

Abstract
Genome-wide binding preferences of the key components of eukaryotic preinitiation complex (PIC) have been recently measured at high resolution in Saccharomyces cerevisiae by Rhee and Pugh. However, the rules determining the PIC binding specificity remain poorly understood. In this study, we show that nonconsensus protein-DNA binding significantly influences PIC binding preferences. We estimate that such nonconsensus binding contributes statistically at least 2–3 kcal/mol (on average) of additional attractive free energy per protein per core-promoter region. The predicted attractive effect is particularly strong at repeated poly(dA:dT) and poly(dC:dG) tracts. Overall, the computed free-energy landscape of nonconsensus protein-DNA binding shows strong correlation with the measured genome-wide PIC occupancy. Remarkably, statistical PIC preferences of binding to both TFIID-dominated and SAGA-dominated genes correlate with the nonconsensus free-energy landscape, yet these two groups of genes are distinguishable based on the average free-energy profiles. We suggest that the predicted nonconsensus binding mechanism provides a genome-wide background for specific promoter elements, such as transcription-factor binding sites, TATA-like elements, and specific binding of the PIC components to nucleosomes. We also show that nonconsensus binding has genome-wide influence on transcriptional frequency.
Introduction
The assembly of the eukaryotic preinitiation complex (PIC) is a critical step in the initiation of the transcription of eukaryotic genes (1–5). The PIC constitutes a multisubunit protein complex; it assembles in the promoter regions of genes in the vicinity of the transcription start site (TSS), and it regulates transcription initiation by the RNA polymerase II enzyme (Pol II). The PIC consists of the TATA-binding protein (TBP), TBP-associated factors (TAFs), and general transcription factors (GTFs) (1–6). In a recent, seminal study, Rhee and Pugh measured, for the first time and with unprecedented resolution, the genome-wide binding preferences of key components of the yeast PIC, such as TBP (Spt15), TFIIA (Toa2), TFIIB (Sua7), TFIID (Taf1), TFIIE (Tfa2), TFIIF (Tfg1), TFIIH (Ssl2), TFIIK (Kin28), and Pol II (Rpo21) (4). These measurements provide a remarkable snapshot of the cis-regulatory code of a eukaryotic genome.
The key, and still open, question is, what rules determine the DNA binding specificity of the PIC components? Attempts to answer this question are complicated by the fact that for the majority of the GTFs in yeast, no consensus DNA binding-sequence motifs have been identified (2,4). One unambiguously identified core-promoter element in yeast, with a relatively high specificity to the TBP, is the TATA box (7,8). The initiator (INR) core-promoter element has been also detected in yeast (9). In higher eukaryotes, yet not in yeast, additional core-promoter elements have been identified (9–12).
Approximately 20% of yeast genes contain the TATA-box motif (7,8). These TATA-containing genes are highly regulated, they are associated with a response to stress, and they predominantly utilize the SAGA complex (7,8). However, in an apparent paradox, it was confirmed in Rhee and Pugh (4) that TBP extensively binds the so-called TATA-less promoters, constituting ∼80% of yeast genes and regulated by the TFIID complex (7,8). The analysis has shown that the vast majority of such TATA-less promoters contain degenerate TATA-like elements (4). The latter finding highlights another key, long-standing question: what promoter-sequence features do distinguish between the TATA-containing and TATA-less genes or, alternatively, between the SAGA-dominated and TFIID-dominated genes (6–8,13)? It is well established that TFIID and SAGA complexes share several TAF subunits (8,14). Therefore, yet another question is, what promoter-sequence features regulate the interplay between the specificity and redundancy (promiscuity) of TFIID and SAGA components?
We have recently suggested the existence of a statistical, nonconsensus protein-DNA binding mechanism operating in eukaryotic genomes (15–17). We use the term nonconsensus protein-DNA binding to describe the predicted protein-DNA binding free energy computed without experimental knowledge of the high-affinity motifs for DNA-binding proteins. The predicted mechanism represents an extension of the notion of nonspecific protein-DNA binding introduced in seminal works of von Hippel, Berg, and colleagues (18–22). In the works of those authors, nonspecific protein-DNA binding was schematically classified into two related mechanisms. The first mechanism is predominantly DNA-sequence-independent and it assumes that DNA-binding proteins experience electrostatic attraction toward DNA, and that this attraction is influenced by the overall DNA geometry (20). The second mechanism assumes that if a DNA-binding protein specifically binds to particular sequence motifs, then DNA sequences that are similar to such specific motifs will possess some enhanced protein-DNA binding affinity (20). We predicted that in addition to these two modes of nonspecific binding, there exists an enhanced statistical attraction between DNA-binding proteins and DNA sequences possessing particular symmetries and lengthscales of sequence repeats. We use the term sequence correlations to describe such sequence repeats (15). In particular, we showed that repeated homo-oligonucleotide tracts, such as poly(dA/dT) and poly(dC/dG), possess the strongest nonconsensus binding affinity toward DNA-binding proteins (15). In yeast, the computed genome-wide landscape of nonconsensus protein-DNA binding free energy significantly correlates with the experimentally measured nucleosome occupancy (16) and with statistical DNA-binding preferences of ∼200 transcription regulators (17).
In this study, we seek to answer the question of how nonconsensus protein-DNA binding influences the binding preferences of the PIC? This article is organized as follows. First, we define the precise notion of the free energy of nonconsensus protein-DNA binding and estimate the genome-wide statistical strength of the effect (Fig. 1). Second, we show that the genome-wide PIC occupancy is strongly correlated with the nonconsensus free-energy landscape (Figs. 2–4). Third, we demonstrate that PIC occupancy for both TFIID-dominated and SAGA-dominated groups of genes is in statistical agreement with the landscape of nonconsensus binding free energy (Fig. 5). However, these two functionally different groups of genes can be distinguished based on their average free-energy profiles. Fourth, we show that genome-wide transcriptional frequency is also influenced by nonconsensus protein-DNA binding (Fig. 6). Finally, we notice that a significant fraction of yeast promoters possess a secondary peak of the PIC occupancy, located in the upstream promoter region. The existence of this peak appears to be influenced by the enhanced occupancy of the −1 nucleosome (Fig. 7).
Figure 1.
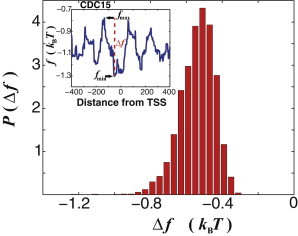
Nonconsensus protein-DNA binding free energy is statistically reduced in the yeast promoter regions. Computed probability distribution, , of the free-energy difference per basepair, , for each transcript from Rhee and Pugh (4), where and are the minimal and the maximal free energy values, respectively, in the interval around the TSS, where we defined, , and we used M = 8. is computed based on 6045 transcripts from Rhee and Pugh (4). The average value, . (Inset) Example of the computed free-energy profile, , for the CDC15 gene, with the definitions of , , and .
Figure 2.
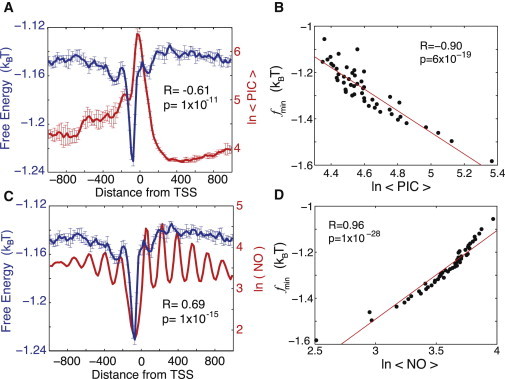
The free energy of nonconsensus TF-DNA binding correlates negatively with the combined GTF occupancy and positively with the nucleosome occupancy. (A) The average free energy of nonconsensus TF-DNA binding per basepair, , and the profile of average combined occupancy of all GTFs in the Rhee and Pugh study (4) around the TSSs of 3945 genes. The notation describes the average-combined-occupancy profile of all nine GTFs. The linear correlation coefficient is computed for a linear fit of versus the average combined GTF occupancy at individual genomic locations, every 20 bp, within the interval . To compute error bars, we divided genes into five randomly chosen subgroups and computed for each subgroup. The error bars are defined as one standard deviation of between the subgroups. The error bars for the combined GTF occupancy are computed analogously. (B) Correlation between the minimal value of the free energy of nonconsensus TF-DNA binding, , and the combined occupancy of all GTFs, computed for individual genes in nonoverlapping windows of 80 bp within the entire interval around the TSS for each of these 3945 genes. The data are binned into 50 bins. We verified that a correlation between the computed free-energy profiles and the experimentally determined PIC occupancy remains statistically significant for a narrower range around the TSS (Fig. S2). (C) The average free energy of nonconensus TF-DNA binding per basepair, , and the average nucleosome occupancy (4), around the TSSs of 3945 genes. (D) Correlation between the minimal value of the free energy of nonconsensus TF-DNA binding, , and the average nucleosome occupancy computed for individual genes, computed in nonoverlapping windows of 80 bp within the entire interval around the TSS for each of the 3945 genes. The data are sorted into 50 bins.
Figure 3.
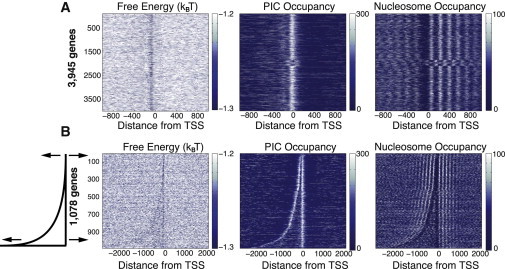
Heat maps demonstrating that at the individual gene level, the free energy of nonconsensus TF-DNA binding correlates negatively with the combined GTF occupancy and positively with the nucleosome occupancy around the TSSs. (A, left to right) Heat maps representing the free energy of nonconsensus TF-DNA binding per basepair, f, combined occupancy of the GTFs, and nucleosome occupancy, respectively, for individual genes aligned with respect to the TSS. (B) Heat maps representing the free energy of nonconsensus TF-DNA binding, f, combined occupancy of the GTFs, and nucleosome occupancy, respectively, for 1078 inverted mRNA genes aligned with respect to the TSS. The genes are sorted by intergenic length.
Figure 4.

The measured occupancy profiles of individual GTFs are significantly affected by nonconsensus TF-DNA binding. The average free energy of nonconsensus TF-DNA binding per basepair, , and the average occupancy profile of individual GTFs from Rhee and Pugh (4) around the TSSs of 3945 genes. To compute error bars, we divided genes into five randomly chosen subgroups and computed for each subgroup. The error bars are defined as one standard deviation of between the subgroups. The error bars for the GTF occupancy are computed analogously. We used in all calculations. The linear correlation coefficient is computed in each case for a linear fit of versus the average GTF occupancy at individual genomic locations, every 20 bp, within the interval .
Figure 5.
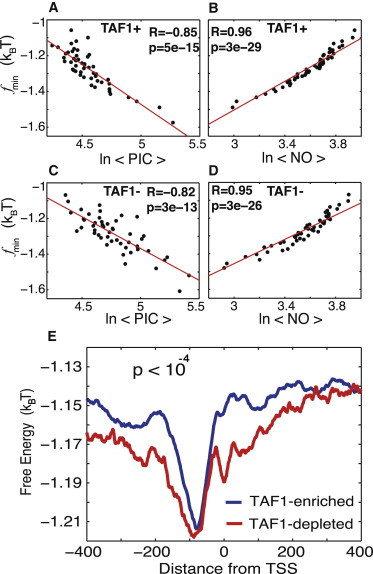
Statistical PIC binding preferences to both TFIID-dominated and SAGA-dominated genes negatively correlate with the nonconsensus free-energy landscape, yet these two groups of genes are distinguishable based on the average free-energy profiles. (A) Correlation between the minimal value of the free energy of nonconsensus TF-DNA binding, , and the average GTF occupancy of 3068 TAF1-enriched genes. The correlation is computed for individual genes in nonoverlapping windows of 80 bp within the entire interval around the TSS. The data are then sorted into 50 bins. (B) Similar to A, but with correlated with the nucleosome occupancy of these TAF1-enriched genes. (C) Correlation between and the average GTF occupancy of 877 TAF1-depleted genes. The correlation is computed for individual genes in nonoverlapping windows of 80 bp within the entire interval around the TSS. The data are sorted into 50 bins. (D) Similar to C, but now is correlated with the nucleosome occupancy of these TAF1-depleted genes. (E) The average free energy of nonconsensus TF-DNA binding per bp, , for a larger set of 4755 TAF1-enriched genes, and 1135 TAF1-depleted genes, around the TSSs.
Figure 6.
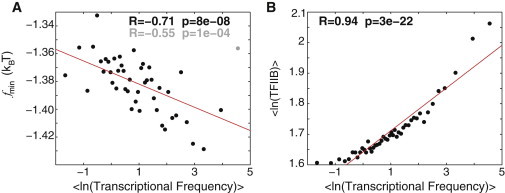
Nonconsensus TF-DNA binding influences transcriptional frequency genome-wide. (A) Correlation between the minimal value of the free energy of nonconsensus TF-DNA binding, , and the transcriptional frequency from Holstege et al. (6), computed for 3811 genes. For each gene, is computed in the interval around the TSS. The data are binned into 45 bins, ordered by the magnitude of transcriptional frequency. The outlier point corresponding to the highest-frequency bin is shown in gray. Removing this point significantly improves the correlation coefficient. (B) Correlation between the experimentally measured (4) peak occupancy of TFIIB in the promoter region and the transcriptional frequency for these 3811 genes.
Figure 7.
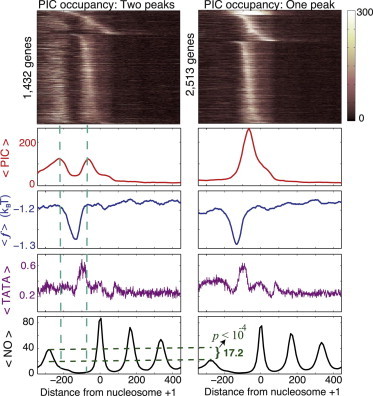
Nucleosomes flanking the upstream promoter region influence PIC occupancy. Specific binding of the PIC components to the −1 nucleosome might be responsible for the emergence of a secondary peak in the PIC occupancy profiles. (Left, top to bottom) The heat map represents the combined occupancy of the GTFs (referred to here as PIC occupancy) in the genes selected with a condition of the existence of a second peak in the combined GTF occupancy per gene, as measured in Rhee and Pugh (4). Only the genes with an absolute upstream peak occupancy >40 (in the occupancy-score units used in Rhee and Pugh (4)), and with a value of at least 50%, as compared with the downstream peak occupancy, were selected. As a result, 1432 double-peak (left) and the remaining 2513 single-peak (right) genes were selected. The next graphs represent (top to bottom) the average combined occupancy of the GTFs, ; the average free energy of nonconsensus TF-DNA binding per basepair, ; the average TATA-like box occupancy score (Materials and Methods); and the average nucleosome occupancy, . (Right) Analogous graphs for the remaining 2513 single-peak genes. The lower right graph shows the absolute difference between the average, maximal values of the −1 nucleosome occupancy for the double-peak and single-peak groups, as well as the computed p-value for this difference.
Materials and Methods
Occupancy of individual GTFs
The experimentally measured occupancies of individual GTFs determined by the ChIP-exo method are taken from Rhee and Pugh (4).
p-Value calculations
To compute the p-value for Fig. 5, we generated 10,000 pairs of randomly chosen groups of 4755 and 1135 genes, respectively, representing random replicas of TAF1-enriched and TAF1-depleted gene groups, respectively. For each of these pairs, we calculated the difference between the average free energy of TAF1-enriched and TAF1-depleted groups within the range around the TSS. The probability that the computed value of the difference in the randomized sets is larger than the actual value is assigned as the p-value. The p-value for Fig. S5 is computed analogously. To compute the p-value for Fig. 7, we first selected 10,000 pairs of randomly chosen groups of 1432 and 2513 genes representing randomized analogs for the actual double-peak and the single-peak groups, respectively. Next, for each pair we calculated the absolute difference in the peak value of the average −1 nucleosome occupancy between the double-peak and the single-peak groups. Finally, we computed the probability that this difference reaches the actual value. This probability was then assigned as the p-value.
TATA-containing and TATA-less genes
The definitions of TATA-containing and TATA-less genes, as well as TAF1-enriched and TAF1-depleted genes are adopted from Rhee and Pugh (4).
TATA-like box occupancy score
To assign the TATA-like box occupancy score in Fig. 7, we used the definition from Rhee and Pugh (4). In particular, we searched for the conventional TATA-like motif, TATA(A/T)A(A/T)(A/G). We assigned scores of 8 for a perfect match to this motif, 7 to a match with one mismatch, 6 to a match with two mismatches, and 0 otherwise. We verified that an alternative definition of the TATA-like box occupancy score, based on position weight matrix (12), leads to similar conclusions (Fig. S6).
Results
Definition of the free energy of nonconsensus protein-DNA binding
To compute the free energy of nonconsensus protein-DNA binding genome-wide in yeast, we first introduce a simple biophysical model of protein-DNA interactions (15). This model uses an ensemble of random DNA binders as a proxy for the phenomenon of nonspecific, nonconsensus protein-DNA binding in a crowded nuclear environment of a cell. We use the term random binder to express that no experimentally predetermined protein-DNA binding preferences are used here to model protein-DNA binding. The actual sequence of the yeast genome constitutes the only experimental input parameter for our model. In particular, we assume that a protein makes contact with M DNA basepairs (bp), and the protein-DNA interaction energy at each genomic position is expressed by
| (1) |
where for each genomic position , represents the elements of a four-component vector of the type , where if , or if . For example, if the T nucleotide is positioned at the coordinate along the DNA, then this vector takes the form . The binding energy scale is set for each protein by the four parameters . To generate each model protein, we draw the values of , , , and from the Gaussian probability distributions, , with the zero mean, , and the standard deviation , where is the temperature and is the Boltzmann constant. We have shown analytically in the past that the resulting free energy is qualitatively robust with respect to the choice of model parameters (15). This energy scale, kcal/mol, is chosen to represent a typical average strength of one hydrogen or electrostatic bond that a protein makes with a DNA basepair in a cell (18,20).
For each model protein, we define the partition function of protein-DNA binding within a sliding window of width bp along the yeast genome by
| (2) |
and the corresponding free energy of protein-DNA binding in this sliding window by
| (3) |
We then assign the computed F to the sequence coordinate in the middle of the sliding window. For example, for the chosen sliding-window size, bp, 50 protein-DNA binding events contribute to the partition function (Eq. 2) in each sliding window for each random binder. We verified that the resulting free-energy landscape is qualitatively robust with respect to the choice of L within a wide range of values (Fig. S1 in the Supporting Material). Moving the sliding window along the genome and computing F at each genomic location allows us to assign the free energy of nonconsensus protein-DNA binding to each DNA basepair within the entire genome.
Next, we repeat the described procedure for an ensemble of 250 model random binders, and we compute the average free energy, , with respect to this ensemble, in each genomic location. The resulting free-energy landscape, , represents the statistical propensity of genomic DNA toward nonconsensus protein-DNA binding. The lower the in a given genomic location, the stronger is the attraction that DNA-binding proteins experience (on average) toward this location. We have shown previously that the predicted effect is entropy-dominated, and it is driven by the correlation properties of the DNA sequence rather than by the average sequence composition (15). In particular, genomic regions enriched in repeated poly(dA/dT) or poly(dC/dG) tracts possess the strongest propensity (the lowest ) toward nonconsensus protein-DNA binding (15–17). This general, statistical effect stems from the symmetry of DNA, and it can be understood intuitively in the following way. The dominant, attractive contribution to the partition function Z, Eq (2), comes from the low-energy tail of the probability distribution for the protein-DNA interaction energies, P(U) (Eq. 1). A protein moving along the DNA enriched in repeated poly(dA/dT) and/or poly(dC/dG) tracts, will possess a statistically wider distribution, P(U), compared with the case when the DNA sequence either is random or has a different symmetry, such as, for example, TATATATAT..., or similar sequences. Such a wider distribution will statistically result in a lower free energy (Eq. 3). This effect is entropic, since it depends on the variation (fluctuation) of U, and not on the average value, 〈U〉 (23). The latter property is also the reason for the fact that the free-energy profiles are statistically robust with respect to the global variation of the nucleotide composition along the yeast genome (Fig. S1).
To estimate the strength of the effect, we compute the probability distribution of the free-energy difference in the vicinity of the TSSs, , for 6045 transcripts from the Rhee and Pugh study (4) (Fig. 1). The position of the peak of this distribution gives the average strength of the effect: per protein per gene, on average, assuming that each protein makes contacts with M = 8 bp upon DNA sliding. The resulting free-energy profiles are statistically robust with respect to a moderate variation of the value of M within a typical range of the TF binding-site size in yeast (Fig. S1). For the vast majority of genes, the minimum, , is located within the interval (−150,0) around the TSS. Intuitively, the estimated value means that DNA-binding proteins are statistically attracted toward the location of the free-energy minimum within the promoter, and each protein gains statistically (on average) ∼ –3 kcal/mol, exclusively due to the existence of nonconsensus protein-DNA binding.
Nonconsensus protein-DNA binding influences genomic organization of the PIC
We now set out to answer the key question: how does the predicted nonconsensus protein-DNA binding affect the experimentally measured binding preferences of the PIC components in yeast genome-wide (4)? We compare the experimentally measured PIC occupancy in the vicinity of the TSSs for ∼4000 yeast genes (4), with the computed free-energy landscape (Fig. 2, A and B). The statistically significant correlation obtained suggests that nonconsensus protein-DNA binding significantly influences the PIC occupancy profile genome-wide (Fig. 2, A and B, and Fig. S2). The strongest effect is observed in the upstream promoter regions, in the immediate vicinity of the TSSs for the majority of genes. The lower the free energy, the stronger the statistical attraction toward DNA experienced by proteins due to nonconsensus protein-DNA binding. It is remarkable that the peak of the average PIC occupancy is shifted ∼50 bp downstream relative to the average free-energy minimum (Fig. 2 A) This result is robust with respect to the choice of the sliding-window size, L, within a wide range of values (Fig. S1). The reason for this shift appears to be the interplay between the predicted nonconsensus binding and specific, cooperative binding of the PIC complex to TATA-like elements in the core-promoter regions (see below).
The genome-wide nucleosome occupancy profile determined in Rhee and Pugh (4) shows statistically strong, positive correlation with the computed free-energy landscape (Fig. 2, C and D). The nucleosome occupancy is dramatically reduced exactly in the region of the reduced free energy (Fig. 2 C). This is in agreement with our previous work (16), which used a different experimental source of nucleosome occupancy (24). Briefly, the proposed mechanism influencing nucleosome depletion stems from the competition between nucleosomes and transcription factors for binding to genomic regions characterized by the reduced free energy of nonconsensus protein-DNA binding (16). The effect of the PIC-occupancy enrichment and the nucleosome-occupancy depletion in the regions of the reduced free energy is clearly observable at the single-gene level (Fig. 3, A and B). Notably, ∼1000 inverted genes exhibit a double-well free-energy landscape, in agreement with the corresponding PIC-occupancy and nucleosome-occupancy profiles (Fig. 3 B).
The individual average occupancy profiles of eight out of nine proteins analyzed in Rhee and Pugh (4) are significantly negatively correlated with the free-energy landscape in a wide region around the TSSs (Fig. 4). Intuition tells us that such negative correlation means that individual GTFs are attracted toward genomic regions that possess reduced free energy. Interestingly, the Pol II occupancy is positively correlated with the free energy (Fig. 4), similar to the nucleosome occupancy. This observation can be rationalized by the fact that Pol II may interact with +1 nucleosomes, and it should therefore resemble the nucleosome-occupancy profile (4), which is positively correlated with the free energy (Fig. 2 D). In addition, Pol II is recruited to the core promoters indirectly through its specific interaction with GTFs, and thus, specific binding dominates its occupancy in the immediate vicinity of the TSSs.
It is remarkable that among all GTFs, the average TFIID occupancy exhibits the weakest correlation with the free energy (Fig. 4). This can be explained by the fact that TFIID experiences two competing interactions. It interacts attractively with the +1 nucleosome located downstream of it (4), and at the same time, it is attracted toward the free-energy minimum located upstream of it (Fig. 4). We conclude, therefore, that the predicted nonconsensus protein-DNA binding free-energy landscape significantly influences binding preferences of GTFs in promoter regions on a genome-wide basis in yeast. This nonconsensus binding mechanism provides a background for specific promoter elements, such as transcription factor binding sites (TFBSs), TATA-like elements, INR elements, and specific binding of GTFs (such as TFIID) to nucleosomes.
We stress that contrary to the case of specific protein-DNA binding, nonconsensus binding is operational globally, within wide genomic regions. In particular, we verified that the predicted nonconsensus protein-DNA binding influences the GTF occupancy and the nucleosome occupancy around the 3′ open-reading-frame (ORF) ends. Fig. S3 shows that the free energy is statistically significantly negatively correlated with the PIC occupancy and positively correlated with the nucleosome occupancy, similar to the trends observed around the TSSs (Fig. 2). Remarkably, at the single-gene level, the GTF occupancy profile of 1860 tandem mRNA genes follows the free-energy profile (Fig. S3). Strikingly, even the individual occupancies of GTFs measured in Rhee and Pugh (4) are significantly correlated with the free energy (Fig. S4). This analysis leads us to conclude that the nonconsensus protein-DNA binding mechanism operates and influences the genome-wide GTF occupancy and nucleosome occupancy within a wide genomic range, not only around the TSSs but also around the ORF gene ends.
Free-energy landscape of nonconsensus protein-DNA interactions distinguishes between TFIID-enriched and TFIID-depleted promoters
Transcriptional regulation in yeast appears to be mechanistically bipolar: ∼90% of the yeast genes are regulated by the TFIID complex, whereas the remaining ∼10% are regulated by the SAGA complex (8). The majority of TFIID-dominated genes are classified as TATA-less and housekeeping, whereas the majority of SAGA-dominated genes are TATA-containing and stress responsive (4,7,8). Remarkably, there exists a considerable cross talk (redundancy) between the components of TFIID and SAGA complexes (8,25).
With this in mind, we now ask the question, how does the predicted nonconsensus protein-DNA binding free-energy landscape affect the PIC occupancy in the TFIID-dominated and SAGA-dominated genes, respectively? Fig. 5, A and C, show that the PIC occupancy within both groups of genes measured in Rhee and Pugh (4) is negatively correlated with the free energy. The nucleosome occupancy in these two groups of genes is positively correlated with the free energy, consistent with our previous analysis (16) (Fig. 5, B and D). Although both groups of genes are affected by the nonconsensus binding, yet the average free-energy profiles are clearly distinguishable between the two groups (Fig. 5 E), where the TFIID-dominated (Taf1-enriched) genes are characterized by a free-energy landscape that is narrower than that of the SAGA-dominated (Taf1-depleted) genes. We verified that TATA-less and TATA-containing genes behave quantitatively similarly to TFIID-dominated and SAGA-dominated genes, respectively (Fig. S5). Based on these observations, we conclude that nonconsensus protein-DNA binding statistically influences PIC occupancy within the vast majority of the yeast genome, including both TFIID-dominated and SAGA-dominated genes. However, these two groups of genes are characterized by distinguishable average free-energy landscapes. These findings lead us to a remarkable conclusion that the observed cross talk and functional redundancy between the components of TFIID and SAGA complexes (8,25) might originate, at least partially, from nonconsensus protein-DNA binding intrinsically encoded into genomic DNA. Such nonconsensus binding has a statistical effect on both TFIID and SAGA complexes (Fig. 5, A and C).
We stress that our simple biophysical model of protein-DNA interactions does not use any experimental knowledge of the high-affinity (consensus) protein-DNA binding sites or TATA-like box preferences, and therefore, the computed nonconsensus free energy does not include any contribution of sequence-specific (consensus) protein-DNA binding. Taking such sequence-specific contribution into account might shed light on the question of the relative significance of specific (consensus) versus nonconsensus effects for binding preferences of TFIID and SAGA complexes, respectively.
Nonconsensus protein-DNA binding influences transcriptional frequency
We now proceed to quantify how the predicted nonconsensus protein-DNA binding influences gene expression on the genome-wide scale. Fig. 6 shows a statistically significant correlation between the computed free energy and the measured transcriptional frequency of ∼4000 genes (6). Genes with the reduced free energy of nonconsensus protein-DNA binding in the promoter regions, and hence with the higher levels of GTF occupancy, exhibit statistically higher levels of transcriptional frequency. The fact that the observed correlation is only moderately strong emphasizes the great significance of other factors that influence gene expression, and first of all, the effect of specific TF-DNA binding, which is not taken into account in the model presented here.
Nucleosomes flanking the upstream promoter region influence PIC occupancy
The analysis of experimentally measured PIC binding preferences shows that a significant fraction of yeast promoters possesses a secondary peak in the upstream promoter regions (Fig. 7). It is remarkable that the two groups of genes (a group with only a single peak and a group with two peaks) are characterized by statistically indistinguishable profiles of average free energy and TATA-like element occupancy (Materials and Methods and Fig. S6). The profiles of INR-promoter-element occupancy (9,12) are also indistinguishable between these two groups of genes (Fig. S6). However, the −1 nucleosome occupancy is significantly enhanced in the group possessing the second peak in the upstream promoter region (Fig. 7). This observation suggests that specific binding of PIC components (such as Taf1) to the −1 nucleosome is an important additional factor regulating the PIC occupancy profiles.
Discussion and Conclusion
Here, we predicted that yeast genomic DNA exerts nonconsensus protein-DNA binding potential on all DNA-binding proteins, and in particular on the GTFs. We described the action of this effective potential by assigning the free energy of nonconsensus protein-DNA binding to each genomic location. We then observed that the experimentally measured binding preferences of GTFs (4) showed remarkable agreement with the predicted free-energy landscape (Figs. 2 and 4). We estimated that the strength of the effect is at least 2–3 kcal/mol/protein (on average). This value represents an additional attractive protein-DNA binding free energy gained by a protein (on average) in a promoter region due exclusively to nonconsensus protein-DNA binding. The predicted attractive effect is particularly strong at repeated poly(dA/dT) and poly(dC/dG) tracts. We emphasize that our simple biophysical model of protein-DNA interactions does not use any experimental knowledge of the high-affinity (consensus) protein-DNA binding sites and therefore does not have fitting parameters. Despite the simplicity of the model, we suggest that our conclusions are quite general, and that the predicted mechanism influencing PIC binding preferences is most likely operational in other eukaryotic genomes.
We observed that TFIID-enriched and TFIID-depleted (SAGA-dominated) genes are statistically distinguishable based on the nonconsensus protein-DNA binding free-energy landscapes of these two groups (Fig. 5). However, remarkably, nonconsensus protein-DNA binding influences the PIC occupancy of both TFIID-dominated and SAGA-dominated genes. In particular, the experimentally measured occupancies of TFIID-enriched and TFIID-depleted genes both show a significant correlation with the free-energy landscape (Fig. 5, A and C). This suggests that the predicted nonconsensus protein-DNA binding might be responsible for the observed cross talk and functional redundancy between the TFIID and SAGA complexes (8,14). We also observed that transcriptional frequency is correlated with the predicted free-energy landscape (Fig. 6). The fact that the observed correlation is not strong, although highly significant, highlights the importance of the specific protein-DNA binding component in transcriptional regulation.
We note that in a recent experimental study performed in vitro (26), it was shown that in addition to conventional TATA-box binding, the TBP extensively binds poly(T) stretches. This effect also might be a direct consequence of the nonconsensus protein-DNA binding mechanisms predicted here. Additional experiments with poly(dA/dT) and poly(dC/dG) stretches might provide further insight into the mechanism of the observed effect.
In conclusion, the predicted nonconsensus protein-DNA binding constitutes a genome-wide attractive background (sink), globally modulating the statistical occupancy of TFs (and other DNA-binding proteins) along the genome. Unlike specific protein-DNA binding, nonconsensus binding involves relatively long genomic regions (of at least a few tens of basepairs) that contribute to this effect. Despite such intrinsic nonlocality, we observed that, statistically, nonconsensus binding significantly influences binding preferences of the majority of the PIC components in core-promoter regions genome-wide. This suggests that intrinsically encoded nonconsensus protein-DNA binding might be tightly linked to specific protein-DNA binding in fine-tuning transcriptional regulation.
Acknowledgments
We thank Ho Sung Rhee for helping us compile the ChIP-exo data.
D.B.L. acknowledges financial support from the Israel Science Foundation (ISF, grant 1014/09). A.A. is a recipient of the Negev Faran graduate fellowship and the Lewiner graduate fellowship.
Supporting Material
References
- 1.Buratowski S., Hahn S., Sharp P.A. Five intermediate complexes in transcription initiation by RNA polymerase II. Cell. 1989;56:549–561. doi: 10.1016/0092-8674(89)90578-3. [DOI] [PubMed] [Google Scholar]
- 2.Burley S.K., Roeder R.G. Biochemistry and structural biology of transcription factor IID (TFIID) Annu. Rev. Biochem. 1996;65:769–799. doi: 10.1146/annurev.bi.65.070196.004005. [DOI] [PubMed] [Google Scholar]
- 3.Green M.R. TBP-associated factors (TAFIIs): multiple, selective transcriptional mediators in common complexes. Trends Biochem. Sci. 2000;25:59–63. doi: 10.1016/s0968-0004(99)01527-3. [DOI] [PubMed] [Google Scholar]
- 4.Rhee H.S., Pugh B.F. Genome-wide structure and organization of eukaryotic pre-initiation complexes. Nature. 2012;483:295–301. doi: 10.1038/nature10799. [DOI] [PMC free article] [PubMed] [Google Scholar]
- 5.Liu X., Bushnell D.A., Kornberg R.D. Structure of an RNA polymerase II-TFIIB complex and the transcription initiation mechanism. Science. 2010;327:206–209. doi: 10.1126/science.1182015. [DOI] [PMC free article] [PubMed] [Google Scholar]
- 6.Holstege F.C., Jennings E.G., Young R.A. Dissecting the regulatory circuitry of a eukaryotic genome. Cell. 1998;95:717–728. doi: 10.1016/s0092-8674(00)81641-4. [DOI] [PubMed] [Google Scholar]
- 7.Basehoar A.D., Zanton S.J., Pugh B.F. Identification and distinct regulation of yeast TATA box-containing genes. Cell. 2004;116:699–709. doi: 10.1016/s0092-8674(04)00205-3. [DOI] [PubMed] [Google Scholar]
- 8.Huisinga K.L., Pugh B.F. A genome-wide housekeeping role for TFIID and a highly regulated stress-related role for SAGA in Saccharomyces cerevisiae. Mol. Cell. 2004;13:573–585. doi: 10.1016/s1097-2765(04)00087-5. [DOI] [PubMed] [Google Scholar]
- 9.Yang C., Bolotin E., Martinez E. Prevalence of the initiator over the TATA box in human and yeast genes and identification of DNA motifs enriched in human TATA-less core promoters. Gene. 2007;389:52–65. doi: 10.1016/j.gene.2006.09.029. [DOI] [PMC free article] [PubMed] [Google Scholar]
- 10.Juven-Gershon T., Hsu J.Y., Kadonaga J.T. The RNA polymerase II core promoter: the gateway to transcription. Curr. Opin. Cell Biol. 2008;20:253–259. doi: 10.1016/j.ceb.2008.03.003. [DOI] [PMC free article] [PubMed] [Google Scholar]
- 11.Juven-Gershon T., Kadonaga J.T. Regulation of gene expression via the core promoter and the basal transcriptional machinery. Dev. Biol. 2010;339:225–229. doi: 10.1016/j.ydbio.2009.08.009. [DOI] [PMC free article] [PubMed] [Google Scholar]
- 12.Jin V.X., Singer G.A., Davuluri R.V. Genome-wide analysis of core promoter elements from conserved human and mouse orthologous pairs. BMC Bioinformatics. 2006;7:114. doi: 10.1186/1471-2105-7-114. [DOI] [PMC free article] [PubMed] [Google Scholar]
- 13.Venters B.J., Wachi S., Pugh B.F. A comprehensive genomic binding map of gene and chromatin regulatory proteins in Saccharomyces. Mol. Cell. 2011;41:480–492. doi: 10.1016/j.molcel.2011.01.015. [DOI] [PMC free article] [PubMed] [Google Scholar]
- 14.Lee T.I., Causton H.C., Young R.A. Redundant roles for the TFIID and SAGA complexes in global transcription. Nature. 2000;405:701–704. doi: 10.1038/35015104. [DOI] [PubMed] [Google Scholar]
- 15.Sela I., Lukatsky D.B. DNA sequence correlations shape nonspecific transcription factor-DNA binding affinity. Biophys. J. 2011;101:160–166. doi: 10.1016/j.bpj.2011.04.037. [DOI] [PMC free article] [PubMed] [Google Scholar]
- 16.Afek A., Sela I., Lukatsky D.B. Nonspecific transcription-factor-DNA binding influences nucleosome occupancy in yeast. Biophys. J. 2011;101:2465–2475. doi: 10.1016/j.bpj.2011.10.012. [DOI] [PMC free article] [PubMed] [Google Scholar]
- 17.Afek A., Lukatsky D.B. Nonspecific protein-DNA binding is widespread in the yeast genome. Biophys. J. 2012;102:1881–1888. doi: 10.1016/j.bpj.2012.03.044. [DOI] [PMC free article] [PubMed] [Google Scholar]
- 18.von Hippel P.H., Revzin A., Wang A.C. Non-specific DNA binding of genome regulating proteins as a biological control mechanism: I. The lac operon: equilibrium aspects. Proc. Natl. Acad. Sci. USA. 1974;71:4808–4812. doi: 10.1073/pnas.71.12.4808. [DOI] [PMC free article] [PubMed] [Google Scholar]
- 19.Berg O.G., Winter R.B., von Hippel P.H. Diffusion-driven mechanisms of protein translocation on nucleic acids. 1. Models and theory. Biochemistry. 1981;20:6929–6948. doi: 10.1021/bi00527a028. [DOI] [PubMed] [Google Scholar]
- 20.von Hippel P.H., Berg O.G. On the specificity of DNA-protein interactions. Proc. Natl. Acad. Sci. USA. 1986;83:1608–1612. doi: 10.1073/pnas.83.6.1608. [DOI] [PMC free article] [PubMed] [Google Scholar]
- 21.von Hippel P.H., Berg O.G. Facilitated target location in biological systems. J. Biol. Chem. 1989;264:675–678. [PubMed] [Google Scholar]
- 22.Berg O.G., von Hippel P.H. Selection of DNA binding sites by regulatory proteins. Statistical-mechanical theory and application to operators and promoters. J. Mol. Biol. 1987;193:723–750. doi: 10.1016/0022-2836(87)90354-8. [DOI] [PubMed] [Google Scholar]
- 23.Elkin M., Andre I., Lukatsky D.B. Energy fluctuations shape free energy of nonspecific biomolecular interactions. J. Stat. Phys. 2012;146:870–877. [Google Scholar]
- 24.Lee W., Tillo D., Nislow C. A high-resolution atlas of nucleosome occupancy in yeast. Nat. Genet. 2007;39:1235–1244. doi: 10.1038/ng2117. [DOI] [PubMed] [Google Scholar]
- 25.Grant P.A., Schieltz D., Workman J.L. A subset of TAF(II)s are integral components of the SAGA complex required for nucleosome acetylation and transcriptional stimulation. Cell. 1998;94:45–53. doi: 10.1016/s0092-8674(00)81220-9. [DOI] [PubMed] [Google Scholar]
- 26.Ahn S., Huang C.L., Irani R.J. TATA binding proteins can recognize nontraditional DNA sequences. Biophys. J. 2012;103:1510–1517. doi: 10.1016/j.bpj.2012.08.030. [DOI] [PMC free article] [PubMed] [Google Scholar]
Associated Data
This section collects any data citations, data availability statements, or supplementary materials included in this article.