Abstract
One-size-fits-all protocol-based approaches to anemia management with erythropoiesis-stimulating agents (ESAs) may result in undesired patterns of hemoglobin variability. In this single-center, double-blind, randomized controlled trial, we tested the hypothesis that individualized dosing of ESA improves hemoglobin variability over a standard population-based approach. We enrolled 62 hemodialysis patients and followed them over a 12-month period. Patients were randomly assigned to receive ESA doses guided by the Smart Anemia Manager algorithm (treatment) or by a standard protocol (control). Dose recommendations, performed on a monthly basis, were validated by an expert physician anemia manager. The primary outcome was the percentage of hemoglobin concentrations between 10 and 12 g/dl over the follow-up period. A total of 258 of 356 (72.5%) hemoglobin concentrations were between 10 and 12 g/dl in the treatment group, compared with 208 of 336 (61.9%) in the control group; 42 (11.8%) hemoglobin concentrations were <10 g/dl in the treatment group compared with 88 (24.7%) in the control group; and 56 (15.7%) hemoglobin concentrations were >12 g/dl in the treatment group compared with 46 (13.4%) in the control group. The median ESA dosage per patient was 2000 IU/wk in both groups. Five participants received 6 transfusions (21 U) in the treatment group, compared with 8 participants and 13 transfusions (31 U) in the control group. These results suggest that individualized ESA dosing decreases total hemoglobin variability compared with a population protocol-based approach. As hemoglobin levels are declining in hemodialysis patients, decreasing hemoglobin variability may help reduce the risk of transfusions in this population.
Anemia is a common complication of ESRD and is treated with erythropoiesis-stimulating agents (ESAs), iron, and/or blood transfusions. Effective anemia management with an ESA is challenging because of significant interindividual variability in erythropoietic response. A large ESA dose associated with an inability to achieve target hemoglobin (ESA resistance) may be a marker for increased risk of cardiovascular adverse events.1–4 Until recently, the national guidelines for anemia management in ESRD patients recommended a hemoglobin target of 10–12 g/dl. The current ESA product label approved by the US Food and Drug Administration (FDA) stipulates treatment individualization to decrease the risk of transfusions. Furthermore, changes in reimbursement rules by Medicare, which provides coverage for a large majority of ESRD patients, have led to an evolution of ESA dosing patterns that results in lower average hemoglobin levels and more transfusions.5
Ever since the introduction of ESAs, dialysis facilities have been providing standardized care using protocols derived from the national guidelines. The new FDA ruling emphasizes the need for individualized ESA dosing.6,7 The goal of such individualization should be to maintain stable hemoglobin concentrations and prevent hemoglobin excursions below levels that typically trigger blood transfusions. However, as of now, no such level has been uniquely defined, and it is typically left to the clinician’s judgment to decide what hemoglobin level and/or presence of other symptoms should trigger transfusions.
We and others have demonstrated the application of automatic control methods to ESA dosing.8–10 We have shown that a population approach to ESA dosing, based on the principles of model predictive control (MPC), is comparable with a standard protocol.8,9 We now present the results of a randomized clinical trial of an MPC-based individualized approach to ESA dosing. We tested the hypothesis that individualized ESA dosing improves the total hemoglobin variability defined as the proportion of hemoglobin measurements within a user-specified target (10–12 g/dl) compared with a standard protocol-based population approach. This study was registered at ClinicalTrials.gov (NCT00572533).
Results
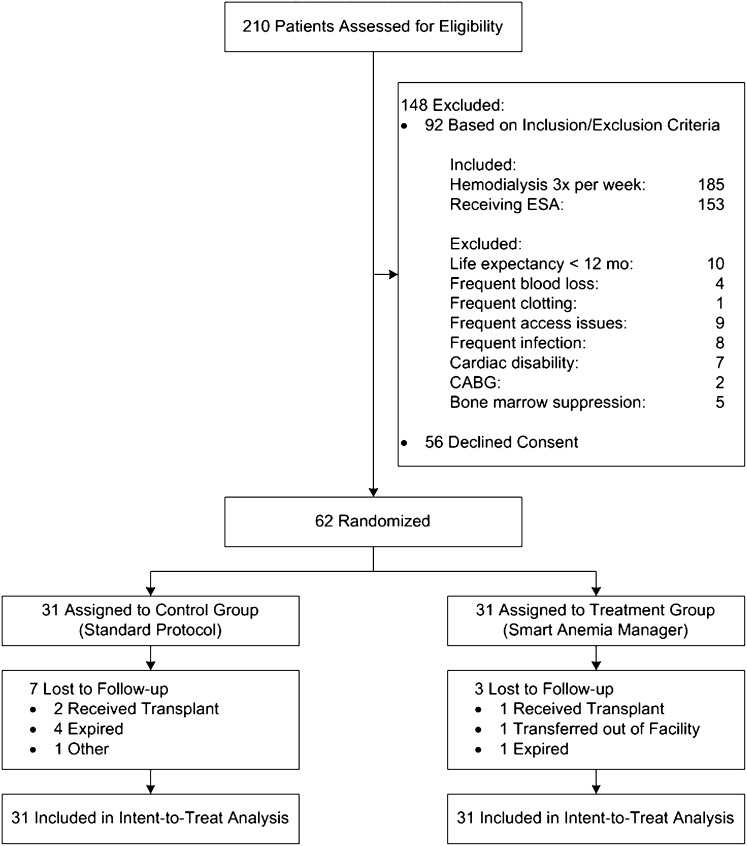
Of the 62 participants who enrolled, 52 completed the study (24 in the control group and 28 in the treatment group) (Figure 1). There were four deaths in the control group and one in the treatment group. Three participants received kidney transplants (two in the control group and one in the treatment group). One participant transferred out of the facility and one individual discontinued participation due to social issues. Table 1 shows the demographic and clinical data of the participants at the beginning of the study. The groups were similar with the exception of minor differences in iron status and ESA dose.
Figure 1.
Consolidated Standards of Reporting Trials diagram of participant flow through the study. CABG, coronary artery bypass graft.
Table 1.
Demographic and clinical parameter distribution of the study population in April 2011 at the time of group assignment
| Parameter | Control Group (Protocol) | Treatment Group (SAM) | P |
|---|---|---|---|
| Age (mean ± SD) | 57±10 | 57±9 | 0.92 |
| Sex | 0.79 | ||
| Male | 22 | 20 | |
| Female | 9 | 11 | |
| Race | 0.99 | ||
| African American | 20 | 21 | |
| Caucasian | 11 | 10 | |
| Hemoglobin (g/dl) (mean ± SD) | 11.2±1.4 | 11.3±1.0 | 0.68 |
| ESA dosage (IU/wk) (median ± interquartile range) | 2000±6000 | 3000±5500 | 0.50 |
| Kt/V (mean ± SD) | 1.5±0.3 | 1.6±0.2 | 0.75 |
| Albumin (g/dl) (mean ± SD) | 4.0±0.4 | 4.0±0.3 | 0.91 |
| TSAT (%) (mean ± SD) | 29.5±8.7 | 32.7±11.7 | 0.23 |
| Ferritin (ng/ml) (median ± interquartile range) | 971±647.5 | 863±528.5 | 0.21 |
| Diabetes | 17 | 18 | 0.99 |
| CHF | 6 | 8 | 0.93 |
| Access | |||
| Fistula | 20 | 21 | 0.99 |
| Graft | 6 | 7 | 0.99 |
| Catheter | 5 | 3 | 0.73 |
Four dose recommendations were overridden in the control group due to a perceived insufficient ESA dose increase at low hemoglobin. No dose recommendations were overridden in the treatment group. The primary analysis was intent to treat and included all study participants (Tables 2 and 3). Over the follow-up period, participants in the treatment group had fewer hemoglobin measurements <10 g/dl (P<0.001) and more within the 10–12 g/dl range (P=0.003) compared with the control group. Both groups had a similar number of hemoglobin measurements >12 g/dl (P=0.39). We observed an absolute difference of 10.7% in the primary outcome and an absolute difference of 12.9% in the proportion of hemoglobin <10 g/dl in favor of the treatment group. Proportions of hemoglobin >12 g/dl were not different between the groups. The mean hemoglobin achieved was 11.0±1.2 g/dl in the treatment group compared with 10.7±1.5 g/dl in the control group (P=0.001). Fifty-eight of 62 participants (93.5%) received average ESA dosages <10,000 IU/wk. Two participants in the treatment group received an average ESA dosage close to 20,000 IU/wk. Both participants were found to have comorbidities compromising their erythropoietic response and one of them required multiple transfusions (14 U). The median iron dose, transferrin saturation (TSAT), and ferritin were not different between the groups.
Table 2.
Statistical comparison of primary and secondary outcomes between study groups
| Proportion of Hemoglobin (g/dl) | Control Group (n=336) | Treatment Group (n=356) | P | Achieved Power |
|---|---|---|---|---|
| 10–12 | 208 (61.9) | 258 (72.5) | 0.003 | 0.55 |
| <10 | 88 (24.7) | 42 (11.8) | <0.001 | 0.90 |
| >12 | 46 (13.4) | 56 (15.7) | 0.39 | 0.68 |
Data are described as proportions, which are computed across all study participants over the 12-month follow-up period, and percentages.
Table 3.
Statistical comparison of other relevant parameters between study groups
| Parameter | Control Group | Treatment Group | P |
|---|---|---|---|
| Hemoglobin (g/dl) (mean ± SD)a | 10.7±1.5 | 11.0±1.2 | 0.001b |
| ESA dose (IU/wk) (median [min,max]) | 2000 [0,29000] | 2000 [0, 35000] | 0.05c |
| Iron dose (mg/wk) (median [min,max]) | 0 [0,300] | 0 [0,300] | 0.71c |
| TSAT (%) (mean ± SD) | 30.1±13.13 | 31.6±10.5 | 0.12b |
| Ferritin (ng/ml) (median ± interquartile range) | 905±611 | 868±662 | 0.08c |
Central tendency and dispersion measures are computed across all study participants over 12 months follow-up period.
Primary outcome.
t test.
Independent samples median test.
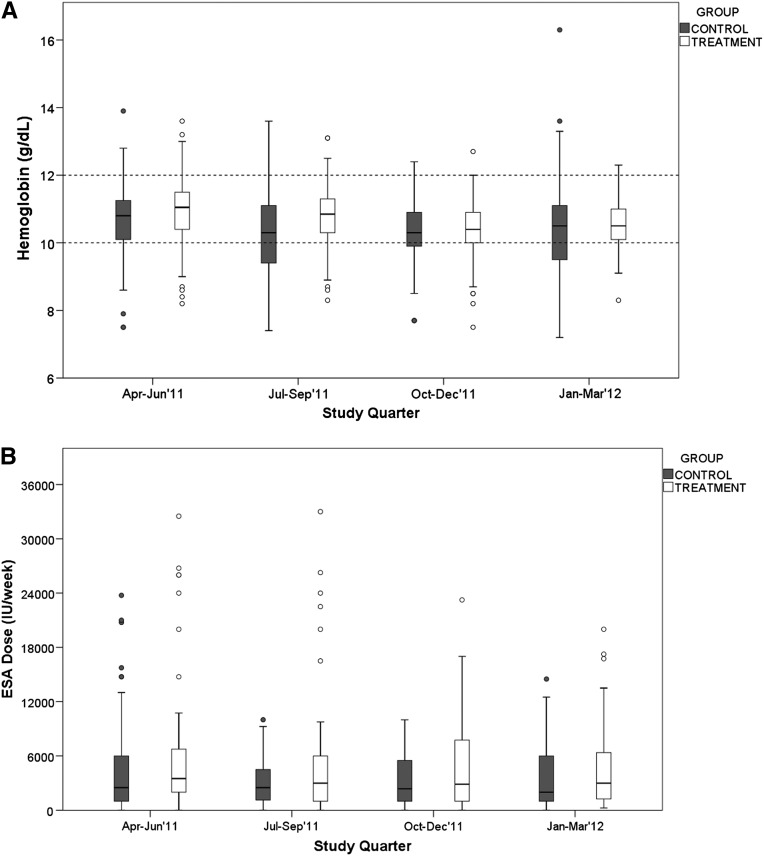
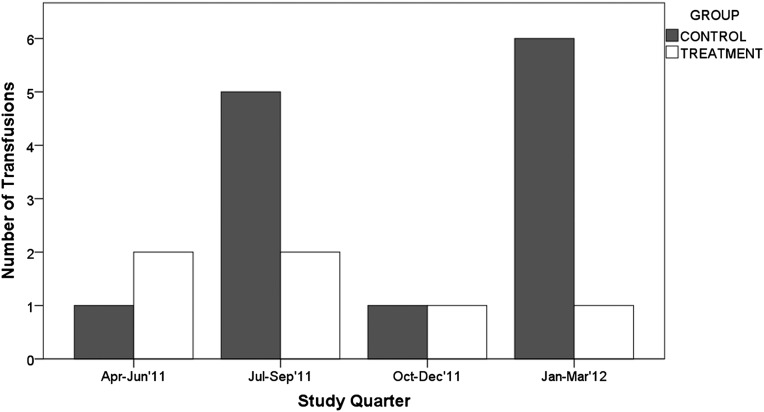
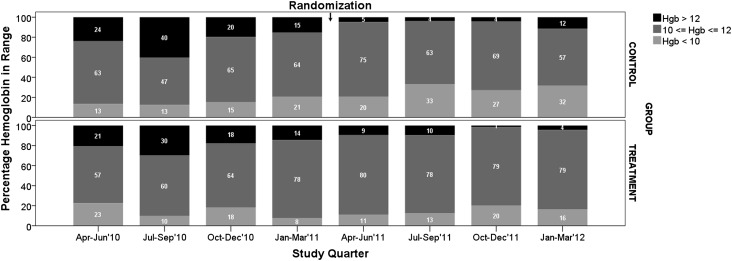
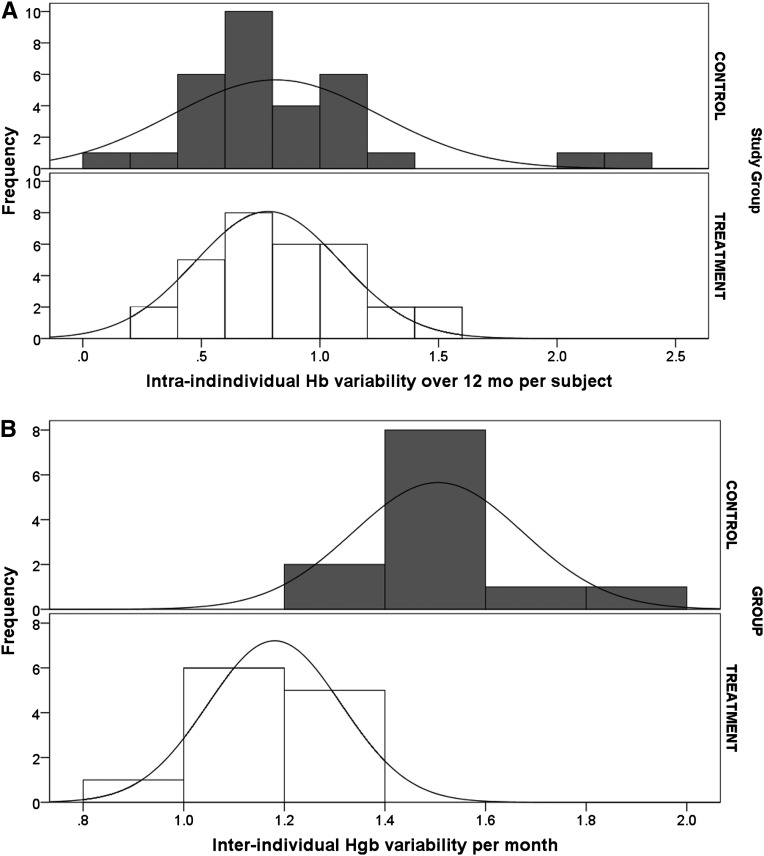
Results of a quarterly analysis excluding participants not receiving ESA are shown in Figures 2–4 and in Table 4. Figure 2A shows that quarterly hemoglobin variability in the treatment group decreased as the study progressed, whereas hemoglobin variability in the control group changed periodically throughout the study (smaller in the first and third study quarters, and larger in the second and fourth study quarters). Repeated-measures ANOVA of quarterly hemoglobin data, excluding participants who did not receive ESA, shows a significant difference in the percentage of hemoglobin between 10 and 12 g/dl (80% treatment versus 64% control; P=0.03) and the percentage of hemoglobin <10 g/dl (14% versus 30%; P=0.04). There was no difference in the percentage of hemoglobin >12 g/dl (6% treatment and control; P=0.92). Repeated-measures ANOVA of the quarterly ESA dose received shows no difference between groups (P=0.25) (Figure 2B). Figure 3 compares the change in hemoglobin percentages below, within, and above the target range 12 months before and during the study. During the 12 months preceding the study, both study groups exhibited similar temporal patterns of hemoglobin distribution below, within, and above the 10–12 range. During the study, the percentage of hemoglobin between 10 and 12 g/dl remained consistently close to 80% in the treatment group and varied between 57% and 75% in the control group. The percentage of hemoglobin <10 g/dl varied between 11% and 20% in the treatment group and 20% and 33% in the control group. Figure 4 shows the transfusion events per study quarter for each study group. There was an increase in the number of transfusions in the control group in the second and fourth study quarters, consistent with the increase in hemoglobin variability (Figure 2A) and the percentage of hemoglobin <10 g/dl (Figure 3). There was no difference in the hospitalization rate between the study groups. Figure 5A shows the probability distribution of the intraindividual hemoglobin variability per participant during the study. Intraindividual hemoglobin variability was not different between the groups (P=0.73). However, as shown in Figure 5B, the mean interindividual hemoglobin variability was different between groups and was 1.18 g/dl in the treatment group and 1.50 g/dl in the control group (P<0.001).
Figure 2.
Distribution of hemoglobin and ESA dose per study quarter, excluding participants who did not receive ESAs in the analyzed quarter. (A) Hemoglobin and (B) ESA dose received.
Figure 4.
Number of transfusion events per quarter.
Table 4.
Comparison of primary and secondary outcomes between study groups per quartera
| Proportion of Hemoglobin (g/dl) | Control Group | Treatment Group | P |
|---|---|---|---|
| Quarter 1 | |||
| <10 | 17 (20.5) | 8 (10.4) | 0.07 |
| 10–12 | 62 (74.7) | 62 (80.5) | 0.29 |
| >12 | 4 (4.8) | 7 (9.1) | 0.21 |
| Quarter 2 | |||
| <10 | 25 (33.3) | 9 (13.0) | 0.002 |
| 10–12 | 47 (62.7) | 56 (81.2) | 0.03 |
| >12 | 3 (4.0) | 4 (5.8) | 0.15 |
| Quarter 3 | |||
| <10 | 19 (27.1) | 14 (20.0) | 0.21 |
| 10–12 | 48 (68.6) | 55 (78.6) | 0.13 |
| >12 | 3 (4.3) | 1 (1.4) | 0.31 |
| Quarter 4 | |||
| <10 | 22 (31.9) | 11 (16.2) | 0.03 |
| 10–12 | 39 (56.5) | 54 (79.4) | 0.003 |
| >12 | 8 (11.6) | 3 (4.4) | 0.11 |
Data are given as n (%).
Excludes participants who did not receive ESAs in the analyzed quarter.
Figure 3.
Percentage of hemoglobin below, within, and above target range, before and during the study, excluding participants who did not receive ESAs in the analyzed quarter.
Figure 5.
Probability distribution of hemoglobin variability. (A) Intraindividual variability and (B) interindividual variability.
There were 13 transfusion events in 8 participants for a total of 31 U of red blood cells in the control group compared with 6 events in 5 participants for a total of 21 U of red blood cells in the treatment group (P=0.31). The reported hemoglobin level at which a transfusion was ordered ranged from 5.8 to 7.8 g/dl (mean 6.9 g/dl) in the control group and from 7.1 to 9.0 g/dl (mean 8.0 g/dl) in the treatment group (P<0.01). There were 11 inpatient and 2 outpatient transfusions. Multiple regression analysis showed that quarterly hemoglobin variability was a significant predictor of transfusions (P<0.001), whereas the study group (P=0.14), mean quarterly hemoglobin (grams per decaliter) (P=0.41), and the number of hospitalizations (P=0.85) were not.
We defined a composite safety event as a combination of all-cause mortality, myocardial infarction, cerebrovascular accident (CVA), and exacerbation of congestive heart failure (CHF). Six participants in the control group and 10 in the treatment group experienced 10 and 11 composite safety events, respectively (P=0.55). There was one myocardial infarction event in each group. There were two CVA events in the treatment group and none in the control group. Both CVA events were in the same patient and were diagnosed as secondary to substance abuse. There were four deaths in the control group and one in the treatment group. There were five CHF events in the control group and seven in the treatment group. Four CHF events in the control group and two in the treatment group were accompanied by missed dialysis treatments. Seventeen participants in each group underwent 38 (control) and 40 (treatment) hospitalizations (P=0.94). Seventeen participants in the control group and 16 in the treatment group underwent 27 and 38 vascular access interventions, respectively (P=0.79). Five participants in the control group and 6 in the treatment group were diagnosed with 7 and 10 infections, respectively (P=0.71).
Discussion
In January 2010, the FDA called for clinical trials to establish optimal ESA dosing algorithms including computer-directed algorithms.6 We present the results of a human study designed to evaluate an individualized, computer-implemented ESA dosing algorithm. In this study, individualization was achieved using patient-specific ESA dosing regimens designed on the principles of multiple MPC (MMPC). The algorithm automatically matched patients to one of many predefined dose-response profiles using individual clinical data collected per the standard of care. We show that individualized administration of ESA leads to an average 11% improvement in total hemoglobin variability around the 10–12 g/dl range compared with a protocol-based population approach leading to a significant decrease in hemoglobin concentrations <10 g/dl, without an increase in hemoglobin concentrations >12 g/dl.
Because the intent of our study was to optimize ESA dosing, our target population was patients receiving an ESA and known to respond to ESA treatment. Nevertheless, two study participants in the treatment group were found to be hyporesponsive and received significantly larger ESA doses than the rest of the study population. This finding emphasizes the need for vigilance in evaluating ESA resistance and using complementary treatment strategies in order to avoid potentially dangerous large ESA doses.
At the time of the study design, the recommended hemoglobin target was 10–12 g/dl. Changes in anemia management have followed recent FDA rulings. The focus is shifting away from population-wide goals toward individual hemoglobin targets and minimizing the risk of transfusions and cardiovascular events. Although we targeted a hemoglobin range of 10–12 g/dl (Smart Anemia Manager [SAM] software targeted 11 g/dl) in this study, our approach allows for individualized hemoglobin targets as required by the physician.
The primary goal of using an ESA is to avoid blood transfusion. One interpretation of this goal is that hemoglobin concentration should be sufficiently high to provide a “safety buffer” in case of acute blood loss. The introduction of the prospective payment system coincided with a decrease in ESA dose.9 In association with this trend and because of the potential danger of targeting higher hemoglobin,1,3 the mean hemoglobin levels have been declining since 2007.11 This decline has been associated with a rise in the number of transfusions.5 In our study, we observed a mean achieved hemoglobin in the treatment group of 0.3 g/dl higher with fewer hemoglobin measurements <10 g/dl compared with the control group. Coincidentally, this finding was associated with a 37% increase in the number of participants receiving a transfusion and a 32% increase in the number of units transfused in the control group. Although this study was not powered to detect statistically significant difference in transfusion rate, we demonstrate that transfusions may increase at hemoglobin levels <10 g/dl and that even a small difference in hemoglobin variability could potentially affect the transfusion rate.
Our study has two limitations. The main limitation is the small sample size and single-center design. Because of this, the results are not easily generalizable to the US dialysis population. The other limitation is the focus on the maintenance dosing, because most of the study participants were receiving ESAs before the start of the study. A large multicenter study including ESA-naïve patients would address both of these limitations. Our results can be used to design such a trial.
New methods are needed to provide individualized anemia management for patients receiving ESAs. We show that individualized ESA dosing facilitates precise hemoglobin control defined by achieving desired targets and decreased variability. We also provide evidence that more precise hemoglobin control may result in fewer transfusions. These findings need to be validated in a larger patient population.
Concise Methods
We performed a single-center, double-blind, standard-of-care controlled study at the dialysis unit of the Kidney Disease Program, University of Louisville, Louisville, Kentucky. The research protocol conformed to the Declaration of Helsinki and was approved by the University of Louisville Institutional Review Board (Supplemental Material). Informed consent was obtained from each individual before participation in the study. Eligible participants were prevalent hemodialysis patients with a dialysis vintage of at least 3 months, were aged 18–80 years, were receiving dialysis treatment three times a week, were receiving or expected to receive ESA treatment, had adequacy of dialysis (Kt/V) ≥1.2, and had adequate iron stores (ferritin >200 ng/ml, TSAT >20%). Patients were excluded if they had a life expectancy <12 months, were known to suffer from frequent (defined as at least once a month during 3–6 months preceding the study) uncontrolled blood loss, dialyzer clotting, or access-related problems, had active infections, were diagnosed with severe cardiac disability, received coronary bypass within 3 months before the study, or had documented resistance to ESAs or bone marrow suppression due to HIV, leukemia, or pharmacologic agents.
Participants were assigned to receive ESA doses guided by SAM software or by a standard protocol. Individualized dosing in SAM was based on MMPC. MMPC is an extension of the MPC approach8,9 and uses multiple MPC algorithms designed for patient-specific dose-response models. Each model corresponds to one of five dose-response classes: extreme hyper-responder, hyper-responder, moderate hyper-responder, intermediate responder, and hyporesponder. Each MPC algorithm constitutes an evolving dosing regimen tied to a specific dose-response class. At each dosing interval, it generates an ESA dose to achieve a physician-specified target hemoglobin (grams per decaliter) for its dose-response class. We used a maximum time to target of 3 months provided that the hemoglobin rate of change was <2 g/dl per month. In this study, SAM matched the dose-response class to individual patients based on an average weekly ESA dose received over 4 weeks before each dose adjustment.12 If no data were available for a participant, we classified the individual as an extreme hyper-responder to avoid ESA doses potentially leading to a rapid hemoglobin increase. Before clinical deployment, we successfully evaluated SAM through computer simulations.13,14 The standard protocol used in the control group was developed in the unit in January 2011.
The primary outcome was the total hemoglobin variability around the target range of 10–12 g/dl defined as the proportion of hemoglobin concentrations within the 10–12 g/dl range over the follow-up period of 12 months and calculated using monthly hemoglobin measurements. If a participant had repeated hemoglobin measurements within a single month, the last measurement was used in the analysis consistent with Centers for Medicare and Medicaid Services reporting guidelines. The secondary outcomes were the proportion of hemoglobin concentrations <10 g/dl and >12 g/dl.
Given the patient population of our facility and our previous experience,8 we expected to enroll between 50 and 80 participants for this study. On the basis of our previous simulations,13,14 we assumed a minimum clinically important difference of 10% in the primary outcome in favor of SAM. We performed compromise power analysis using one-tailed Fisher’s exact test to determine the implied significance (α) and power (1 − β) at the minimum and maximum expected sample sizes. Using Bonferroni correction to account for multiple measurements, we set the threshold for statistical significance at P=0.004 (=0.05/12, for 12 cumulative measurements in each participant) for the intent-to-treat analysis. The implied significance varied between 0.009 (50 participants) and 0.005 (80 participants). The implied power varied between 0.58 (50 participants) and 0.75 (80 participants). After completion of the study, we computed the achieved power using the post hoc power approach. Power analysis was performed in G*Power.15
A total of 62 participants were enrolled and followed between April 2011 and April 2012. All participants were enrolled at the same time. Participants were randomly assigned to the treatment or control arms using the minimization16 technique to balance age, sex, average monthly hemoglobin (grams per decaliter), median ESA dose, mean TSAT, median ferritin, mean Kt/V, and mean albumin during the month immediately preceding the study, as well as presence of diabetes, CHF, and the type of vascular access.
Hemoglobin concentrations were measured and ESA dose adjustments made at the beginning of each month consistent with the standard of care. The standard dosage increment was 1000 IU/wk and the maximum allowed dosage was 90,000 IU/wk. The ESA used in the study was epoetin alfa given by intravenous injection.
Monthly ESA dose adjustments were performed by a blinded nurse practitioner experienced in anemia management. To achieve blinding, the SAM algorithm, standard protocol, and group assignment key were incorporated into a single computer program. The nurses interacted with it through a graphical user interface that displayed hemoglobin concentrations over time, the average weekly ESA dose received over the last 4 weeks, and a recommended new weekly ESA dose. The nurses were instructed to follow the dose recommendations unless they found them inappropriate for the participant’s clinical presentation at the time, in which case they were to consult with the supervising physicians who would then approve or deny overriding the dose recommendation. Intravenous iron sucrose in both groups was administered per protocol derived from the National Kidney Foundation Kidney Disease Outcomes Quality Initiative guidelines. Iron was administered to maintain ferritin levels of 300–500 ng/ml and TSAT >30%. The maximum iron dosage was 100 mg three times per week. Hospitalizations, infections, cardiovascular events, blood transfusions, and access complications and procedures were recorded on a weekly basis. Intraindividual hemoglobin variability was defined as the SD of all of a participant’s hemoglobin measurements over the study follow-up period. Interindividual hemoglobin variability for each study month was defined as the SD of hemoglobin measurements performed during that study month for all of the participants. Statistical analysis was performed using the Fisher’s exact test for primary and secondary outcomes, the independent sample t test for normally distributed variables, the Mann–Whitney U test for non-normally distributed variables, and the independent sample median test for medians. Repeated-measures ANOVA with a statistical significance threshold of P=0.05 was used to compare temporal patterns in hemoglobin variability on a quarterly basis. All calculations were performed in SPSS Statistics 20 (IBM) and MatLab (The Mathworks) software.
Disclosures
A.E.G. is a coinventor of the Smart Anemia Manager software program, a cofounder of Pharos Medicine LLC, and a consultant to and advisory board member for Amgen. G.R.A. is a coinventor of the Smart Anemia Manager software program, a cofounder of Pharos Medicine LLC, and an advisory board member for Amgen. A.A.J. is a coinventor of the Smart Anemia Manager software program. M.E.B. is a coinventor of the Smart Anemia Manager software program and a cofounder of Pharos Medicine LLC.
Supplementary Material
Acknowledgments
This study was supported by grants from the National Institutes of Health National Institute of Diabetes and Digestive and Kidney Diseases (5K25DK72085 and 1R01DK093832 to A.E.G.) and the Department of Veterans Affairs (Merit Review Grant to M.E.B.). S.N.R. was partially supported by Dr. D.M. Miller, Director James Graham Brown Cancer Center and Wendell Cherry Chair in Clinical Trial Research.
Footnotes
Published online ahead of print. Publication date available at www.jasn.org.
This article contains supplemental material online at http://jasn.asnjournals.org/lookup/suppl/doi:10.1681/ASN.2013010089/-/DCSupplemental.
References
- 1.Singh AK, Szczech L, Tang KL, Barnhart H, Sapp S, Wolfson M, Reddan D, CHOIR Investigators : Correction of anemia with epoetin alfa in chronic kidney disease. N Engl J Med 355: 2085–2098, 2006 [DOI] [PubMed] [Google Scholar]
- 2.Szczech LA, Barnhart HX, Inrig JK, Reddan DN, Sapp S, Califf RM, Patel UD, Singh AK: Secondary analysis of the CHOIR trial epoetin-alpha dose and achieved hemoglobin outcomes. Kidney Int 74: 791–798, 2008 [DOI] [PMC free article] [PubMed] [Google Scholar]
- 3.Pfeffer MA, Burdmann EA, Chen CY, Cooper ME, de Zeeuw D, Eckardt KU, Feyzi JM, Ivanovich P, Kewalramani R, Levey AS, Lewis EF, McGill JB, McMurray JJ, Parfrey P, Parving HH, Remuzzi G, Singh AK, Solomon SD, Toto R, TREAT Investigators : A trial of darbepoetin alfa in type 2 diabetes and chronic kidney disease. N Engl J Med 361: 2019–2032, 2009 [DOI] [PubMed] [Google Scholar]
- 4.Solomon SD, Uno H, Lewis EF, Eckardt KU, Lin J, Burdmann EA, de Zeeuw D, Ivanovich P, Levey AS, Parfrey P, Remuzzi G, Singh AK, Toto R, Huang F, Rossert J, McMurray JJ, Pfeffer MA, Trial to Reduce Cardiovascular Events with Aranesp Therapy (TREAT) Investigators : Erythropoietic response and outcomes in kidney disease and type 2 diabetes. N Engl J Med 363: 1146–1155, 2010 [DOI] [PubMed] [Google Scholar]
- 5.Collins AJ: ESRD Payment Policy Changes: The New “Bundled” Dialysis Prospective Payment System (PPS) in the United States. Presented at the 2012 National Kidney Foundation Spring Clinical Meeting, Washington, DC, May 9–13, 2012 [Google Scholar]
- 6.Unger EF, Thompson AM, Blank MJ, Temple R: Erythropoiesis-stimulating agents—time for a reevaluation. N Engl J Med 362: 189–192, 2010 [DOI] [PubMed] [Google Scholar]
- 7.Kliger AS, Fishbane S, Finkelstein FO: Erythropoietic stimulating agents and quality of a patient’s life: Individualizing anemia treatment. Clin J Am Soc Nephrol 7: 354–357, 2012 [DOI] [PubMed] [Google Scholar]
- 8.Brier ME, Gaweda AE, Dailey A, Aronoff GR, Jacobs AA: Randomized trial of model predictive control for improved anemia management. Clin J Am Soc Nephrol 5: 814–820, 2010 [DOI] [PMC free article] [PubMed] [Google Scholar]
- 9.Gaweda AE, Jacobs AA, Aronoff GR, Brier ME: Model predictive control of erythropoietin administration in the anemia of ESRD. Am J Kidney Dis 51: 71–79, 2008 [DOI] [PubMed] [Google Scholar]
- 10.Lines SW, Lindley EJ, Tattersall JE, Wright MJ: A predictive algorithm for the management of anaemia in haemodialysis patients based on ESA pharmacodynamics: Better results for less work. Nephrol Dial Transplant 2012;27: 2425–2429 [DOI] [PubMed]
- 11.Pisoni RL, Fuller DS, Bieber BA, Gillespie BW, Robinson BM: The DOPPS Practice Monitor for US dialysis care: Trends through August 2011. Am J Kidney Dis 60: 160–165, 2012 [DOI] [PubMed] [Google Scholar]
- 12.Gaweda AE, Jacobs AA, Brier ME: Application of fuzzy logic to predicting erythropoietic response in hemodialysis patients. Int J Artif Organs 31: 1035–1042, 2008 [DOI] [PubMed] [Google Scholar]
- 13.Gaweda AE, Malof JM, Aronoff GR, Jacobs AA, Brier ME: computer-aided personalized anemia management. J Am Soc Nephrol 21: 107A, 2010
- 14.Gaweda AE, Brier ME, Aronoff GR: Validation of an intelligent decision support tool for anemia management. J Am Soc Nephrol 22: 480A, 2011
- 15.Faul F, Erdfelder E, Lang A-G, Buchner A: G*Power 3: A flexible statistical power analysis program for the social, behavioral, and biomedical sciences. Behavior Res Methods 39, 175–191, 2007 [DOI] [PubMed] [Google Scholar]
- 16.Taves DR: Minimization: A new method of assigning patients to treatment and control groups. Clin Pharmacol Ther 15: 443–453, 1974. [DOI] [PubMed] [Google Scholar]
Associated Data
This section collects any data citations, data availability statements, or supplementary materials included in this article.


