Abstract
Elevated serum leptin levels correlate with inflammation and predict changes in lean body mass in patients with CKD, and activation of the melanocortin system by leptin signaling mediates the pathophysiology of CKD-associated cachexia. We tested whether treatment with a pegylated leptin receptor antagonist (PLA) attenuates cachexia in mice with CKD. CKD and Sham mice received vehicle or PLA (2 or 7 mg/kg per day). At these doses, PLA did not influence serum leptin levels in mice. Treatment with 7 mg/kg per day PLA stimulated appetite and weight gain, improved lean mass and muscle function, reduced energy expenditure, and normalized the levels of hepatic TNF-α and IL-6 mRNA in mice with CKD. Furthermore, treatment with 7 mg/kg per day PLA attenuated the CKD-associated increase in the transcriptional and protein abundance of uncoupling proteins that mediates thermogenesis, and it normalized the molecular signatures of processes associated with muscle wasting in CKD, including proteolysis, myogenesis and muscle regeneration, and expression of proinflammatory muscle cytokines, such as IL-1α, -1β, and -6 and TNF-α. Our results suggest that leptin antagonism may represent a viable therapeutic strategy for cachexia in CKD.
Cachexia is prevalent among patients with CKD and associated with high mortality and morbidity.1 Leptin regulates energy homeostasis and is a key immunomodulatory cytokine.2 Leptin induces a negative energy balance by inhibiting food intake and increasing energy expenditure. Leptin inhibits food intake through hypothalamic signaling and increases energy expenditure through upregulation of uncoupling proteins (UCPs).3 Elevated serum leptin levels in CKD patients predict longitudinal changes in lean body mass and correlate with inflammation.4,5
Leptin crosses the blood–brain barrier, and its receptors are found both centrally and peripherally.2,6 Leptin binds to its hypothalamic receptor and inhibits orexigenic signaling pathways while it stimulates anorexigenic signaling pathways. We previously reported that activation of the melanocortin system through leptin signaling is a key step in the pathophysiology of CKD cachexia.7 Blockade of leptin activity may provide a novel therapeutic strategy for cachexia in CKD. The pegylated leptin receptor antagonist (PLA), BL5040, binds but does not activate the leptin receptor.8,9 PLA treatment stimulates food intake and weight gain in normal mice.8,10 In this study, we tested the efficacy of this PLA in a mouse model of CKD-associated cachexia.
Results
PLA Treatment Ameliorates Anorexia and Weight Loss and Improves Muscle Function in CKD
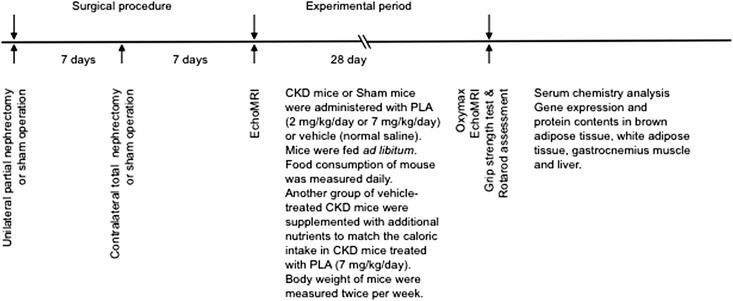
Schematic representation of the experimental design is shown in Figure 1. CKD mice received treatment with either the PLA (2 or 7 mg/kg per day) or vehicle (V). CKD/PLA and CKD/V mice were fed ad libitum. To investigate the beneficial effects of PLA treatment beyond its nutritional effects, we included another group of CKD mice that was supplemented with additional nutrients (CKD/Supp) to match the calorie intake in CKD/PLA (7 mg/kg per day) mice. Sham mice received the PLA (7 mg/kg per day) or V.
Figure 1.
Schematic representation of the study design.
CKD mice were uremic. CKD/V, CKD/PLA (2 mg/kg per day), CKD/PLA (7 mg/kg per day), and CKD/Supp mice had higher serum creatinine and BUN than Sham/V mice (Table 1). Serum leptin levels were higher in CKD than Sham mice and were not changed by PLA treatment. Serum leptin levels in CKD/PLA mice were not different than levels in CKD/V and CKD/Supp mice. In addition, serum leptin levels in Sham/PLA mice were not different from those levels in Sham/V mice. Serum levels of total protein, albumin, globulin, albumin/globulin ratio, and triglyceride in both CKD and Sham mice did not change after PLA treatment (Table 1).
Table 1.
Serum chemistry of mice
| Measurements | CKD | Sham | ||||
|---|---|---|---|---|---|---|
| V (n=12) | Supp (n=12) | PLA (2 mg/kg per day; n=12) | PLA (7 mg/kg per day; n=12) | V (n=8) | PLA (7 mg/kg per day; n=8) | |
| Initial body weight (g) | 21.9±0.3a | 20.8±0.3a | 20.9±0.1a | 21.3±0.3a | 24.9±0.4 | 24.6±0.5 |
| Serum chemistry | ||||||
| Creatinine (mg/dl) | 0.4±0.0a | 0.6±0.1a | 0.4±0.0a | 0.5±0.0a | <0.2 | <0.2 |
| BUN (mg/dl) | 88.4±9.9a | 96.4±9.2a | 100.5±12.0a | 100.3±10.0a | 29.6±1.1 | 26.0±1.1b |
| Leptin (ng/ml) | 8.5±0.3a | 8.9±0.4a | 8.4±0.4a | 8.3±0.5a | 4.5±0.6 | 5.7±0.4 |
| Total protein (g/dl) | 4.9±0.1 | 5.0±0.2 | 5.1±0.1 | 5.1±0.0b | 5.0±0.1 | 5.1±0.1b |
| Total albumin (g/dl) | 2.8±0.0 | 2.8±0.2 | 2.9±0.0 | 2.9±0.0 | 2.9±0.0 | 3.0±0.1b |
| Globulin (g/dl) | 2.1±0.0 | 2.1±0.0 | 2.2±0.0b | 2.2±0.0b | 2.1±0.0 | 2.2±0.1 |
| Albumin/globulin ratio | 1.4±0.0 | 1.3±0.0 | 1.4±0.0 | 1.3±0.0 | 1.4±0.0 | 1.4±0.0 |
| Triglyceride (mg/dl) | 93.6±12.7 | 79.5±5.9 | 101.1±13.9 | 71.2±3.2 | 86.1±9.3 | 81.4±2.4 |
Six groups of mice were included: CKD/V, CKD/Supp, CKD/PLA (2 mg/kg per day), CKD/PLA (7 mg/kg per day), Sham/V, and Sham/PLA (7 mg/kg per day). All groups of mice were compared with Sham/V mice. CKD, nephrectomized; Sham, sham-operated; V, vehicle-treated; Supp, nutrient supplemented. Data are expressed as mean ± SEM.
P<0.01.
P<0.05.
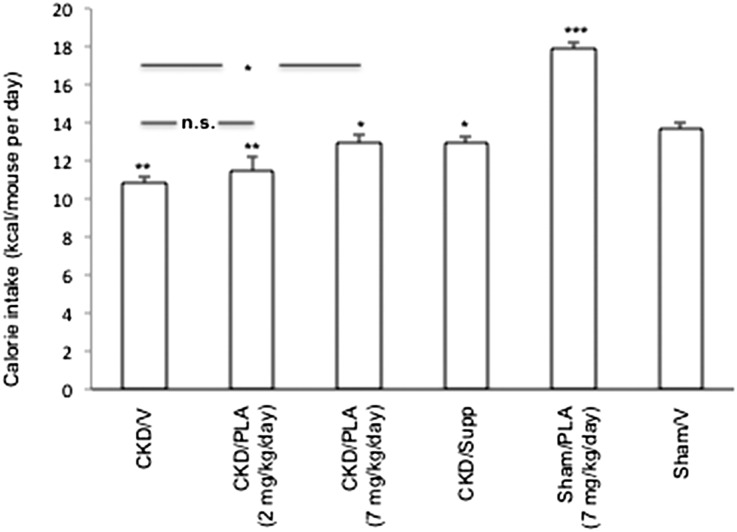
PLA treatment ameliorated anorexia in CKD mice. Average daily calorie intake in CKD/PLA (2 mg/kg per day) and CKD/V mice (11.5±0.7 and 10.9±0.4 kcal/d, respectively) was significantly lower than average daily caloric intake in Sham/V mice (13.7±0.4 kcal/d) (Figure 2). Average daily calorie intake was normalized in CKD/PLA (7 mg/kg per day) mice (13.0±0.5 kcal/d).
Figure 2.
Average daily calorie intake in mice. For CKD/V, CKD/PLA (2 mg/kg per day), CKD/PLA (7 mg/kg per day), Sham/PLA, and Sham/V mice, calorie intake (kilocalories) was calculated by multiplication of daily food intake of Diet 5015 (grams) with physiologic fuel value of 3.8 kcal/g. For CKD/Supp mice, total calorie intake (kilocalories) is the sum of calorie intake derived from daily food intake and nutrient supplementation. Calorie intake from nutrient supplementation is the volume of supplemented nutrient (in milliliters)×3.0 kcal/ml. Calorie intakes of CKD/V, CKD/PLA (2 mg/kg per day), CKD/PLA (7 mg/kg per day), CKD/Supp, and Sham/PLA mice were compared with calorie intakes of Sham/V mice. Calorie intakes of CKD/PLA (2 mg/kg per day) and CKD/PLA (7 mg/kg per day) mice were also compared with calories intakes of CKD/V mice. Data are expressed as mean ± SEM. *P<0.05; **P<0.01; ***P<0.001.
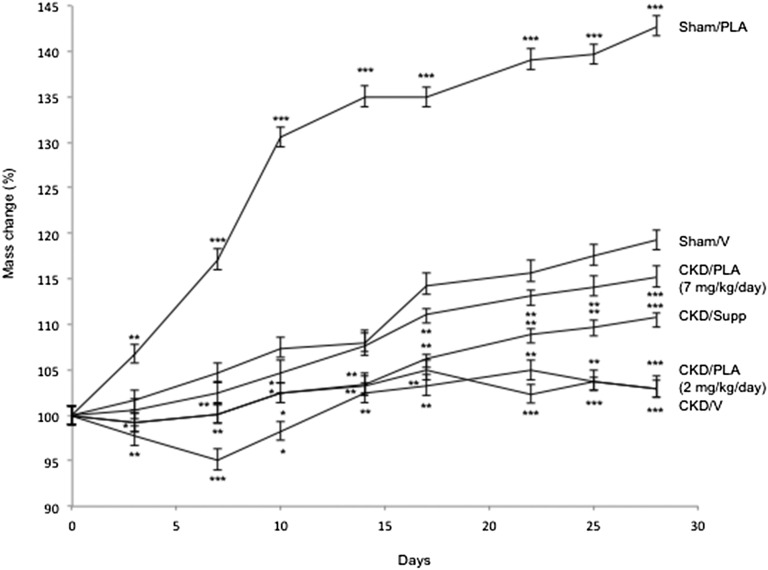
Weight gain in CKD/PLA (2 mg/kg per day) and CKD/V mice (gain of 3.0±1.3% and gain of 3.0±0.8%, respectively) was significantly lower than weight gain in Sham/V mice (gain of 19.2±1.2%) (Figure 3). Significant weight gain in CKD/PLA (7 mg/kg per day; gain of 2.4±1.3%) mice relative to CKD/V and CKD/Supp mice (loss of 5.0±1.3% and gain of 0.1±1.1%, respectively) was observed at day 7, and the trend remained significant for the rest of the study (Figure 3). Sham/PLA mice showed a significant weight gain versus Sham/V controls (gain of 6.7±0.1% and gain of 1.6±0.2%, respectively) at day 3, and the trend remained significant for the rest of the study.
Figure 3.
Weight change during the course of the study. Mice were weighted and normalized with initial weight. Weight changes in CKD/V, CKD/PLA (2 mg/kg per day), CKD/PLA (7 mg/kg per day), CKD/Supp, and Sham/PLA mice were compared with Sham/V mice. Data are expressed as mean ± SEM. *P<0.05; **P<0.01; ***P<0.001.
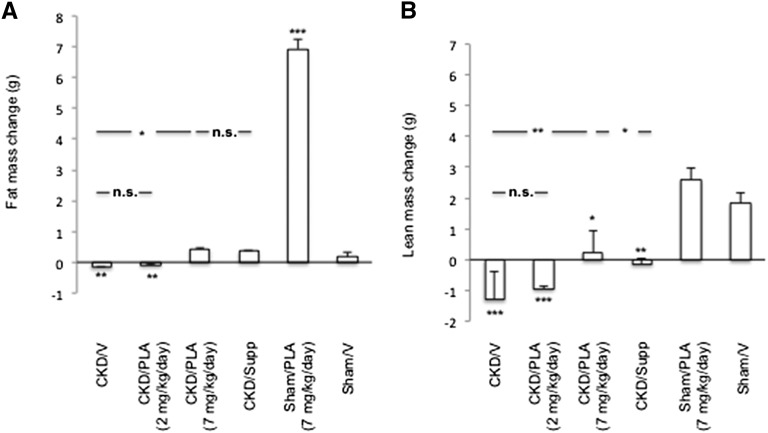
CKD/V and CKD/PLA (2 mg/kg per day) mice lost fat mass (loss of 0.2±0.0 g and loss of 0.1±0.0 g, respectively) (Figure 4). CKD/PLA (7 mg/kg per day) mice gained fat mass, and it was not different from the gain in CKD/Supp and Sham/V mice (gain of 0.4±0.1 g, gain of 0.4±0.0 g, and gain of 0.2±0.1 g, respectively). CKD/V, CKD/PLA (2 mg/kg per day), and CKD/Supp mice lost lean mass (loss of 1.3±0.9 g, loss of 0.9±0.1 g, and loss of 0.1±0.2 g, respectively), whereas CKD/PLA (7 mg/kg per day) mice gained lean mass (gain of 0.2±0.7 g).
Figure 4.
Change of (A) fat and (B) lean mass in mice. Animals were scanned before the initiation of the study followed 28 days later by a second quantitative magnetic resonance imaging scan. Results were analyzed and expressed as in Figure 3. *P<0.05; **P<0.01; ***P<0.001.
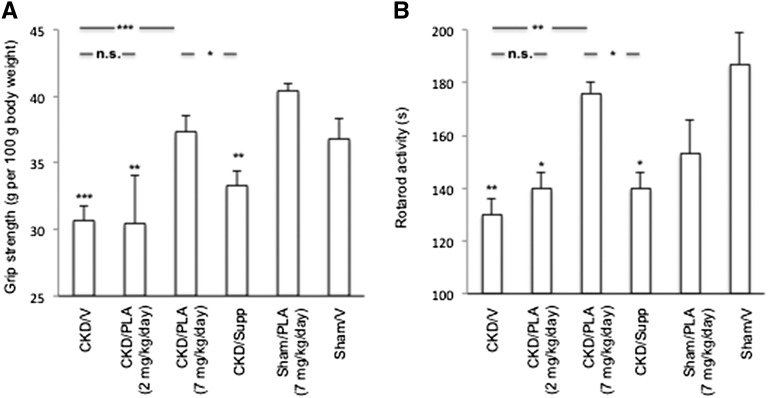
Forelimb grip strength was markedly reduced in CKD/V, CKD/PLA (2 mg/kg per day), and CKD/Supp mice (30.7±1.1 g/100 g, 30.4±3.7 g/100 g, and 33.3±1.2 g/100 g, respectively) relative to Sham/V mice (36.8±1.5 g/100g) and normalized in CKD/PLA (7 mg/kg per day) mice (37.3±1.2 g/100 g) (Figure 5). Similarly, rotarod activity was significantly impaired in CKD/V, CKD/PLA (2 mg/kg per day), and CKD/Supp mice (130±6 seconds, 140±6 s seconds, and 140±6 seconds, respectively) and normalized in CKD/PLA (7 mg/kg per day) mice (176±4 seconds).
Figure 5.
Muscle function in mice. (A) Forelimb grip strength and (B) motor coordination. Results were analyzed and expressed as in Figure 3. *P<0.05; **P<0.01; ***P<0.001.
PLA Treatment Normalizes Energy Expenditure and Decreases Expression of UCPs in CKD
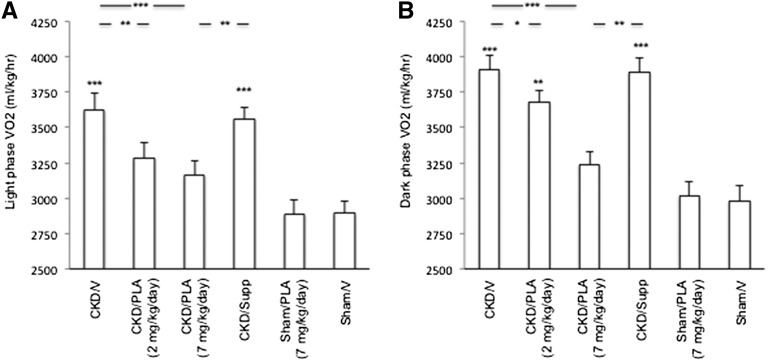
Light-phase volume of oxygen consumption (VO2) was significantly elevated in CKD/V and CKD/Supp mice relative to Sham/V mice (627±112, 3562±79, and 2893±83 ml/kg per hour, respectively) (Figure 6). Light-phase VO2 was normalized in CKD/PLA (2 and 7 mg/kg per day) mice (3287±108 and 3162±104 ml/kg per hour, respectively). Dark-phase VO2 was significantly increased in CKD/V, CKD/PLA (2 mg/kg per day), and CKD/Supp mice (3912±103, 3682±79, and 3893±98 ml/kg per hour, respectively) relative to Sham/V mice (2893±103 ml/kg per hour). Dark-phase VO2 in CKD/PLA (7 mg/kg per day) mice (3241±89 ml/kg per hour) was not different than dark-phase VO2 in Sham/V mice.
Figure 6.
Basal metabolic rate in mice. (A) Light- and (B) dark-phase VO2. VO2 (milliliters per kilogram per hour) is calculated as the average readings obtained during the recording period. Results were analyzed and expressed as in Figure 3. *P<0.05; **P<0.01; ***P<0.001.
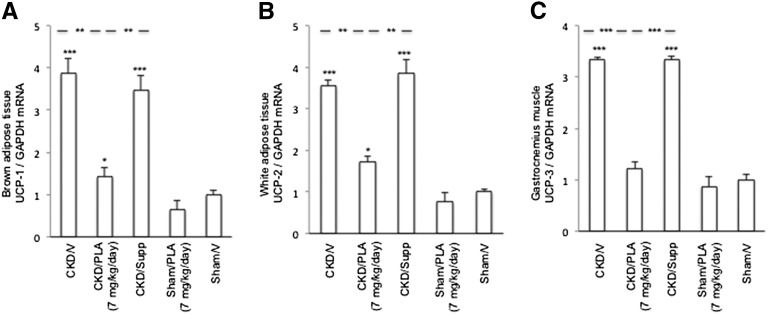
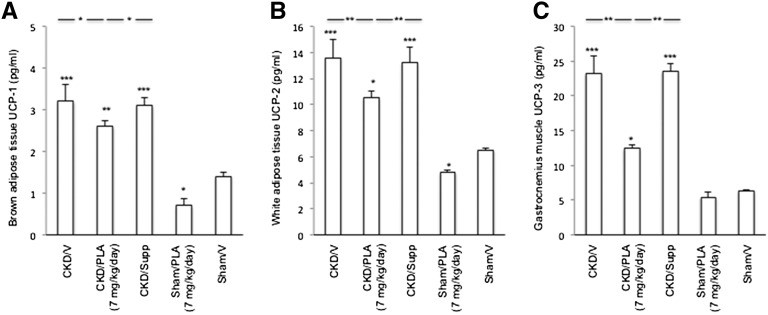
Brown adipose tissue (BAT) UCP-1, white adipose tissue UCP-2, and gastrocnemius muscle UCP-3 mRNA levels were significantly increased in CKD/V and CKD/Supp mice relative to Sham/V mice (Figure 7). UCP-1 and -2 mRNA levels in CKD/PLA (7 mg/kg per day) mice were significantly lower than in CKD/V and CKD/Supp mice. Gastrocnemius muscle UCP-3 mRNA content was normalized in CKD/PLA (7 mg/kg per day) mice. Protein levels of UCPs were elevated in CKD/V and CKD/Supp relative to Sham/V mice (Figure 8). UCPs protein levels were significantly decreased in CKD/PLA (7 mg/kg per day) compared with CKD/V and CKD/Supp mice.
Figure 7.
Gene expression of UCPs. (A) Gene expression of UCP-1 in brown adipose tissue. (B) Gene expression of UCP-2 in white adipose tissue. (C) Gene expression of UCP-3 in gastrocnemius muscle. GAPDH, glyceraldehyde-3-phosphate dehydrogenase. Results were analyzed and expressed as in Figure 3. *P<0.05; **P<0.01; ***P<0.001.
Figure 8.
Protein contents of UCPs. (A) Protein content of UCP-1 in brown adipose tissue. (B) Protein content of UCP-2 in white adipose tissue. (C) Protein content of UCP-3 in gastrocnemius muscle. Results were analyzed and expressed as in Figure 3. *P<0.05; **P<0.01; ***P<0.001.
PLA Treatment Attenuates the Exacerbation of Hepatic Inflammation in CKD
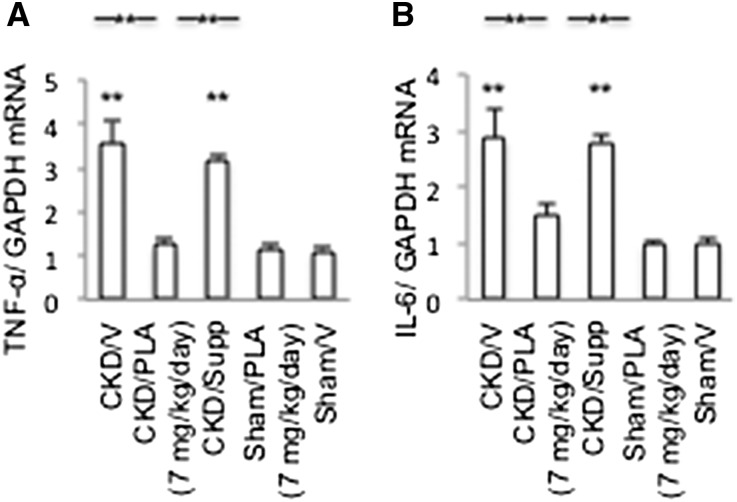
Significant upregulation of hepatic TNF-α and IL-6 was observed in CKD/V and CKD/Supp mice relative to Sham/V mice (Figure 9). Hepatic TNF-α and IL-6 mRNA expressions were normalized in CKD/PLA (7 mg/kg per day) mice.
Figure 9.
Hepatic inflammatory cytokine mRNA levels. (A) Hepatic TNF-α mRNA. (B) Hepatic IL-6 mRNA. GAPDH, glyceraldehyde-3-phosphate dehydrogenase. Results were analyzed and expressed as in Figure 3. **P<0.01.
PLA Treatment Corrects Aberrant Muscle Mass Signaling Pathways in CKD
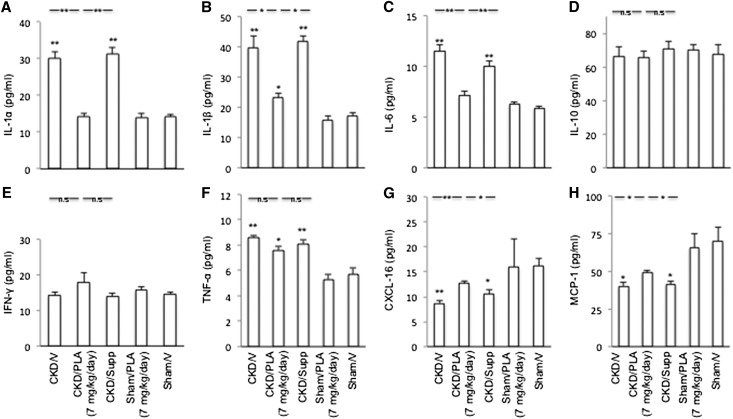
Gastrocnemius muscle protein contents of IL-1α, -1β, and IL-6 and TNF-α were increased in CKD/V and CKD/Supp mice compared with Sham/V mice (Figure 10). PLA caused an overall decrease in proinflammatory cytokines in CKD. Muscle protein contents of IL-1α and -6 were normalized in CKD/PLA (7 mg/kg per day) mice. Muscle protein level of IL-1β was significantly reduced in CKD/PLA (7 mg/kg per day) mice relative to CKD/V and CKD/Supp mice. There was no difference in muscle IL-10 and IFN-γ protein contents among various groups of mice. Skeletal muscle chemokine (C-X-C motif) ligand 16 (CXCL-16) and monocyte chemotactic protein-1 (MCP-1) protein levels were decreased in CKD/V and CKD/Supp mice but normalized in CKD/PLA (7 mg/kg per day) mice.
Figure 10.
Protein concentrations of cytokines in gastrocnemius muscle. (A) Muscle IL-1α content. (B) Muscle IL-1β content. (C) Muscle IL-6 content. (D) Muscle IL-10 content. (E) Muscle IFN-γ content. (F) Muscle TNF-α content. (G) Muscle CXCL-16 content. (H) Muscle MCP-1 content. Results were analyzed and expressed as in Figure 3. *P<0.05; **P<0.01.
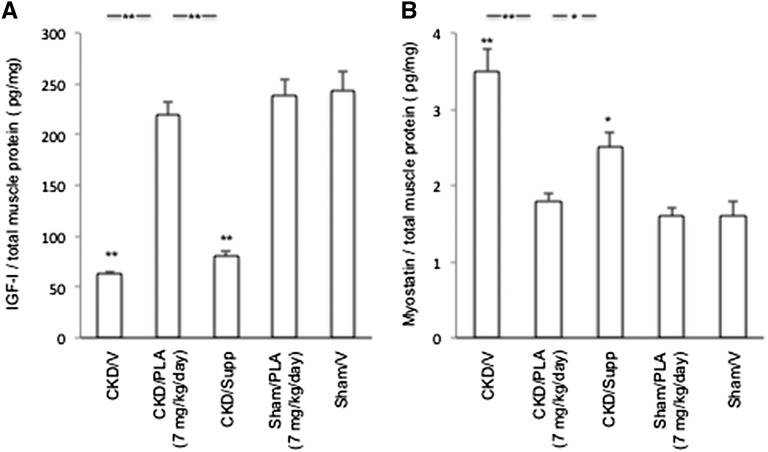
Gastrocnemius muscle IGF-I protein content was decreased, whereas myostatin protein content was increased in CKD/V and CKD/Supp relative to Sham/V mice (Figure 11). Skeletal muscle IGF-I and myostatin protein levels were normalized in CKD/PLA (7 mg/kg per day) mice.
Figure 11.
Protein concentration of IGF-I and myostatin in gastrocnemius muscle. (A) Muscle IGF-I protein content. (B) Muscle myostatin protein content. Results were analyzed and expressed as in Figure 3. *P<0.05; **P<0.01.
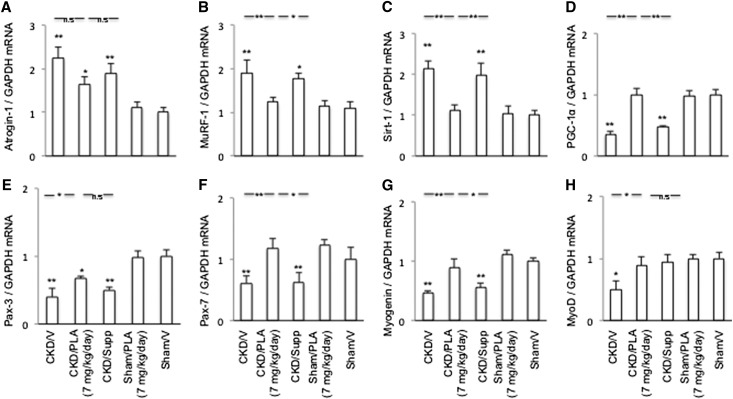
Gastrocnemius muscle Atrogin-1 and muscle-specific RING finger-1 (MuRF) transcript levels were significantly higher in CKD/V and CKD/Supp mice relative to Sham/V mice, whereas Pax-3 and -7, myogenin, and myogenic differentiation (MyoD) transcript levels were lower in CKD/V than Sham/V mice (Figure 12). Aberrant gene expressions of MuRF-1, Pax-7, myogenin, and MyoD were corrected in CKD/PLA (7 mg/kg per day) mice. Gastrocnemius muscle Sirtuin-1 (Sirt) transcript levels were increased, whereas peroxisome proliferator-activated receptor gamma, coactivator-1 (PGC-1α) transcript levels were decreased in CKD/V and CKD/Supp relative to Sham/V mice. Skeletal muscle Sirt-1 and PGC-1α transcript levels were normalized in CKD/PLA (7 mg/kg per day) mice.
Figure 12.
Gene expression of key molecules implicated in the pathogenesis of CKD-associated muscle wasting. (A) Muscle Atrogin-1 mRNA expression. (B) Muscle MuRF-1 mRNA expression. (C) Muscle Sirt-1 mRNA expression. (D) Muscle PGC-1α mRNA expression. (E) Muscle Pax-3 mRNA expression. (F) Muscle Pax-7 mRNA expression. (G) Muscle myogenin mRNA expression. (H) Muscle MyoD mRNA expression. GAPDH, glyceraldehyde-3-phosphate dehydrogenase. Results were analyzed and expressed as in Figure 3. *P<0.05; **P<0.01.
Discussion
Leptin signaling is an important cause of CKD-associated cachexia.1,4 In this study, we tested the efficacy of a pegylated leptin antagonist in a mouse model of CKD. This PLA can cross the blood–brain barrier. After peripheral administration, this PLA has been detected in the central nervous system.8 PLA treatment blocks the transport of circulating leptin across the blood–brain barrier and also blocks the binding of central nervous system leptin to its receptor. PLA treatment did not influence serum leptin levels in mice. Serum leptin levels were increased in CKD/V versus Sham/V mice. Serum leptin levels were not different in CKD/PLA versus CKD/V mice or Sham/PLA versus Sham/V mice (Table 1).
PLA treatment corrected anorexia and improved weight gain in CKD mice. Daily calorie intake was normalized in CKD/PLA (7 mg/kg per day) mice (Figure 2). Significant weight gain in CKD/PLA (7 mg/kg per day) mice relative to CKD/V mice was observed from day 7 (Figure 3). CKD/PLA (7 mg/kg per day) mice gained fat and lean mass, whereas CKD/V mice continued to lose fat and lean mass (Figure 4). Our results are consistent with other reports. Leptin antagonist attenuated the magnitude of leptin-induced weight loss, loss of fat deposition, and suppression of food intake.11,12 Accrual of lean mass in CKD/PLA mice resulted in the normalization of muscle function as assessed by grip strength and rotarod activity (Figure 5).
Basal metabolic rate comprises 50%–80% of daily energy expenditure and exhibits circadian rhythms.13,14 Disrupted circadian rhythm was documented in CKD.15,16 Basal metabolic rate is elevated in CKD, but there are concerns about the validity of these results; although basal metabolic rate is higher in CKD, the 24-hour metabolic rate may not be elevated, and actually, it may be reduced, because patients or animals with CKD are less active overall. We measured diurnal rhythm VO2 consumption in mice. Light- and dark-phase VO2 levels were significantly increased in CKD/V and CKD/Supp mice but normalized in CKD/PLA (7 mg/kg per day) mice (Figure 6).
UCPs are key regulators of energy expenditure.17 Suppression of UCPs expression by PLA treatment may, in fact, lower respiratory demands in CKD. Previously, we showed that mRNA and protein content of UCP-1 and -3 in BAT were increased in CKD mice.18 PLA treatment significantly reduced transcriptional and protein levels of BAT UCP-1, white adipose tissue UCP-2, and muscle UCP-3 in CKD mice (Figures 7 and 8).
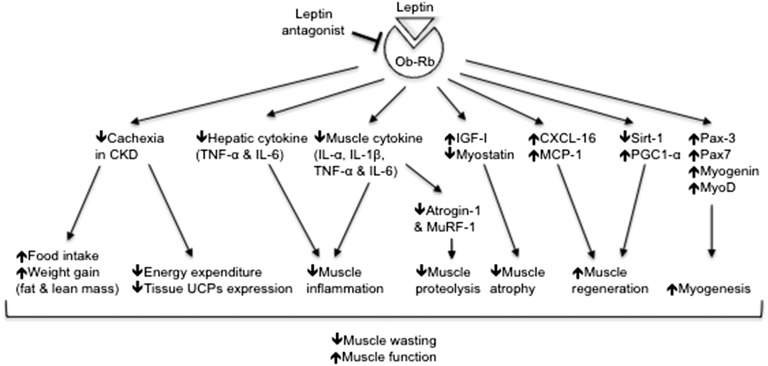
PLA treatment exerts additional metabolic advantages beyond its nutritional effects. Calorie supplementation to CKD mice could not exert the anticachectic effects. CKD/Supp mice gained less weight (Figure 3), gained fat mass (Figure 4), and continued to lose lean mass, and the muscle function remained impaired (Figure 5), despite having the same calorie intake as CKD/PLA (7 mg/kg per day) mice. Light- and dark-phase VO2 (Figure 6) as well as expression of tissue UCPs (Figures 7 and 8) were significantly higher in CKD/Supp relative to CKD/PLA (7 mg/kg per day) mice. Our results suggest that PLA treatment reverses CKD-associated cachexia through the combined effects of appetite stimulation and reduction in energy expenditure (Figure 13).
Figure 13.
Summary of the beneficial effects of PLA treatment on food intake, energy expenditure, and muscle wasting in CKD mice.
Hepatic inflammation is commonly observed in CKD. Significant elevation of hepatic TNF-α and IL-6 mRNA levels was observed in CKD/V and CKD/Supp mice (Figure 9). Our results are in agreement with a recent report, in which mRNA contents of hepatic inflammatory cytokines were elevated in bilateral nephrectomized mice.19 Hepatic TNF-α and IL-6 mRNA contents were normalized in CKD/PLA (7 mg/kg per day) mice.
IL-1 and -6 and TNF-α have been associated with muscle wasting in CKD.1,5,20 Gastrocnemius muscle protein contents of IL-1α, -1β, and -6 and TNF-α were increased in CKD/V and CKD/Supp mice (Figure 10). IL-1α and -1β increased expression of Atrogin-1 and MuRF-1 and stimulated protein catabolism in C2C12 myotubes through the AKT/Foxo (protein kinase B/forkhead box protein) signaling pathway.21 High-circulating IL-6 stimulated Atrogin-1 and MuRF-1 gene expression and promoted gastrocnemius muscle wasting in cachectic mice.22 PLA treatment caused an overall decrease in proinflammatory cytokines in CKD mice. Muscle protein contents of IL-1α and -6 were normalized, and the protein level of IL-1β was significantly reduced in CKD/PLA (7 mg/kg per day) mice. Leptin has proinflammatory effects through the induction of proinflammatory cytokines and the stimulation of macrophage and natural killer cell function.23 Leptin upregulates the IL-1 system and induces secretion of IL-6 and TNF-α through janus kinase 2/signal transducers and activators of transcription (JAK2/STAT3) and p38 mitogen-activated protein kinase/extracellular signal-regulated kinase (p38MAPK/ERK1/2) signaling pathways.24,25 Conversely, blockade of leptin signaling protects against inflammation (Figure 13).
IGF-I and myostatin play stimulatory and inhibitory roles, respectively, in the regulation of muscle mass.26 Myostatin induces muscle wasting through the AKT/Foxo (protein kinase B/forkhead box protein) pathway.27 Pharmacological inhibition of myostatin suppresses systemic inflammation and muscle atrophy in CKD.28 Leptin influences IGF-I signaling cascade by inducing the phosphorylation of IGF-IR.29,30 PLA treatment attenuated muscle wasting by correcting the imbalance between IGF-I and myostatin in CKD (Figures 11 and 13).
Atrogin-1 and MuRF-1 mediate protein degradation in skeletal muscle. Muscle atrophy is often associated with increased expression of Atrogin-1 and MuRF-1.1 Leptin regulates Atrogin-1 and MuRF-1 protein expression in gastrocnemius muscle.31 Results from this group and others showed that muscle Atrogin-1 and MuRF-1 transcriptional expressions were significantly increased in CKD mice.28,32–34 MuRF-1 mRNA contents were corrected in CKD/PLA (7 mg/kg per day) mice (Figures 12 and 13).
CXCL-16 and MCP-1 are crucial for muscle regeneration.35–37 Lower expression of CXCL-16 and MCP-1 in muscle may lead to decreased macrophage infiltration, and eventually, it impairs muscle regeneration. We and others have reported that skeletal muscle CXCL-16 and MCP-1 protein levels were significantly decreased in CKD mice (Figure 10).32,35 Muscle CXCL-16 and MCP-1 protein levels were normalized in CKD/PLA (7 mg/kg per day) mice.
Leptin could also influence muscle regeneration through Sirt-1/Foxo3a and their downstream target PGC-1α.38,39 Our results suggest that CKD is associated with changes in Sirt-1 and PGC-1α transcriptional content in skeletal muscle (Figure 12), consistent with a recent finding in which lower transcriptional level of skeletal muscle PGC-1α was observed in CKD rats.40 Skeletal muscle Sirt-1 and PGC-1α mRNA contents were normalized in CKD/PLA (7 mg/kg per day) mice.
We also measured the transcriptional levels of differentiation markers in skeletal muscle. The transcription factors Pax-3 and -7 have essential and overlapping roles in myogenesis. Pax-3 acts to specify embryonic muscle precursors, whereas Pax-7 enforces the satellite cell myogenic program while maintaining the undifferentiated state.41 Myogenic factor 5 (Myf5) is the first myogenic regulatory protein expressed in the skeletal muscle lineage. In concert with Pax-3, Myf5 activates a network of myogenic regulatory factors, including MyoD, myogenin, and myogenic factor 6 (Myf6), in the muscle precursors to initiate and maintain the expression of muscle-specific genes.41,42 The mRNA contents of Pax-3 and -7, myogenin, and MyoD were decreased in the gastrocnemius muscle of CKD mice (Figure 12), suggesting dysfunction of satellite cells and a reduced rate of myoblast differentiation in CKD. Importantly, Pax-7, myogenin, and MyoD gene expressions were normalized in CKD/PLA (7 mg/kg per day) mice, indicating that PLA is able to activate muscle satellite cell and promote myoblast differentiation (Figure 13).
In summary, results of this study show that leptin receptor antagonist improves food intake, ameliorates weight loss and lean mass loss, and normalizes muscle function as well as reduces energy expenditure in mice with CKD. PLA treatment attenuates the exacerbation of hepatic inflammation in CKD mice. PLA also causes an overall decrease in proinflammatory cytokines and ameliorates aberrant signaling pathways associated with muscle wasting in CKD (Figure 13). This PLA may represent a novel therapeutic modality for CKD-associated cachexia, in which preservation of muscle mass is associated with a survival advantage.
Concise Methods
Animals and Experimental Design
Animal protocols complied with Institutional Animal Care and Use Committee and National Institutes of Health guidelines for the care and use of laboratory animals. The experimental design is shown in Figure 1. C57BL/6J male mice were used. CKD in mice was induced by two-stage 5/6 nephrectomy. BL5040, a PLA, was prepared10 and provided by BioLine Innovations. CKD and Sham mice were given the PLA or vehicle through intraperitoneal injection. Mice were fed with LabDiet 5015. Another group of CKD mice was gavaged with additional nutrients. Oxygen consumption and carbon dioxide production were simultaneously determined by indirect Oxymax calorimetry (Columbus Instruments).7 Body composition was determined by EchoMRI-100 (Echo Medical Systems).32 Grip Strength Meter (model 47106; UGO Basile) and AccuRotor Rota Rod (model RRF/SP; Accuscan Instrument) were used to assess forelimb grip strength and motor coordination in mice, respectively.22,43
Blood Chemistry
Mice were fasted for 3 hours before euthanasia. Serum chemistry was assayed by standard laboratory methods.
Serum, Muscle Protein Levels, and Tissue Protein Levels of UCPs
Serum leptin levels were assayed (R&D Systems). Gastrocnemius muscle lysate protein levels of IL-1α, -1β, -6, and -10, IFN-γ, TNF-α, CXCL-16, and MCP-1 were quantified (RayBiotech). IGF-I and myostatin protein levels were measured (R&D Systems and Immundiagnostik AG Kits, respectively). UCPs protein contents were assayed using mouse UCP-1 (E95557Mu; Uscn Life Science), UCP-2 (E2066m; EIAab), and UCP-3 (E2068m; EIAab) Assay Kits, respectively.
mRNA Expression
Transcriptional levels of target genes were measured by real-time PCR (Applied Biosystems). Appropriate primers and probes for target genes were listed (Table 2). Comparative 2−ΔΔCt method was used to determine the relative quantification of the target gene. Final results were expressed in arbitrary units, with one unit being the mean mRNA level in the Sham/V mice.
Table 2.
Taqman Gene Expression Assays-On-Demand identities
| Genes | Assay Identities |
|---|---|
| Target genes | |
| Atrogin-1 | Mm00499523_m1 |
| IL-6 | Mm00446190_m1 |
| MuRF-1 | Mm01185221_m1 |
| MyoD | Mm00440387_m1 |
| Myogenin | Mm00446195_g1 |
| Pax-3 | Mm00435493_m1 |
| Pax-7 | Mm00834079_m1 |
| PGC-1α | Mm01208835_m1 |
| Sirt-1 | Mm00490758_m1 |
| TNF-α | Mm00443258_m1 |
| UCP-1 | Mm01244861_m1 |
| UCP-2 | Mm00627599_m1 |
| UCP-3 | Mm00494077_m1 |
| Internal control gene | |
| GAPDH | 4352339E |
GAPDH, glyceraldehyde-3-phosphate dehydrogenase.
Statistical Analyses
Results were compared using one-way ANOVA; t tests for unpaired data were used to compare results between two groups when significant differences were detected by ANOVA. P<0.05 were considered to be statistically significant.
Disclosures
None.
Acknowledgments
We thank Dr. Jianhua Shao (Department of Pediatrics, University of California, San Diego) for the use of EchoMRI-100.
This work was supported in part by funding from BioLine Innovations. W.W.C. received support from an Amgen Young Investigator Grant from the National Kidney Foundation and Satellite Healthcare Inc. W.D. was supported by an exchange program fund from Fudan University. R.H.M. received support from National Institutes of Health Grant U01 DK-3-012.
Footnotes
Published online ahead of print. Publication date available at www.jasn.org.
References
- 1.Mak RH, Ikizler AT, Kovesdy CP, Raj DS, Stenvinkel P, Kalantar-Zadeh K: Wasting in chronic kidney disease. J Cachexia Sarcopenia Muscle 2: 9–25, 2011 [DOI] [PMC free article] [PubMed] [Google Scholar]
- 2.Farooqi IS, O’Rahilly S: Leptin: A pivotal regulator of human energy homeostasis. Am J Clin Nutr 89: 980S–984S, 2009 [DOI] [PubMed] [Google Scholar]
- 3.Rayner DV, Trayhurn P: Regulation of leptin production: Sympathetic nervous system interactions. J Mol Med (Berl) 79: 8–20, 2001 [DOI] [PubMed] [Google Scholar]
- 4.Mak RH, Cheung W: Adipokines and gut hormones in end-stage renal disease. Perit Dial Int 27[Suppl 2]: S298–S302, 2007 [PubMed] [Google Scholar]
- 5.Axelsson J, Heimbürger O, Stenvinkel P: Adipose tissue and inflammation in chronic kidney disease. Contrib Nephrol 151: 165–174, 2006 [DOI] [PubMed] [Google Scholar]
- 6.Bjørbaek C, Kahn BB: Leptin signaling in the central nervous system and the periphery. Recent Prog Horm Res 59: 305–331, 2004 [DOI] [PubMed] [Google Scholar]
- 7.Cheung W, Yu PX, Little BM, Cone RD, Marks DL, Mak RH: Role of leptin and melanocortin signaling in uremia-associated cachexia. J Clin Invest 115: 1659–1665, 2005 [DOI] [PMC free article] [PubMed] [Google Scholar]
- 8.Elinav E, Niv-Spector L, Katz M, Price TO, Ali M, Yacobovitz M, Solomon G, Reicher S, Lynch JL, Halpern Z, Banks WA, Gertler A: Pegylated leptin antagonist is a potent orexigenic agent: Preparation and mechanism of activity. Endocrinology 150: 3083–3091, 2009 [DOI] [PMC free article] [PubMed] [Google Scholar]
- 9.Elinav E, Ali M, Bruck R, Brazowski E, Phillips A, Shapira Y, Katz M, Solomon G, Halpern Z, Gertler A: Competitive inhibition of leptin signaling results in amelioration of liver fibrosis through modulation of stellate cell function. Hepatology 49: 278–286, 2009 [DOI] [PubMed] [Google Scholar]
- 10.Shpilman M, Niv-Spector L, Katz M, Varol C, Solomon G, Ayalon-Soffer M, Boder E, Halpern Z, Elinav E, Gertler A: Development and characterization of high affinity leptins and leptin antagonists. J Biol Chem 286: 4429–4442, 2011 [DOI] [PMC free article] [PubMed] [Google Scholar]
- 11.Peters JH, Simasko SM, Ritter RC: Leptin analog antagonizes leptin effects on food intake and body weight but mimics leptin-induced vagal afferent activation. Endocrinology 148: 2878–2885, 2007 [DOI] [PMC free article] [PubMed] [Google Scholar]
- 12.Zhang J, Matheny MK, Tümer N, Mitchell MK, Scarpace PJ: Leptin antagonist reveals that the normalization of caloric intake and the thermic effect of food after high-fat feeding are leptin dependent. Am J Physiol Regul Integr Comp Physiol 292: R868–R874, 2007 [DOI] [PubMed] [Google Scholar]
- 13.Ravussin E, Burnand B, Schutz Y, Jéquier E: Twenty-four-hour energy expenditure and resting metabolic rate in obese, moderately obese, and control subjects. Am J Clin Nutr 35: 566–573, 1982 [DOI] [PubMed] [Google Scholar]
- 14.Rubal A, Choshniak I, Haim A: Daily rhythms of metabolic rate and body temperature of two murids from extremely different habitats. Chronobiol Int 9: 341–349, 1992 [DOI] [PubMed] [Google Scholar]
- 15.Hsu CY, Chang FC, Ng HY, Kuo CC, Lee YT, Lu CY, Lee CT: Disrupted circadian rhythm in rats with nephrectomy-induced chronic kidney disease. Life Sci 91: 127–131, 2012 [DOI] [PubMed] [Google Scholar]
- 16.Fukuda M, Mizuno M, Yamanaka T, Motokawa M, Shirasawa Y, Nishio T, Miyagi S, Yoshida A, Kimura G: Patients with renal dysfunction require a longer duration until blood pressure dips during the night. Hypertension 52: 1155–1160, 2008 [DOI] [PubMed] [Google Scholar]
- 17.Rousset S, Alves-Guerra MC, Mozo J, Miroux B, Cassard-Doulcier AM, Bouillaud F, Ricquier D: The biology of mitochondrial uncoupling proteins. Diabetes 53[Suppl 1]: S130–S135, 2004 [DOI] [PubMed] [Google Scholar]
- 18.Cheung WW, Kuo HJ, Markison S, Chen C, Foster AC, Marks DL, Mak RH: Peripheral administration of the melanocortin-4 receptor antagonist NBI-12i ameliorates uremia-associated cachexia in mice. J Am Soc Nephrol 18: 2517–2524, 2007 [DOI] [PubMed] [Google Scholar]
- 19.Park SW, Chen SWC, Kim M, Brown KM, Kolls JK, D’Agati VD, Lee HT: Cytokines induce small intestine and liver injury after renal ischemia or nephrectomy. Lab Invest 91: 63–84, 2011 [DOI] [PMC free article] [PubMed] [Google Scholar]
- 20.Avesani CM, Carrero JJ, Axelsson J, Qureshi AR, Lindholm B, Stenvinkel P: Inflammation and wasting in chronic kidney disease: Partners in crime. Kidney Int 70: S8–S13, 2006 [Google Scholar]
- 21.Li W, Moylan JS, Chambers MA, Smith J, Reid MB: Interleukin-1 stimulates catabolism in C2C12 myotubes. Am J Physiol Cell Physiol 297: C706–C714, 2009 [DOI] [PMC free article] [PubMed] [Google Scholar]
- 22.Baltgalvis KA, Berger FG, Peña MM, Davis JM, White JP, Carson JA: Muscle wasting and interleukin-6-induced atrogin-I expression in the cachectic Apc (Min/+) mouse. Pflugers Arch 457: 989–1001, 2009 [DOI] [PMC free article] [PubMed] [Google Scholar]
- 23.Fernández-Riejos P, Najib S, Santos-Alvarez J, Martín-Romero C, Pérez-Pérez A, González-Yanes C, Sánchez-Margalet V: Role of leptin in the activation of immune cells. Mediators Inflamm 2010: 568343, 2010 [DOI] [PMC free article] [PubMed] [Google Scholar]
- 24.Guo S, Gonzalez-Perez RR: Notch, IL-1 and leptin crosstalk outcome (NILCO) is critical for leptin-induced proliferation, migration and VEGF/VEGFR-2 expression in breast cancer. PLoS One 6: e21467, 2011 [DOI] [PMC free article] [PubMed] [Google Scholar]
- 25.Agrawal S, Gollapudi S, Su H, Gupta S: Leptin activates human B cells to secrete TNF-α, IL-6, and IL-10 via JAK2/STAT3 and p38MAPK/ERK1/2 signaling pathway. J Clin Immunol 31: 472–478, 2011 [DOI] [PMC free article] [PubMed] [Google Scholar]
- 26.Mak RH, Rotwein P: Myostatin and insulin-like growth factors in uremic sarcopenia: The yin and yang in muscle mass regulation. Kidney Int 70: 410–412, 2006 [DOI] [PubMed] [Google Scholar]
- 27.Elliott B, Renshaw D, Getting S, Mackenzie R: The central role of myostatin in skeletal muscle and whole body homeostasis. Acta Physiol (Oxf) 205: 324–340, 2012 [DOI] [PubMed] [Google Scholar]
- 28.Zhang L, Rajan V, Lin E, Hu Z, Han HQ, Zhou X, Song Y, Min H, Wang X, Du J, Mitch WE: Pharmacological inhibition of myostatin suppresses systemic inflammation and muscle atrophy in mice with chronic kidney disease. FASEB J 25: 1653–1663, 2011 [DOI] [PMC free article] [PubMed] [Google Scholar]
- 29.Saxena NK, Taliaferro-Smith L, Knight BB, Merlin D, Anania FA, O’Regan RM, Sharma D: Bidirectional crosstalk between leptin and insulin-like growth factor-I signaling promotes invasion and migration of breast cancer cells via transactivation of epidermal growth factor receptor. Cancer Res 68: 9712–9722, 2008 [DOI] [PMC free article] [PubMed] [Google Scholar]
- 30.Ozbay T, Nahta R: A novel unidirectional cross-talk from the insulin-like growth factor-I receptor to leptin receptor in human breast cancer cells. Mol Cancer Res 6: 1052–1058, 2008 [DOI] [PMC free article] [PubMed] [Google Scholar]
- 31.Sáinz N, Rodríguez A, Catalán V, Becerril S, Ramírez B, Gómez-Ambrosi J, Frühbeck G: Leptin administration favors muscle mass accretion by decreasing FoxO3a and increasing PGC-1alpha in ob/ob mice. PLoS One 4: e6808, 2009 [DOI] [PMC free article] [PubMed] [Google Scholar]
- 32.Cheung WW, Mak RH: Melanocortin antagonism ameliorates muscle wasting and inflammation in chronic kidney disease. Am J Physiol Renal Physiol 303: F1315–F1324, 2012 [DOI] [PMC free article] [PubMed] [Google Scholar]
- 33.Cheung WW, Rosengren S, Boyle DL, Mak RH: Modulation of melanocortin signaling ameliorates uremic cachexia. Kidney Int 74: 180–186, 2008 [DOI] [PubMed] [Google Scholar]
- 34.Hu J, Du J, Zhang L, Price SR, Klein JD, Wang XH: XIAP reduces muscle proteolysis induced by CKD. J Am Soc Nephrol 21: 1174–1183, 2010 [DOI] [PMC free article] [PubMed] [Google Scholar]
- 35.Zhang L, Ran L, Garcia GE, Wang XH, Han S, Du J, Mitch WE: Chemokine CXCL16 regulates neutrophil and macrophage infiltration into injured muscle, promoting muscle regeneration. Am J Pathol 175: 2518–2527, 2009 [DOI] [PMC free article] [PubMed] [Google Scholar]
- 36.Shireman PK, Contreras-Shannon V, Ochoa O, Karia BP, Michalek JE, McManus LM: MCP-1 deficiency causes altered inflammation with impaired skeletal muscle regeneration. J Leukoc Biol 81: 775–785, 2007 [DOI] [PubMed] [Google Scholar]
- 37.Warren GL, Hulderman T, Mishra D, Gao X, Millecchia L, O’Farrell L, Kuziel WA, Simeonova PP: Chemokine receptor CCR2 involvement in skeletal muscle regeneration. FASEB J 19: 413–415, 2005 [DOI] [PubMed] [Google Scholar]
- 38.Toledo M, Busquets S, Ametller E, López-Soriano FJ, Argilés JM: Sirtuin 1 in skeletal muscle of cachectic tumour-bearing rats: A role in impaired regeneration? J Cachexia Sarcopenia Muscle 2: 57–62, 2011 [DOI] [PMC free article] [PubMed] [Google Scholar]
- 39.Wang YZ, Huang YN, Sun KY, Qi JH, Xiang L: Leptin gene transfer regulates fibromuscular development and lipid deposition in muscles via SIRT1, FOXO3a and PGC-1α in mice in vivo. Int J Mol Med 28: 617–623, 2011 [DOI] [PubMed] [Google Scholar]
- 40.Barazzoni R, Zhu X, Deboer M, Datta R, Culler MD, Zanetti M, Guarnieri G, Marks DL: Combined effects of ghrelin and higher food intake enhance skeletal muscle mitochondrial oxidative capacity and AKT phosphorylation in rats with chronic kidney disease. Kidney Int 77: 23–28, 2010 [DOI] [PMC free article] [PubMed] [Google Scholar]
- 41.Wang YX, Rudnicki MA: Satellite cells, the engines of muscle repair. Nat Rev Mol Cell Biol 13: 127–133, 2012 [DOI] [PubMed] [Google Scholar]
- 42.Armand AS, Bourajjaj M, Martínez-Martínez S, el Azzouzi H, da Costa Martins PA, Hatzis P, Seidler T, Redondo JM, De Windt LJ: Cooperative synergy between NFAT and MyoD regulates myogenin expression and myogenesis. J Biol Chem 283: 29004–29010, 2008 [DOI] [PMC free article] [PubMed] [Google Scholar]
- 43.Bohlen M, Cameron A, Metten P, Crabbe JC, Wahlsten D: Calibration of rotational acceleration for the rotarod test of rodent motor coordination. J Neurosci Methods 178: 10–14, 2009 [DOI] [PMC free article] [PubMed] [Google Scholar]


