Abstract
Purpose
We propose a constrained optimization approach for designing parallel transmit (pTx) pulses satisfying all regulatory and hardware limits. We study the trade-offs between excitation accuracy, local and global SAR, and maximum and average power for small flip-angle pTx (8 channels) spokes pulses in the torso at 3 T and in the head at 7 T.
Methods
We compare the trade-offs between the above-mentioned quantities using the L-curve method. We use a primal-dual algorithm and a compressed set of local SAR matrices to design RF pulses satisfying all regulatory (including local SAR) and hardware constraints.
Results
Local SAR can be substantially reduced (factor of 2 or more) by explicitly constraining it in the pulse design process compared to constraining global SAR or pulse power alone. This often comes at the price of increased pulse power.
Conclusion
Simultaneous control of power and SAR is needed for the design of pTx pulses that are safe and can be played on the scanner. Constraining a single quantity can create large increase in the others, which can then rise above safety or hardware limits. Simultaneous constraint of local SAR and power is fast enough to be applicable in a clinical setting.
Keywords: Parallel transmit, local SAR, global SAR, pulse power, excitation accuracy, spokes
Introduction
The degrees-of-freedom (DOFs) provided by parallel transmit (pTx) coils can be used in the pulse design process to trade-off excitation accuracy, SAR and pulse power. Conventionally, pTx pulses are designed by rapid minimization of a cost function that is a sum of a least-squares (LS) error term between the target and achieved spatial excitation patterns (excitation accuracy) and a SAR or RF power quantity (penalty term) (1-3). The trade-off between minimization of the LS error and the penalty term is controlled by the regularization strength, or Lagrange multiplier. One way to optimize the Lagrange multiplier is to step through a range of values and plotting the excitation accuracy as a function of the SAR or power quantity penalized (L-curves) (4). Such a procedure is cumbersome however, especially when multiple quantities are penalized. On the other hand, sub-optimal choice of the regularization parameters results in sub-optimal excitation accuracy or excessive SAR or power, or both.
Another limitation of regularized pulse design approaches is their incapacity to incorporate maximum norm constraints like maximum local SAR and maximum power. Maximum norm penalties are not differentiable and need to be approximated by smooth functions in order to be used in conjunction with gradient-based optimization techniques. Lee et al. (5) and Sbrizzi et al. (4) have proposed approximating local SAR by the weighted sum of SAR at all positions in the body. This proxy for local SAR is convex and differentiable, but errors in the determination of the weights of this linear combination results in pulses that do not achieve the optimal trade-off between excitation accuracy and local SAR. Brunner et al. have proposed a method that allows rigorous control for local SAR (6), however they constrained it at only three locations in a uniform sphere and did not explore the trade-offs between excitation accuracy, transmitter power and SAR in realistic imaging situations.
We propose a pulse design framework based on a constrained optimization algorithm allowing the design of pulses with the greatest excitation accuracy consistent with multiple SAR and power hard constraints. We use this optimization method in the small flip-angle regime. We employ the virtual observation points (VOP) compression algorithm to control local SAR in the entire body in a computationally efficient manner (7). We also control global SAR and maximum power and average power on each transmit channel. Like the approach by Brunner et al. (6), our technique is based on a constrained optimization algorithm that does not depend on regularization parameters set by the user. This least-squares design approach can be used in the inner loop of a magnitude least-squares (MLS) variable-exchange pulse design strategy (8), yielding pulses that are optimized for flip-angle, phase, local SAR, global SAR, average power and maximum power. We show that this method is fast enough (less than 5 seconds on a single Intel i7 2.80 GHz CPU) to be used in a clinical setting, even when used as part of an MLS optimization strategy (less than 2 minutes in this case). Note that this pulse design approach is significantly different from ad-hoc local SAR reduction methods that do not explicitly penalize local SAR and are therefore potentially sub-optimal with respect to this metric (3,9,10).
We use this pulse design strategy to study the trade-offs between different SAR and power quantities in electromagnetic simulations of a realistic human body model at 3 T and 7 T. We observe that power and local SAR can become partially decoupled. Namely, SAR hotspots can be excessive when pulse power is constrained alone. Conversely, pulse power can become large when local and global SAR are constrained alone. This suggests that local SAR and power should be constrained simultaneously. We also observe that the trade-offs between excitation accuracy, SAR and power strongly depend on the target excitation phase.
Methods
Low-flip-angle pulse design with SAR and power constraints
At low-flip-angles, the Bloch equations can be linearized (11,12). In this regime, the transverse magnetization pattern (we note m the vector containing the values of the complex transverse magnetization at all voxel locations) created by RF pulses (concatenated in a single vector x) is given by m=Ax. The system matrix A is given by:
| (1) |
where i, j and c are spatial, time and Tx channel indices, respectively, and m0(r) and Sc(r) are the magnetization at thermal equilibrium and the complex transmit profile of coil c at position r, respectively. k(t) is the excitation k-space trajectory computed from the gradients as (T is the pulse duration). Off-resonance effects (e.g., concomitant gradient fields and B0 inhomogeneity) can be incorporated in the system matrix (12). For “spokes” pulses (13,14) with the same basic kz profile, the matrix A can be modified so as to incorporate this common factor so that x only contains the spokes amplitude (magnitude and phase) played on every channel.
The specific absorption rate (SAR) of pTx spokes pulse at location r is (1,15):
| (2) |
Where σ(r) and ρ(r) are the conductivity and density at location r, N is the total number of samples in the pulse of length TR (including the data acquisition module and imaging gradients), Ns is the number of samples of the basic sinc profile shared by all spokes, S is the number of spokes and xs is the vertical concatenation of the complex-valued amplitudes played on all channels for spoke s. The division by N in Eq. [2] accounts for the duty-cycle of the pulse. In this equation, Q(r) is a positive semi-definite matrix of size C×C, where C is the number of channels, obtained from the knowledge of each channel’s electric field map (15,16). It is common to re-define Q(r) to incorporate all the factors in Eq. [2] which are independent of the RF pulse to yield a simpler expression for the SAR at location r: . These re-defined Q(r) matrices also include 10-gram averaging (4,15).
Low flip-angle spokes pulses can be designed while controlling local and global SAR as well as average and maximum power on every channel by solving the following optimization problem:
| (3) |
where b is the target transverse magnetization pattern, Q(r) is the local SAR matrix for position r, ⟨Q⟩ is the global SAR matrix, lSAR and gSAR are the local and global SAR regulatory limits, Z0 is the reference impedance of the coil and Pav. and Ppeak are the average and peak power limits on each channel. The source is assumed to be an ideal voltage source V with a Z0=50Ω internal resistance outputting power into the coil, which is represented by the load ZL. The factor of 8 in the relation P =V2/8Z0 is due to the fact that, when the load ZL is power-matched to the voltage source, the voltage across the port of the coil is V/2. The constraints a) to d) constrain local SAR, global SAR, peak power and average power in this order. This optimization problem is convex because the function to be minimized is convex and the constraints define a convex set (all SAR matrices are positive semi-definite).
VOP compression of the SAR matrices
Eq. [3] is a large optimization problem because typical human body models contain hundreds of thousands of voxels where local SAR needs to be constrained. Since B1+ maps must be acquired for every patient, this optimization must be performed with the subject in the scanner. It is therefore crucial to reduce computation time to a minimum, ideally less than a minute. We reduce the number of local SAR constraints in Eq. [3] by compressing the SAR matrices at all locations in the body to a much smaller set of virtual observation points (VOPs) using the algorithm described in (5,7). In short, this algorithm clusters the SAR matrices Q(r) and assigns a VOP to every cluster so that (i) the VOP of a cluster dominates (in the positive semi-definite sense) all the SAR matrices in this cluster and (ii) the overestimation of the maximum local SAR in each cluster is smaller than a user-defined limit. These properties guarantee that the VOP compression gives safe estimates of local SAR and allow the user to control the trade-off between the SAR overestimation and the number of VOPs. Then, in Eq. [3], we replace condition a) at each voxel ( ∀ r ) with a similar condition on every VOP:
| (4) |
Where V is the number of VOPs and {Sv}v=1…V denotes the set of VOPs.
In this work, we use the VOP compression variant of Eichfelder and Gebhardt in which the SAR overestimation factor is expressed as a percentage of the worst possible local SAR for a pulse vector of unit norm (7). Another construction, which we do not use, is to express the compression overestimation factor as a percentage of global SAR (5). All SAR values reported in this paper are computed using the original Q(r) matrices and not the VOPs (the VOPs are used to control local SAR in the pulse design, but we compute the actual local SAR map of every pulse using the Q(r) matrices in every voxel of the body model). We report SAR values for a duty-cycle of 10%.
PTx pulse design using a primal-dual constrained optimization algorithm
We use a primal-dual interior point algorithm to solve the optimization problem of Eq. [3]. Primal-dual methods can be derived by rewriting the Karush-Kuhn-Tucker (KKT) optimality conditions by relaxing the complementary slackness condition by a factor t (17) (pp. 577). The vector of unknown x (i.e. the RF pulse) and the Lagrange multipliers associated with the constraints are estimated iteratively by decreasing this relaxation factor as the algorithm progresses. New estimates for x and the Lagrange multipliers are computed at every primal-dual iteration using a Newton step. The Hessian of this Newton problem has a diagonal lower-right block (17) (pp. 610), therefore we invert it efficiently using a Schur complement elimination approach.
As the primal-dual algorithm progresses, the relaxation factor t decreases and the solution estimate converges to the optimal solution of Eq. [3] following a trajectory in the state space called “central path” (17) (pp. 612). This relaxation parameter must decrease as fast as possible to minimize computation time but not too fast in order to ensure convergence of the algorithm. In the notation of Boyd and Vandenberghe (17) (pp. 612) it is usually set to where is the surrogate duality gap at the current iteration, μ ≈ 10 and Nc is the number of constraints. For our specific problem, we found that using μ = μmin (μmax/μmin)α where α is the step size at the previous iteration (between 0 and 1), μmin=1 and μmax=10 significantly reduced the total number of iterations compared to using a fixed value of μ. Indeed, this expression of μ forces the algorithm to take conservative steps when many constraints are active (small step size) but to advance quickly when no constraints are active (step size close to 1). We implemented this primal-dual strategy in C++ using optimized linear algebra libraries (18,19) for maximum performance.
Choice of the target phase
The optimization problem of Eq. [3] attempts to create an excitation profile with a specified magnitude and phase. A simple choice of the target phase is a uniform distribution. Flat target phase profiles are widely used but ignore unavoidable propagation delays between the electromagnetic waves created by the different Tx channels. Since the image phase is rarely of interest in MR imaging, a better strategy consists in choosing a target phase that is easier to achieve, or to optimize only the magnitude of the excitation profile. This latter magnitude least-squares (MLS) strategy was shown to dramatically improve the uniformity of flip-angle maps of spokes pTx excitations (8), at the expense of greater computation time and loss of convexity of the pulse design problem.
In this work, we evaluate the trade-offs between global and local SAR, power and excitation accuracy when using a uniform target phase, a target phase that matches the phase distribution of the uniform birdcage mode of the pTx array, the MLS method, and finally an approximation of the MLS method whereby a pulse is first designed using MLS and the resulting phase distribution is used as the target phase in a least-squares design strategy. This latter strategy allows fast generation of L-curves (all pulses of the L-curve use the same MLS target phase), is based on a convex least-squares design strategy and takes advantage of the improved excitation quality of MLS pulses.
Evaluation in electromagnetic simulations
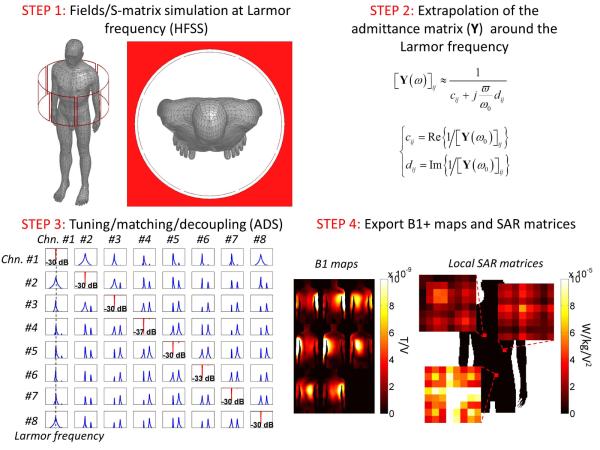
We simulate spokes pulses played on two 8-channels pTx coils for head imaging at 7 T and body imaging at 3 T. We compute the electric and magnetic fields created by these arrays using a co-simulation strategy based on the field solver HFSS (Ansys, Canonsburg PA) and the circuit simulator ADS (Agilent, Santa Clara CA) (20-22). PTx coils are loaded with the Ansys adult male body model (33 tissue types, 1 mm resolution). Coupling between transmit elements is modeled by simulating all Tx channels simultaneously. Sources and lumped elements are replaced by lumped ports in the HFSS simulation. Fields and S-parameters are computed for all ports (including the lumped element ports) at the Larmor frequency (123.2 MHz at 3 T and 297 MHz at 7 T). In order to visualize tuning curves, the S-matrix is extrapolated in a 50 MHz range around the Larmor frequency by assuming that the structure coil/patient/shield has a purely inductive behavior (see Fig. 1) (23).
Figure 1.
Flow chart of the co-simulation process for simulation of coupled pTx arrays. In step 2, the admittance matrix Y of the coupled transmit array is extrapolated around the Larmor frequency by assuming that its frequency dependence is purely inductive (cij and dij are the real and imaginary parts of the inverse of the elements of the admittance matrix at the Larmor frequency).
The extrapolated S-matrix is then loaded in ADS and capacitors and voltage sources are reinstated as shown in Fig. 1. Capacitors are optimized so as to tune (to the Larmor frequency), match (better than −30 dB) and decouple the transmit channels (better than −15 dB) using the gradient optimization routine of ADS. This separation of the field simulation and the optimization of capacitor values allows modeling a large number of tuning/matching/decoupling conditions without having to simulate the coil every time a capacitor value is changed (20). Capacitor values are finally transformed into power scaling values which are used to scale the fields associated to the corresponding ports (20). Electric and magnetic fields created by the Tx channels are finally obtained by summation of the fields associated with each lumped element port.
For the body simulation at 3 T, we export the B1+ maps and electric fields on a 80×120×200, 5 mm isotropic image grid. The model contains 426,412 non-zero voxels (and thus 426,412 SAR matrices). We use the VOP compression algorithm with SAR overestimation factors equal to 1%, 1.4% and 2% of the worst possible local SAR, yielding 1289, 689, and 401 VOPs, respectively. Pulses are optimized to generate uniform flip-angle distributions within an axial slice (80×120 grid size) passing though the liver and containing 2,448 non-zero pixels. In the simulation of the head at 7 T, there are 92,572 non-zero voxels compressed into 484 VOPs (SAR overestimation of 5% of the worst possible local SAR). B1+ maps are exported on a 100×100 grid (4 mm isotropic resolution) with 1,816 non-zero pixels.
Spokes locations, excitation error and power
We design pulses with spokes at fixed locations in the (kx,ky) plane. In the torso simulation at 3 T, spokes are placed at (0;0), (3 m−1;3 m−1) and (−3 m−1;3 m−1) for RF-shimming, 2-spoke and 3-spoke pulses, respectively. In the 7 T head simulations, they are placed at (0;0), (4.7 m−1;6.3 m−1) and (−3 m−1;−3 m−1) for RF-shimming, 2-spokes and 3-spoke pulses, respectively (the 2-spoke pulse had the same first spoke as RF-shimming and the 3-spoke pulse had the same two first spokes as the 2-spoke pulse). All spokes share the same sinc profile (3 lobes, 0.8 ms second duration). Pulses are designed for a nominal flip-angle of 40 degrees and a duty-cycle of 10%. The design of 40 degrees pulses using the linear approximation to Bloch equations (Eq. [1]) introduces a systematic error in all flip-angle maps. To correct for this systematic deviation, we design all pulses with a target flip-angle slightly greater (45 degrees) than the desired excitation flip-angle (40 degrees). This flip-angle correction factor was determined by direct comparison of the Bloch equations and their linear approximation.
After computation of a pulse, its excitation profile is computed using the full Bloch equations and not their simpler, linear approximation (Eq. [1]). To quantify the quality of an excitation profile, we report the root mean square error (RMSE) of the flip-angle map, expressed in percent of the target flip-angle. This metric does not depend on the excitation phase profile, which is usually not of interest in MR imaging (note that the least-squares excitation accuracy metric, unlike the MLS optimization metric, does depend on the excitation phase however).
Finally, we characterize the power demands of a pTx pulse using the total forward power metric, or transmitter power. Total forward power is computed as the square of the voltage amplitude played on each Tx channel divided by 8 times the reference impedance (Z0=50 Ω). Note that this definition of power does not take into account the power angle between the different amplifiers drives and therefore does not reflect the amount of power actually transmitted in the patient (which is closely related to global SAR). Instead, it is a measure of the size of the amplifiers.
Results
Pulse design algorithm performance
Fig. 2 shows the performance of our primal-dual algorithm as a function of the number of spokes and VOPs for the design of a uniform slice passing through the liver (body simulation at 3 T). The number of Newton iterations remains relatively constant even as the number of VOPs and spokes increases, indicating that our tuning of the primal-dual relaxation parameter is appropriate. Total solve time is below 5 seconds on a single CPU (Intel i7 2.80 GHz) for the design of up to 11 spokes subject to more than 1,300 VOP and power constraints. This is fast enough to be applicable in a clinical environment, even when used in conjunction with an MLS optimization approach (~20 least-squares optimizations are typically performed per MLS pulse, which yields a computation time smaller than 2 minutes). Fig. 2C shows that the per-iteration computation time is equally distributed between calculation and inversion of the Hessian and calculation of the step size, which indicates that the algorithm does not have obvious computational bottlenecks.
Figure 2.

Performance of the primal-dual algorithm for designing pulses with up to 11 spokes and up to 1289 local SAR constraints (VOPs). Figure 2C was obtained using the VOP set containing 1289 VOPs. Panels A, B and C show the number of iterations, total solve time and solve time per iteration as a function of the number of spokes and VOPs. All spokes pulses are designed while enforcing local SAR, global SAR, maximum and average power to be below 8 W/kg, 4 W/kg, 5000 W/channel and 500 W/channel, respectively.
Choice of the target phase
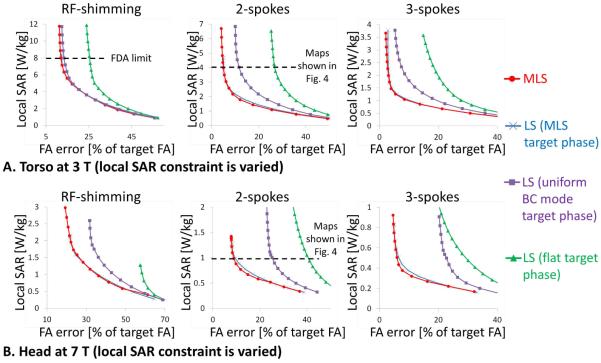
Fig. 3 shows L-curves for different target phase approaches obtained by varying the local SAR constraint (all other constraints are fixed to realistic values). MLS pulses achieve the best tradeoff between local SAR and excitation accuracy. An almost equivalent strategy consists in designing least-squares pulses using a phase target computed using MLS for a single value of the constraints (the same target phase is used for all pulses of the L-curve). The fact that the MLS and this “LS (MLS target phase)” strategies are almost equivalent show that the MLS phase does not vary significantly as the local SAR constraint is changed. We therefore use the latter strategy in the rest of this paper.
Figure 3.
Trade-off between local SAR and excitation accuracy for different target phases. A: In the torso at 3 T. B: In the head at 7 T. L-curves are obtained by varying the local SAR constraint. All other constraints are set to fixed values. In the torso, global SAR, maximum power and average power constraints are set 4 W/kg, 5 kW/ch. and 500 W/ch., respectively. In the head, these are set to 3 W/kg, 1 kW/ch. and 100 W/ch., respectively. The “LS (MLS target phase)” pulse design strategy consists in using the phase of a single MLS pulse as the target phase for all pulses of the L-curve. The strategy “LS (uniform BC mode target phase)” uses the phase of the uniform birdcage mode of the pTx array as the target phase. These L-curves show that the local SAR/excitation accuracy tradeoff is strongly affected by the target phase. A uniform target should be avoided and a more natural phase distribution should be used instead, like the phase of the uniform BC mode of the array. The best design strategy for reducing both local SAR and the excitation error is MLS. The horizontal lines indicate the FDA limits (these are not always in the range of the y-axis).
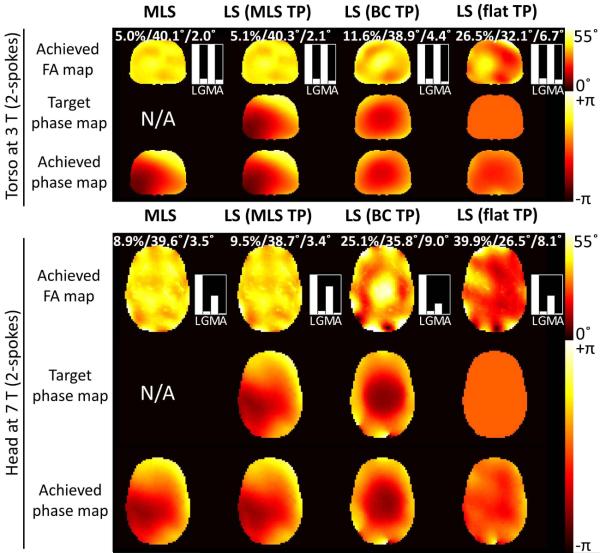
The “LS (flat target phase)” strategy yields the poorest performance both in the torso and the head simulations. Note that the use of a flat target phase not only increases the excitation error compared to MLS, it also tends to increase local SAR. An intermediate strategy between MLS and the use of a flat target phase consists in using the phase of the uniform birdcage mode of the pTx array as the least-squares target phase. As can be seen in Fig. 4 (head results), this strategy can potentially introduce artifacts in the flip-angle map when rapid phase variations are present in the uniform birdcage mode profile due to the close proximity of the coil however. The bar graphs in Fig. 4 indicate that both local SAR and peak power constraints are active in the torso at 3 T but that only local SAR is binding in the head at 7 T.
Figure 4.
Flip-angle and phase maps obtained with design strategies handling the phase differently (2-spoke pulses in the head at 7 T and in the torso at 3 T). TP stands for target phase. The bar graphs on the right side of the maps indicate how far from their limits the constraints are (“L” is for local SAR, “G” is for global SAR, “M” for maximum power and “A” for average power). The three numbers above the flip-angle maps indicate the RMSE (in percent of the target flip-angle, which is 40°), mean and standard deviation of the flip-angle distribution. In the torso, the constraints are set to 4 W/kg (local SAR), 4 W/kg (global SAR), 5 kW/ch. (peak power) and 500 W/ch. (average power). In the head, these constraints are set to 1 W/kg, 3 W/kg, 1 kW/ch. and 100 W/ch. Black represents “don’t care” regions that are not taken into account in the pulse design.
Effect of constraining a single power or SAR quantity
In this section, we study the effect of constraining only one SAR or power metric on the trade-offs between all the SAR/power/excitation accuracy quantities.
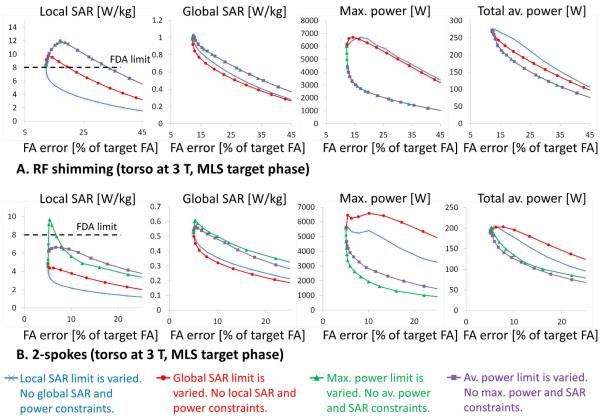
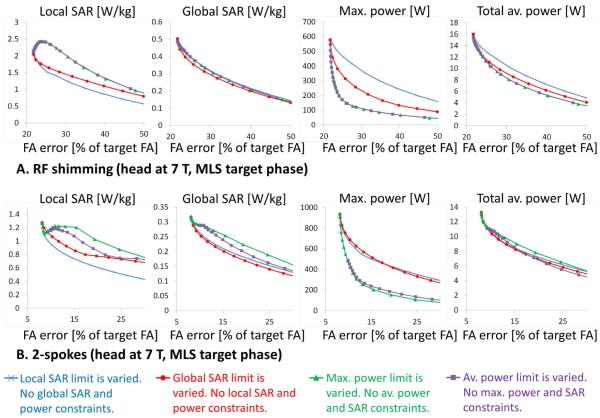
Fig. 5 and 6 show power/SAR/excitation accuracy trade-offs for pulses designed with an MLS target phase (this is the “LS (MLS target phase)” method evaluated in the previous section) while varying a single power or SAR constraint at a time. This comparison is performed for RF-shimming and 2-spoke pulses in the torso at 3 T and the head at 7 T. As expected, local SAR and global SAR control yields pulses achieving the best trade-off between SAR and excitation accuracy. Control of local SAR achieves almost optimal control of global SAR. The converse is not true however, i.e. control of global SAR alone yields pulses with a local SAR significantly greater than when constraining local SAR explicitly. Pulses designed with explicit SAR control (either local or global) require more input power than pulses that explicitly control power. This indicates that SAR (local and/or global) and power (average and/or maximum) should be controlled simultaneously.
Figure 5.
Effect of controlling a single SAR or power metric on all SAR, power and excitation accuracy quantities for RF-shimming and 2-spokes pulses in the torso at 3 T. The target phase of the least-square pulse design is the phase of a single MLS pulse (the same target phase is used for all pulses of the L-curve). The MLS target phase is the same for all pulses in A but is different for pulses in A and B. L-curves are obtained by varying a single constraint at a time (other quantities are not constrained). For example, red L-curves are obtained by varying the global SAR limit and setting the local SAR, maximum power and average power constraint limits to very large values. This shows the effect of constraining global SAR alone on global SAR, local SAR, maximum power and average power. The horizontal lines indicate the FDA limits (these are not always in the range of the y-axis).
Figure 6.
Effect of controlling a single SAR or power metric on all SAR, power and excitation accuracy quantities for RF-shimming and 2-spokes pulses in the head at 7 T. The target phase of the least-square pulse design is the phase of a single MLS pulse (the same target phase is used for all pulses of the L-curve). The MLS target phase is the same for all pulses in A but is different for pulses in A and B. L-curves are obtained by varying a single constraint at a time (other quantities are not constrained). The horizontal lines indicate the FDA limits (these are not always in the range of the y-axis).
SAR and power values are much smaller in the head at 7 T than in the torso at 3 T (a x5 increase of B1+ sensitivity decreases power demands by x25), so that absence of local SAR control is much less of a problem in this case. Still, designing pulses in the head at 7 T while constraining power alone yields pulses with significantly greater local SAR than when controlling local SAR explicitly.
Supplemental material Fig. S1 and S2 show the trade-offs depicted in Fig. 5 and 6 but using a flat phase target. These pulses have higher SAR values and poorer excitation accuracies than those obtained with the “LS (MLS target phase)” approach.
Effect of simultaneously constraining two SAR/power quantities
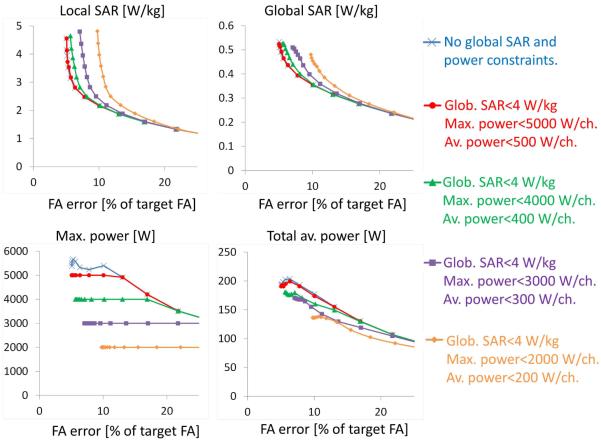
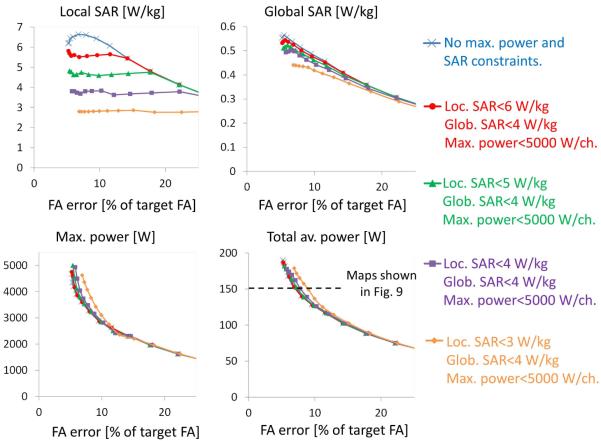
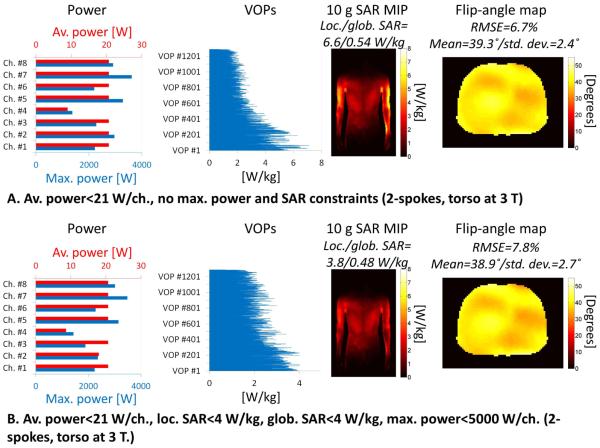
Fig. 7 is obtained by continuously varying the local SAR constraint and setting the power limits to different levels and the global SAR limit to 4 W/kg. Conversely, Fig. 8 is obtained by continuously varying the average power constraint and setting the local SAR limit to different safety levels. All pulses are designed using a least-squares strategy with a single MLS target phase. Fig. 7 shows that reduction of the input power decreases the ability of the pulse design algorithm to produce quality excitations at low local SAR. This is consistent with the observation from Fig. 5 and 6 that more input power is usually needed to reduce local SAR. Additionally, Fig. 9 underscores the point that adding multiple constraints to the pulse design problem can significantly reduce both local and global SAR (by 42% and 11%, respectively) compared to using a single power constraint, while still producing high quality excitations.
Figure 7.
Power/SAR/excitation accuracy trade-offs obtained by varying the local SAR limit and by turning on the power constraints (2-spoke pulses in the torso at 3 T). All pulses are designed using a least-square design strategy using the phase of a single MLS pulse as the target phase (the same target phase is used for all the pulses in this figure). Note that increasing input power from low (orange L-curves) to high levels (red L-curves) allows the pulse design algorithm to more effectively cancel local SAR hotspots while producing uniform excitations.
Figure 8.
Power/SAR/excitation accuracy trade-offs obtained by varying the average power limit and by turning on the local SAR constraint (2-spokes pulses in the torso at 3 T). All pulses are designed using a least-square design strategy using the phase of a single MLS pulse as the target phase (the same target phase is used for all the pulses in this figure). In this case, moving from conservative local SAR constraints (orange L-curves) to more liberal local SAR constraints (red L-curves) has little effect on pulse power and excitation accuracy.
Figure 9.
Detailed data for two of the pulses of Fig. 8. A: Power, local SAR and flip-angle map of a pulse obtained by constraining average power alone. B: Power, local SAR and flip-angle map of a pulse obtained by simultaneously constraining average power (to the same level as in A), maximum power, local SAR and global SAR. Pulses A and B use the same average power limit. Note that local SAR can be reduced by a factor of ~2 without using more power and without sacrificing the excitation quality.
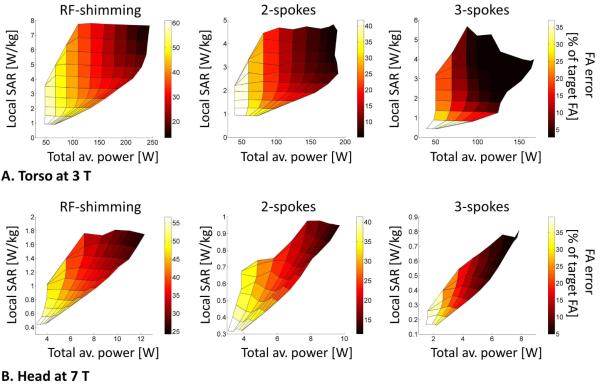
Fig. 10 shows L-surfaces obtained by varying the average power and local SAR constraints simultaneously when designing 1, 2 and 3-spoke pulses both in the head at 7 T and the torso at 3 T (pulses are designed using the “LS (MLS target phase)” strategy). If average power and local SAR were equivalent constraints, specifying one would determine the other. Instead, there exists a fairly large range of local SAR values consistent with a fixed value of the input power (conversely, there is a large range of power values consistent with a fixed value of local SAR). Local SAR and average power constraints appear to be more decoupled in the torso than in the head. This is due to the greater complexity of the electric fields patterns in the torso, which increases the possibility of creating local SAR hotspots even at relatively low power levels. In the head, the electric fields are much more uniform, therefore the potential for local SAR hotspots is reduced and controlling average power does a better job at controlling local SAR. This observation is also reflected in the higher SAR values in the torso than in the head as shown in Fig. 5 and 6. S
Figure 10.
Excitation accuracy (RMSE in percent of the target flip-angle) as a function of local SAR and average pulse power. A: In the torso at 3 T. B: In the head at 7 T. Vertical cuts through these L-surfaces (constant power) correspond to the L-curves of Fig. 7. Horizontal cuts (constant local SAR) correspond to the L-curves of Fig. 8. These L-surfaces show that there is a large range of local SAR values consistent with a given average power value. Conversely, the same local SAR value can be achieved at many different power levels. Together with the results of Fig. 5 and 6, this supports a picture in which local SAR can act in a manner relatively independent from pulse power. For this reason, local SAR and power should be constrained simultaneously.
Supplemental material Fig. S4 shows the excitation accuracy as a function of both local SAR and global SAR for 1, 2 and 3-spoke pulses in the head at 7 T and the torso at 3 T. These L-surfaces show that global SAR and local SAR are much more coupled than average power and local SAR.
Discussion
We have presented a strategy for designing small flip-angle spokes pulses with explicit control of local SAR, global SAR, maximum power and average power on every channel. This pulse design approach is based on a primal-dual constrained optimization algorithm that guarantees the SAR and power quantities to be below regulatory and system limits. This is in contrast with regularized pulse design that trade-off pulse fidelity with a single SAR or power quantity by adjustment of a regularization parameter. Such approaches do not typically guarantee that the SAR or power quantity being regularized is below the tolerated limit without exhaustive exploration of the parameter space (L-curve), which becomes increasingly burdensome as multiple constraints are added (L-surface).
Ideally, excitation pulses should be designed that yield the best excitation profile while satisfying all system (power) and regulatory constraints (SAR). If one of these constraints is not satisfied, the resulting pulse cannot be played on the scanner no matter how good its excitation profile is. On the other hand, excessive emphasis on a single regularization term could produce a pulse that satisfies all constraints but “over-achieve” the heavily regularized metric. This is sub-optimal as optimal relaxation of this regularization parameter could produce higher quality excitations. The constrained optimization approach that we propose allows explicit enforcement of hard limits for local SAR, global SAR, maximum and average power. It is similar to the algorithm of Brunner et al. (6) however we use it in conjunction with a local SAR matrices compression algorithm (7) that allows control of local SAR in complex, realistic body models. This allows us to explore the trade-offs between pulse fidelity, SAR and transmitter power in realistic imaging situations (head at 7 T and torso at 3 T).
A primary conclusion of this study is that, for the low flip-angle pulses studied in this work, it is possible to enforce all major SAR and power constraints to realistic levels without significant degradation of the excitation quality. For example, controlling all SAR and power metrics in a 2-spoke pulse in the torso at 3 T reduced local and global SAR by 42% and 11% respectively while only increasing the excitation RMSE from 6.7% to 7.8% compared to when controlling average power alone. This is because the pTx degrees-of-freedom (DOFs) can be used both to improve the excitation profile and to decrease SAR by cancellation of the electric fields created by the transmit channels at crucial locations in the body using the VOPs. If local SAR is always the binding constraint, as it appears to be for the pulses studied in the head at 7 T, then only implementing this constraint is sufficient. Our approach allows control of all SAR and power quantities in less than 5 seconds (less than 2 minutes for MLS pulses on a single Intel I7 2.80 GHz CPU), which protects the user from designing un-playable pulses in cases where this result does not extrapolate to other pulses and duty-cycles.
Another conclusion of this work is that the intuitive broad correspondence assumed between SAR and power is lost in pTx pulses. Specifically, controlling local SAR usually requires more input power compared to when designing pulses with a single power constraint. This indicates that local SAR control should be accompanied by some form of power control in order to avoid large increase in power consumption yielding only a negligible reduction of local SAR or the excitation error. Conversely, controlling only average or maximum power yields pulses with systematically greater local SAR compared to when explicitly controlling this quantity. This, again, indicates that power should be controlled in conjunction with SAR. The idea that more power is needed to decrease SAR can appear counterintuitive. Note that there is an important difference between “transmitted power”, which is closely related to global SAR, and “transmitter power”, which is related to the size of the amplifiers. Transmitter power, or equivalently total forward power, is computed independently of the power angle between the different Tx amplifiers and corresponds to the maximum possible power that would be transmitted to the object if all amplifiers were driven with the same phase. The difference between transmitter power and the power actually transmitted to the patient (transmitted power is only slightly greater than the power absorbed in the patient, which is related to global SAR, because radiated power and coil losses are usually small (22)) is deflected by circulators and burnt in dummy loads.
We observed that controlling global SAR alone yields reasonable (although sub-optimal) control of local SAR. This is an important observation given the simplicity of controlling global SAR compared to local SAR. In the absence of a local SAR control procedure, one may therefore design a pulse using global SAR and power constraints and check a posteriori whether the local SAR that it produces satisfies the legal limit.
Finally, we have shown that the choice of the target phase pattern significantly affects the power/SAR/excitation accuracy trade-offs of spoke pulses. It was already shown by Setsompop et al (8) that optimization of the magnitude of the excitation profile dramatically improves the quality of flip-angle maps compared to when optimizing both its magnitude and phase. The present work shows that adequate choice of the target phase not only improves the excitation quality but also allows reduction of local and global SAR. This is because the pTx degrees-of-freedom (DOFs) can be used both for improvement of the excitation quality and for reduction of local and global SAR. Using an appropriate target phase effectively “frees” excitation DOFs which can then be used to improve the excitation error and/or decrease SAR.
Conclusion
We propose a pulse design algorithm allowing the design of small flip-angle pTx spoke pulses with explicit control for local SAR, global SAR, maximum and average power on each channel. Our approach is based on a fast primal-dual interior point constrained optimization algorithm, which, unlike regularized pulse design strategies, explicitly enforces SAR and power hard limits without requiring user intervention. Control for local SAR is achieved using a virtual observation points (VOPs) compression of the SAR matrices, which allows designing complex pTx pulses with explicit SAR control in clinically relevant computation times. We show that the use of target phases obtained using magnitude least-squares (MLS) yields a significantly improved SAR/excitation accuracy trade-off compared to when using flat or birdcage-like phase targets. Both in the head at 7 T and the torso at 3 T, we find that controlling a single SAR or power metric does not allow control of the other SAR and power quantities. Local SAR and power should therefore be controlled simultaneously. This is especially true at low excitation errors where SAR and power tend to increase very rapidly with improving excitation accuracy.
Supplementary Material
Figure S1. Effect of controlling a single SAR or power metric on all SAR, power and excitation accuracy quantities for RF-shimming and 2-spokes pulses in the torso at 3 T. Pulses are designed using a least-square design strategy with a flat target phase. L-curves are obtained by varying a single constraint at a time (other quantities are not constrained). For example, red L-curves are obtained by varying the global SAR limit and setting the local SAR, maximum power and average power constraint limits to very large values. This shows the effect of constraining global SAR alone on global SAR, local SAR, maximum power and average power. The horizontal lines indicate the FDA limits (these are not always in the range of the y-axis).
Figure S2. Effect of controlling a single SAR or power metric on all SAR, power and excitation accuracy quantities for RF-shimming and 2-spokes pulses in the head at 7 T. Pulses are designed using a least-square design strategy with a flat target phase. L-curves are obtained by varying a single constraint at a time (other quantities are not constrained).
Figure S3. L-curves corresponding to horizontal cuts (constant local SAR) through the L-surfaces of Fig. 10.
Figure S4. Excitation accuracy (RMSE in percent of the target flip-angle) as a function of local SAR and global SAR. A: In the torso at 3 T. B: In the head at 7 T. Horizontal cuts (constant local SAR) through these L-surfaces are shown in Fig. S5. These L-surfaces show that the range of local SAR values consistent with a fixed value of global SAR is much smaller than the range of local SAR values consistent with a fixed value of average power (Fig. 10). This indicates that global SAR is a much better proxy for local SAR than average power.
Figure S5. L-curves corresponding to horizontal cuts (constant local SAR) through the L-surfaces of Fig. S4.
Acknowledgements
The authors would like to acknowledge the NIH (grants R01EB-0068547, R01EB-007942 and P41EB-015896) and the Siemens-MIT Alliance MKI Support for funding.
References
- 1.Zhu Y. Parallel excitation with an array of transmit coils. Magnetic Resonance in Medicine. 2004;51(4):775–784. doi: 10.1002/mrm.20011. [DOI] [PubMed] [Google Scholar]
- 2.Setsompop K, Wald LL, Alagappan V, Gagoski B, Hebrank F, Fontius U, Schmitt F, Adalsteinsson E. Parallel RF transmission with eight channels at 3 Tesla. Magnetic Resonance in Medicine. 2006;56(5):1163–1171. doi: 10.1002/mrm.21042. [DOI] [PubMed] [Google Scholar]
- 3.Cloos MA, Luong M, Ferrand G, Amadon A, Le Bihan D, Boulant N. Local SAR reduction in parallel excitation based on channel dependent Tikhonov parameters. Journal of Magnetic Resonance Imaging. 2010;32(5):1209–1216. doi: 10.1002/jmri.22346. [DOI] [PubMed] [Google Scholar]
- 4.Sbrizzi A, Hoogduin H, Lagendijk JJ, Luijten P, Sleijpen GLG, van den Berg CAT. Fast design of local N-gram-specific absorption rate–optimized radiofrequency pulses for parallel transmit systems. Magnetic Resonance in Medicine. 2012;67(3):824–834. doi: 10.1002/mrm.23049. [DOI] [PubMed] [Google Scholar]
- 5.Lee J, Gebhardt M, Wald LL, Adalsteinsson E. Local SAR in parallel transmission pulse design. Magnetic Resonance in Medicine. 2012;67(6):1566–1578. doi: 10.1002/mrm.23140. [DOI] [PMC free article] [PubMed] [Google Scholar]
- 6.Brunner DO, Pruessmann KP. Optimal design of multiple channel RF pulses under strict power and SAR constraints. Magnetic Resonance in Medicine. 2010;63(5):1280–1291. doi: 10.1002/mrm.22330. [DOI] [PubMed] [Google Scholar]
- 7.Eichfelder G, Gebhardt M. Local specific absorption rate control for parallel transmission by virtual observation points. Magnetic Resonance in Medicine. 2011;66(5):1468–1476. doi: 10.1002/mrm.22927. [DOI] [PubMed] [Google Scholar]
- 8.Setsompop K, Wald L, Alagappan V, Gagoski B, Adalsteinsson E. Magnitude least squares optimization for parallel radio frequency excitation design demonstrated at 7 Tesla with eight channels. Magnetic Resonance in Medicine. 2008;59(4):908–915. doi: 10.1002/mrm.21513. [DOI] [PMC free article] [PubMed] [Google Scholar]
- 9.Homann H, Graesslin I, Nehrke K, Findeklee C, Dössel O, Börnert P. Specific absorption rate reduction in parallel transmission by k-space adaptive radiofrequency pulse design. Magnetic Resonance in Medicine. 2010;65(2):350–357. doi: 10.1002/mrm.22663. [DOI] [PubMed] [Google Scholar]
- 10.van den Bergen B, Van den Berg CAT, Bartels LW, Lagendijk JJW. 7 T body MRI: B1 shimming with simultaneous SAR reduction. Physics in medicine and biology. 2007;52(17):5429. doi: 10.1088/0031-9155/52/17/022. [DOI] [PubMed] [Google Scholar]
- 11.Pauly J, Nishimura D, Macovski A. A k-space analysis of small-tip-angle excitation. Journal of Magnetic Resonance (1969) 1989;81(1):43–56. doi: 10.1016/j.jmr.2011.09.023. [DOI] [PubMed] [Google Scholar]
- 12.Grissom W, Yip C, Zhang Z, Stenger VA, Fessler JA, Noll DC. Spatial domain method for the design of RF pulses in multicoil parallel excitation. Magnetic Resonance in Medicine. 2006;56(3):620–629. doi: 10.1002/mrm.20978. [DOI] [PubMed] [Google Scholar]
- 13.Saekho S, Yip C, Noll DC, Boada FE, Stenger VA. Fast kz three-dimensional tailored radiofrequency pulse for reduced B1 inhomogeneity. Magnetic Resonance in Medicine. 2006;55(4):719–724. doi: 10.1002/mrm.20840. [DOI] [PMC free article] [PubMed] [Google Scholar]
- 14.Setsompop K, Alagappan V, Gagoski B, Witzel T, Polimeni J, Potthast A, Hebrank F, Fontius U, Schmitt F, Wald LL. Slice selective RF pulses for in vivo B 1+ inhomogeneity mitigation at 7 tesla using parallel RF excitation with a 16 element coil. Magnetic Resonance in Medicine. 2008;60(6):1422–1432. doi: 10.1002/mrm.21739. [DOI] [PMC free article] [PubMed] [Google Scholar]
- 15.Das SK, Clegg ST, Samulski TV. Computational techniques for fast hyperthermia temperature optimization. Medical Physics. 1999;26:319. doi: 10.1118/1.598519. [DOI] [PubMed] [Google Scholar]
- 16.Wu X, Akgün C, Vaughan JT, Andersen P, Strupp J, Ugurbil K, Moortele PFV. Adapted RF pulse design for SAR reduction in parallel excitation with experimental verification at 9.4 T. Journal of Magnetic Resonance. 2010;205(1):161–170. [PMC free article] [PubMed] [Google Scholar]
- 17.Boyd SP, Vandenberghe L. Convex optimization. Cambridge Univ Pr; 2004. [Google Scholar]
- 18.Blackford LS, Petitet A, Pozo R, Remington K, Whaley RC, Demmel J, Dongarra J, Duff I, Hammarling S, Henry G. An updated set of basic linear algebra subprograms (BLAS) ACM Transactions on Mathematical Software. 2002;28(2):135–151. [Google Scholar]
- 19.Anderson E, Bai Z, Bischof C, Demmel J, Dongarra J, Du Croz J, Greenbaum A, Hammarling S, McKenney A, Ostrouchov S. LAPACK usersguide. Release 1.0 Argonne National Lab.; IL (United States): 1992. [Google Scholar]
- 20.Kozlov M, Turner R. Fast MRI coil analysis based on 3-D electromagnetic and RF circuit co-simulation. Journal of Magnetic Resonance. 2009;200(1):147–152. doi: 10.1016/j.jmr.2009.06.005. [DOI] [PubMed] [Google Scholar]
- 21.Kozlov MTR. Analysis of RF transmit performance for a multi-row multi-channel MRI loop array at 300 and 400 MHz. Proceedings of the Asia-Pacific Microwave Conference; 2011; [DOI] [PubMed] [Google Scholar]
- 22.Turner MKaR. Analysis of Transmit Performance Optimization Strategies for Multi Channel MRI Array. MOROCCO; Marrakesh: 2011. pp. 1622–1626. [Google Scholar]
- 23.Lemdiasov RA, Obi AA, Ludwig R. A numerical postprocessing procedure for analyzing radio frequency MRI coils. Concepts in Magnetic Resonance Part A. 2011;38(4):133–147. [Google Scholar]
Associated Data
This section collects any data citations, data availability statements, or supplementary materials included in this article.
Supplementary Materials
Figure S1. Effect of controlling a single SAR or power metric on all SAR, power and excitation accuracy quantities for RF-shimming and 2-spokes pulses in the torso at 3 T. Pulses are designed using a least-square design strategy with a flat target phase. L-curves are obtained by varying a single constraint at a time (other quantities are not constrained). For example, red L-curves are obtained by varying the global SAR limit and setting the local SAR, maximum power and average power constraint limits to very large values. This shows the effect of constraining global SAR alone on global SAR, local SAR, maximum power and average power. The horizontal lines indicate the FDA limits (these are not always in the range of the y-axis).
Figure S2. Effect of controlling a single SAR or power metric on all SAR, power and excitation accuracy quantities for RF-shimming and 2-spokes pulses in the head at 7 T. Pulses are designed using a least-square design strategy with a flat target phase. L-curves are obtained by varying a single constraint at a time (other quantities are not constrained).
Figure S3. L-curves corresponding to horizontal cuts (constant local SAR) through the L-surfaces of Fig. 10.
Figure S4. Excitation accuracy (RMSE in percent of the target flip-angle) as a function of local SAR and global SAR. A: In the torso at 3 T. B: In the head at 7 T. Horizontal cuts (constant local SAR) through these L-surfaces are shown in Fig. S5. These L-surfaces show that the range of local SAR values consistent with a fixed value of global SAR is much smaller than the range of local SAR values consistent with a fixed value of average power (Fig. 10). This indicates that global SAR is a much better proxy for local SAR than average power.
Figure S5. L-curves corresponding to horizontal cuts (constant local SAR) through the L-surfaces of Fig. S4.


