

Background: Protofibrils of the amyloid-β peptide (Aβ) are neurotoxic oligomers implicated in development and progression of Alzheimer disease.
Results: The dissociation of Aβ protofibrils into their monomeric subunits is a slow process, occurring on the time scale of hours.
Conclusion: Aβ protofibrils possess a high kinetic stability toward dissociation into monomers.
Significance: The longevity of Aβ protofibrils permits sustained toxic effects.
Keywords: Alzheimer Disease, Amyloid, Fluorescence, Kinetics, Protein Aggregation, Protein Engineering, Protein Misfolding, Scaffold Proteins, Spectroscopy
Abstract
The interconversion of monomers, oligomers, and amyloid fibrils of the amyloid-β peptide (Aβ) has been implicated in the pathogenesis of Alzheimer disease. The determination of the kinetics of the individual association and dissociation reactions is hampered by the fact that forward and reverse reactions to/from different aggregation states occur simultaneously. Here, we report the kinetics of dissociation of Aβ monomers from protofibrils, prefibrillar high molecular weight oligomers previously shown to possess pronounced neurotoxicity. An engineered binding protein sequestering specifically monomeric Aβ was employed to follow protofibril dissociation by tryptophan fluorescence, precluding confounding effects of reverse or competing reactions. Aβ protofibril dissociation into monomers follows exponential decay kinetics with a time constant of ∼2 h at 25 °C and an activation energy of 80 kJ/mol, values typical for high affinity biomolecular interactions. This study demonstrates the high kinetic stability of Aβ protofibrils toward dissociation into monomers and supports the delineation of the Aβ folding and assembly energy landscape.
Introduction
Amyloid fibrils composed of amyloid-β peptide (Aβ)3 are the main protein component of senile plaques found in the brains of Alzheimer disease patients (1, 2). Genetics, cell culture studies, and animal models support a critical role of Aβ in Alzheimer disease pathogenesis, with the 42-amino acid Aβ42 peptide being more aggregation-prone and neurotoxic than the more common 40-amino acid Aβ40 variant. Aβ forms different types of prefibrillar oligomers, which, according to several lines of evidence, include the most toxic Aβ species (3, 4). Neurotoxic high molecular weight oligomers referred to as protofibrils or Aβ-derived diffusible ligands have been purified by size exclusion chromatography (SEC) of Aβ incubations (4–10). Aβ protofibrils are heterogeneous in size (in the range of 50–1500 kDa) and morphology, comprising spherical, annular, and curvilinear assemblies. The protofibrils are in equilibrium with both monomers and fibrils (7). The dynamics of the monomer-protofibril-fibril equilibrium is crucial for Aβ toxicity, as (i) the different association states exhibit different toxicities (2, 3), and (ii) toxicity emanates from the polymerization reaction itself (11). It is thus valuable to gain kinetic information on the individual interconversion steps. Knowledge of the kinetic stability of the involved species furthermore aids in the delineation of the amyloid folding and assembly energy landscape (12, 13).
In this study, we determined the off-rate of monomers dissociating from Aβ protofibrils by tryptophan fluorescence using a tryptophan-containing variant of the engineered Aβ-binding protein ZAβ3. ZAβ3, which has been selected previously from an Affibody protein library, specifically binds monomeric Aβ with an affinity of Kd = 17 nm (14, 15). ZAβ3 is a dimer of two identical subunits composed of 58 amino acids covalently linked by a disulfide bond. ZAβ3 inhibits Aβ oligomerization and aggregation by sequestering the aggregation-prone central and C-terminal sequence regions of monomeric Aβ (15, 16). The addition of an excess of the tryptophan-containing variant ZAβ3W to SEC-purified Aβ protofibrils enabled the detection of monomeric Aβ dissociating from protofibrils while preventing the reverse reaction from monomers to protofibrils as well as the reaction to amyloid fibrils. The temperature-dependent kinetic stability of Aβ protofibrils toward dissociation into monomers could thus be assessed.
EXPERIMENTAL PROCEDURES
Cloning of ZAβ3W
Site-directed mutagenesis was achieved by back-to-back primer PCR (17). Plasmid pAY442 containing the ZAβ3 gene (14) was amplified with phosphorylated primers, one of which carried the mutation for the Y18W exchange at the 5′-end. The vector was religated, and the mutation was verified by sequencing.
Expression and Purification of ZAβ3W
Expression and purification were done as described previously (18) with minor modifications. For cell lysis, high pressure (2.9 kilobars; Constant Systems) was used. After affinity chromatography, SEC (Superdex 75 16/60, GE Healthcare) was performed in 20 mm sodium phosphate and 50 mm NaCl (pH 7.2).
Expression, Purification, and Protofibril Formation of Aβ
Aβ40 and Aβ42 were produced with an N-terminal methionine by recombinant coexpression with ZAβ3 (19). For protein expression, unlabeled M9 medium without Celtone was used. The cell pellet was resuspended in 50 mm sodium phosphate, 200 mm NaCl, and 20 mm imidazole (pH 8.0). For cell disruption, high pressure (2.9 kilobars) was used. Affinity chromatography was performed on an ÄKTA Purifier system using a 5-ml HisTrap FF column (GE Healthcare). Aβ was eluted from the ZAβ3-Aβ complex bound on the column with 8 m urea and 20 mm sodium phosphate (pH 7.6). The eluted Aβ was washed over a 1-ml HisTrap FF column equilibrated in urea to remove any residual ZAβ3. Buffer exchange to 20 mm sodium phosphate (pH 7.0) was achieved by SEC (Superdex 75 16/60). The pH was adjusted to 10 to prevent aggregation during storage (4 °C) and during concentration (Vivaspin 20 3000 MWCO PES, Sartorius AG). For preparation of protofibrils, the pH was titrated back to 7. At room temperature, Aβ42 was incubated at a concentration of ∼100 μm for 1–4 h, whereas Aβ40 was incubated at a concentration of ∼500 μm for 24 h. The formation of protofibrils was monitored by analytical SEC runs (Superdex 75 10/300; 20 mm sodium phosphate (pH 7.0)). Protofibrils were purified by SEC and immediately employed in the fluorescence assay. The Aβ concentration of the freshly eluted protofibril fractions was determined by UV absorption at 280 nm. A protofibril batch referred to in this study is defined as one particular protofibril preparation starting from an individual Aβ expression cell pellet. To test fibril dissociation, amyloid fibrils were prepared by incubation of 650 μl of 380 μm Aβ42 in 20 mm sodium phosphate (pH 7.0) and 0.03% sodium azide for 1 week at 37 °C in a 2-ml glass vial, with stirring at 300 rpm using a micro stir bar.
Fluorescence Assay
Protofibril dissociation samples with a volume of ∼500 μl were prepared in 5 × 5-mm fluorescence cells (101.016-QS, Hellma) and sealed with Parafilm. An air-water interface was present at the top of the solutions. The samples were equipped with crown magnetic stirring bars (Jasco) and stirred at 500 rpm. Aβ concentrations between 4 and 35 μm were employed in the dissociation assay, and ZAβ3W was added at an excess of ∼25% to ensure removal of dissociated Aβ monomers from the monomer-protofibril equilibrium. The time elapsed between protofibril elution from SEC and the addition of ZAβ3W was ∼15 min.
Tryptophan fluorescence was excited at 295 nm, and emission spectra were recorded from 330 to 360 nm on a Jasco FP-6500 spectrofluorometer. The excitation and emission bandwidths were 5 and 1 nm, respectively, and the data pitch was 0.2 nm. The fluorescence was repeatedly measured over ∼12 h, during which time the sample temperature was kept constant using external water-jacketed cell holders. For fluorescence measurements, cells were transferred to the spectrofluorometer cell holder, which was thermostatted at 25 °C.
The λmax values of the fluorescence emission spectra were determined by fitting the fluorescence intensity to an empirical fitting function (1) using a trust region reflective algorithm implemented in MATLAB 2011 (MathWorks) (Equation 1),
 |
where F0 is the fluorescence intensity offset, F0 + ΔF is the fluorescence intensity at λmax, and Γ is the peak width. The fraction of free ZAβ3W was determined from λmax as explained under “Results,” employing the fit shown in Fig. 1D and complying with Equation 2.
 |
The fraction of free ZAβ3W dependent on incubation time was plotted, and a monoexponential fit to Equation 3 was employed to obtain individual apparent koff values for each dissociation experiment using OriginPro 8.6 (OriginLab) (Equation 3).
 |
A global fit of all Aβ42 protofibril dissociation data sets recorded at 25 °C to a triexponential decay with individual amplitudes A1, A2, and A3 and offset y0 but shared rate constants koff,1, koff,2, and koff,3 was performed according to Equation 4.
 |
The fraction of Aβ in protofibrils was calculated according to Equation 5.
 |
FIGURE 1.

ZAβ3W as a probe for Aβ protofibril dissociation. A, model of the ZAβ3W-Aβ complex. Tyr-18 in both subunits (blue and marine) of ZAβ3 (Protein Data Bank entry 2OTK) was replaced by tryptophan (red sticks). Aβ(16–40) is shown in orange. B, scheme of protofibril dissociation monitored by binding of Aβ monomers to ZAβ3W. C, fluorescence emission spectra of ZAβ3W in the absence (red) and presence (blue) of a stoichiometric amount of Aβ42 monomers and spectra of free Aβ42 (magenta) and buffer (black). D, λmax of fluorescence emission spectra of simulated mixtures of free and bound ZAβ3W (●). The line represents a fit to an exponential function employed to calculate the fraction of free ZAβ3W from experimentally determined λmax values.
Transmission Electron Microscopy
Aβ samples were diluted to 1 μm and incubated for 3 min on a Formvar/carbon-coated copper grid (S162, Plano). The grid was washed three times with H2O and one time with 2% aqueous uranyl acetate before incubation for 1 min with 2% aqueous uranyl acetate for negative staining, followed by drying overnight. The samples were examined with a Libra 120 electron microscope (Zeiss) operating at 120 kV.
Analytical Ultracentrifugation
Analytical ultracentrifugation (AUC) was performed in an Optima XL-A analytical ultracentrifuge (Beckman Coulter) with absorbance optics using an An-60 Ti rotor with aluminum 2-channel centerpiece cells. Sedimentation velocity centrifugation was done at 40,000 rpm and 20 °C. The intensity at 230 nm was recorded (radial resolution, 0.03 cm; continuous mode; no replicate; one scan/3 min). The run duration was 5 h for the protofibril sample and 10 h for the samples containing ZAβ3W. Data were fitted using the continuous distribution (c(s)) Lamm equation model with a v̄ of 0.738 cm3/g based on the Aβ42 sequence for the protofibril sample and a v̄ of 0.721 cm3/g based on the ZAβ3W sequence for the ZAβ3W samples in the software package Sedfit. An s-value resolution of 0.3 or 0.025 S was chosen for the fit of the protofibril sample or the ZAβ3W samples, respectively. The quality of the fits was confirmed by low root mean square deviations below A230 = 0.005. Specified amounts of species in the protofibril sample resulted from the c(s) distribution exclusive of the area below 0.6 S, which contains a base-line deconvolution artifact. The s-values determined were corrected for water at 20 °C.
Isothermal Titration Calorimetry
Isothermal titration calorimetry was performed essentially as described previously (15) using an iTC200 calorimeter (GE Healthcare).
RESULTS
ZAβ3W Is a Tryptophan Fluorescence Probe for Monomeric Aβ
Binding of ZAβ3 to Aβ is accompanied by a decrease in tyrosine fluorescence (18), presumably due to altered fluorescence properties of Tyr-18 in both ZAβ3 subunits, which are located at the binding interface. To exploit the higher extinction coefficient, higher quantum yield, and greater environment sensitivity of tryptophan compared with tyrosine, a ZAβ3 variant termed ZAβ3W was generated by site-directed mutagenesis of Tyr-18 to Trp-18 (Fig. 1A). ZAβ3W bound monomeric Aβ40 with an affinity of Kd = 20 nm as determined by isothermal titration calorimetry, which is close to the value of Kd = 17 nm obtained for ZAβ3 (15). Thus, the Y18W mutation did not significantly affect the affinity. The fluorescence emission spectrum of free ZAβ3W had a maximum at 348 nm (Fig. 1C), indicative of water exposure of the tryptophan side chains (20). Upon Aβ binding, the fluorescence intensity increased, and the emission maximum was blue-shifted to a wavelength of λmax = 340 nm, in agreement with a less polar environment of the tryptophan indole groups in the bound state. Because of the spectral differences between its free and bound states, ZAβ3W could be employed to detect and quantify monomeric Aβ by sequestering it into the ZAβ3W-Aβ complex. Both the fluorescence intensity and λmax could in principal be evaluated for this purpose. However, the fluorescence intensity decreased upon repeated measurements of free and bound ZAβ3W, indicative of photobleaching, whereas λmax remained constant. Therefore, λmax was chosen as the spectral property to evaluate for the detection of monomeric Aβ. However, λmax does not linearly depend on the fraction of free/bound ZAβ3W (21). To derive the relationship between λmax and the fraction of free/bound ZAβ3W, the simulated spectra of mixtures of free and bound ZAβ3W were calculated from the spectra of free and bound ZAβ3W, and the resulting λmax values dependent on the fraction of free ZAβ3W were plotted (Fig. 1D). A fit to an exponential function was employed for the calculation of the fraction of free ZAβ3W from experimentally determined λmax values. In conclusion, ZAβ3W addition to test solutions permits the detection and quantification of monomeric Aβ. In particular, the concentration of monomeric Aβ in a test solution corresponds to the concentration of bound ZAβ3W if an excess of ZAβ3W is added, ensuring a concentration of free ZAβ3W of [ZAβ3W]free ≫ Kd = 20 nm.
Exponential Decay Kinetics of Aβ Protofibril Dissociation
ZAβ3W was employed to study the dissociation kinetics of Aβ protofibrils as schematically shown in Fig. 1B. Monomers dissociating from protofibrils were captured by ZAβ3W. The ZAβ3W binding kinetics were sufficiently fast (time constant on the order of seconds (18)) not to obscure the slow protofibril dissociation kinetics. Sequestration of monomeric Aβ by ZAβ3W effectively inhibited fibril formation, which otherwise is a competing reaction of protofibril dissociation (11, 16). Under the experimental conditions, the decrease in the fraction of free ZAβ3W was proportional to the decrease in the fraction of Aβ within protofibrils and to the amount of Aβ monomers dissociated from protofibrils.
Aβ protofibrils were prepared by SEC of incubated samples of monomeric Aβ as described previously (4–8, 10, 16). Fresh samples of monomeric Aβ42 or Aβ40 were incubated at 25 °C in 20 mm sodium phosphate (pH 7.0), followed by injection of the solution onto a Superdex 75 10/300 SEC column and isolation of the protofibril fraction, which eluted close to the void volume of the column (Fig. 2A). The protofibrils exhibited mainly curvilinear but also spherical and annular morphologies in transmission electron microscopy (Fig. 2B), in agreement with previous studies (4–9). AUC of the Aβ42 protofibril fraction detected a monomer content of ∼30% of total Aβ, in accordance with dissociation of protofibrils on the time scale of AUC sample preparation and measurement. Of the remaining Aβ, the majority (∼50% of total Aβ) could be resolved by sedimentation velocity AUC at 40,000 rpm and 20 °C, yielding a size distribution from 2 to 13 S with an average s20,w = 7.6 S (Fig. 2C). These values are in agreement with literature AUC data for the high molecular weight SEC fraction of Aβ42 (10). An additional Aβ fraction (∼20% of total Aβ) sedimented too fast for reliable determination of s-values, possibly comprising larger protofibrils as well as mature amyloid fibrils.
FIGURE 2.
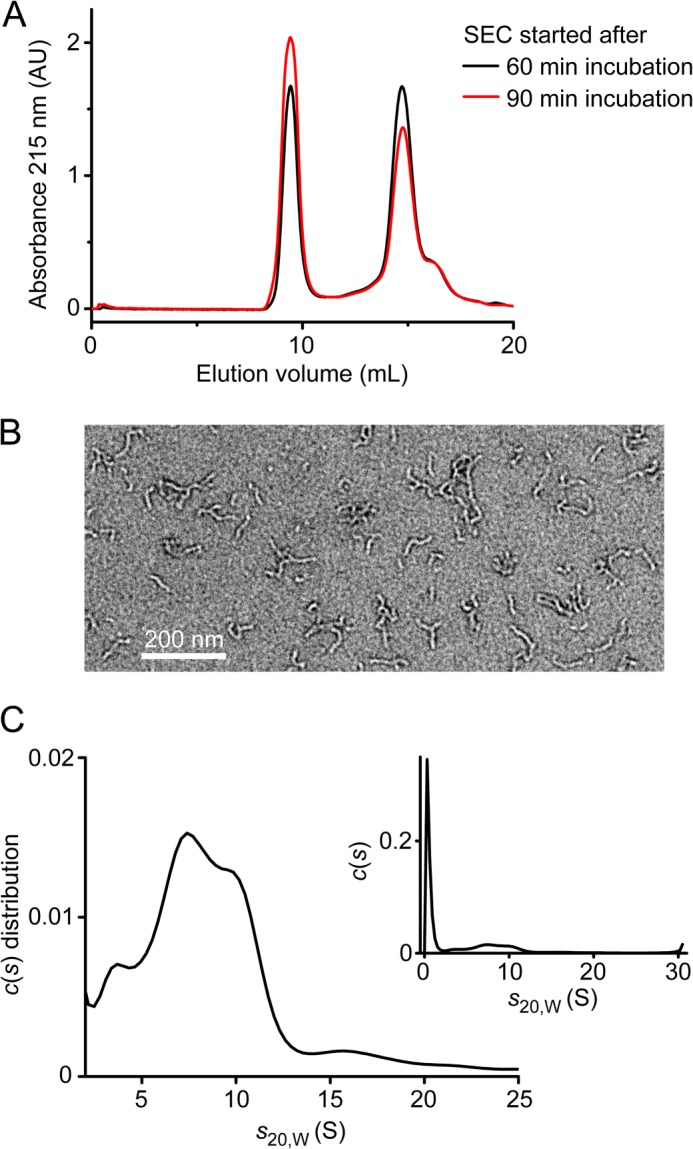
Aβ protofibrils. A, SEC of Aβ42 monomer samples incubated at 25 °C for the indicated times. The protofibril fraction eluted at ∼9 ml, and the monomer fraction eluted at ∼14.5 ml on a Superdex 75 10/300 column. AU, absorbance units. B, transmission electron microscopy of Aβ42 protofibrils prepared for the dissociation assay. C, sedimentation coefficient distribution of the Aβ42 protofibril fraction obtained from sedimentation velocity AUC analyzed with a continuous c(s) distribution model. The complete distribution, including the monomer peak, is shown in the inset.
Protofibril dissociation samples containing between 4 and 35 μm Aβ were prepared in fluorescence cells. The time of ZAβ3W addition was taken as the starting time of the protofibril dissociation reaction. Fluorescence emission spectra showed a blue shift of the tryptophan fluorescence with time, reporting the binding of ZAβ3W to monomeric Aβ dissociated from protofibrils on the time scale of minutes to hours (Fig. 3A). This is in agreement with the appearance of an Aβ monomer peak on this time scale after reinjection of the protofibril fraction onto an SEC column (Fig. 3B) as reported previously (16, 22). At the end of the dissociation experiments, protofibrils or other protein aggregates were not detected by transmission electron microscopy (Fig. 3C). In contrast, a protofibril sample incubated for the same time without ZAβ3W contained amyloid fibrils. AUC performed at the end of protofibril dissociation experiment showed that protofibrils were dissociated and that Aβ was bound to ZAβ3W (Fig. 3E).
FIGURE 3.

Protofibril dissociation. A, normalized fluorescence emission spectra of ZAβ3W after the addition of an Aβ42 protofibril sample and incubation at 25 °C for 10 min or 1, 2, 3, 4, or 5 h. The protein concentrations used were 14.8 μm Aβ42 and 19.6 μm ZAβ3W. Spectra of free ZAβ3W and ZAβ3W bound to a stoichiometric amount of Aβ42 monomers are shown for comparison. B, SEC of an Aβ42 protofibril sample re-injected onto a Superdex 75 10/300 column after incubation for 20 min in the absence of ZAβ3W. In addition to protofibrils eluting at ∼9 ml, Aβ monomers eluting at ∼14.5 ml were detected. AU, absorbance units. C, transmission electron microscopy of fresh Aβ42 protofibrils (upper panel), Aβ42 protofibrils at the end of the dissociation experiment (middle panel), and Aβ42 protofibrils treated as in the dissociation experiment but in the absence of ZAβ3W (lower panel). D, normalized fluorescence emission spectra of ZAβ3W after the addition of an Aβ42 amyloid fibril sample and incubation at 25 °C for 10 min or 2 or 7 days (d). The protein concentrations used were 20 μm Aβ42 and 25 μm ZAβ3W. Spectra of free ZAβ3W and ZAβ3W bound to a stoichiometric amount of Aβ42 monomers are shown for comparison. E, sedimentation coefficient distribution of ZAβ3W (black) and of the Aβ42 protofibril fraction in the presence of ZAβ3W at the end of the dissociation experiment (red). The shift of the distribution maximum to a higher s-value upon addition of protofibrils to ZAβ3W demonstrates formation of the ZAβ3W-Aβ42 complex. The complete distribution is shown in the inset.
In contrast to protofibrils, Aβ amyloid fibrils did not cause a significant blue shift of ZAβ3W tryptophan fluorescence after prolonged incubation (Fig. 3D). This is in agreement with previous data obtained by NMR-detected binding of ZAβ3 to Aβ, which showed a very high kinetic stability of Aβ fibrils prepared in vitro (16).
For the kinetic analysis of protofibril dissociation, the fraction of free ZAβ3W was calculated from the λmax values of the fluorescence emission spectra. The time traces of the fraction of free ZAβ3W revealed that protofibril dissociation was a rather slow reaction, occurring on the time scale of minutes to hours (Fig. 4). The dissociation kinetics were not affected by agitation, as expected for a dissociation reaction occurring in solution (Fig. 4). The time traces could be fitted to a monoexponential decay function, providing individual koff values for each protofibril dissociation sample (Figs. 4A and 5). The fits did not cover the complete amplitude of the decay of the fraction of Aβ in protofibrils, explainable by (i) the dissociation of protofibrils during the time elapsed between protofibril elution from SEC and addition of ZAβ3W and (ii) the fast dissociation of a fraction of Aβ monomers loosely bound to the protofibril surface, which has been detected before by dark-state exchange saturation transfer NMR (23).
FIGURE 4.

Kinetics of Aβ42 protofibril dissociation. Eight exemplary time traces are shown of protofibril-bound Aβ42 fractions after the addition of ZAβ3W to fresh Aβ42 protofibril preparations at 25 °C. The time traces were obtained for six independent protofibril preparations, with each batch indicated in individual color. For the batch shown in red, protofibrils harvested after 60 min of incubation (closed circles) or 90 min of incubation (open circles) were compared (SEC profiles in Fig. 2A). For the batch shown in light blue, protofibril dissociation samples were incubated with agitation (closed circles) or quiescent (open circles). A, lines represent local fits for each time trace to single exponential decay functions. B, lines represent one global fit for all time traces to a triexponential decay with shared rate constants but independent amplitudes for the time traces. The lower panels show the residuals of the fits.
FIGURE 5.

The off-rate of monomers dissociating from Aβ protofibrils. Shown is a plot of the ln(koff) values of Aβ40 (stars) and Aβ42 (circles) protofibrils against the inverse of the temperature. Independent protofibril preparations are identified by individual colors. For three Aβ42 protofibril preparations, ln(koff) values were determined at different temperatures and fit linearly according to an Arrhenius temperature dependence. Aβ concentrations in the protofibril dissociation samples were 4.5 μm (magenta circles), 10.0 μm (black circles), 10.5–14.8 μm (red circles), 14.8 μm (orange circles), 20.0 μm (light blue circles and gray stars), ands 35.0 μm (dark blue circles).
The average koff at 25 °C determined from 12 Aβ42 protofibril dissociation experiments of six independent protofibril batches was (1.4 ± 0.7) × 10−4 s−1. The koff values obtained for different protofibril batches varied considerably, ranging from 0.8 × 10⁻⁴ to 3.5 × 10⁻⁴ s−1 (Figs. 4A and 5). The koff value did not correlate with the Aβ concentration in the protofibril preparation (Fig. 5). koff did also not vary with the protofibril maturation time, as protofibril fractions harvested at two different times from the same Aβ incubation did not exhibit different dissociation kinetics within the error of the experiment (Figs. 4 and 5). One possible explanation for the heterogeneity in koff values would be a high sensitivity of the energy barrier of a defined rate-limiting step of protofibril dissociation to subtle differences in the solution conditions of different protofibril preparations. Alternatively, protofibril batches might be variably composed of a set of protofibrillar structures, each associated with a distinct individual energy barrier of the rate-limiting step of dissociation. A global fit of the 12 Aβ42 protofibril dissociation data sets recorded at 25 °C to a triexponential decay with shared rate constants performed similarly to the individual monoexponential fits, yielding the rate constants koff,1 = 0.77 × 10⁻⁴ s−1, koff,2 = 1.5 × 10⁻⁴ s−1, and koff,3 = 3.5 × 10⁻⁴ s−1 (Fig. 4B). Our data are thus compatible with the existence of a set of protofibrillar structures of different kinetic stabilities, with variable distribution in different protofibril batches.
Aβ40 and Aβ42 Protofibrils Possess Similar Kinetic Stabilities
The koff values of three protofibril dissociation experiments of an Aβ40 protofibril batch were within the range of those observed for Aβ42 protofibrils, with an average koff at 25 °C of 1.2 × 10⁻⁴ s−1 for Aβ40 (Fig. 5). Aβ40 and Aβ42 protofibrils thus possess similar kinetic stabilities.
Activation Energy of Protofibril Dissociation
The temperature dependence of the protofibril dissociation kinetics was investigated in the range of 19–37 °C for three independent Aβ42 protofibril preparations (Fig. 5). The koff values were obtained from fits to a monoexponential decay function. The ln(koff) versus 1/T plots could be fit linearly, in concordance with Arrhenius law behavior in this temperature range. The activation energy was obtained from the slope of the linear fits, yielding values between 75 and 89 kJ/mol, with an average of 80 kJ/mol.
DISCUSSION
This study introduces a fluorescence assay for the determination of Aβ protofibril dissociation kinetics, employing the engineered binding protein ZAβ3W. ZAβ3W is uniquely suited for this purpose because it requires the hydrophobic central region of Aβ comprising residues 17–36 to be accessible to coupled folding-binding (15, 18). This region is buried in the hydrophobic core of Aβ oligomers and amyloid fibrils (24–27), implying that ZAβ3W specifically binds monomeric Aβ, a prerequisite for the dissociation assay.
The results from this study reveal that the dissociation of monomers from Aβ protofibrils follows exponential decay kinetics. This is remarkable, inasmuch as the protofibril fraction obtained from SEC includes particles of different sizes, with spherical as well as (curvi)linear morphologies. Exponential decay behavior is not in agreement with a rate-limiting role of processes occurring exclusively at the end of (curvi)linear assemblies. However, it would be compatible with dissociation of (curvi)linear assemblies, e.g. (i) by rate-limiting dissociation of subunits at a rate that is independent of the subunit position within the linear assembly (Fig. 6A) or (ii) through a pre-equilibrium of linear with nonlinear assemblies and a rate-limiting dissociation of the latter into monomers (Fig. 6B). Interestingly, both models require the postulation of an Aβ oligomer as an intermediate unit through which protofibril dissociation occurs. Aβ oligomers potentially fulfilling this role have been identified before, e.g. by ion mobility coupled with mass spectrometry (28). Exponential dissociation kinetics have also been reported for prefibrillar oligomers of the SH3 domain of PI3K (29).
FIGURE 6.

Models of Aβ protofibril dissociation into monomers compatible with exponential decay kinetics. A, rate-limiting dissociation of protofibril subunits at a rate that is independent of the subunit position within the linear assembly. B, pre-equilibrium of linear and nonlinear protofibrils and rate-limiting dissociation of the latter into monomers. For illustration purposes, only one of the protofibril subunits (shown in magenta) dissociates. The indicated dissociation time constant (τ) was determined for Aβ42 protofibrils at 25 °C.
Aβ protofibril dissociation is a slow process, with a time constant of ∼2 h at 25 °C. The low rate of dissociation corresponds to a high free energy barrier that has to be crossed in the rate-limiting step. The energy barrier has a considerable enthalpic component as evidenced by the high activation energy of dissociation of ∼80 kJ/mol, a value typical for high affinity biomolecular interactions (30, 31). This indicates that a significant number of interactions have to be broken to reach the transition state. Aβ protofibrils contain extended H-bonded and β-sheet structure as detected by hydrogen-deuterium exchange and CD spectroscopy (7, 32, 33). Destruction of this structure can be expected to be associated with a considerable energy barrier, explaining the slow kinetics and high activation energy of protofibril dissociation.
The apparent koff values of different protofibril batches varied considerably, indicating the existence of distinct protofibrillar structures with different kinetic stabilities. This is reminiscent of prion/amyloid strains, protein aggregates of different conformation and thermodynamic stabilities that are associated with different phenotypes (34, 35).
Formation of protofibrils by Aβ40 requires higher monomer concentrations and longer incubation times compared with Aβ42, reflecting a marked difference in the association kinetics (4). In contrast, the dissociation kinetics of Aβ40 and Aβ42 protofibrils provided here are similar. This indicates that the main difference between Aβ40 and Aβ42 is the lower monomer solubility and increased oligomerization of the latter (36), whereas the kinetic stabilities of the formed protofibrils are alike.
In contrast to protofibrils, Aβ amyloid fibrils prepared in vitro do not dissociate effectively in the presence of ZAβ3 over weeks (16). This is in line with an even higher kinetic stability of fibrils compared with protofibrils, probably due to a more ordered and expanded β-sheet core (32).
The data gained by the ZAβ3W sequestration approach can be compared with previous data for the dissociation of different Aβ aggregates obtained from other techniques. The dissociation of radiolabeled Aβ40 deposited onto an amyloid fibril template occurred with dissociation half-times of ∼10 min or ≫1000 min depending on the deposition time, providing evidence for two different Aβ association states, a docked and a locked state (37). Dissociation of the weakly bound, docked Aβ is approximately an order of magnitude faster than protofibril dissociation. Aβ40 fibrils released soluble species at a rate of ∼1 × 10⁻⁴ s−1 as detected by two-color coincidence detection fluorescence (38), a value in the range of the rate of Aβ protofibril dissociation reported here. Analysis of hydrogen-deuterium exchange of Aβ fibrils employing a model of a recycling mechanism resulted in comparatively fast monomer off-rates of 0.6 × 10⁻² and 1.0 × 10⁻² s−1 for Aβ40 and Aβ42 fibrils, respectively (39). The comparability of the data sets is limited, however, inasmuch as ZAβ3W sequestration reports on the appearance of monomers, whereas the other techniques detect all soluble particles or hydrogen-deuterium exchangeable species.
This study demonstrates the applicability of a binding molecule obtained by protein engineering for the characterization of a key intermediate in amyloid formation. ZAβ3W can further be used to identify conditions and compounds that modulate Aβ aggregation, for example by destabilizing soluble oligomers (40).
This work was supported by the Ministerium für Innovation, Wissenschaft und Forschung des Landes Nordrhein-Westfalen.
- Aβ
- amyloid-β peptide
- SEC
- size exclusion chromatography
- AUC
- analytical ultracentrifugation.
REFERENCES
- 1. Querfurth H. W., LaFerla F. M. (2010) Alzheimer's disease. N. Engl. J. Med. 362, 329–344 [DOI] [PubMed] [Google Scholar]
- 2. Skovronsky D. M., Lee V. M., Trojanowski J. Q. (2006) Neurodegenerative diseases: new concepts of pathogenesis and their therapeutic implications. Annu. Rev. Pathol. 1, 151–170 [DOI] [PubMed] [Google Scholar]
- 3. Haass C., Selkoe D. J. (2007) Soluble protein oligomers in neurodegeneration: lessons from the Alzheimer's amyloid β-peptide. Nat. Rev. Mol. Cell Biol. 8, 101–112 [DOI] [PubMed] [Google Scholar]
- 4. Jan A., Hartley D. M., Lashuel H. A. (2010) Preparation and characterization of toxic Aβ aggregates for structural and functional studies in Alzheimer's disease research. Nat. Protoc. 5, 1186–1209 [DOI] [PubMed] [Google Scholar]
- 5. Hartley D. M., Walsh D. M., Ye C. P., Diehl T., Vasquez S., Vassilev P. M., Teplow D. B., Selkoe D. J. (1999) Protofibrillar intermediates of amyloid β-protein induce acute electrophysiological changes and progressive neurotoxicity in cortical neurons. J. Neurosci. 19, 8876–8884 [DOI] [PMC free article] [PubMed] [Google Scholar]
- 6. Lashuel H. A., Hartley D. M., Petre B. M., Wall J. S., Simon M. N., Walz T., Lansbury P. T., Jr. (2003) Mixtures of wild-type and a pathogenic (E22G) form of Aβ40 in vitro accumulate protofibrils, including amyloid pores. J. Mol. Biol. 332, 795–808 [DOI] [PubMed] [Google Scholar]
- 7. Walsh D. M., Hartley D. M., Kusumoto Y., Fezoui Y., Condron M. M., Lomakin A., Benedek G. B., Selkoe D. J., Teplow D. B. (1999) Amyloid β-protein fibrillogenesis. Structure and biological activity of protofibrillar intermediates. J. Biol. Chem. 274, 25945–25952 [DOI] [PubMed] [Google Scholar]
- 8. Walsh D. M., Lomakin A., Benedek G. B., Condron M. M., Teplow D. B. (1997) Amyloid β-protein fibrillogenesis. Detection of a protofibrillar intermediate. J. Biol. Chem. 272, 22364–22372 [DOI] [PubMed] [Google Scholar]
- 9. Freir D. B., Nicoll A. J., Klyubin I., Panico S., Mc Donald J. M., Risse E., Asante E. A., Farrow M. A., Sessions R. B., Saibil H. R., Clarke A. R., Rowan M. J., Walsh D. M., Collinge J. (2011) Interaction between prion protein and toxic amyloid β assemblies can be therapeutically targeted at multiple sites. Nat. Commun. 2, 336. [DOI] [PMC free article] [PubMed] [Google Scholar]
- 10. Hepler R. W., Grimm K. M., Nahas D. D., Breese R., Dodson E. C., Acton P., Keller P. M., Yeager M., Wang H., Shughrue P., Kinney G., Joyce J. G. (2006) Solution state characterization of amyloid β-derived diffusible ligands. Biochemistry 45, 15157–15167 [DOI] [PubMed] [Google Scholar]
- 11. Jan A., Adolfsson O., Allaman I., Buccarello A. L., Magistretti P. J., Pfeifer A., Muhs A., Lashuel H. A. (2011) Aβ42 neurotoxicity is mediated by ongoing nucleated polymerization process rather than by discrete Aβ42 species. J. Biol. Chem. 286, 8585–8596 [DOI] [PMC free article] [PubMed] [Google Scholar]
- 12. Eichner T., Radford S. E. (2011) A diversity of assembly mechanisms of a generic amyloid fold. Mol. Cell 43, 8–18 [DOI] [PubMed] [Google Scholar]
- 13. Baldwin A. J., Knowles T. P., Tartaglia G. G., Fitzpatrick A. W., Devlin G. L., Shammas S. L., Waudby C. A., Mossuto M. F., Meehan S., Gras S. L., Christodoulou J., Anthony-Cahill S. J., Barker P. D., Vendruscolo M., Dobson C. M. (2011) Metastability of native proteins and the phenomenon of amyloid formation. J. Am. Chem. Soc. 133, 14160–14163 [DOI] [PubMed] [Google Scholar]
- 14. Grönwall C., Jonsson A., Lindström S., Gunneriusson E., Ståhl S., Herne N. (2007) Selection and characterization of Affibody ligands binding to Alzheimer amyloid β peptides. J. Biotechnol. 128, 162–183 [DOI] [PubMed] [Google Scholar]
- 15. Hoyer W., Grönwall C., Jonsson A., Ståhl S., Härd T. (2008) Stabilization of a β-hairpin in monomeric Alzheimer's amyloid-β peptide inhibits amyloid formation. Proc. Natl. Acad. Sci. U.S.A. 105, 5099–5104 [DOI] [PMC free article] [PubMed] [Google Scholar]
- 16. Luheshi L. M., Hoyer W., de Barros T. P., van Dijk Härd I., Brorsson A. C., Macao B., Persson C., Crowther D. C., Lomas D. A., Ståhl S., Dobson C. M., Härd T. (2010) Sequestration of the Aβ peptide prevents toxicity and promotes degradation in vivo. PLoS Biol. 8, e1000334. [DOI] [PMC free article] [PubMed] [Google Scholar]
- 17. Hemsley A., Arnheim N., Toney M. D., Cortopassi G., Galas D. J. (1989) A simple method for site-directed mutagenesis using the polymerase chain reaction. Nucleic Acids Res. 17, 6545–6551 [DOI] [PMC free article] [PubMed] [Google Scholar]
- 18. Hoyer W., Härd T. (2008) Interaction of Alzheimer's Aβ peptide with an engineered binding protein–thermodynamics and kinetics of coupled folding-binding. J. Mol. Biol. 378, 398–411 [DOI] [PubMed] [Google Scholar]
- 19. Macao B., Hoyer W., Sandberg A., Brorsson A. C., Dobson C. M., Härd T. (2008) Recombinant amyloid β-peptide production by coexpression with an Affibody ligand. BMC Biotechnol. 8, 82. [DOI] [PMC free article] [PubMed] [Google Scholar]
- 20. Burstein E. A., Vedenkina N. S., Ivkova M. N. (1973) Fluorescence and the location of tryptophan residues in protein molecules. Photochem. Photobiol. 18, 263–279 [DOI] [PubMed] [Google Scholar]
- 21. Ladokhin A. S., Jayasinghe S., White S. H. (2000) How to measure and analyze tryptophan fluorescence in membranes properly, and why bother? Anal. Biochem. 285, 235–245 [DOI] [PubMed] [Google Scholar]
- 22. Jan A., Gokce O., Luthi-Carter R., Lashuel H. A. (2008) The ratio of monomeric to aggregated forms of Aβ40 and Aβ42 is an important determinant of amyloid-β aggregation, fibrillogenesis, and toxicity. J. Biol. Chem. 283, 28176–28189 [DOI] [PMC free article] [PubMed] [Google Scholar]
- 23. Fawzi N. L., Ying J., Ghirlando R., Torchia D. A., Clore G. M. (2011) Atomic-resolution dynamics on the surface of amyloid-β protofibrils probed by solution NMR. Nature 480, 268–272 [DOI] [PMC free article] [PubMed] [Google Scholar]
- 24. Chimon S., Shaibat M. A., Jones C. R., Calero D. C., Aizezi B., Ishii Y. (2007) Evidence of fibril-like β-sheet structures in a neurotoxic amyloid intermediate of Alzheimer's β-amyloid. Nat. Struct. Mol. Biol. 14, 1157–1164 [DOI] [PubMed] [Google Scholar]
- 25. Lührs T., Ritter C., Adrian M., Riek-Loher D., Bohrmann B., Döbeli H., Schubert D., Riek R. (2005) 3D structure of Alzheimer's amyloid-β(1–42) fibrils. Proc. Natl. Acad. Sci. U.S.A. 102, 17342–17347 [DOI] [PMC free article] [PubMed] [Google Scholar]
- 26. Petkova A. T., Yau W. M., Tycko R. (2006) Experimental constraints on quaternary structure in Alzheimer's β-amyloid fibrils. Biochemistry 45, 498–512 [DOI] [PMC free article] [PubMed] [Google Scholar]
- 27. Yu L., Edalji R., Harlan J. E., Holzman T. F., Lopez A. P., Labkovsky B., Hillen H., Barghorn S., Ebert U., Richardson P. L., Miesbauer L., Solomon L., Bartley D., Walter K., Johnson R. W., Hajduk P. J., Olejniczak E. T. (2009) Structural characterization of a soluble amyloid β-peptide oligomer. Biochemistry 48, 1870–1877 [DOI] [PubMed] [Google Scholar]
- 28. Bernstein S. L., Dupuis N. F., Lazo N. D., Wyttenbach T., Condron M. M., Bitan G., Teplow D. B., Shea J. E., Ruotolo B. T., Robinson C. V., Bowers M. T. (2009) Amyloid-β protein oligomerization and the importance of tetramers and dodecamers in the aetiology of Alzheimer's disease. Nat. Chem. 1, 326–331 [DOI] [PMC free article] [PubMed] [Google Scholar]
- 29. Orte A., Birkett N. R., Clarke R. W., Devlin G. L., Dobson C. M., Klenerman D. (2008) Direct characterization of amyloidogenic oligomers by single-molecule fluorescence. Proc. Natl. Acad. Sci. U.S.A. 105, 14424–14429 [DOI] [PMC free article] [PubMed] [Google Scholar]
- 30. Ojcius D. M., Gapin L., Kourilsky P. (1993) Dissociation of the peptide/MHC class I complex: pH dependence and effect of endogenous peptides on the activation energy. Biochem. Biophys. Res. Commun. 197, 1216–1222 [DOI] [PubMed] [Google Scholar]
- 31. Schwesinger F., Ros R., Strunz T., Anselmetti D., Güntherodt H. J., Honegger A., Jermutus L., Tiefenauer L., Plückthun A. (2000) Unbinding forces of single antibody-antigen complexes correlate with their thermal dissociation rates. Proc. Natl. Acad. Sci. U.S.A. 97, 9972–9977 [DOI] [PMC free article] [PubMed] [Google Scholar]
- 32. Kheterpal I., Chen M., Cook K. D., Wetzel R. (2006) Structural differences in Aβ amyloid protofibrils and fibrils mapped by hydrogen exchange-mass spectrometry with on-line proteolytic fragmentation. J. Mol. Biol. 361, 785–795 [DOI] [PubMed] [Google Scholar]
- 33. Kheterpal I., Lashuel H. A., Hartley D. M., Walz T., Lansbury P. T., Jr., Wetzel R. (2003) Aβ protofibrils possess a stable core structure resistant to hydrogen exchange. Biochemistry 42, 14092–14098 [DOI] [PubMed] [Google Scholar]
- 34. Qiang W., Kelley K., Tycko R. (2013) Polymorph-specific kinetics and thermodynamics of β-amyloid fibril growth. J. Am. Chem. Soc. 135, 6860–6871 [DOI] [PMC free article] [PubMed] [Google Scholar]
- 35. Tanaka M., Chien P., Naber N., Cooke R., Weissman J. S. (2004) Conformational variations in an infectious protein determine prion strain differences. Nature 428, 323–328 [DOI] [PubMed] [Google Scholar]
- 36. Bitan G., Kirkitadze M. D., Lomakin A., Vollers S. S., Benedek G. B., Teplow D. B. (2003) Amyloid β-protein (Aβ) assembly: Aβ40 and Aβ42 oligomerize through distinct pathways. Proc. Natl. Acad. Sci. U.S.A. 100, 330–335 [DOI] [PMC free article] [PubMed] [Google Scholar]
- 37. Esler W. P., Stimson E. R., Jennings J. M., Vinters H. V., Ghilardi J. R., Lee J. P., Mantyh P. W., Maggio J. E. (2000) Alzheimer's disease amyloid propagation by a template-dependent dock-lock mechanism. Biochemistry 39, 6288–6295 [DOI] [PubMed] [Google Scholar]
- 38. Narayan P., Orte A., Clarke R. W., Bolognesi B., Hook S., Ganzinger K. A., Meehan S., Wilson M. R., Dobson C. M., Klenerman D. (2012) The extracellular chaperone clusterin sequesters oligomeric forms of the amyloid-β(1–40) peptide. Nat. Struct. Mol. Biol. 19, 79–83 [DOI] [PMC free article] [PubMed] [Google Scholar]
- 39. Sánchez L., Madurga S., Pukala T., Vilaseca M., López-Iglesias C., Robinson C. V., Giralt E., Carulla N. (2011) Aβ40 and Aβ42 amyloid fibrils exhibit distinct molecular recycling properties. J. Am. Chem. Soc. 133, 6505–6508 [DOI] [PubMed] [Google Scholar]
- 40. Ladiwala A. R., Dordick J. S., Tessier P. M. (2011) Aromatic small molecules remodel toxic soluble oligomers of amyloid β through three independent pathways. J. Biol. Chem. 286, 3209–3218 [DOI] [PMC free article] [PubMed] [Google Scholar]