


Abstract
How tumor suppressor p53 selectively responds to specific signals, especially in normal cells, is poorly understood. We performed genome-wide profiling of p53 chromatin interactions and target gene expression in human embryonic stem cells (hESCs) in response to early differentiation, induced by retinoic acid, versus DNA damage, caused by adriamycin. Most p53-binding sites are unique to each state and define stimulus-specific p53 responses in hESCs. Differentiation-activated p53 targets include many developmental transcription factors and, in pluripotent hESCs, are bound by OCT4 and NANOG at chromatin enriched in both H3K27me3 and H3K4me3. Activation of these genes occurs with recruitment of p53 and H3K27me3-specific demethylases, UTX and JMJD3, to chromatin. In contrast, genes associated with cell migration and motility are bound by p53 specifically after DNA damage. Surveillance functions of p53 in cell death and cell cycle regulation are conserved in both DNA damage and differentiation. Comparative genomic analysis of p53-targets in mouse and human ESCs supports an inter-species divergence in p53 regulatory functions during evolution. Our findings expand the registry of p53-regulated genes to define p53-regulated opposition to pluripotency during early differentiation, a process highly distinct from stress-induced p53 response in hESCs.
INTRODUCTION
Tumor suppressor protein p53 is well studied in its roles of cellular surveillance by activation of cell cycle arrest and cell death pathways (1). Recent work expands p53 regulatory functions to cellular metabolism and homeostasis, implantation, aging and quiescence of stem cells [reviewed in detail in (2)]. Tumor suppressor p53 has been implicated in limiting the self-renewal of stem cells in variety of systems (3–5). Reports that p53 loss in breast cancers activates genes with embryonic stem cell (ESC) transcription signatures (6) and that p53 mutation enables aberrant self-renewal of hematopoietic stem cells to promote acute myeloid leukemia (7) support p53 functions in opposition to a stem cell state.
The characteristics shared between specific cancers and stem cells (8), and the dysfunction of p53 in a majority of human cancers (9), led to a proposal that p53 imposes differentiation as a tumor-suppressive mechanism (2,10). Multiple studies show that developmental reprogramming of a fully differentiated somatic cell to an induced pluripotent stem cell state is facilitated by depletion of p53 or malfunction in pathways that activate p53 [reviewed in (11)]. However, whether p53 is a passive barrier to reprogramming and creation of induced pluripotent stem cells, due to its inhibitory effects on cellular proliferation, or if it actively opposes pluripotency remains controversial (12). Recent work from our laboratory revealed that p53 plays a significant role during retinoic acid (RA)-mediated differentiation of human ESCs (hESCs) by regulating cell cycle and activating micro-RNAs that repress stem cell factors (5). Prior studies comparing mouse embryonic stem cells (mESCs) and hESCs show fundamental differences between the two, including basic mechanisms of transcription factor function (13,14) and the impact cell cycle has on self-renewal (15). These differences may reflect different stages of development: inner cell mass (mESCs) versus epiblast (hESCs) (16). However, further discovery and analysis of the earliest stages of human embryonic development are needed to resolve such controversies.
Genome-wide profiling of protein interactions with chromatin and intersection with global gene expression analysis allow functional annotation of directly regulated biological pathways. These approaches have been instrumental in revealing networks of transcription and epigenetic regulators of pluripotency and self-renewal of ESCs (17,18). Here, we applied these methods and identified genome-wide downstream targets of p53 in hESCs undergoing differentiation or DNA damage. Using a combination of genomic and biochemical approaches, we found that p53 responds to RA signaling by direct regulation of genes significant in developmental processes. These gene targets of p53 are distinct from those induced during DNA damage, which function in cellular migration and motility. Moreover, during differentiation p53 interacts with genomic regions occupied by core pluripotency factors OCT4 and NANOG in pluripotent hESCs. Using conventional ChIP and sequential ChIP, we show that p53 binds OCT4-occupied gene loci and mediates loss of H3K27me3 to activate expression of specific developmental genes. Further, by co-immunoprecipitation analysis of chromatin, we show that p53 interacts with H3K27me3 demethylases, UTX and JMJD3, which alter chromatin to induce developmental gene expression. Collectively, our results broaden the known transcriptional functions of p53 and reveal directly regulated gene signatures unique to either differentiation or damage response, as well as the prime functions of p53 in hESCs conserved in both.
MATERIALS AND METHODS
Cell culture
Human Embryonic Stem (WA09) Cells were obtained from National Stem Cell Bank (Madison, WI, USA) and cultured according to the protocol from WiCell Research Insitute. Briefly, WA09 cells were maintained in hESC culture medium on γ-irradiated Mouse Embryonic Fibroblasts (MEFs) prepared using WiCell instructions. hESCs ranging from passage number 32–38 were used for all of our experiments. hESC complete culture medium is composed of DMEM/F12 supplemented with 20% knockout serum replacement, 1 mM l-glutamine, 1% non-essential amino acids, 4 ng/ml human basic FGF (all from Invitrogen) and 0.1 mM 2-mercaptoethanol (Sigma). The medium was changed daily, and cells were passaged every 4–6 days with 1 mg/ml Collagen IV (Invitrogen). For differentiation studies, hESCs were cultured in differentiation media (hESC media without FGF) containing 1 µM RA with fresh medium change daily. hESCs were also maintained as feeder-free cultures on hESC qualified Matrigel (BD Biosciences) in mTeSR1 media (Stem Cell Technologies) and CM (MEF conditioned media). Passage 32 hESCs were grown on mTeSR1 media for five passages. hESCs were cultured on Matrigel (BD Biosciences) following manufacturer’s instructions, received fresh mTeSR1 media everyday and cells were passaged every 4–6 days with 1 mg/ml Dispase (Stem Cell Technologies). For differentiating hESCs cultured on mTeSR1, 1 µM RA was added to homemade MEF-CM (Conditioned Media, without additional FGF). CM media was prepared in our facility by culturing γ-irradiated MEFs in complete hESC culture media for 24 h and collected every day, filtered and freezed at −20 degrees. FGF was added to CM media before use to a final concentration of 10 ng/ml to culture the cells grown on Matrigel under pluripotent conditions. Alkaline-phosphatase staining and western blot analysis were performed as described previously (5).
ChIP
hESCs grown on inactivated MEF feeders were cultured in complete hESC media or treated with RA for 2 days in differentiation media were collected, PBS washed and cross-linked in 1% formaldehyde for 10 min at room temperature. After glycine followed by PBS wash, cells were lysed using lysis buffer [5 mM Hepes (pH 8.0), 85 mM KCl, 0.5% NP40] supplemented with protease inhibitor (Calbiochem). After removal of cytoplasmic extract, remaining cell pellet was lysed in Nuclear lysis buffer [50 mM Tris–HCl (pH 7.5), 10 mM EDTA, 1% SDS] and protease inhibitor. Lysates with glass beads (Sigma) were fragmented with a Bioruptor (Diagenode) to obtain DNA fragments of average length under 500 bp. After centrifugation, the supernatant was preabsorbed with 40 μl of Protein A beads (GE Healthcare) and immunoglobulin G (IgG) for 2 h, then incubated with 5 μg of p53 (Santa Cruz Biotechnology), OCT4, Histone H3, (both from Abcam), H3K4me3 or H3K27me3 antibody or control IgG (all from Millipore) overnight at 4°C. The immunocomplex was collected on protein A beads, washed and bound DNA was eluted and reverse cross-linked overnight at 65°C. The DNA region of interest was detected by SYBR real-time quantitative PCR using primers encompassing p53-response elements (p53RE) or OCT4-binding sites on the respective gene (see Supplementary Table S7 for sequence of primers used for ChIP-qPCR).
ChIP-seq analysis
Sequencing of p53-bound DNA was performed at the Bioinformatics Core of the Cincinnati Children’s Hospital Medical Center, Cincinnati, OH. p53-bound DNA (∼10 ng) was purified by PAGE to obtain 100–300-bp fragments and sequenced on an Illumina Solexa GAII sequencer. Sequence reads derived from Illumina GAII sequencer were aligned to the NCBI Build 36 (UCSC hg18) human genome using ELAND software (Illumina) to produce uniquely matched reads with up to two mismatches per read allowance. We obtained 15012584, 14655088 and 11280919 uniquely mapped reads to the genome in untreated, differentiation and damage conditions, respectively. Enriched regions for each condition were normalized to input DNA and detected by MACS v1.4.0 (19) with a cut-off P < 10−8 for damage and differentiation, and P < 10−10 for untreated. Wiggle files were generated by the same sequence file and later normalized. Peaks share at least one base under their enriched regions called as overlapped between different conditions. The distance between unique peaks in each condition was measured using a gradually increasing window and determining the unique peaks summits coinciding in the same window. Obtained numbers were plotted, and pie charts were generated by ratios of overlapping versus non-overlapping summits for a certain window length. PhastCons conservation scores for 44 vertebrates were downloaded from UCSC website (http://hgdownload.cse.ucsc.edu/goldenPath/hg18/phastCons44way/vertebrate/), and individual chromosome files were merged into a single wiggle file. Aggregate plots for conservation scores across enriched sites were generated using the Sitepro program under CEAS (20).
Motif analysis was performed using MEME-ChIP (21), which is specifically designed to discover associated motifs in large sets of DNA sequences. Zero or one motif per sequence was searched with the motif lengths betweens 6 and 30 bp. Analysis of motif enrichment (22) outputs for each data set are shown with a P-value cut-off <1.00 E-10. SeqPos motif discovery program in Cistrome analysis pipeline (http://cistrome.org/ap/) was also performed for motif discovery underneath enriched sites (∼400 bp of the peak’s center) in each condition.
Human RefSeq gene information was obtained from UCSC table browser (http://genome.ucsc.edu/cgi-bin/hgTables?command=start). Weighted binding coefficient was calculated as previously described (23), to determine the fold enrichment over the randomized binding sites. Genes with a nearby peak 10 kb up/downstream of transcription start sites (TSS) were designated as targets. Gene Ontology (GO) analyses for each set of target genes were performed using DAVID (24). Developmental transcription factors were obtained from the HUGO website (http://www.genenames.org/genefamily.html), previously published study (17) and NCBI’s Gene database (http://www.ncbi.nlm.nih.gov/gene). Each dot shown represents a member of a particular family only if the gene’s ontology terms entail transcription or DNA binding and also development or differentiation.
INTERPRO protein domain analysis was performed using Genomic Regions Enrichment of Annotations Tool (GREAT) (25). Peak files were imported into GREAT by setting a gene association rule as a single gene within 10 kb ranges of binding sites. The top five categories are shown.
ChIP-Seq data sets of OCT4 (GSM518373) and NANOG (GSM518374) were obtained from GEO database (http://www.ncbi.nlm.nih.gov/geo/). Raw sequences were re-analyzed with MACS v1.4.0. Obtained peaks were used for overlap analysis and circular plot. Circos (26) was used to visualize p53, OCT4, NANOG and Histone 3 Lysine 27 trimethylation (H3K27me3) around four Homeodomain-box (HOX) clusters. H3K27me3 data were obtained from UCSC genome browsers’ ENCODE project website (http://hgdownload.cse.ucsc.edu/goldenPath/hg18/encodeDCC/wgEncodeBroadChipSeq/) (27). Random locations showing similar distribution in each chromosome were generated 10 000 times and used for determining statistical significance. Wiggle files were used to generate a density plot, using the heatmap tool in the Cistrome analysis pipeline (http://cistrome.org/ap/). K-means clustering was applied to the condition specific regions. Normalized wiggle files were used to generate histone aggregate plots. TSS of p53 target genes was used as the center of the window and each window was divided into 40 bins of 25 bp resolution. Average ratios were plotted for each category.
Microarray analysis
Affymetrix U133 Plus2.0 microarrays were performed for each condition (Pluripotent, +Adr and +RA) in triplicates. Robust multi-array average method was used with default options (with background correction, quantile normalization, and log transformation) to normalize raw data from batches using R/Bioconductor‘s affy package (28). For genes, which are represented by multiple probes on the array, maximum expression value was retained for further analyses. A gene is called as differentially expressed if FDR corrected P < 0.05, which is calculated with empirical Bayes method by eBayes function in Bioconductor’s limma package. GO analysis of differentially expressed gene was performed using DAVID.
RNA knockdown
hESC colonies were grown on Matrigel in 6-well plates. siRNA-targeting human TP53, and non-target (control) were purchased from Dharmacon. In all, 75 nM siRNA oligos were transfected twice into cells using Lipofectamine2000 (Invitrogen) transfection reagent according to manufacturer’s protocol within a period of 5 days. First siRNA transfection was performed 24 h after splitting the cells followed by media change 6 h post-transfection. Thirty-six hours after first siRNA transfection, cells were cultured in differentiation media (−FGF, +RA) for 3 days and harvested. Cells were transfected one more time with siRNA on beginning of day 2 of RA treatment to maintain the knockdown efficiency.
RNA isolation and real-time qPCR analysis
RNA was isolated using TRIzol Reagent (Invitrogen) as per manufacturer’s specifications. For RNA analysis 500 ng total RNA was treated with DNaseI and cDNA was synthesized as previously described (29), and amplified with human gene specific primers (Supplementary Table S8) with Power SYBR Green PCR Master Mix (Applied Biosystems). The average threshold (Ct) was determined for each gene and normalized to Actin mRNA level as internal normalization control.
Chromatin fractionation
Chromatin fractions were prepared using biochemical fractionation protocol as described previously (30) with some modifications. Briefly, pluripotent or RA treated hESCs were harvested and washed with chilled phosphate-buffered saline (PBS). The cells were then resuspended in buffer A [10 mM HEPES (pH 7.9), 10 mM KCl, 1.5 mM MgCl2, 0.34 M sucrose, 10% glycerol, 1 mM DTT and protease inhibitor cocktail]. Triton X-100 was added to cells at a final concentration of 0.1%, followed by incubation on ice for 8 min, and nuclei were collected by centrifugation (5 min, 1300g, 4°C). The supernatant was clarified by high speed centrifugation (5 min, 20 000g, 4°C) to recover the cytoplasmic extract. The nuclei were washed once with buffer A and lysed for 30 min in buffer B (3 mM EDTA, 0.2 mM EGTA, 1 mM DTT and protease inhibitor cocktail), and insoluble chromatin pellet and soluble fractions were separated by centrifugation (5 min, 1700g, 4°C). The chromatin pellet was resuspended in immunoprecipitation (IP) buffer (50 mM Tris–HCl, 1% Triton X-100, 150 mM NaCl and 15 U of MNase (Worthington) at 37 °C for 10 min, centrifuged (5 min, 10 000g, 4°C), and the supernatant was used for immunoprecipitation and western blot analyses.
Co-immunoprecipitation analysis
hESCs grown on inactivated MEF feeders were cultured in complete hESC media or treated with RA for indicated time points in differentiation media, were subjected to chromatin fractionation as described above. 0.5 mg of chromatin fractions were used for immunoprecipitation with 2.5 μg of antibody overnight at 4°C with shaking. Thirty microliters of washed Protein A Sepharose CL-4B bead suspension (GE Healthcare) was added to fraction-antibody mixture and incubated for additional 1 h at 4°C with shaking. Immunecomplexes were washed twice with IP buffer without MNase, boiled with 1× SDS SDS–Laemmli sample buffer and resolved on 10% SDS–PAGE followed by immunoblotting.
Western blotting
hESCs were lysed in RIPA buffer [50 mM Tris (pH 8.0), 150 mM NaCl, 1% NP-40, 0.5% Deoxycholic acid, 0.1% SDS] supplemented with protease inhibitor cocktail (Calbiochem) and phosphatase inhibitor cocktails I and II (Sigma) to obtain whole-cell lysate. Approximately 50 µg of cell lysate or chromatin fraction was analyzed by immunoblottting with anti-p53 (DO1), anti-OCT4, (Santa Cruz Biotechnologies), anti-UTX (Bethyl Laboratories), anti-JMJD3 (Abcam), anti-H3 (Abcam), anti-LaminB1 (Santa Cruz Biotechnologies) and anti-Actin (GeneTex Biotechnology), followed by corresponding Horseradish peroxidase-tagged secondary antibody (GE Healthcare) as described previously (5).
Generating stable-knockdown hESCs
hESCs were cultured in mTeSR1 medium as described above. Lentiviral supernatants were produced by transfecting 293T cells with the pLKO.1 control shRNA vector (Open Biosystems) or pLKO.1-shp53 vector (Addgene plasmid 19119), along with psPAX2 and pMD2.G packaging plasmids (Open Biosystems), using Fugene HD transfection reagent (Roche) and collected viral media 48 h post-transfection. Stable knockdown hESCs were generated by incubating the cells with viral media followed by spin infection at 2500 rpm at 32°C for 90 min with polybrene (4 μg/ml) and incubated at 37°C for an additional 2 h before medium replacement with fresh mTeSR1. Three days after infection, cells were selected with increasing doses of Puromycin (0.2–2 µg/ml) and finally maintained in 1 µg/ml Puromycin. p53-knockdown efficiency was confirmed by RNA and protein analysis.
Comparing p53-binding profiles in human and mouse ESCs
ChIP-Seq data sets of mouse p53 DNA-damage (GSE26362) and H3K27me3 in mESC (GSM397410) (31) were obtained from GEO database. Raw sequences were re-analyzed with MACS v1.4.0 with a P-value cut-off of P < 10−8. UCSC lift over tool (http://genome.ucsc.edu/cgi-bin/hgLiftOver) was used to convert mouse genomic coordinates to human hg18 genome assembly. Obtained peaks were used for overlap analysis and circular plot. Genes with a p53 peak within 10 kb up/downstream of TSS were designated as p53 targets. Based on the inter-species transcription factor target gene classification as described previously (32), mouse p53 bound to aligned region in human genome for homologous genes were designated as ‘Conserved’ target genes. Homologous genes with unaligned p53 binding sites between species were designated as ‘Turnover’ p53-targets. GO analyses for each set of target genes were performed using DAVID annotation tool (24). Circos (26) was used to visualize p53, Phastcons Scores and H3K27me3 around four HOX clusters in human and mouse genomes.
Data access
p53, H3K4me3 and H3K27me3 ChIP-seq data can be accessed at NCBI Gene Expression Omnibus (GEO) (http://www.ncbi.nlm.nih.gov/geo/) under accession no. GSE39912. Affymetrix microarray expression data are available under accession no. GSE39762.
RESULTS
Genome-wide mapping of p53 in hESCs reveal distinct functional binding sites
Alkaline phosphatase (AP)-staining of hESCs, as one measure of self-renewing (positive staining) versus differentiated (negative staining) state, was monitored for hESCs treated with siControl oligos or depleted of p53, followed by RA-induced differentiation or DNA damage induced by Adriamycin (Adr) (Supplementary Figure S1A). Adr elicited a robust induction of p53, no major change in OCT4 protein levels and a minor reduction in AP-staining of hESCs, indicating no significant differentiation under DNA damage conditions whether p53 is depleted or not (Supplementary Figure S1A and B). In contrast, RA treatment induced p53 protein and both p53-dependent loss in AP-staining and p53-dependent reduced OCT4 protein levels (Supplementary Figure S1A and B), as we previously reported using multiple measures of stem cell status (5).
To determine the molecular basis for these signal-specific responses and define a landscape of p53-chromatin interactions in hESCs, we mapped p53 occupancy throughout the genome by deep sequencing of p53-bound chromatin fragments (ChIP-Seq) isolated from hESCs in a pluripotent state (untreated), undergoing differentiation (+RA) or after DNA damage (+Adr). In pluripotent hESCs, p53 is enriched at 4509 genomic sites, compared with 8282 and 4941 in hESCs undergoing differentiation or damage, respectively (Figure 1A). A fraction of p53-bound peaks (26.5%) overlapped between differentiation and damage induction (Figure 1A). Comparison of unique sites in a gradually increasing genomic window revealed that only 44% of unique sites overlapped in a 100 kb window, suggesting highly diverse p53 functions in these two states (Supplementary Figure S1C). PhastCons score analysis, comparing genomic regions within 4 kb of each p53-peak summit in 44 vertebrate species, revealed high evolutionary conservation of p53 binding regions (Figure 1B). Comparison of p53 ChIP-Seq signals to input suggests robust p53 enrichment during both differentiation and damage (Supplementary Figure S2A), consistent with p53 protein stabilization under these conditions (Supplementary Figure S1B). p53-bound regions were significantly enriched with consensus p53-binding sites (p53-motif) in both differentiation and damage (P < 10−37 and P < 10−235, respectively, Figure 1D), a motif that is similar to the p53 consensus obtained from TRANSFAC (Figure 1C, Supplementary Figure S1D and Supplementary Table S1). Interestingly, sequences bound by p53 in pluripotent hESCs (untreated) did not generate a similarly high confidence, p53-consensus motif (P > 10−5, Figure 1D). Our finding of lower significance for p53 interactions with chromatin, in the absence of inductive signaling, is likely the result of unstable interactions by low levels of p53 in pluripotent hESCs (5). These findings are also consistent with a model proposed by Prives and colleagues (33). In this scenario, basal p53, lacking stimulus-dependent post-translational modifications and present at low concentration, scans and interacts with p53 response element (p53RE) sequences with a high on-off rate. These sites, where p53 interaction may be low-affinity/high off-rate but sufficient for cross-linking in ChIP, display similar parameters of relative distance to gene TSS, histone marks and chromatin accessibility (DNaseI) as p53 sites of treated hESCs (data not shown). Basal p53 interactions with chromatin are unlikely productive with regards to transcription regulation; hence, we did not consider these data for further analyses.
Figure 1.

Genome-wide mapping of p53 in hESC reveal distinct functional binding sites. (A) Comparison of genome occupancy of p53 in untreated, differentiation (RA 2 days) and damage (Adriamycin: Adr 6 h) induced hESCs. (B) Average PhastCons score profiles depicting conservation in the vicinity of p53-binding sites and randomly generated genomic loci (purple). (C and D) Associated p53, OCT4-SOX2 motifs within p53 enriched sites. (C) p53 and OCT4 consensus motif sequence from TRANSFAC database (top) and matching enriched motifs under p53 peaks (bottom). (D) The OCT4 motif is enriched in p53-bound regions in cells undergoing differentiation, but not in response to damage.
Interestingly, high confidence p53-bound regions in hESCs undergoing differentiation were significantly enriched in OCT4- and SOX2-binding motifs (P < 10−16 and P < 10−12, respectively) (Figure 1C and D), whereas no OCT4-SOX2 motifs were found in p53-bound genomic regions in hESCs exposed to damage or untreated (Figure 1C and D). Reciprocal analysis of OCT4-SOX2 and NANOG-enriched sites in pluripotent hESCs, using previously published ChIP-Seq data sets (13), revealed overlapping p53 response elements (p53REs) in both data sets (Supplementary Figure S1E). Thus, the presence of consensus binding motifs for OCT4 and SOX2 in p53-bound regions, and vice-versa, suggests a possible interplay between these transcription factors in determination of specific stem cell states.
p53 targets developmental transcription factors during differentiation
Across the genome, a significant portion of p53-binding sites (42% for +RA and 28% for +Adr) are enriched (weighted binding coefficient of 0.68-fold for +RA and 0.61-fold for +Adr compared with randomized binding sites) (23) within 10 kb of the nearest annotated TSS (Supplementary Figure S2B). Therefore, we used a 10 kb window of distance from the p53-peak summit to the nearest gene TSS to define a p53 target gene (Figure 2A). Gene comparison analysis revealed only 22% overlap in identity (717 genes) between damage (1326 genes) and differentiation (3172 genes) (Figure 2A), suggesting distinct roles for p53 dependent on cellular environment. GO analysis revealed a striking distinction between genes regulated by p53 during differentiation versus damage (Figure 2B). During differentiation, a majority of p53-target genes is associated with functions in development and transcription regulation (P < 10−6). In contrast, damage-specific p53-gene targets are primarily linked to cell migration and motility (P < 10−4), as determined by GO analysis of each set of stimulus-specific gene targets (Figure 2B and Supplementary Table S2). Highly studied p53-regulated genes with functions in cell death and cell cycle, e.g. CDKN1A, MDM2, are significantly represented (P < 10−6) in p53-bound genes common to both differentiation and damage (Figure 2B).
Figure 2.

p53 targets developmental transcription factors during differentiation. (A) Numbers of distinct and overlapping p53-target genes in hESCs undergoing differentiation and DNA damage. (B) GO term analysis revealed significant and diverse functions of p53 downstream target genes that are specific or shared in response to each treatment. (C) Enrichment analysis of protein domains encoded by p53 downstream targets. Top categories from each data set are listed. (D) Gene families of developmental transcription factors are targets of p53 during differentiation. p53 (green circle) regulation is linked to individual transcription factors (cyan circles), shown grouped by family.
Next, we determined enrichment of protein domains encoded by p53-target genes in each condition using InterPro terms of the GREAT functional annotation tool. Homeobox domains were revealed as differentiation targets (P < 10−13), and the broad classification of EGF-like domains was enriched across damage-specific p53 targets (P < 10−6) (Figure 2C). Several transcription factors that regulate specification and development are highly represented as differentiation targets (Figure 2D and Supplementary Table S3). These include members of the HOX gene family, which are activated as an early response to RA (34); LIM homeobox (LHX) genes, which are involved in embryonic development and specifically neuronal differentiation (35); the forkhead box (FOX) family of genes, which are involved in axial patterning and tissue development from all three germ layers (36); the sex-determining region-Y box (SOX) gene family that regulates cell-fate specification (37); and, Zic family members (ZIC) that are important during neuronal development, mutations of which cause a wide variety of congenital malformations (38) (Figure 2D and Supplementary Table S3). These findings suggest that, during differentiation of hESCs, the regulatory influence of p53 is extensive and amplified by targeting transcription factors that promote a committed cellular state.
p53-binding sites coincide with ESC transcription factors during differentiation
Specific developmental genes, which are inactive in pluripotent ESCs and activated early during differentiation, have been described as ‘poised’, owing to sequence-specific binding of core pluripotency factors (OCT4, SOX2 and NANOG) within chromatin enriched in bivalent histone modifications: both repressive H3K27me3 and activation-associated H3K4me3 (18,39). The bivalent state of chromatin is thought to predispose poised genes, e.g. HOX genes, with major roles in differentiation for rapid response to differentiation signals. A circular plot of human chromosomes 2, 7, 12 and 17, representing a ∼100 kb region of each of four HOX gene clusters, was used to illustrate enrichment of OCT4, NANOG and H3K27me3 in pluripotent hESCs (Figure 3A). When we compared sites of p53 binding (induced by RA or Adr) to OCT4, NANOG and H3K27me3 enrichment across the HOX genes, we saw that RA-induced p53 binds (20 binding sites for 11 genes) in and around the poised HOX genes during differentiation; whereas, in contrast, there is only one p53-bound site induced by DNA damage at these loci, and this lies outside regions of OCT4/NANOG binding.
Figure 3.
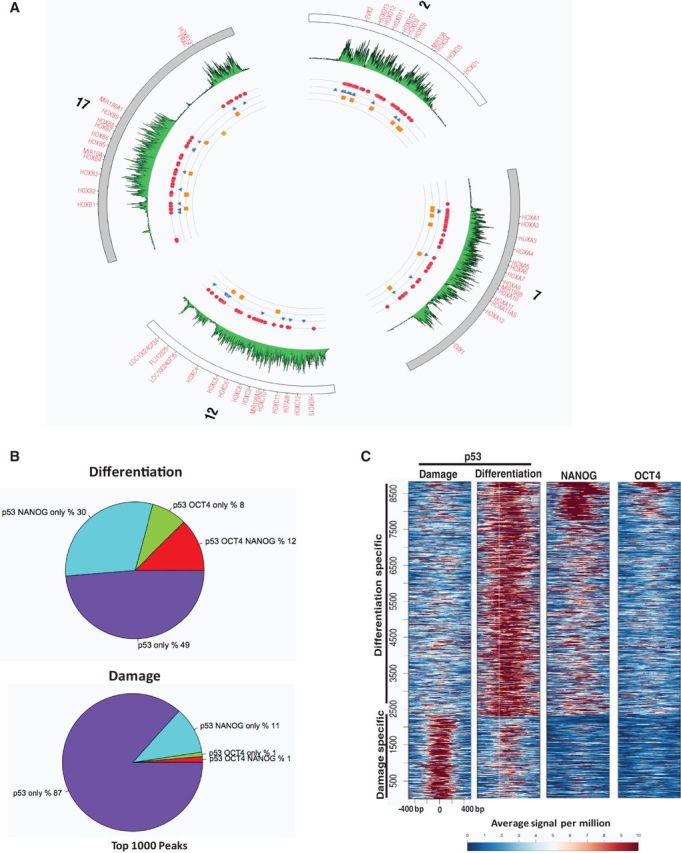
p53-binding sites coincide with ESC transcription factors during differentiation. (A) Circos plot of four human HOX gene clusters showing differential binding patterns of OCT4 (blue), NANOG (red), p53 (damage:yellow, differentiation:orange) and H3K27me3 (green). Numbers outside the circle is for specific human chromosome. (B) Overlap of p53 occupancy with OCT4 and NANOG in hESCs undergoing differentiation or damage. (C) Heat map of binding signals of p53, OCT4 and NANOG within −500 bp to +500 bp of p53 peak summits.
Overlap between RA-induced p53 and pluripotency-associated OCT4 and NANOG-binding sites is widespread across the genome, as ∼50% of the 1000 highest confidence, differentiation-bound p53 sites are occupied by OCT4, NANOG or both in pluripotent hESCs; only a small fraction (∼12%) overlap with damage-specific p53 sites (Figure 3B and Supplementary Figure S3A). Co-occupancy analysis genome-wide showed a considerably higher ratio of p53:OCT4:NANOG overlap and stronger p53 peaks at differentiation- versus damage-induced binding sites (Supplementary Figure S3B). Heat map analysis revealed that there is a substantial enrichment of OCT4 and NANOG at genomic sites bound by p53 during hESC differentiation versus damage (Figure 3C). Binding profiles and comparison of p53 and NANOG peaks reveal that OCT4 enrichment at p53 peaks, established during differentiation, is of the same magnitude as at NANOG sites. However, NANOG enrichment is stronger at OCT4-binding sites than at sites bound by p53 (Supplementary Figure S3C). Taken together, this suggests that a specific subset of genes is kept in a repressed but poised state by OCT4/NANOG during pluripotency and, in response to RA, p53 occupies these genes to promote hESC differentiation. The lack of overlap between OCT4/NANOG binding in pluripotent hESCs and damage-induced p53 sites of binding, versus a high degree of overlap with differentiation-induced p53 sites, suggests that distinct mechanisms are involved in stimulus-specific p53-mediated regulation in hESCs.
Transcription of development genes is dependent on p53
To uncover the functional consequences of p53 interactions with chromatin, we performed microarray-based gene expression analysis of hESCs undergoing differentiation and integrated these data with our p53 ChIP-Seq data set (Figure 4A and B). Expression analysis revealed a total of 1220 up- and 1221 downregulated genes during differentiation of hESCs. Intersection with our p53 ChIP-Seq revealed that >25% of genes regulated during differentiation (262 down- and 361 upregulated) are bound by p53. Differentiation-specific p53 targets (198 down- and 271 upregulated) were assigned by eliminating genes also responsive to DNA damage (Figure 4A and B). GO analysis of RA downregulated p53 targets revealed that these genes are enriched for cell motion and mesodermal differentiation (Figure 4C). These genes include FOXO3: an essential activator of mesodermal marker Brachyury (40); KLF6: associated with hematopoiesis (41); chromatin modifiers HDAC5 and HDAC9: class II HDACs with critical functions in heart development (42); and, telomere repeat binding factor TERF1: a telomere maintenance factor associated with pluripotency (43) (highlighted in Figure 4A and Supplementary Table S4). RA upregulated p53 targets revealed significant (P < 10−5) representation in neuro-ectodermal development, embryonic morphogenesis and pattern specification categories (Figure 4C). These genes include homeobox domain genes (HOXA1, HOXA3, HHEX and HOXB1), developmental transcription factors (GATA2, LHX8, ZIC1 and TCF7L2) and RA nuclear receptors (RARA and RARB) (highlighted in Figure 4A). Several of these genes are repressed by Polycomb complexes and classified as poised by core pluripotency factors in pluripotent hESCs (17), but a role for p53 in their activation during differentiation has not previously been reported.
Figure 4.
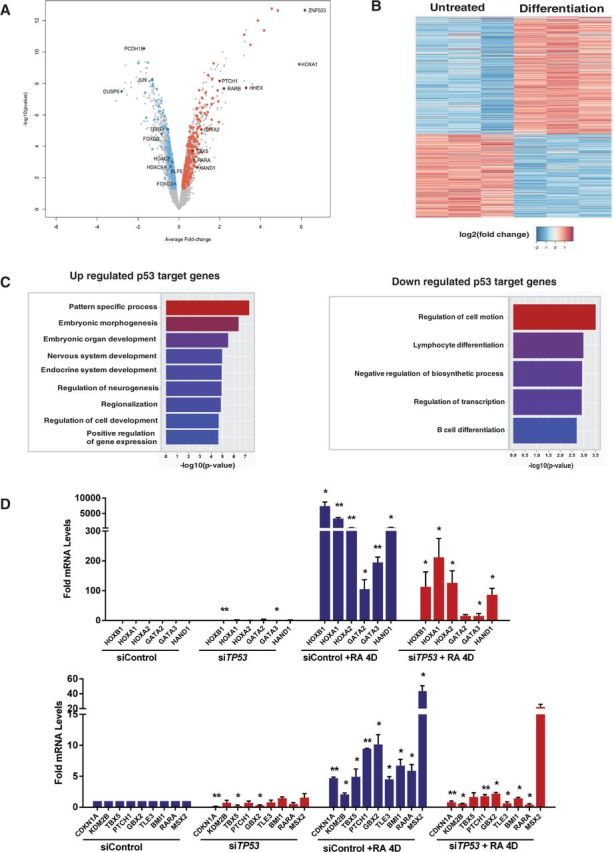
Transcription of development genes is dependent on p53. (A) Volcano plot of microarray gene-expression data. Each point corresponds to RefSeq gene; in RA-treated samples with average log2-fold change compared with pluripotent hESCs and negative log10 P-value scores. Colored points correspond to genes bound by p53: significantly up- (red) or downregulated (green) p53 targets are highlighted. Target genes overlapping with damage data sets are discarded. (B) Heat map, generated for differentiation-specific p53-target genes, reveals up- or downregulated targets during differentiation compared with pluripotent hESCs. (C) The GO term analysis of differentiation-specific up- or downregulated p53-target genes is shown. (D) RT-qPCR analyses of selected genes in hESCs after 4 days of RA treatment with TP53 or control non-targeting siRNA. Error bars represent SEM from three independent experiments (*P < 0.05, **P < 0.001). For determining statistical significance, data for untreated siTP53 are compared against untreated sicontrol; siControl + RA 4D treatment is compared with siControl; siTP53 + RA 4D treatment is compared with siControl + RA 4D.
We performed quantitative RNA and p53 ChIP-PCR analyses of selected genes to assess the impact and specificity of p53 binding (Figures 4 and 5). RA treatment for 2 days resulted in significant activation of genes belonging to HOX and GATA families (Supplementary Figure S4A). Four days of RA increased expression of these genes, as well as developmental transcription factors: TBX5, homeobox genes MSX2 and GBX2, hedgehog receptor PTCH1, Notch co-repressor TLE3, polycomb protein BMI1 and histone H3K36 demethylase KDM2B (Figure 4D). RA-mediated activation is dependent on p53, as hESCs transfected with siTP53 showed a significant reduction in activation of these genes with RA treatment compared with siControl. In contrast, p53 induction by DNA damage had no significant effect on these genes (Supplementary Figure S4A). Expression of CDKN1A and MDM2 was induced during both differentiation and damage in a p53-dependent manner (Supplementary Figure S4B).
Figure 5.
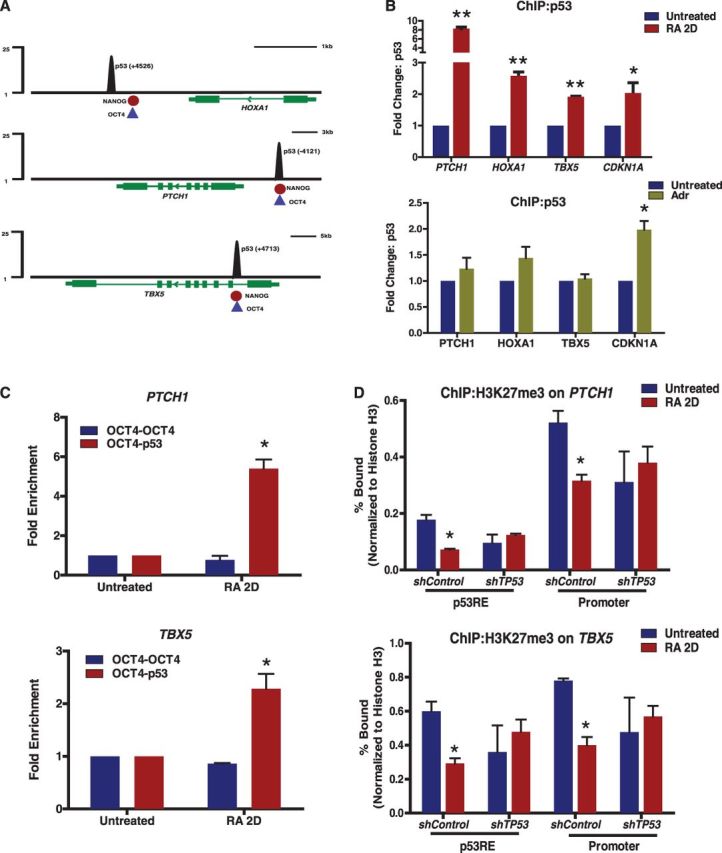
Enrichment of p53 at developmental genes results in activation. (A) Tracks represent normalized p53 sequence tag enrichments (numbers indicate distance from TSS). Binding location of NANOG (red) and OCT4 (blue) are shown at the bottom of the tracks. (B) ChIP-qPCR analysis of p53 occupancy at selected target genes during differentiation (top) or DNA damage (bottom). (C) p53 enrichment on OCT4 bound regions after sequential ChIPs. Quantitative PCR of chromatin fragments enriched by p53, OCT4 and sequential ChIP of hESCs, treated with RA for 2 days. DNA enrichments at indicated target genes were determined as fold change in percentage input, compared with untreated hESCs. (D) Histone H3K27me3 status on gene promoter or p53RE of PTCH1 and TBX5 in hESCs treated with RA for 2 days. Error bars represent s.d. from three independent experiments (*P < 0.05, **P < 0.001).
We obtained previously published OCT4 and NANOG ChIP-Seq data sets in hESCs from GEO database [(13), see ‘Materials and Methods’ section] and compared those with p53-enriched regions of the human genome to map OCT4, NANOG and p53-binding elements at specific developmental genes: HOXA1, PTCH1 and TBX5 (Figure 5A, schematic diagram). ChIP-qPCR analyses revealed significant enrichment of p53 binding, within 2 days of RA exposure, at the p53REs of PTCH1, HOXA1, TBX5 and CDKN1A (Figure 5B). Importantly, p53 enrichment at RA-specific genes, PTCH1, HOXA1 and TBX5, is little changed in response to DNA damage. Both differentiation and damage induce enriched p53 binding at CDKN1A and activation of p21 (CDKN1A) transcription (Figure 5B). We performed sequential ChIPs (re-ChIP) to assess whether OCT4 and p53 co-occupy or exclusively bind to their overlapping binding sites at PTCH1 and TBX5, where the distance between p53- and OCT4-binding sites is within the size range of our fragmented chromatin length (<500 bp), as diagrammed in Figure 5A. We assessed binding of p53 on OCT4-enriched chromatin fragments from hESCs treated with RA for 2 days and found that RA significantly induced p53 enrichment and co-occupancy at OCT4-associated regions of PTCH1 and TBX5 (Figure 5C), roughly equivalent to the increase in p53 association induced by RA (Figure 5B). The OCT4-OCT4 re-ChIP indicates equal efficiency of OCT4 binding to chromatin sites in both untreated and 2-day RA-treated hESCs. Our analysis indicates that, early in RA-mediated differentiation, co-occupancy of p53 and OCT4 occurs within the same region of chromatin and is consistent with activation of gene expression. Robust expression of these p53-target genes, as OCT4 protein levels decrease with differentiation, is likely dependent on alteration and activation of chromatin structure during differentiation.
p53 target genes lose repressive histone marks during differentiation
Developmental genes are held silent in pluripotent ESCs by repressive chromatin enriched in specific histone post-translational modifications (H3K27me3), which are lost during differentiation (18). We generated hESCs stably expressing non-target (shControl) or shRNA against p53 (shTP53) to determine whether RA-activated p53 had an impact on levels of H3K27me3 at the promoters and/or p53REs of PTCH1, TBX5 and CDKN1A (Figure 5D and Supplementary Figure S5). Stable integration of shTP53 resulted in substantial knockdown of p53 protein and failure to elicit an RA-response, as no reduction in AP staining and OCT4 protein was observed in shTP53-hESCs as compared with control (Supplementary Figure S5A and B). In response to RA, H3K27me3 levels are significantly reduced at PTCH1, TBX5 and CDKN1A loci (shControl), whereas no change in H3K27me3 levels were observed in hESCs stably depleted of p53 (shTP53) (Figure 5D and Supplementary Figure S5C). Together, these results suggest that RA-induced signals of differentiation mobilize p53 to bind and activate chromosomal locations, which are repressed but relatively accessible due to binding by OCT4/NANOG in pluripotent hESCs, and this p53 binding alters chromatin status during differentiation.
We tested this hypothesis by categorizing differentially expressed, p53-dependent gene targets as those with overlapping p53, OCT4 and/or NANOG-binding sites versus those bound by p53 only (Figure 6). Gene expression profiling revealed that although the average expression of the two sets are comparable, p53 gene targets that are shared with those bound by OCT4 and/or NANOG before differentiation are the most robustly changed (up- or downregulated) genes (Figure 6A and Supplementary Figure S6A). Consistent with the biological functions of all differentiation-specific p53 targets (Figure 4C), GO analysis for upregulated p53 targets with overlapping OCT4 and/or NANOG sites revealed genes responsible for pattern specification, embryonic morphogenesis and development (Figure 6B, and Supplementary Table S5). Downregulated p53 targets with overlapping OCT4 and/or NANOG sites are involved in mesodermal differentiation, metabolism and cell motion (Supplementary Figure S6B and Supplementary Table S5). On the other hand, p53-bound differentially expressed genes did not result in significant functional categories after GO analysis.
Figure 6.

p53 targets loss of repressive histone marks during differentiation. (A) Violin plots representing fold changes in expression of p53 targets upregulated during differentiation. Genes that have p53-binding sites overlapping with OCT4 and/or NANOG (p53_OCT4_NANOG) (blue); or only p53 binding sites (green). (B) The GO term analysis of overlapping targets of p53_OCT4_NANOG is shown. (C and D) Aggregate plots showing profiles of histone modifications around ± 2 kb from TSS of p53_OCT4_NANOG overlapping gene targets (C) and only p53 targets (D).
We performed ChIP-Seq for active (H3K4me3) or repressive (H3K27me3) histone marks in hESCs after 2 days of RA treatment, compared with pluripotent hESCs, to assess global changes in active versus repressed chromatin structure during differentiation of hESCs (Figure 6C and D). Profiling of averaged genome-wide histone modifications, 2 kb upstream and downstream of the TSS, confirmed that upregulated p53 targets, bound by OCT4 and/or NANOG in pluripotent hESCs, are highly enriched for bivalent histone marks (H3K4me3 and H3K27me3) before RA treatment. During differentiation, these p53/OCT4/NANOG-regulated genes exhibit marked loss of H3K27me3 and gain of H3K4me3 (Figure 6C). However, differentially expressed genes targeted by p53 and not OCT4 and NANOG, as well as repressed p53/OCT4/NANOG target genes, gain H3K4me3 marks without a substantial change in H3K27me3 status after RA treatment (Figure 6D and Supplementary Figure S6C and D). Taken together, these results suggest that p53 plays an active role in hESC differentiation and promotes expression of a group of genes associated with pattern specification, neurogenesis and organ development. These genes, destined for activation during differentiation of hESCs, have bivalent chromatin structure with OCT4 and/or NANOG bound in a pluripotent state and are likely activated by p53-mediated recruitment of chromatin modifying complexes that reduce repressive histone marks.
p53 interacts with H3K27me3 demethylases to induce expression of poised genes
To uncover p53-mediated reduction of H3K27me3 at the promoters of developmentally poised genes, we determined whether p53 interacts with H3K27me3-specific demethylases in hESCs (Figure 7). UTX and JMJD3 specifically demethylate H3K27me3/me2 and are members of the JmjC-domain-containing family (44,45). Expression analysis during hESC differentiation revealed <2-fold, but statistically significant, induction of UTX after 5 days of RA treatment, and no obvious effect of RA on EZH2 (an H3K27 methyl transferase) expression (Supplementary Figure S7A). During the same time course, expression of JMJD3 was significantly induced as early as 2 days of RA treatment (Figure 7A and Supplementary Figure S7A). JMJD3 expression during differentiation of hESCs is partly dependent on p53, as JMJD3 induction was impaired in hESCs depleted of TP53 (Figure 7A). Analysis of proteins stably bound to fractionated chromatin, prepared from hESCs undergoing RA-induced differentiation during a time course of 5 days, revealed a marked enrichment of p53, UTX and JMJD3 that coincides with concomitant reduction of OCT4 (Figure 7B). Co-immunoprecipitation analyses of these chromatin fractions show that p53 interactions with UTX and JMJD3 are increased after RA-treatment (Figure 7C), suggesting that p53 binding to chromatin may enrich H3K37me3 demethylases at specific gene sites to alter chromatin structure.
Figure 7.

p53 interacts with JMJD3 and UTX. (A) RT-qPCR analyses of EZH2, UTX and JMJD3 in hESCs after 2 or 4 days of RA treatment with TP53 or control non-targeting siRNA. Error bars represent SEM from three independent experiments (*P < 0.05). (B) Chromatin fractions from hESCs undergoing RA-induced differentiation for 5 days were analyzed by western blotting. (C) Co-immunoprecipitation. Chromatin fractions from hESCs were immunoprecipitated with p53, UTX or JMJD3 antibodies and analyzed by western blotting (*Background IgG heavy chain). (D) ChIP-qPCR analysis of UTX occupancy at PTCH1 and TBX5 promoter in hESCs treated with RA for 2 days. Error bars represent s.d. from three independent experiments (*P < 0.05).
Recent reports suggest that UTX is required for proper differentiation (46,47), and both JMJD3 and UTX are actively involved in removing H3K27me3 marks for activation of the HOXA gene cluster (44,48). Consistent with these reports, we observed UTX enrichment on HOXA1 and HOXA2 promoters, associated with a significant reduction in H3K27me3 mark during RA-induced differentiation of hESCs (Supplementary Figure S7B and C). In response to RA, UTX is significantly enriched at PTCH1, TBX5 and HOXA1 loci (shControl), whereas no change in UTX enrichment was observed in hESCs stably depleted of p53 (shTP53) (Figure 7D and Supplementary Figure S7D). These results, combined with those summarized in Figures 5 and 6, suggest that p53 recruits H3K27me3 specific demethylases to modify repressive chromatin structure of poised genes and favor gene activation during hESC differentiation.
Divergence in p53 transcription functions between mouse and human ESCs
We determined whether our findings on p53’s role in differentiation of hESCs are evolutionarily conserved by comparison with p53 functions in mESCs at a molecular level. Recent studies support evolutionary divergence in the functions of transcription factors by similar comparisons of mESCs and hESCs (13,14). In mESCs, p53 was reported as a direct repressor of Nanog expression in response to DNA damage, suggesting a potential role for p53 during mESC differentiation (3). Recently, by comparing global p53 chromatin-interaction maps and gene expression analyses, Huang and colleagues showed that p53 both activates differentiation-associated genes and represses stem cell-specific genes in response to DNA damage in mESCs (49). This is in contrast to the highly distinct, DNA damage- and differentiation-induced profiles of p53 interactions with chromatin and regulation of gene expression in hESCs, reported here. To determine whether this is an example of interspecies disparity in p53 transcriptional functions, we compared genome wide p53–chromatin interaction data sets, generated by analysis of mESCs undergoing DNA damage (49), to our p53-chromatin binding profiles in hESCs, both in response to DNA damage and RA-mediated differentiation (Figure 8). We analyzed the mESCs p53 ChIP-Seq data by the same method as used for p53 peak calling in hESCs and found 39150 significantly enriched genomic regions, 28032 of which have homologous sequences in the human genome (Supplementary Figure S8A). Evolutionary conservation profiling of the genomic sequences for these identified regions revealed that p53-peak summits in mESCs or their homologous counterparts in human genome are conserved among 44-vertebrate species compared across 3 kb of flanking DNA (Supplementary Figure S8A). We used a 10 kb window of distance from the p53-peak summit to the nearest mouse gene TSS to call a p53 target gene. The p53 binding sites that are homologous within the human genome (28 032) correspond to 5717 genes (Supplementary Figure S8B). We then compared p53-target genes in mESC to those in hESCs and classified them as genes with ‘conserved’ (homologous genes with aligned p53 bound region) or ‘turnover’ (homologous genes with unaligned p53 bound region) p53-binding sites, as described previously (32). Approximately 20–25% of all p53-target genes, during hESC damage or differentiation, have either conserved or turnover p53-sites when compared with targets of p53 during mESC damage (Figure 8A). A comparison of these two gene categories (conserved or turnover) revealed that most targets of human p53 (differentiation or damage) match to those of mouse p53 (damage) (Figure 8B). GO functional annotation analysis revealed that p53 targets, conserved between mouse and human irrespective of treatment (170 genes), are mostly enriched in canonical p53-mediated cell cycle arrest and cell death pathways. Interestingly, the conserved p53 targets common to hES differentiation and mES damage (486 genes) are mostly enriched for gene expression, embryonic morphogenesis and differentiation (Figure 8C and Supplementary Table S6). Similarly, the turnover p53 targets common between hES differentiation and mES damage (501 genes) are highly enriched for transcription, embryonic morphogenesis and differentiation (Figure 8C and Supplementary Table S6). These comparative location analyses suggest that p53 transcriptional activity diverges amongst different species; p53 activates developmental genes in hESC undergoing active differentiation, whereas p53 activates a similar transcription program in mESC exposed to DNA damage.
Figure 8.
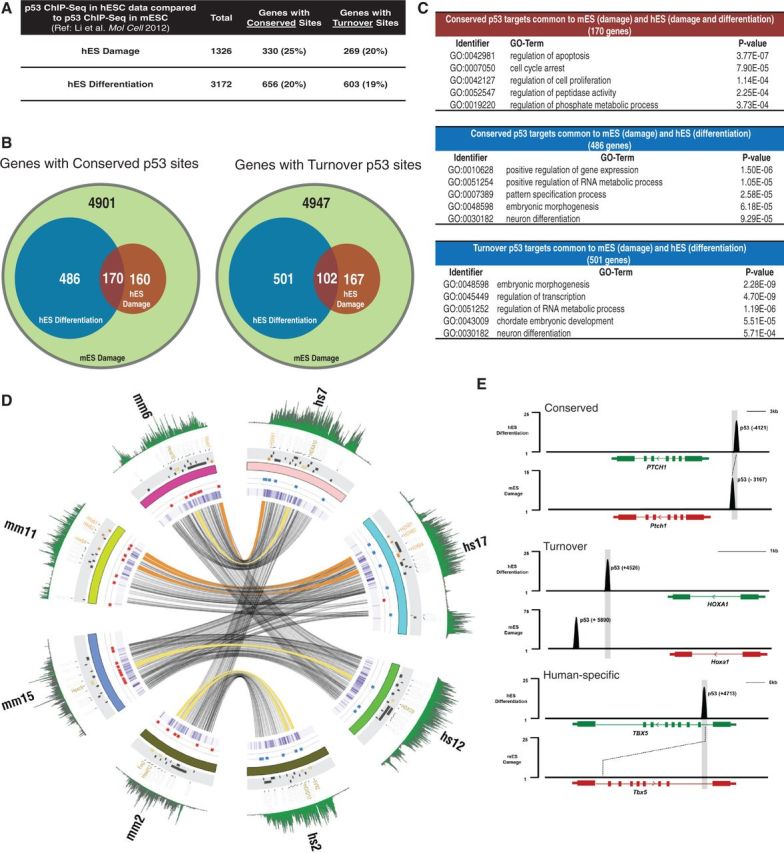
Comparison of p53-mediated transcriptional regulation of developmental genes in mouse and human ESCs. (A) Target genes are classified as ‘Conserved’ or ‘Turnover’ based on p53-binding sites to corresponding aligned regions in human and mouse genome. p53 binds to align regions in two species at Conserved targets; however, when p53 binding sites on orthologous genes do not align, those targets are categorized as Turnover genes. (B and C) Numbers of distinct and overlapping p53-target genes in mESCs during DNA damage (green) (49) with hESCs undergoing differentiation (blue) or DNA damage (red) and enriched GO-terms for each subset (C). (D) Circos plot of four human (hs) and mouse (ms) HOX gene clusters (HOXA, B, D and C) showing species-specific differential binding patterns of p53 (damage:Red, differentiation:Blue). Ribbons show syntenic genomic locations between mouse and human (orange:Conserved p53-targets, Yellow:Turnover p53-targets). Green tracks represent repressive H3K27me3 marks around the displayed regions in mouse and human ESCs. Tiles (black, orange or yellow) show RefSeq HOX gene annotations. Purple heat map depicts the Phastcons scores around the displayed regions. Numbers outside the circle is for specific human (hs) and mouse (mm) chromosomes. (E) Tracks represent normalized p53 sequence tag enrichments in differentiating human (top) and DNA-damaged mouse (bottom) ES cells at PTCH1, HOXA1 and TBX5 genomic locations (numbers indicate distance from TSS).
As an example of p53 interactions at developmentally significant genes, we used Circos plot analysis of four highly conserved HOX-gene clusters (HOX-A, -B, -C and –D) in human (hs) and mouse (mm) to show that mouse p53 binds to several locations within Hox genes during DNA damage, whereas human p53 is enriched at multiple sites of HOX genes during differentiation not damage (Figure 8D). Interspecies gene target classification revealed that HOX genes are either conserved (orange ribbons) or turnover (yellow ribbons) p53 targets in ESCs (Figure 8D). We focused on p53-binding locations on several target genes (CDKN1A, HOXA, PTCH1 and TBX5) and observed that CDKN1A and PTCH1 are both conserved p53-targets, HOXA1 is a turnover p53 target in mouse and human, and TBX5 is human-specific p53 target (Figure 8E, diagram, and Supplementary Figure S8C, gene browser snapshots). Taken together, these results suggest that p53 induces differentiation in both human and mouse ESCs by activating a similar genetic program. In ESCs, mouse p53 actively induces differentiation-specific genes on exposure to DNA damage; whereas transcription functions of human p53 are largely specific for each inductive signaling program in hESCs.
DISCUSSION
Studies of p53 are numerous, but few are focused on non-transformed cells, where p53 may have regulatory roles that complement its surveillance functions; fewer still address roles for p53 in early differentiation (1). Genome-wide profiling and expression analyses show that RA-mediated p53-response is highly distinct from stress-responsive events occurring downstream of DNA damage in hESCs. We find that p53 promotes differentiation of hESCs by activating expression of developmental transcription factor genes involved in patterning, morphogenesis and organ development. This activated cascade of transcription factors amplifies the functional effects downstream of p53 induction beyond the transient time period when p53 protein is elevated (5). Differentiation-specific p53 gene targets in hESCs include several members of the homeodomain family (HOX, LHX, DLX, PAX) (34,35), the forkhead family of FOX genes (36), the SOX gene family (37) and members of the TBX family (50) of genes, all of which regulate a wide variety of developmental processes. In addition, p53 targets members of the CBX family, specifically CBX2 and CBX4, which are part of the Polycomb complex and are crucial for cell-fate determination (51). Our integration analysis reveals several p53 gene targets are downregulated during RA-mediated differentiation, including genes that direct mesodermal differentiation (FOXO3, KLF6, HDAC5, HDAC6) and telomere repeat binding factor TERF1, associated with pluripotency (43). RA signaling directs differentiation of ESCs along a neuro-ectodermal lineage (34). Taken together, p53 may play a role in lineage determination by RA-induced p53-mediated repression and activation of specific genes in hESCs.
Remarkably, more than half of the differentiation-induced p53-bound genomic sites are coincident with binding by either OCT4 or NANOG, or both, in pluripotent hESCs, suggesting that core pluripotency factors may ‘poise’ these genes for p53-mediated activation during the earliest stages of differentiation (18). Our expression analyses confirmed that specific developmental genes, e.g. HOXA1, PTCH1 and TBX5, previously reported to be in a poised state in pluripotent hESCs and essential in differentiation (52–54), are rapidly and highly upregulated during hESC differentiation in a p53-dependent manner. During differentiation, p53 is robustly enriched at the promoters of these genes, whereas OCT4 and NANOG remain bound. Sequential-ChIP analyses confirmed that p53 localizes to and co-occupies regions bound by OCT4. Whether OCT4 is temporally displaced by p53 at these sites to de-repress gene expression, or OCT4 plays a gene-specific role in initial activation of these genes, requires further study. A similar phenomenon has previously been reported for Sox17, which competes with Nanog for DNA binding to promote expression of development genes during differentiation of mESCs (55). Analysis of histone status around these specific genomic loci (PTCH1 and TBX5) revealed that these genes reside in repressed chromatin enriched in H3K27me3, which is decreased during differentiation of hESCs in a p53-dependent manner.
A comprehensive genome-wide analysis of H3K4me3 and H3K27me3 status indicated that a significant portion of p53 targets might be held in a poised state in pluripotent ESCs by bivalent histone modifications, which are altered during differentiation with a gain in H3K4me3 and loss of H3K27me3. Removal of H3K27me3 marks is a key step for developmental gene activation during embryonic development (44). Processes responsible for deposition of trimethylation marks on H3K27me3 mediated by polycomb repressive complex 2 (PRC2) have been extensively studied (17,56,57). However, the enzymes that remove methyl marks from H3K27me3 were identified relatively recently. Three members of JmjC-domain containing protein family, UTX, UTY and JMJD3, were reported to specifically demethylate H3K27me3/me2; however, UTY is not active in vitro (44,45,58). UTX and JMJD3 counteract Polycomb-mediated repression to induce gene expression required for proper cellular differentiation and development (44,46,47,59–62). In addition to catalyzing loss of repressive chromatin structure, JMJD3 has been implicated in transcriptional elongation of bivalent genes (62). Depletion of UTX impairs reprograming, whereas expression of JMJD3 acts as a barrier to generation of iPS cells, suggesting that precise maintenance of the H3K27me3 marks is crucial for cellular differentiation (63,64). Analysis of p53 interactions with H3K27me3 demethylases, enriched in fractionated chromatin of hESCs, revealed that p53 binding to UTX and JMJD3 is enhanced during differentiation. In parallel, UTX is enriched at development gene promoters (PTCH1, TBX5 and HOXA loci) in a p53-dependent manner, which is associated with depletion of H3K27me3 marks and subsequent transcriptional activation. This suggests that p53 plays a role in modifying chromatin structure at OCT4/NANOG-poised genes, in partnership with specific H3K27me3 demethylases, to activate a developmental transcription program.
Target genes conserved in both differentiation and DNA-damage response are active in the biological pathways of cell cycle regulation, cell motion and cell death response. This finding underscores the role that cell cycle control plays in hESCs (5) and complements a large body of work that shows the importance of cell death pathways in development and in blocking tumor progression (2). Ranked by significance, the next category of downstream p53 targets in both damage and differentiation is metabolism. Conservation of these gene targets adds to recent work linking p53 regulation and cellular metabolic pathways during both homeostasis and tumor progression (65,66).
Notably absent in our analysis of genome-wide interactions of p53 is any indication that p53 binds the NANOG gene during differentiation of hESCs. In both damage and differentiation of mESCs, p53 mediates repression of Nanog transcription (3). A recent report revealed that in response to DNA damage p53 both activates differentiation-associated genes and represses ES-specific genes in mESCs, although binding of p53 at Nanog was not found (49). We find that p53 targets a diverse set of genes during differentiation versus DNA damage, resulting in induction-specific outcomes that largely differ. The absence of p53 binding at genes encoding major stem cell factors in hESCs suggests that p53 does not directly repress pluripotency, supporting species-specific differences in p53 functions especially at the level of cell cycle and differentiation (5,15).
We compared our genome-wide p53–chromatin interaction profiles in hESCs undergoing differentiation or DNA damage to a p53 ChIP-Seq data set in mESC undergoing DNA damage, obtained from Li et al. (49). Interestingly, we observed that p53-targets during hESC differentiation substantially overlap with those activated in mESC during DNA damage. To determine whether a p53-binding event detected in one species occurred at a corresponding aligned region in a second species, the homologous p53-gene targets in human and mouse ESCs were categorized as ‘conserved’ (aligned) or ‘turnover’ (unaligned), as described previously (32). The overlapping p53-targets during differentiation in hESC and DNA damage in mESC are enriched for development-specific functional categories, such as gene expression, embryonic morphogenesis and differentiation. Our comparative location analyses reveal that p53 activates a specific transcription program to induce developmental gene expression in hESC undergoing differentiation or mESC exposed to DNA damage. This is suggestive of inter-species disparity in p53 transcription functions as demonstrated previously for tissue-specific transcription factors (FOXA2, HNF1A, HNF4A, HNF6A and CEBPA) (32,67). Species-specific divergence in gene expression signature (14) and OCT4 and NANOG-binding sites in human versus mouse ESCs (13,68) suggests possible differences in transcription factor functions in these cell types, which may reflect the developmental stage-specific programs in mESCs and hESCs (16). Overall, these observations support the notion that p53 is central in promoting cellular differentiation in both human and mouse ESCs. Based on these results and other studies that describe pro-differentiation effects of p53 (3,5), one might expect that deletion of p53 would have considerable impact on embryonic development. However, p53-null mice appear to develop normally, although with some problems, and p53-null hESCs contribute to all three germ layers during teratoma formation in Severe Combined Immunodeficiency (SCID) mice (69). Compensation by structurally related protein family members, p63 and p73, likely occurs (70), but it is incomplete, as detailed examination of p53-null mice reveals developmental anomalies and implantation defects (71,72) [reviewed in detail in (2)]. Whether p63 or p73 isoforms act in hESCs to regulate any or all of the downstream targets of p53 is unknown.
The p53-regulated gene signatures uncovered in pluripotent, damaged and differentiating hESCs showed that p53 has specific functions and target genes in opposing self-renewal versus maintenance of cellular surveillance. The most significant category of DNA damage-specific p53 gene targets in hESCs encompasses regulation and functions of cell migration and motility, characteristics associated with metastatic carcinomas (6). Further comparisons with other data sets reveal that DNA damage-induced targets of p53 in hESCs, colon cancer-derived cells (73) and normal fibroblasts (74) are strikingly different, suggesting that p53 interactions with chromatin are dictated by stress-specific upstream signaling and cellular microenvironment. How p53 functions are parsed among the genes that are important in development and those involved in guarding cellular integrity is not known, but likely involves the regulatory lexicon imposed by post-translational modifications of p53 and interactions with co-regulatory protein partners. The characteristics shared between specific cancers and stem cells (8), and the dysfunction of p53 in a majority of human cancers (9), support the need for greater understanding of mechanisms and pathways regulated by p53 in multiple types of stem cells.
SUPPLEMENTARY DATA
Supplementary Data are available at NAR Online.
FUNDING
Funding for open access charge: NIH [GM081627 to M.C.B. and A.J.C., CPRIT RP110471 to W.L.]; NCI Cancer Center Support Grant to the UT MD Anderson Cancer Center; the RNA Center Award of Excellence in RNAi and ncRNA Research from MDACC Center for RNA Interference and Non-Coding RNAs (to A.K.J.); and Odyssey Program and The Laura and John Arnold Foundation at the UT MD Anderson Cancer Center (to A.K.J.).
Conflict of interest statement. None declared.
Supplementary Material
ACKNOWLEDGEMENTS
The authors thank the hESC core facility at Baylor College of Medicine for materials. They thank Chunlei Jin for help in generating hESCs stably expressing shRNAs, Zeynep Coban Akdemir for help with computational analysis and Dr Min Gyu Lee for ChIP grade UTX antibody, and are grateful to members of their laboratories for help with this work.
REFERENCES
- 1.Vousden KH, Prives C. Blinded by the light: the growing complexity of p53. Cell. 2009;137:413–431. doi: 10.1016/j.cell.2009.04.037. [DOI] [PubMed] [Google Scholar]
- 2.Spike BT, Wahl GM. p53, Stem Cells, and Reprogramming: tumor suppression beyond guarding the genome. Genes Cancer. 2011;2:404–419. doi: 10.1177/1947601911410224. [DOI] [PMC free article] [PubMed] [Google Scholar]
- 3.Lin T, Chao C, Saito S, Mazur SJ, Murphy ME, Appella E, Xu Y. p53 induces differentiation of mouse embryonic stem cells by suppressing Nanog expression. Nat. Cell. Biol. 2005;7:165–171. doi: 10.1038/ncb1211. [DOI] [PubMed] [Google Scholar]
- 4.Meletis K, Wirta V, Hede SM, Nister M, Lundeberg J, Frisen J. p53 suppresses the self-renewal of adult neural stem cells. Development. 2006;133:363–369. doi: 10.1242/dev.02208. [DOI] [PubMed] [Google Scholar]
- 5.Jain AK, Allton K, Iacovino M, Mahen E, Milczarek RJ, Zwaka TP, Kyba M, Barton MC. p53 regulates cell cycle and microRNAs to promote differentiation of human embryonic stem cells. PLoS Biol. 2012;10:e1001268. doi: 10.1371/journal.pbio.1001268. [DOI] [PMC free article] [PubMed] [Google Scholar]
- 6.Mizuno H, Spike BT, Wahl GM, Levine AJ. Inactivation of p53 in breast cancers correlates with stem cell transcriptional signatures. Proc. Natl Acad. Sci. USA. 2010;107:22745–22750. doi: 10.1073/pnas.1017001108. [DOI] [PMC free article] [PubMed] [Google Scholar]
- 7.Zhao Z, Zuber J, Diaz-Flores E, Lintault L, Kogan SC, Shannon K, Lowe SW. p53 loss promotes acute myeloid leukemia by enabling aberrant self-renewal. Genes Dev. 2010;24:1389–1402. doi: 10.1101/gad.1940710. [DOI] [PMC free article] [PubMed] [Google Scholar]
- 8.Kim J, Orkin SH. Embryonic stem cell-specific signatures in cancer: insights into genomic regulatory networks and implications for medicine. Genome Med. 2011;3:75. doi: 10.1186/gm291. [DOI] [PMC free article] [PubMed] [Google Scholar]
- 9.Olivier M, Hollstein M, Hainaut P. TP53 mutations in human cancers: origins, consequences, and clinical use. Cold Spring Harb. Perspect. Biol. 2010;2:a001008. doi: 10.1101/cshperspect.a001008. [DOI] [PMC free article] [PubMed] [Google Scholar]
- 10.Menendez S, Camus S, Izpisua Belmonte JC. p53: guardian of reprogramming. Cell Cycle. 2010;9:3887–3891. doi: 10.4161/cc.9.19.13301. [DOI] [PubMed] [Google Scholar]
- 11.Krizhanovsky V, Lowe SW. Stem cells: the promises and perils of p53. Nature. 2009;460:1085–1086. doi: 10.1038/4601085a. [DOI] [PMC free article] [PubMed] [Google Scholar]
- 12.Hanna J, Saha K, Pando B, van Zon J, Lengner CJ, Creyghton MP, van Oudenaarden A, Jaenisch R. Direct cell reprogramming is a stochastic process amenable to acceleration. Nature. 2009;462:595–601. doi: 10.1038/nature08592. [DOI] [PMC free article] [PubMed] [Google Scholar]
- 13.Kunarso G, Chia NY, Jeyakani J, Hwang C, Lu X, Chan YS, Ng HH, Bourque G. Transposable elements have rewired the core regulatory network of human embryonic stem cells. Nat. Genet. 2010;42:631–634. doi: 10.1038/ng.600. [DOI] [PubMed] [Google Scholar]
- 14.Wei CL, Miura T, Robson P, Lim SK, Xu XQ, Lee MY, Gupta S, Stanton L, Luo Y, Schmitt J, et al. Transcriptome profiling of human and murine ESCs identifies divergent paths required to maintain the stem cell state. Stem Cells. 2005;23:166–185. doi: 10.1634/stemcells.2004-0162. [DOI] [PubMed] [Google Scholar]
- 15.Li VC, Ballabeni A, Kirschner MW. Gap 1 phase length and mouse embryonic stem cell self-renewal. Proc. Natl Acad. Sci. USA. 2012;109:12550–12555. doi: 10.1073/pnas.1206740109. [DOI] [PMC free article] [PubMed] [Google Scholar]
- 16.Tesar PJ, Chenoweth JG, Brook FA, Davies TJ, Evans EP, Mack DL, Gardner RL, McKay RD. New cell lines from mouse epiblast share defining features with human embryonic stem cells. Nature. 2007;448:196–199. doi: 10.1038/nature05972. [DOI] [PubMed] [Google Scholar]
- 17.Lee TI, Jenner RG, Boyer LA, Guenther MG, Levine SS, Kumar RM, Chevalier B, Johnstone SE, Cole MF, Isono K, et al. Control of developmental regulators by Polycomb in human embryonic stem cells. Cell. 2006;125:301–313. doi: 10.1016/j.cell.2006.02.043. [DOI] [PMC free article] [PubMed] [Google Scholar]
- 18.Young RA. Control of the embryonic stem cell state. Cell. 2011;144:940–954. doi: 10.1016/j.cell.2011.01.032. [DOI] [PMC free article] [PubMed] [Google Scholar]
- 19.Zhang Y, Liu T, Meyer CA, Eeckhoute J, Johnson DS, Bernstein BE, Nusbaum C, Myers RM, Brown M, Li W, et al. Model-based analysis of ChIP-Seq (MACS) Genome Biol. 2008;9:R137. doi: 10.1186/gb-2008-9-9-r137. [DOI] [PMC free article] [PubMed] [Google Scholar]
- 20.Shin H, Liu T, Manrai AK, Liu XS. CEAS: cis-regulatory element annotation system. Bioinformatics. 2009;25:2605–2606. doi: 10.1093/bioinformatics/btp479. [DOI] [PubMed] [Google Scholar]
- 21.Machanick P, Bailey TL. MEME-ChIP: motif analysis of large DNA datasets. Bioinformatics. 2011;27:1696–1697. doi: 10.1093/bioinformatics/btr189. [DOI] [PMC free article] [PubMed] [Google Scholar]
- 22.McLeay RC, Bailey TL. Motif Enrichment Analysis: a unified framework and an evaluation on ChIP data. BMC Bioinformatics. 2010;11:165. doi: 10.1186/1471-2105-11-165. [DOI] [PMC free article] [PubMed] [Google Scholar]
- 23.Klisch TJ, Xi Y, Flora A, Wang L, Li W, Zoghbi HY. In vivo Atoh1 targetome reveals how a proneural transcription factor regulates cerebellar development. Proc. Natl Acad. Sci. USA. 2011;108:3288–3293. doi: 10.1073/pnas.1100230108. [DOI] [PMC free article] [PubMed] [Google Scholar]
- 24.Huang da W, Sherman BT, Tan Q, Collins JR, Alvord WG, Roayaei J, Stephens R, Baseler MW, Lane HC, Lempicki RA. The DAVID Gene Functional Classification Tool: a novel biological module-centric algorithm to functionally analyze large gene lists. Genome Biol. 2007;8:R183. doi: 10.1186/gb-2007-8-9-r183. [DOI] [PMC free article] [PubMed] [Google Scholar]
- 25.McLean CY, Bristor D, Hiller M, Clarke SL, Schaar BT, Lowe CB, Wenger AM, Bejerano G. GREAT improves functional interpretation of cis-regulatory regions. Nat. Biotechnol. 2010;28:495–501. doi: 10.1038/nbt.1630. [DOI] [PMC free article] [PubMed] [Google Scholar]
- 26.Krzywinski M, Schein J, Birol I, Connors J, Gascoyne R, Horsman D, Jones SJ, Marra MA. Circos: an information aesthetic for comparative genomics. Genome Res. 2009;19:1639–1645. doi: 10.1101/gr.092759.109. [DOI] [PMC free article] [PubMed] [Google Scholar]
- 27.Myers RM, Stamatoyannopoulos J, Snyder M, Dunham I, Hardison RC, Bernstein BE, Gingeras TR, Kent WJ, Birney E, Wold B, et al. A user's guide to the encyclopedia of DNA elements (ENCODE) PLoS Biol. 2011;9:e1001046. doi: 10.1371/journal.pbio.1001046. [DOI] [PMC free article] [PubMed] [Google Scholar]
- 28.Irizarry RA, Hobbs B, Collin F, Beazer-Barclay YD, Antonellis KJ, Scherf U, Speed TP. Exploration, normalization, and summaries of high density oligonucleotide array probe level data. Biostatistics. 2003;4:249–264. doi: 10.1093/biostatistics/4.2.249. [DOI] [PubMed] [Google Scholar]
- 29.Allton K, Jain AK, Herz HM, Tsai WW, Jung SY, Qin J, Bergmann A, Johnson RL, Barton MC. Trim24 targets endogenous p53 for degradation. Proc. Natl Acad. Sci. USA. 2009;106:11612–11616. doi: 10.1073/pnas.0813177106. [DOI] [PMC free article] [PubMed] [Google Scholar]
- 30.Wysocka J, Reilly PT, Herr W. Loss of HCF-1-chromatin association precedes temperature-induced growth arrest of tsBN67 cells. Mol. Cell. Biol. 2001;21:3820–3829. doi: 10.1128/MCB.21.11.3820-3829.2001. [DOI] [PMC free article] [PubMed] [Google Scholar]
- 31.Marks H, Chow JC, Denissov S, Francoijs KJ, Brockdorff N, Heard E, Stunnenberg HG. High-resolution analysis of epigenetic changes associated with X inactivation. Genome Res. 2009;19:1361–1373. doi: 10.1101/gr.092643.109. [DOI] [PMC free article] [PubMed] [Google Scholar]
- 32.Odom DT, Dowell RD, Jacobsen ES, Gordon W, Danford TW, MacIsaac KD, Rolfe PA, Conboy CM, Gifford DK, Fraenkel E. Tissue-specific transcriptional regulation has diverged significantly between human and mouse. Nat. Genet. 2007;39:730–732. doi: 10.1038/ng2047. [DOI] [PMC free article] [PubMed] [Google Scholar]
- 33.Beckerman R, Prives C. Transcriptional regulation by p53. Cold Spring Harb. Perspect. Biol. 2010;2:a000935. doi: 10.1101/cshperspect.a000935. [DOI] [PMC free article] [PubMed] [Google Scholar]
- 34.Gudas LJ, Wagner JA. Retinoids regulate stem cell differentiation. J. Cell Physiol. 2011;226:322–330. doi: 10.1002/jcp.22417. [DOI] [PMC free article] [PubMed] [Google Scholar]
- 35.Hobert O, Westphal H. Functions of LIM-homeobox genes. Trends Genet. 2000;16:75–83. doi: 10.1016/s0168-9525(99)01883-1. [DOI] [PubMed] [Google Scholar]
- 36.Lehmann OJ, Sowden JC, Carlsson P, Jordan T, Bhattacharya SS. Fox's in development and disease. Trends Genet. 2003;19:339–344. doi: 10.1016/S0168-9525(03)00111-2. [DOI] [PubMed] [Google Scholar]
- 37.Schepers GE, Teasdale RD, Koopman P. Twenty pairs of sox: extent, homology, and nomenclature of the mouse and human sox transcription factor gene families. Dev. Cell. 2002;3:167–170. doi: 10.1016/s1534-5807(02)00223-x. [DOI] [PubMed] [Google Scholar]
- 38.Merzdorf CS. Emerging roles for zic genes in early development. Dev. Dyn. 2007;236:922–940. doi: 10.1002/dvdy.21098. [DOI] [PubMed] [Google Scholar]
- 39.Bernstein BE, Mikkelsen TS, Xie X, Kamal M, Huebert DJ, Cuff J, Fry B, Meissner A, Wernig M, Plath K, et al. A bivalent chromatin structure marks key developmental genes in embryonic stem cells. Cell. 2006;125:315–326. doi: 10.1016/j.cell.2006.02.041. [DOI] [PubMed] [Google Scholar]
- 40.Zhang X, Yalcin S, Lee DF, Yeh TY, Lee SM, Su J, Mungamuri SK, Rimmele P, Kennedy M, Sellers R, et al. FOXO1 is an essential regulator of pluripotency in human embryonic stem cells. Nat. Cell. Biol. 2011;13:1092–1099. doi: 10.1038/ncb2293. [DOI] [PMC free article] [PubMed] [Google Scholar]
- 41.Matsumoto N, Kubo A, Liu H, Akita K, Laub F, Ramirez F, Keller G, Friedman SL. Developmental regulation of yolk sac hematopoiesis by Kruppel-like factor 6. Blood. 2006;107:1357–1365. doi: 10.1182/blood-2005-05-1916. [DOI] [PMC free article] [PubMed] [Google Scholar]
- 42.Chang S, McKinsey TA, Zhang CL, Richardson JA, Hill JA, Olson EN. Histone deacetylases 5 and 9 govern responsiveness of the heart to a subset of stress signals and play redundant roles in heart development. Mol. Cell. Biol. 2004;24:8467–8476. doi: 10.1128/MCB.24.19.8467-8476.2004. [DOI] [PMC free article] [PubMed] [Google Scholar]
- 43.Karlseder J, Kachatrian L, Takai H, Mercer K, Hingorani S, Jacks T, de Lange T. Targeted deletion reveals an essential function for the telomere length regulator Trf1. Mol. Cell. Biol. 2003;23:6533–6541. doi: 10.1128/MCB.23.18.6533-6541.2003. [DOI] [PMC free article] [PubMed] [Google Scholar]
- 44.Agger K, Cloos PA, Christensen J, Pasini D, Rose S, Rappsilber J, Issaeva I, Canaani E, Salcini AE, Helin K. UTX and JMJD3 are histone H3K27 demethylases involved in HOX gene regulation and development. Nature. 2007;449:731–734. doi: 10.1038/nature06145. [DOI] [PubMed] [Google Scholar]
- 45.Hong S, Cho YW, Yu LR, Yu H, Veenstra TD, Ge K. Identification of JmjC domain-containing UTX and JMJD3 as histone H3 lysine 27 demethylases. Proc. Natl Acad. Sci. USA. 2007;104:18439–18444. doi: 10.1073/pnas.0707292104. [DOI] [PMC free article] [PubMed] [Google Scholar]
- 46.Welstead GG, Creyghton MP, Bilodeau S, Cheng AW, Markoulaki S, Young RA, Jaenisch R. X-linked H3K27me3 demethylase Utx is required for embryonic development in a sex-specific manner. Proc. Natl Acad. Sci. USA. 2012;109:13004–13009. doi: 10.1073/pnas.1210787109. [DOI] [PMC free article] [PubMed] [Google Scholar]
- 47.Morales Torres C, Laugesen A, Helin K. Utx is required for proper induction of ectoderm and mesoderm during differentiation of embryonic stem cells. PLoS One. 2013;8:e60020. doi: 10.1371/journal.pone.0060020. [DOI] [PMC free article] [PubMed] [Google Scholar]
- 48.Shahhoseini M, Taghizadeh Z, Hatami M, Baharvand H. Retinoic acid dependent histone 3 demethylation of the clustered HOX genes during neural differentiation of human embryonic stem cells. Biochem. Cell Biol. 2013;91:116–122. doi: 10.1139/bcb-2012-0049. [DOI] [PubMed] [Google Scholar]
- 49.Li M, He Y, Dubois W, Wu X, Shi J, Huang J. Distinct regulatory mechanisms and functions for p53-activated and p53-repressed DNA damage response genes in embryonic stem cells. Mol. Cell. 2012;46:30–42. doi: 10.1016/j.molcel.2012.01.020. [DOI] [PMC free article] [PubMed] [Google Scholar]
- 50.Showell C, Binder O, Conlon FL. T-box genes in early embryogenesis. Dev. Dyn. 2004;229:201–218. doi: 10.1002/dvdy.10480. [DOI] [PMC free article] [PubMed] [Google Scholar]
- 51.Morey L, Helin K. Polycomb group protein-mediated repression of transcription. Trends Biochem. Sci. 2010;35:323–332. doi: 10.1016/j.tibs.2010.02.009. [DOI] [PubMed] [Google Scholar]
- 52.Martinez-Ceballos E, Gudas LJ. Hoxa1 is required for the retinoic acid-induced differentiation of embryonic stem cells into neurons. J. Neurosci. Res. 2008;86:2809–2819. doi: 10.1002/jnr.21729. [DOI] [PubMed] [Google Scholar]
- 53.Maye P, Becker S, Siemen H, Thorne J, Byrd N, Carpentino J, Grabel L. Hedgehog signaling is required for the differentiation of ES cells into neurectoderm. Dev. Biol. 2004;265:276–290. doi: 10.1016/j.ydbio.2003.09.027. [DOI] [PubMed] [Google Scholar]
- 54.Dixon JE, Dick E, Rajamohan D, Shakesheff KM, Denning C. Directed differentiation of human embryonic stem cells to interrogate the cardiac gene regulatory network. Mol. Ther. 2011;19:1695–1703. doi: 10.1038/mt.2011.125. [DOI] [PMC free article] [PubMed] [Google Scholar]
- 55.Niakan KK, Ji H, Maehr R, Vokes SA, Rodolfa KT, Sherwood RI, Yamaki M, Dimos JT, Chen AE, Melton DA, et al. Sox17 promotes differentiation in mouse embryonic stem cells by directly regulating extraembryonic gene expression and indirectly antagonizing self-renewal. Genes Dev. 2010;24:312–326. doi: 10.1101/gad.1833510. [DOI] [PMC free article] [PubMed] [Google Scholar]
- 56.Kuzmichev A, Nishioka K, Erdjument-Bromage H, Tempst P, Reinberg D. Histone methyltransferase activity associated with a human multiprotein complex containing the Enhancer of Zeste protein. Genes Dev. 2002;16:2893–2905. doi: 10.1101/gad.1035902. [DOI] [PMC free article] [PubMed] [Google Scholar]
- 57.Muller J, Hart CM, Francis NJ, Vargas ML, Sengupta A, Wild B, Miller EL, O'Connor MB, Kingston RE, Simon JA. Histone methyltransferase activity of a Drosophila Polycomb group repressor complex. Cell. 2002;111:197–208. doi: 10.1016/s0092-8674(02)00976-5. [DOI] [PubMed] [Google Scholar]
- 58.Sengoku T, Yokoyama S. Structural basis for histone H3 Lys 27 demethylation by UTX/KDM6A. Genes Dev. 2011;25:2266–2277. doi: 10.1101/gad.172296.111. [DOI] [PMC free article] [PubMed] [Google Scholar]
- 59.Dahle O, Kumar A, Kuehn MR. Nodal signaling recruits the histone demethylase Jmjd3 to counteract polycomb-mediated repression at target genes. Sci. Signal. 2010;3:ra48. doi: 10.1126/scisignal.2000841. [DOI] [PMC free article] [PubMed] [Google Scholar]
- 60.Kartikasari AE, Zhou JX, Kanji MS, Chan DN, Sinha A, Grapin-Botton A, Magnuson MA, Lowry WE, Bhushan A. The histone demethylase Jmjd3 sequentially associates with the transcription factors Tbx3 and Eomes to drive endoderm differentiation. EMBO J. 2013;32:1393–1408. doi: 10.1038/emboj.2013.78. [DOI] [PMC free article] [PubMed] [Google Scholar]
- 61.Lee S, Lee JW, Lee SK. UTX, a histone H3-lysine 27 demethylase, acts as a critical switch to activate the cardiac developmental program. Dev Cell. 2012;22:25–37. doi: 10.1016/j.devcel.2011.11.009. [DOI] [PMC free article] [PubMed] [Google Scholar]
- 62.Chen S, Ma J, Wu F, Xiong LJ, Ma H, Xu W, Lv R, Li X, Villen J, Gygi SP, et al. The histone H3 Lys 27 demethylase JMJD3 regulates gene expression by impacting transcriptional elongation. Genes Dev. 2012;26:1364–1375. doi: 10.1101/gad.186056.111. [DOI] [PMC free article] [PubMed] [Google Scholar]
- 63.Mansour AA, Gafni O, Weinberger L, Zviran A, Ayyash M, Rais Y, Krupalnik V, Zerbib M, Amann-Zalcenstein D, Maza I, et al. The H3K27 demethylase Utx regulates somatic and germ cell epigenetic reprogramming. Nature. 2012;488:409–413. doi: 10.1038/nature11272. [DOI] [PubMed] [Google Scholar]
- 64.Zhao W, Li Q, Ayers S, Gu Y, Shi Z, Zhu Q, Chen Y, Wang HY, Wang RF. Jmjd3 inhibits reprogramming by upregulating expression of INK4a/Arf and targeting PHF20 for ubiquitination. Cell. 2013;152:1037–1050. doi: 10.1016/j.cell.2013.02.006. [DOI] [PMC free article] [PubMed] [Google Scholar]
- 65.Levine AJ, Puzio-Kuter AM. The control of the metabolic switch in cancers by oncogenes and tumor suppressor genes. Science. 2010;330:1340–1344. doi: 10.1126/science.1193494. [DOI] [PubMed] [Google Scholar]
- 66.Vousden KH, Ryan KM. p53 and metabolism. Nat. Rev. Cancer. 2009;9:691–700. doi: 10.1038/nrc2715. [DOI] [PubMed] [Google Scholar]
- 67.Schmidt D, Wilson MD, Ballester B, Schwalie PC, Brown GD, Marshall A, Kutter C, Watt S, Martinez-Jimenez CP, Mackay S, et al. Five-vertebrate ChIP-seq reveals the evolutionary dynamics of transcription factor binding. Science. 2010;328:1036–1040. doi: 10.1126/science.1186176. [DOI] [PMC free article] [PubMed] [Google Scholar]
- 68.Loh YH, Wu Q, Chew JL, Vega VB, Zhang W, Chen X, Bourque G, George J, Leong B, Liu J, et al. The Oct4 and Nanog transcription network regulates pluripotency in mouse embryonic stem cells. Nat. Genet. 2006;38:431–440. doi: 10.1038/ng1760. [DOI] [PubMed] [Google Scholar]
- 69.Song H, Chung SK, Xu Y. Modeling disease in human ESCs using an efficient BAC-based homologous recombination system. Cell Stem Cell. 2010;6:80–89. doi: 10.1016/j.stem.2009.11.016. [DOI] [PubMed] [Google Scholar]
- 70.Dotsch V, Bernassola F, Coutandin D, Candi E, Melino G. p63 and p73, the ancestors of p53. Cold Spring Harb. Perspect. Biol. 2010;2:a004887. doi: 10.1101/cshperspect.a004887. [DOI] [PMC free article] [PubMed] [Google Scholar]
- 71.Armstrong JF, Kaufman MH, Harrison DJ, Clarke AR. High-frequency developmental abnormalities in p53-deficient mice. Curr. Biol. 1995;5:931–936. doi: 10.1016/s0960-9822(95)00183-7. [DOI] [PubMed] [Google Scholar]
- 72.Hu W, Feng Z, Teresky AK, Levine AJ. p53 regulates maternal reproduction through LIF. Nature. 2007;450:721–724. doi: 10.1038/nature05993. [DOI] [PubMed] [Google Scholar]
- 73.Wei CL, Wu Q, Vega VB, Chiu KP, Ng P, Zhang T, Shahab A, Yong HC, Fu Y, Weng Z, et al. A global map of p53 transcription-factor binding sites in the human genome. Cell. 2006;124:207–219. doi: 10.1016/j.cell.2005.10.043. [DOI] [PubMed] [Google Scholar]
- 74.Botcheva K, McCorkle SR, McCombie WR, Dunn JJ, Anderson CW. Distinct p53 genomic binding patterns in normal and cancer-derived human cells. Cell Cycle. 2011;10:4237–4249. doi: 10.4161/cc.10.24.18383. [DOI] [PMC free article] [PubMed] [Google Scholar]
- 75.Griffiths-Jones S, Grocock RJ, van Dongen S, Bateman A, Enright AJ. miRBase: microRNA sequences, targets and gene nomenclature. Nucleic Acids Res. 2006;34:D140–D144. doi: 10.1093/nar/gkj112. [DOI] [PMC free article] [PubMed] [Google Scholar]
Associated Data
This section collects any data citations, data availability statements, or supplementary materials included in this article.