Abstract
Medical Infrared (IR) Imaging has become an important diagnostic tool over recent years. However, one underlying problem in medical diagnostics is associated with accurate quantification of body surface temperatures. This problem is caused by the artifacts induced by the curvature of objects, which leads to inaccurate temperature mapping and biased diagnostic results. Therefore, in our study, an experiment-based analysis is conducted to address the curvature effects toward the 3D temperature reconstruction of the IR thermography image. For quantification purposes, an isothermal copper plate with flat surface, and a cylindrical metal container filled with water are imaged. For the flat surface, the tilting angle measured from camera axis was varied incrementally from 0° to 60 °, such that the effects of surface viewing angle and travel distance on the measured temperature can be explored. On the cylindrical curved surface, the points viewed from 0° to 90° with respect to the camera axis are simultaneously imaged at different temperature levels. The experimental data obtained for the flat surface indicate that both viewing angle and distance effects become noticeable for angles over 40 °. The travel distance contributes a minor change when compared with viewing angle. The experimental results from the curved surface indicate that the curvature effect becomes pronounced when the viewing angle is larger than 60 °. The measurement error on the curved surface is compared with the simulation using the non-dielectric model, and the normalized temperature difference relative to 0° viewing angle was analyzed at six temperature levels. These results indicate that the linear formula associated with directional emissivity is a reasonable approximation for the measurement error, and the normalized error curves change consistently with viewing angle at various temperatures. Therefore, the analysis in this study implies that the directional emissivity based on the non-dielectric model can be applied for the calibration of measurement error. The normalized error curve serves as a consistent basis to correct the measurement error due to curvature artifacts.
Keywords: curvature artifacts, medical infrared thermography
1. INTRODUCTION
Due to the advancement in camera and computer technologies, medical IR thermography has regained interest in clinical medicine in the recent decades. In clinical applications, the IR camera captures the infrared radiation emitted by curved skin surfaces. In spite of the uniform temperature distribution along the skin surface, the curved surface will exhibit temperature variation in thermography owning to the effect of skin curvature on the emissivity. Based on a model under the assumption of dielectric interface, this effect was first observed and analyzed by Watmough et al. [1]. They showed that the temperature drop due to the curvature effect is apparent when the angle between viewing axis and the normal direction is greater than 65 °. The experimental study based on human body thermography was later conducted by Lewis et al [2]. They indicated that the temperature errors only occur if the viewing angle is greater than 85 °, and such a finding casts doubt on the theory based on dielectric interface assumption. On the other hand, Clark [3] takes into account the reflected radiation to further analyze the temperature errors due to the viewing angle effect, and suggests that such errors are likely to be proportional to the temperature difference between the skin surface and environment. The reflection effect is then included into the dielectric interface model by Martin and Wattmough [4], and such inclusion makes the theory agree better with experimental measurements. During the 80s, the curvature error in thermography was repeatedly pointed out by other researchers such as Ash et al.[5] and Anbar[6]. In general, these subsequent in-vivo measurements showed the effective emissivity reduction in the wavelength range of 2-5μm due to surface curvature could be neglected when viewing angle is smaller than 60° [7]. In 1992, based on the non-dielectric interface assumption, a theoretical model of reflectivity and emissivity for skin in the infrared region was developed by Hejazi and Spangler[8]. The model provides an important basis to quantify the non-Lambertian behavior of skin in IR thermography.
Regarding the highly improved temperature sensitivity of modern IR cameras, the demands on temperature measurement accuracy have become more stringent. For example, a temperature difference of less than 0.5 °C would serve as the classification criterion in clinical diagnostic applications [9]. Also, when considering future needs in applications involving 3D thermographic reconstruction, temperature errors induced by skin curvature effect have to be quantified for correction.
Therefore, in this study, the curvature effect is quantified experimentally, and experimental results are compared with theoretical models proposed in the literatures[3, 8]. The agreement of theoretical and experimental data suggests that these results can serve as the base for a correction formula.
2. METHOD
2.1 EQUIPMENT
The Merlin midwave (3-5 μm) infrared camera (MWIR) with frame rate of 60 Hz, as shown in Fig.1(a), was used in our measurements. This camera has a temperature sensitivity of 0.025 °C, and the image generated is digitized using 16 bit raw data with the spatial resolution of 320 by 256 pixels. The camera and data acquisition setup used for this experiment are shown in Fig. 1 (b). The measurements are conducted with the environment temperature being around 22.63 °C .
FIGURE 1.
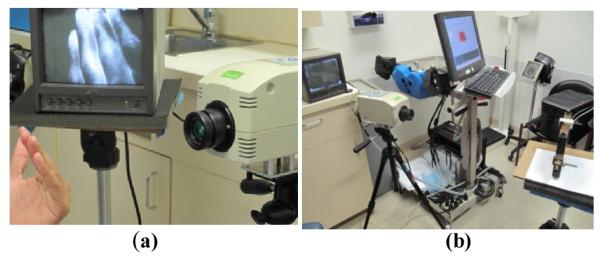
(a) THE MERLIN MIDWAVE INFRARED CAMERA AND IMAGE MONITOR AND (b) THE DATA ACQUISITION SETUP USED IN THE EXPERIMENT.
2.2 MEASUREMENTS WITH A TILTED FLAT SURFACE
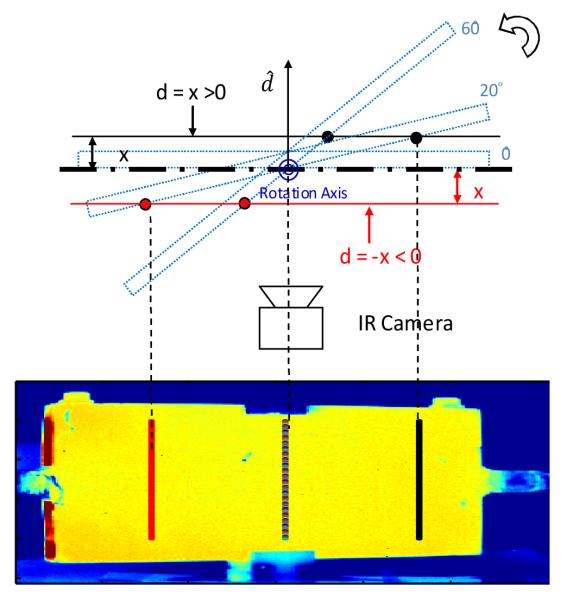
Before reaching the IR camera, the radiation emitted by a curved surface is affected by two factors leading to temperature variations: 1. the viewing angle and 2. the travel distance. To investigate the influence of these two factors, a flat copper plate of dimensions 210 × 157 mm, containing circulating water at 26.4 °C, is used first as the imaging phantom. In the imaging session, the copper plate is first placed perpendicular with respect to the camera axis, and then rotated to capture images at 5 angles in the range 10 – 60 degrees, with an increment of 10 degrees. By comparing the surface temperatures measured at each angle along the rotation axis, with the distance to camera fixed, the effect of viewing angle can be isolated and presented independently. At each tilt angle data from the central portion of the plate (rows 50 to 200 for each vertical line in the image, Fig. 3) are analyzed to eliminate edge effects and reduce noise. The measured 1D temperature distributions from row 50 to row 200 (along a vertical line in the image frame, with each vertical line corresponding to the same distance and same tilt angle), are averaged to yield a single 1D temperature profile along the horizontal direction. As shown in Fig. 3, along the plate surface in horizontal direction, the temperature variation caused by the positive/negative linear distance shift with respect to the rotation axis, can be displayed.
FIGURE 3.
THE TWO PROJECTED LINES (RED AND BLACK) REPRESENTING TWO PLANES AT DISTANCE x FURTHER AWAY/CLOSER TO THE CAMERA IN THE IR IMAGE WHEN TILT ANGLE IS 20 °. THE CENTRAL LINE IS THE PROJECTION OF ROTATION AXIS, WHICH LIES ON THE PLANE d = 0. ( IS POSITIVE IN THE DIRECTION AWAY FROM THE CAMERA)
In addition, with respect to the rotation axis, two planes representing the distance x = ± 22. 6 mm farther away/closer to the camera (Fig. 3) are intercepted by the plate surface tilting from 20 ° to 60 °, and the temperatures along the two intercept lines projected on the IR image are analyzed. Thus, by comparing the mean temperature on these two lines and the rotation axis at different angles, the effect of travel distance on measurement can be examined.
2.3 MEASUREMENTS WITH A CURVED SURFACE
A cylindrical aluminum container of diameter 165 mm, with anodized surface (Fig. 2b), is used to investigate the curvature effect at various temperatures. During the imaging session, the container center (as shown in Fig. 4) is positioned on the camera axis. With respect to the central axis of camera, the viewing angle θ at any surface point is defined by the angle between its normal line and the container center. The container is filled with water at temperature from 34 °C to 44 °C, and the surface image is acquired after the entire container reaches an equilibrium with the water. The temperature increment in the experiments was 2 °C.
FIGURE 2.
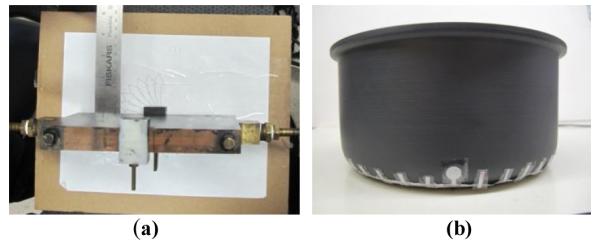
(a) THE FLAT COPPER PLATE USED FOR FLAT SURFACE MEASUREMENTS AND (b) THE CYLINDRICAL PHANTOM USED FOR CURVED FACE EXPERIMENTS.
FIGURE 4.
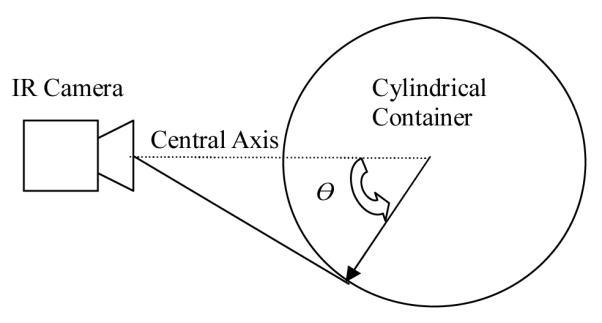
THE VIEWING ANGLE θ DEFINED FOR THE CURVED SURFACE.
2.4 THORETICAL SIMULATION USING THE NON-DIELECTRIC MODEL
To be able to better generalize the conclusions from our experiments, we investigate the difference between theoretical predictions and the experimental results using the non-dielectric model developed by Hejazi and Spangler[8] for the directional emissivity. In their model, skin is simulated as an imperfect dielectric medium with finite electrical conductivity. In Electromagnetics, the refraction index of a medium with finite electrical conductivity can be described as a complex function:
| (1) |
where ns and na represent the refraction index for skin and air, respectively. In Eq.(1), n1 and n2 are the real parts, and k1 is the attenuation coefficient. Based on the law reported by Siegel and Howell[10], the directional emissivity ε(θ), which is a function of viewing angle θ, is related to the refraction index n1, n2, and the attenuation k1 as follows:
| (2) |
where
| (3) |
As indicated by Hajazi and Spangler [8]:
| (4) |
| (5) |
where
| (6) |
| (7) |
To simulate the optical properties of anodized aluminum surface, we set the n1=2.84, which leads to the emissivity ε0 at the normal angle (θ = 0) is around 0.77 [11], k1 =0.0003[12], and the refractive index of air n2 = 1.
3. RESUTLS
3.1 EXPERIMENTS ON THE FLAT SURFACE
Fig. 5 shows the averaged temperature along the rotation axis at tilt angles from 0 ° to 60 °. It can be observed that the temperature drop due to viewing angle effect is not noticeable until the angle reaches 40 °. A more pronounced drop of around 0.2 ° C can be observed from 40 ° to 60 °, and this phenomenon is in agreement with the results published by previous researchers [2, 4].
FIGURE 5.
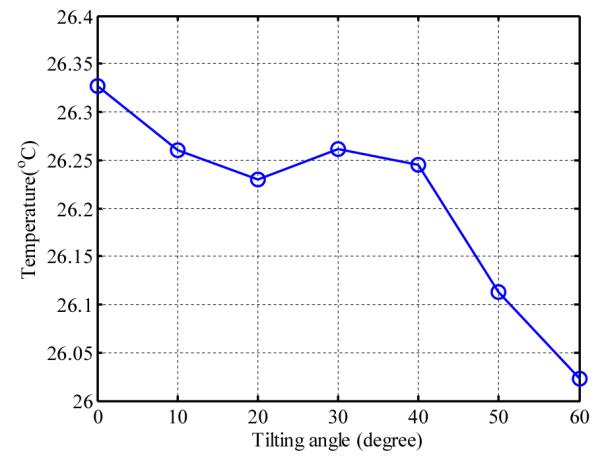
THE AVERAGED TEMPERATURE ON THE FLAT SURFACE ALONG THE ROTATION AXIS FOR TILT ANGLES FROM 0 ° TO 60 °.
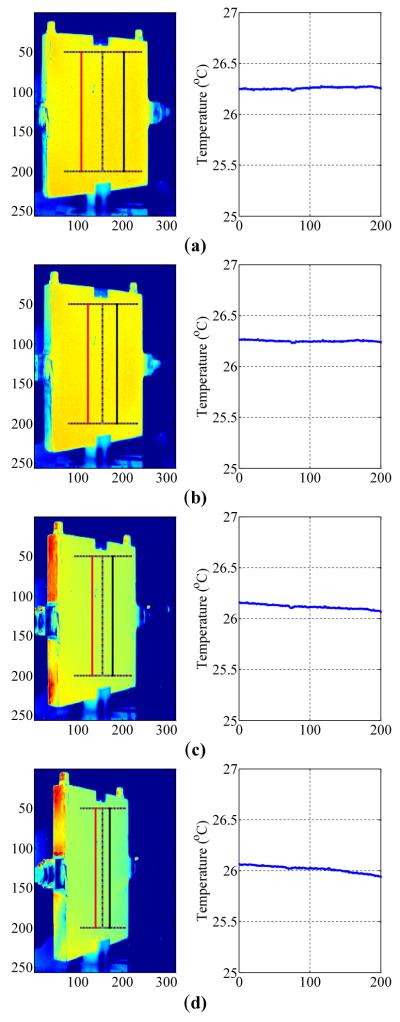
The averaged horizontal 1D temperature distributions at tilt angles 30 ° , 40 ° , 50 ° and 60 ° are illustrated in Fig. 6 (a)-(d). In the temperature distribution along a horizontal line, the effect of travel distance can be demonstrated for each viewing angle. The results suggest that the temperature differences caused by the distance shift become prominent when the angle is larger than 50 °.
FIGURE 6.
THE AVERAGE TEMPERATURE ALONG THE ROTATION AXIS (THE CENTRAL STRAIGHT LINE) ON THE FLAT SURFACE TILTED FROM 30 ° TO 60 ° (a) 30 ° (b) 40 ° (c) 50 ° (d) 60 °.
Considering both viewing angle and distance factors together, the temperature variation can be plotted as shown in Fig.7, in which three curves represent the mean temperature along three lines at different distances to the camera (d >0, d=0, and d <0).
FIGURE 7.
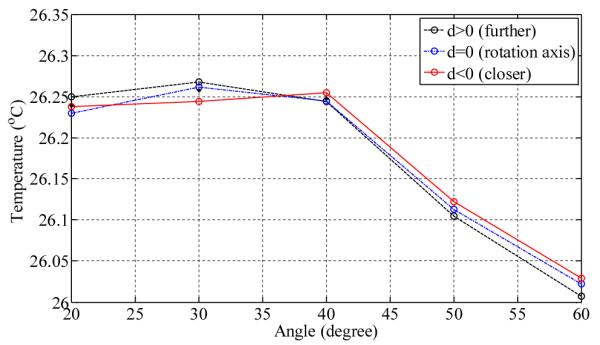
INFLUENCE OF THE TILT ANGLE ON THE TEMPERATURE AT THREE FIXED TRAVEL DISTANCES RELATIVE TO THE ROTATION AXIS (RED, D >0 FURTHER AWAY FROM THE CAMERA THAN THE ROTATION AXIS; BLUE, D=0, THE ROTATION AXIS; BLACK, D < 0, CLOSER TO THE CAMERA THAN THE ROTATION AXIS)
It can be inferred that both factors are not apparent when the tilt angle is smaller than 40 °. Once the tilt angle is larger than 40 °, the temperature variation due to both factors can be observed. At angle 60 °, a clearer divergence due to distance shift (further/closer) can be observed among the three curves. The temperature deviation is in the range of 0.05 ° C.
3.2 EXPERIMENTS ON THE CURVED SURFACE
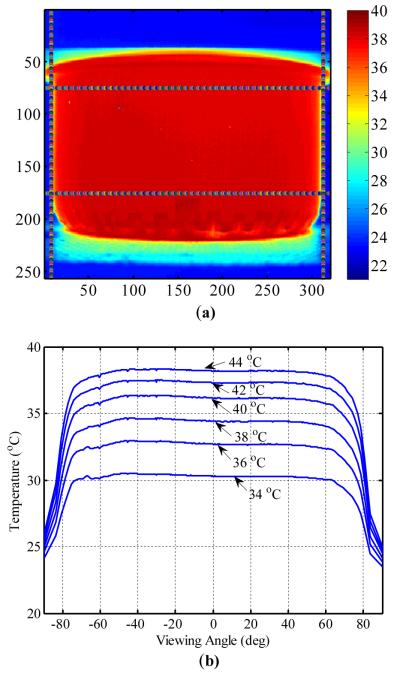
Color coded IR thermographic images of the metal cylinder filled with warm water are shown in Fig. 8(a). The margins of the area sampled for analysis are marked by four lines; the two lines on the left and right hand sides indicate the range for which viewing angle is considered. The top and bottom lines encompass the horizontal region for averaging. The variation caused by viewing angle is shown in Fig. 8(b) for various surface temperatures. It can be observed that the temperature begins to drop slightly when the viewing angle is between 40 ° and 60 °. However, when the viewing angle is larger than 60 °, the temperature drop becomes more significant, and the trend is consistent for all temperature levels. These results are in agreement with the theoretical prediction by Martin and Wattmough [4].
FIGURE 8.
(a) IR THERMOGRAPHIC IMAGE OF THE CYLINDRICAL CURVED SURFACE WITH MARKED MARGINS INDICATING THE REGION FOR THE ANALYSIS. (b) AVERAGED TEMPERATURE DATA (IN THE REGION ENCLOSED BY THE UPPER AND BOTTOM LINES) OVER THE VIEWING ANGLES : 0 ° TO 90 ° AT 6 SURFACE TEMPERATURES.
As proposed by Clark [3], if we take the temperature difference between the curved surface and the environment into account, at shorter wavelengths, the estimated error of object temperature due to surface curvature can be linearized for small temperature intervals as [3] :
| (8) |
where Ts is the surface temperature, T(θ) is the measured temperature at viewing angle θ, which depends on the position on the curved surface, and Ta is the ambient temperature. As shown in Eq. (8), Clark [3] indicated that the measurement error ΔT is proportional to two factors: 1. the temperature difference between the surface and ambient temperature; 2. the deviation of emissivity from unity.
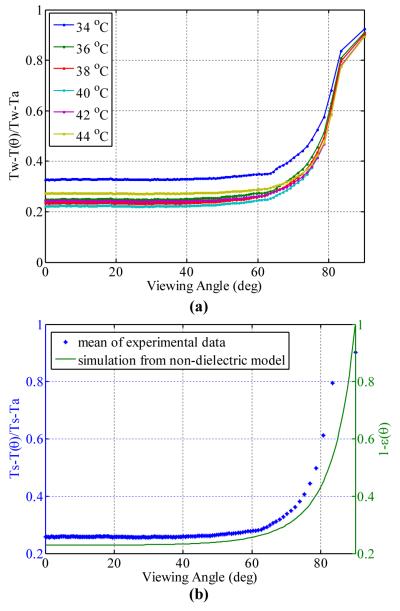
In our experiment, we assume that the water temperature corresponds to the surface temperature Ts and Ta = 22. 63 °C. We plot the ratio shown in Eq. (8) as a function of viewing angle in Fig.9 (a). The mean value of the 6 temperature levels shown in Fig.9(a) is plotted in Fig.9(b) along with the simulated value of 1 – ε(θ) using the non-dielectric model. Based on the results shown in Fig.9(b), we conclude that the mean value of experimental ratio using Eq.(8) is proportional to the simulated value of 1 – ε(θ). Because of the curvature effect, for the viewing angles smaller than 75 °, the sampling rate is high (more pixels are available per unit length). However, the sampling density is reduced as θ exceeds 80 °. Therefore, the correspondence between the experimental data and simulation basically supports the linear formula in Eq. (8).
FIGURE 9.
(a) THE MEASUREMENT ERROR DEFINED BY EQUATION (8) OVER THE VIEWING ANGLE AT SIX WATER TEMPERATURES (b) THE COMPARISON BETWEEN THE MEAN VALUE OF MEASURMENT ERROR FROM SIX TEMPERATURES (LEFT) AND THE SIMULATED VALUE OF 1 – ε(θ) (RIGHT)
If we take measured temperature using IR imaging viewed at normal angle as the surface temperature in Eq.(8), instead of the water temperature used in the previous analysis, the measurement error over the curved surface at all temperature levels can be normalized to the range (0,1) and defined as ΔT*:
| (9) |
In Eq.(9), Tn is the temperature viewed at normal angle, i.e., the measured temperature at the central point of the curved surface, at which the viewing angle with respect to the camera axis is 0 °. The normalized measurement error from these experiments is plotted in Fig. 10.
FIGURE 10.
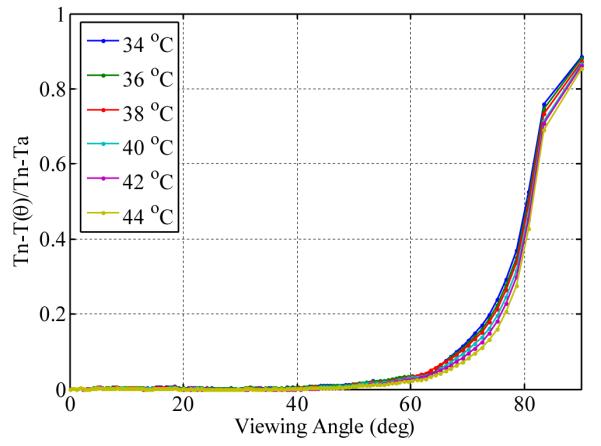
THE NORMALIZED TEMPERATURE ERROR ΔT* OVER THE VIEWING ANGLE: 0 ° TO 90 ° AT 6 SURFACE TEMPERATURES
The results in Fig.10 indicate that ΔT* begins to deviate from 0 at 40 °, and the six curves rapidly converge when the angle is larger than 80 °. A similar dependence of ΔT* on the viewing angle for these six temperature levels is observed. We can also conclude that viewing angles between 65 ° and 80 ° are most sensitive to the difference between surface and ambient temperature.
4. CONCLUSIONS
From measurements on the flat surface with tilt angles as shown in Fig.6, it can be inferred that the factors of viewing angle and travel distance (both associated with the curvature effect on emissivity) are negligible when the tilt angle is smaller than 40 °. As the tilt angle increases between 40 ° and 60 °, both effects gradually cause an apparent decrease of the temperature measured by IR thermography (Fig.7). The distance effect is of the order of 0.05 °C, which is relatively minor when compared with the viewing angle effect that produces an artifact of around 0.2 °C decrease of the measured temperature.
When the viewing angle is larger than 60 °, as indicated in the curved surface measurement, the temperature drops more rapidly with the increase of viewing angle. At angles of 70 ° - 80 °, the resulting artifacts can be more than 2 °C with respect to the point measured at normal angle. By comparing the experimental data of the curved surface with the simulation using non-dielectric model, it can be concluded that the measurement error due viewing angle can be approximated using the linear formula, which is associated with the directional emissivity and ambient temperature (Eq. (8)). Finally, from the analysis of normalized measurement error ΔT*, six curves that change consistently with viewing angle can be observed, and the sensitivity to the temperature variation is minor.
Based on the experimental data, we can conclude that the theoretical model of directional emissivity can be used for error correction and measurement calibration using the linear formula described by Eq.(8). The normalized temperature difference ΔT* is as a function of viewing angle θ with minor dependence on temperature level. This parameter can be used to quantify the relative measurement error with respect to the normal viewing angle. Therefore, by knowing the orientation of a unit surface of human body and the ambient temperature, the measurement errors due to curvature effects can be estimated in IR thermography. In this way, the temperature artifacts owing to surface curvature can be corrected to allow accurate temperature area in 3D thermographic reconstruction.
ACKNOWLEDGMENTS
This research was funded by the National Institutes of Health NCI Grant No. 5R01CA161265-02, the National Science Foundation Grant No. 0651981 and the Alexander and Margaret Stewart Trust through the Cancer Center of the Johns Hopkins University.
REFERENCES
- 1.Watmough DJ, Fowler PW, Oliver R. The thermal scanning of a curved isothermal surface: implications for clinical thermography. Phys Med Biol. 1970;15(1):1–8. doi: 10.1088/0031-9155/15/1/301. [DOI] [PubMed] [Google Scholar]
- 2.Lewis DW, Goller HO, Teates CD. Apparent temperature degradation in thermograms of human anatomy viewed obliquely. Radiology. 1973;106(1):95–9. doi: 10.1148/106.1.95. [DOI] [PubMed] [Google Scholar]
- 3.Clark JA. Effects of surface emissivity and viewing angle errors in thermography. Acta thermographica. 1976;1(3):138–141. [Google Scholar]
- 4.Martin CJ, Watmough DJ. Thermal scanning of curved surfaces. Acta thermographica. 1977;2(1,1,2):18–22. [Google Scholar]
- 5.Ash CJ, Gotti E, Haik CH. Thermography of the curved living skin surface. Mo Med. 1987;84(11):702–8. [PubMed] [Google Scholar]
- 6.Anbar M. Potential artifacts in infrared thermographic measurements. Thermology. 1991;273(3):3. [Google Scholar]
- 7.Woodrough RE. Medical Infra-red Thermography: Principles and Practice. Cambridge University Press; Cambridge: 1982. [Google Scholar]
- 8.Hejazi S, Spangler R. Theoretical Modeling of Skin Emissivity. Proceedings of the Annual International Conference of the Ieee Engineering in Medicine and Biology Society; 1992. pp. 258–259. 14. [Google Scholar]
- 9.Buzug TM, et al. Skin-tumour classification with functional infrared imaging. Proceedings of the Eighth IASTED International Conference on Signal and Image Processing.2006. pp. 313–322. [Google Scholar]
- 10.Siegel R, Howell JR. Thermal Radiation Heat Transfer. 3 ed Taylor & Francis Inc.; Hemisphere, Washington: 1992. [Google Scholar]
- 11.Emissivity Coefficients of some common Materials. http://www.engineeringtoolbox.com/emissivity-coefficients-d_447.html.
- 12.Nakamura S, et al. Infrared Optical-Constants of Anodic Alumina Films with Micropore Arrays. Japanese Journal of Applied Physics Part 1-Regular Papers Short Notes & Review Papers. 1992;31(11):3589–3593. [Google Scholar]


