

Abstract
Hepatocellular carcinoma (HCC) is associated with poor survival for patients and few effective treatment options, raising the need for novel therapeutic strategies. MicroRNAs (miRNAs) play important roles in tumor development and show deregulated patterns of expression in HCC. Because of the liver’s unique affinity for small nucleic acids, miRNA-based therapy has been proposed in the treatment of liver disease. Thus, there is an urgent need to identify and characterize aberrantly expressed miRNAs in HCC. In our study, we profiled miRNA expression changes in de novo liver tumors driven by MYC and/or RAS, two canonical oncogenes activated in a majority of human HCCs. We identified an up-regulated miRNA megacluster comprised of 53 miRNAs on mouse chromosome 12qF1 (human homolog 14q32). This miRNA megacluster is up-regulated in all three transgenic liver models and in a subset of human HCCs. An unbiased functional analysis of all miRNAs within this cluster was performed. We found that miR-494 is overexpressed in human HCC and aids in transformation by regulating the G1/S cell cycle transition through targeting of the Mutated in Colorectal Cancer tumor suppressor. miR-494 inhibition in human HCC cell lines decreases cellular transformation, and anti-miR-494 treatment of primary MYC-driven liver tumor formation significantly diminishes tumor size. Conclusion: Our findings identify a new therapeutic target (miR-494) for the treatment of HCC. (Hepatology 2014;58:202–215)
Hepatocellular carcinoma (HCC) is the third-most common cause of cancer-related death worldwide.1 Genomic alterations and subsequent aberrant activation of multiple signaling cascades make HCC a complex, heterogeneous disease.2 MYC and RAS are canonical oncogenes whose increased expression or pathway activation has been identified in many human cancers, including HCC. MYC is amplified or overexpressed in up to 70% of viral and alcohol-related HCCs, and RAS pathway activation is observed in up to 89% of human HCCs.3,4 Together, their coactivation has been associated with a more proliferative phenotype and worse survival in human HCC.5
Although extensive effort has been devoted to understanding the molecular pathogenesis of HCC, few effective treatments currently exist. Systemic chemotherapy and radiotherapy, two conventional cancer therapies, have low response rates and no demonstrated survival benefits in HCC.6 Treatment with sorafenib, a recently approved multikinase inhibitor, resulted in only modestly prolonged survival.7 Development of novel therapeutics for the prevention and treatment of HCC is therefore urgently needed.
Despite the general lack of activity of conventional therapeutics in HCC, hepatocytes have been shown to readily take up antisense oligonucleotides,8 raising the hope that small nucleic acid-based molecules may have utility against HCC. MicroRNAs (miRNAs) are small, endogenous RNAs that regulate gene expression through messenger RNA (mRNA) degradation or inhibition of translation.9 Aberrant miRNA expression plays an essential role in HCC pathogenesis, and miRNA replacement or inhibition therapies have been suggested as potential therapeutics for HCC.10 As proof of principle, recombinant adeno-associated virus (AAV)-mediated overexpression of miR-26a was recently shown to attenuate primary MYC-driven tumor formation in a transgenic (Tg) mouse model.11 However, safety considerations exist over the clinical application of AAV-vector-based gene therapy.12 The use of drug-like anti-miR oligonucleotides to inhibit miRNAs overexpressed in liver cancer may provide a robust, safer approach for the treatment of HCC. miRNA antagonists have demonstrated efficacy in tumor xenograft studies, metabolic disease, and antiviral therapy.13–15 However, whether miRNA antagonists will have therapeutic utility against primary liver tumor formation and which miRNAs should be targeted to block tumor growth remains largely unexplored.
We sought to model human HCC in vivo by liver-specific activation of oncogenic pathways driven by MYC and/or RAS in mice. We postulated that miRNAs up-regulated in these models could be potential therapeutic targets in HCC. We found that miR-494 is up-regulated in multiple HCC tumor models and human HCC samples. Increased miR-494 expression promotes proliferation in tumor cells and its inhibition reduces transformation of human HCC cells and tumor growth in vivo, raising its potential as a therapeutic target in HCC.
Materials and Methods
Mouse Strains
TRE-RASV12 mice16 were crossed with Liver-Enriched Activator Protein promoter-controlled tetracycline transactivator (LAP-tTA) mice17 to generate LAP-tTA/TRE-RAS (LT2/RAS) Tg mice. LAP-tTA/TRE-MYC (LT2/MYC) Tg mice have been described previously.18 LT2/MYC males were crossed with LT2/RAS females to generate LAP-tTA/TRE-MYC/TRE-RAS (LT2/MYC/RAS) mice. Doxycycline (Dox) was supplied in feed (200 mg/kg) to suppress oncogene expression and was removed after 8 weeks of age to induce transgene expression. The committee for animal research at the University of California San Francisco (San Francisco, CA) approved all animal experiments.
Microarray Analysis
RNA from normal liver (LT2) and tumor tissue (LT2/MYC, LT2/RAS, and LT2/MYC/RAS) was extracted, enriched for miRNAs, and biotin-labeled using Ambion’s miRVana, flashPAGE, and miRVana miRNA labeling kits, respectively (Ambion, Austin, TX). Samples (n = 4) from each genotype were hybridized to a custom Affymetrix Genechip designed to miRNA probes derived from Sanger miRBase v9.2 (Affymetrix, Santa Clara, CA). This array contained a total of 14,216 probes. Mouse probes and human probes whose sequence is complementary to mouse homologs were used for the analysis. For each probe, an estimated background value was subtracted that was derived from the median signal of a set of GC-matched anti-genomic controls. Detection calls were based on a Wilcoxon rank-sum test of the miRNA probe signal, compared to the distribution of signals from GC-content-matched anti-genomic probes, and normalized according to the variance stabilization method previously described.19 Postnormalized data scale is reported as generalized log2 data. For statistical hypothesis testing, one-way analysis of variance (ANOVA) was applied and probes were considered significantly differentially expressed based on a default P value of 0.05 and log2 difference >1 or <−1. The microarray data have been deposited at the National Center for Biotechnology Institute Gene Expression Omnibus (GEO) repository under accession number GSSE44570.
Human Data Sets
Human HCC expression data sets were retrieved from the GEO (http://www.ncbi.nlm.nih.gov/geo/) for the Burchard set (GSE22058) and The Cancer Genome Atlas (http://cancergenome.nih.gov/). The Burchard set was based on microarray-based data across 192 samples containing paired tumor and nontumor adjacent control tissues.20 The TCGA LIHC set was based on next-gen sequencing of 103 samples containing 67 tumors and 36 unpaired nontumor liver tissues.
Bioinformatic Analysis
The Burchard HCC array data were quality controlled for outliers and possible batch effects using principal component analysis (PCA). Outliers were removed, and the remaining samples were then log-transformed. Samples were then compared between tumors and nontumor controls using one-way ANOVA. Fold changes and raw P values were used to filter the differentially expressed miRNAs. Statistical analysis, Venn comparisons, and visualization of expression heat maps were performed using Array Studio (OmicSoft Corp., Cary, NC) and R software. The TCGA LIHC data set was first normalized within each sample by dividing raw count values by total counts.21 Samples were then quality controlled by PCA and subsequently log-transformed. Comparisons and visualization were also made by one-way ANOVA using similar fold change and P value filters as with the Burchard set.20
Please see the Supporting Materials for a detailed description of additional methods.
Results
MYC- and/or RAS-Driven Liver Tumors Have Distinct Characteristics
To model HCC in the mouse, we utilized a liver-specific Dox-regulated oncogene expression approach.18,24 This system allows temporal control over expression of MYC specifically in the liver, resulting in murine liver tumor formation (LT2/MYC).18,24 In the present study, we developed a new HRASV12-driven model of liver cancer (LT2/RAS) and also coexpressed MYC and HRASV12 together to drive liver tumor formation by both oncogenes (LT2/MYC/RAS). Adult mice of each genotype were taken off Dox at 8 weeks to induce oncogene expression. Tg mouse models gave rise to liver tumors with near 100% penetrance within a range of 5-12 weeks. To determine whether specific oncogene expression resulted in distinct tumor types, we characterized livers from the four genotypes. Oncogene expression was confirmed by western blotting analysis of tumor tissue (Supporting Fig. 1A). LT2 controls had normal-appearing livers, whereas MYC and RAS oncogenes induced morphologically distinct liver tumors (Fig. 1A). Likewise, combined expression of MYC and RAS gave rise to heterogeneous tumors morphologically distinct from either oncogene alone (Fig. 1A). Histological analysis revealed that MYC-driven tumors resemble poorly differentiated HCCs or human hepatoblastomas,25 whereas RAS-driven tumors resemble human HCC. MYC+RAS-driven tumors are reminiscent of an aggressive variant of HCC or fetal variants of human hepatoblastoma (Fig. 1B and Supporting Fig. 1B).
Figure 1.
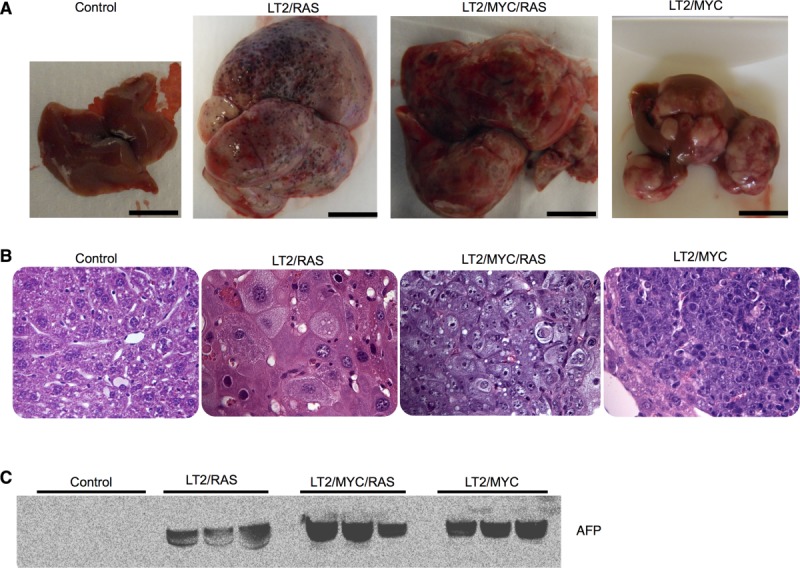
Dox-regulated expression of MYC or/and RAS oncogenes give rise to distinct liver tumors. (A) Gross morphology of representative control liver and tumors from each genotype are shown. Scale bar = 1 cm. (B) Hematoxylin and eosin histology from representative samples for control (LT2) liver and tumors from each genotype. Original magnification = 40×. (C) Western blotting for AFP, a liver cancer marker, which is expressed at high levels in all three liver tumor models and is absent in control livers (controls). Equal amounts of total protein for each sample were loaded and verified by Ponceau-S staining.
Alfa-fetoprotein (AFP) is expressed in fetal liver progenitors, but not in normal adult liver, and is used as a clinical biomarker to confirm the diagnosis of HCC.26 We examined expression of AFP in the Tg tumor models and found high expression of AFP in all samples for each genotype, but undetectable levels in nontumor control mice (Fig. 1C). These results confirm that though distinct, each of the Tg models represents bona-fide liver tumors.
An miRNA Megacluster on Mouse Chromosome 12qF1 Is Up-Regulated in Multiple HCC Models
Although MYC and RAS play important roles in HCC, little is known about the effect these canonical oncogenes exert individually and together on miRNA expression. To identify aberrantly expressed miRNAs, we performed an miRNA microarray on samples collected from MYC, RAS, and MYC+RAS liver tumors and compared to control (LT2) livers. We observed at least 2-fold up- or down-regulation (−1 > log2 > 1 and P < 0.05) for 103 miRNAs in the LT2/RAS, 129 in the LT2/MYC, and 118 in the LT2/MYC/RAS models, compared to normal LT2 mice (Fig. 2A; Supporting Table 1). We hypothesized that the subset of miRNAs commonly deregulated in all three tumor genotypes might be especially important for HCC development. We found 60 miRNAs up- (n = 58) or down-regulated (n = 2) among all three genotypes, compared to normal liver (intersection of the three genotypes in the Venn diagram; Fig. 2A; Supporting Table 1). To determine whether the miRNA expression changes observed in these Tg liver cancer models are relevant to human HCC, we used the shared 60-miRNA signature found in our models to cluster human HCC patient samples (Fig. 2B,C). We applied the 60-miRNA liver cancer signature to two human HCC miRNA data sets and found that the signature clustered 21% (Dataset #1) and 25% (Dataset #2) of tumor samples (Fig. 2B,C). Elevated tumor AFP expression has been associated with poorly differentiated and aggressive HCCs.27 Because clinical or pathologic characteristics for these human data sets were not available, we instead examined tumor AFP mRNA expression to determine whether it differed between tumor samples clustered by the 60-miRNA signature. In both data sets, we found significantly increased tumor AFP expression in the tumor samples clustered by the 60-miRNA signature (Fig. 2D,E). Thus, the 60-miRNA signature shared among all mouse liver tumor models can distinguish human tumors associated with elevated AFP expression, a marker of a poorly differentiated state.
Figure 2.

An miRNA megacluster containing multiple transforming miRNAs is up-regulated in mouse tumor models (A) Venn analysis of differentially expressed miRNAs in MYC, RAS, and MYC+RAS Tg mice indicate substantial overlap. MicroRNA signatures from each mouse line were analyzed using one-way ANOVA comparisons with a minimum fold change log2 >1 or <−1 at a P value <0.05. The intersection of the three signatures indicated that 60 miRNAs were commonly shared among these mice. Orthologs of these miRNAs were used for subsequent analysis in human HCC cohorts. (B and C) Distinct subsets of human HCC tumors with up-regulated miRNA orthologs of the 60-miRNA murine signature. Two-dimensional unsupervised hierarchical clustering of orthologous miRNAs was performed based on miRNAs from the murine signature. (B) Thirty for Dataset#1.20 (C) Thirty-eight for Dataset#2, TCGA LIHC. Red indicates miRNA up-regulation, blue indicates down-regulation on the heat maps. (D and E) AFP expression is elevated in human HCC tumors that exhibit high miRNA signature. Mean AFP mRNA expression is depicted, and error bars represent standard error of the mean. (D) Dataset#1; (E) Dataset#2. (F) Hierarchical clustering of all miRNAs located within 1 kilobase of each other in the mouse genome reveals an up-regulated megacluster on Chr12qF1 in mouse tumors (heat-map region E, underlined in black). miR-17-92 oncomiR cluster and its homologs are indicated with green lines (heat-map regions B, D, and F). RAS-regulated miR-221-222 cluster shows RAS specific expression (heat-map region A), whereas MYC regulated miR-302b-d cluster shows MYC specific expression (heat-map region C). (G) SB transposon integration in the same transcriptional orientation as the anti-Rtl1 cluster causes HCCs in mice, accompanied by an up-regulation of Dlk1-Dio3 miRNAs (indicated in red). This is compared to HCCs with inverted SB insertions in the anti-Rtl1 cluster and normal livers that have no Dlk1-Dio3 miRNA up-regulation. (H) Quantification of soft agar colonies formed by each LT2MR stable cell line. miR-17-92 and miR-122 were used as positive and negative controls, respectively. Values are average of three independent experiments. SM-4, -5, -7, and -8 subclusters significantly increased transformation, when compared to LT2MR cells stably expressing a control pMSCV vector (*P < 0.05). (I) Relative expression of miR-494 and miR-495 from 47 human HCC tumor and matched normal samples were analyzed by qRT-PCR. miRNA abundance was normalized to RNU48. Differences in expression are shown as fold change over matched normal tissue.
Because previous studies have demonstrated that clusters of miRNAs can play important roles in development, disease, and cancer,28–30 we sought to determine whether the 58 up-regulated miRNAs were clustered within the genome. Surprisingly, 29 of the 58 (50%) commonly up-regulated miRNAs are located in the same genomic locus on mouse chromosome 12qF1 (Fig. 2F). This region, known as the Dlk1-Dio3 domain, is conserved among placental mammals and comprises approximately 5% of all known miRNA genes.31 miRNAs from the Dlk1-Dio3 region are split into two separate clusters, which we termed the Anti-Rtl1 and Mirg clusters, respectively (Supporting Fig. 2).
We next asked whether this miRNA megacluster is also up-regulated in other models of liver cancer. An unbiased Sleeping Beauty (SB) transposon system generates liver cancer in mice at ∼35% frequency.22 Pyrosequencing of liver tumors from these mice revealed a preferential transposon integration site within the Anti-Rtl1 cluster in 73% (8 of 11) of samples. Five of these eight tumors had transposon integrations in the same transcriptional orientation, resulting in significant up-regulation of Dlk1-Dio3 miRNAs (Fig. 2G). Together, these results suggest that up-regulation of miRNAs within the Dlk1-Dio3 megacluster may promote HCC development in mice.
miR-494 Enhances Transformation of Liver Tumor Cells and Is Up-Regulated in Human HCC
Studies of oncogenic miRNA clusters suggest that only one or a few miRNAs may account for the tumor-promoting properties of these clusters.32 To identify such miRNAs within the Dlk1-Dio3 megacluster, we tested their ability to accelerate cell growth in soft agar. We split the Dlk1-Dio3 megacluster into 13 subclusters and stably expressed each in a mouse liver tumor cell line (Supporting Fig. 3A; Supporting Table 3). LT2MR cells, derived from LT2/MYC tumors and engineered to stably express RAS (Supporting Fig. 3B), showed reduced or absent expression of many Dlk1-Dio3 miRNAs (data not shown), making it a suitable system to assess the effects of overexpression of miRNAs within the megacluster. Stable expression was verified by quantitative real-time polymerase chain reaction (qRT-PCR) of a representative miRNA within each subcluster (Supporting Fig. 3C). We found four subclusters of miRNAs that significantly increased LT2MR colony growth in soft agar. However, we were most intrigued by the observation that subclusters SM-4 and SM-5, each containing a single miRNA (miR-494 and -495, respectively), were the most potent at increasing soft agar growth (Fig. 2H).
miR-494 and miR-495 were highly up-regulated in all three tumor genotypes, as verified by qRT-PCR (Supporting Table 2; Supporting Fig. 4). To investigate whether these miRNAs might also be up-regulated in human HCC, we performed qRT-PCR on 47 human HCC samples and their matched normal tissues. Thirty-four percent (n = 16) and 27% (n = 13) of samples had >1.5-fold miR-494 and miR-495 overexpression, compared to normal liver tissue, respectively (Fig. 2I). miR-494 and miR-495 were also part of the 60-miRNA signature found to be up-regulated in Dataset #2 (Fig. 2C). Because miR-494 was more frequently up-regulated in primary human HCC samples, we selected it for further study.
miR-494 Overexpression Increases Cellular Proliferation and S-Phase Entry
Because miR-494 was among the most potent at increasing soft agar growth, we determined whether it could directly effect tumor cell proliferation. To address this, we performed proliferation assays on LT2MR cells stably overexpressing miR-494 (Supporting Fig. 5). We observed that miR-494 overexpression increased LT2MR proliferation, compared to control cells. Conversely, stable expression of an miR-494 antagonist resulted in diminished miR-494 expression (Supporting Fig. 5) and attenuated proliferation of LT2MR cells, compared to controls (Fig. 3A).
Figure 3.
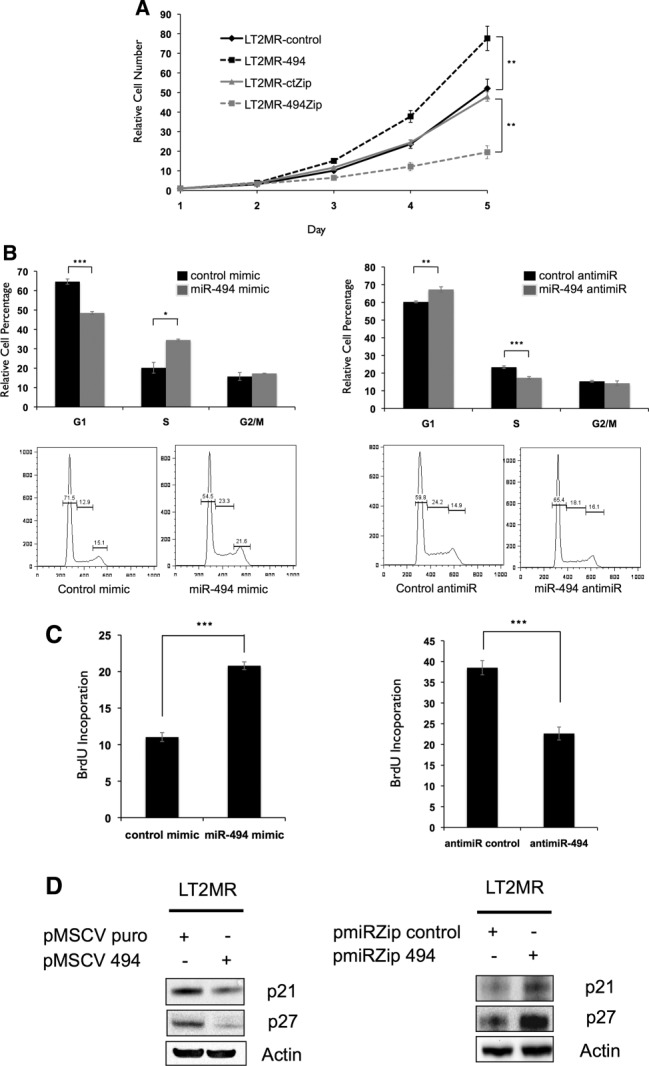
miR-494 increases proliferation through accelerated G1/S transition. (A) LT2MR cells undergo increased proliferation with enforced miR-494 expression and decreased proliferation with miR-494 inhibition. Fifty thousand cells were plated in triplicate and counted at days 1, 2, 3, 4, and 5 after transfection of pMSCV puro, pMSCV 494, pmiR-ZIP-control, or pmiR-ZIP-494. Cell numbers were normalized to day 1. Experiment was repeated three times, and values are from one representative experiment. **P = 0.01. (B) LT2MR cells exhibit accelerated G1/S transition with enforced miR-494 expression and G1/S delay with miR-494 inhibition. LT2MR cells transfected with miR-494 or control mimic and miR-494 or control inhibitor for 48 hours were stained with propidium iodide for fluorescence-activated cell sorting analysis. Cell-cycle profiles were analyzed using FlowJo analysis software (Tree Star, Inc., Ashland, OR). Experiment was done with three replicates per sample, and values were averaged to generate graphs (top panels). *P = 0.01; **P = 0.003; ***P = 0.001. Figure is representative of three experiments. (C) BrdU incorporation in miR-494 overexpressing cells. LT2MR cells were transfected with either miRNA mimics (left panel) or miRNA inhibitors (right panel) for 48 hours and exposed to BrdU for 40 minutes. Flow cytometry was used to measure BrdU incorporation. Experiment was repeated three times with three replicates per sample, and values are from one representative experiment. ***P = 0.008. (D) Expression of cell-cycle inhibitors corresponds to proliferation. Stable cell lines with either increased (left panel) or decreased miR-494 (right panel) expression were generated and tested for expression of p27 and p21 by western blotting.
We asked whether the observed increase in proliferation was mediated through alterations in cell-cycle control and performed DNA content analysis of LT2MR cells. miR-494 mimic transfection resulted in decreased G1-phase and increased S-phase cells (Fig. 3B), whereas miR-494 inhibitor transfection resulted in increased G1-phase and decreased S-phase cells (Fig. 3B). These results suggest that miR-494 could play a role in G1/S transition in LT2MR cells. We next treated cells with bromodeoxyuridine (BrdU) and measured its incorporation. We observed that miR-494 mimic transfection caused an increase in S-phase BrdU-labeled cells, whereas miR-494 inhibitor transfection resulted in decreased S-phase BrdU-labeled cells (Fig. 3C).
We next examined whether increased S-phase entry caused by miR-494 was associated with changes in the expression of cell-cycle-inhibitor proteins. Thus, we tested for expression of two key regulators of the G1/S transition (p21 and p27) and observed decreased expression of both in miR-494 overexpressing cells (Fig. 3D). In contrast, miR-494 knockdown increased the expression of these cell-cycle inhibitors (Fig. 3D). We confirmed these findings in a separate cell line, Hepa1-6 mouse hepatoma cells, which have high miR-494 expression. miR-494 inhibition decreased proliferation in Hepa1-6 cells, associated with a delay in G1/S transition and an increase in p21 and p27 (Supporting Fig. 6A-E). Together, these results demonstrate that miR-494 overexpression increases G1/S transition in LT2MR and Hepa1-6 cells and is associated with decreased p21 and p27 abundance, known inhibitors of cell proliferation.
The Tumor Suppressor, Mutated in Colorectal Cancer, Is a Direct Target of miR-494
We hypothesized that miR-494 may regulate one or more growth-inhibitory genes to alter cell proliferation. We identified seven candidate miR-494 targets using TargetScan, previously established to block cell-cycle progression, and also containing conserved miR-494-binding sites (transforming, acidic coiled-coil containing protein 2 [TACC2], transforming growth factor, beta 2 [TGFB2], retinoblastoma 1 [RB1], retinoblastoma-1-inducible coiled-coil 1 [RB1CC1], cell division cycle 73 [CDC73], WEE1, and Mutated in Colorectal Cancer [MCC]). To evaluate whether these genes were direct miR-494 targets, we cloned a fragment of their 3′ untranslated regions (UTRs) containing the putative miR-494-binding sites into luciferase reporter constructs. MiR-494 had negligible effect on the RB1, RB1CC1, CDC73, and WEE1 UTRs and increased TACC2 and TGFB2 UTR reporter expression (Supporting Figure 7). However, we observed a 70% decrease in reporter expression when the MCC 3′ UTR reporter was cotransfected with miR-494 mimic and a 40% increase in reporter expression when transfected with miR-494 inhibitor (Fig. 4B). The 5,203-base-pair (bp) MCC 3′ UTR contains one 7-mer binding site for miR-494 (seed region, 5,049-5,055 nucleotides [nts]) conserved among human, mouse, and chimpanzee transcripts (Fig. 4A). To determine whether MCC was indeed an miR-494 target, we mutated four nts within the putative seed-binding site. Reporter responsiveness was abrogated when this mutant reporter was cotransfected with either an miR-494 mimic or miR-494 inhibitor (Fig. 4B).
Figure 4.

MCC is a direct target of miR-494. (A) Putative binding site of miR-494 in MCC 3′ UTR is conserved across multiple species. Alignment of human, mouse, and chimpanzee MCC 3′ UTRs shows a highly conserved region predicted to bind to miR-494. Predicted 7-mer binding seed of miR-494 to MCC 3′ UTR indicated with vertical lines. Putative binding site was mutated as indicated. (B) MCC 3′ UTR is a direct target of miR-494. A 300-bp region of the MCC 3′ UTR containing the predicted miR-494-binding site was cloned into a pMIR-REPORT luciferase vector. Activity of the reporter was decreased when cotransfected into LT2MR cells with miR-494 mimic and increased when cotransfected with miR-494 antimiR, compared to control cotransfections. *P < 0.05. In both cases, site-directed mutagenesis of the predicted miR-494-binding site resulted in loss of reporter response. (C) MCC mRNA expression is responsive to miR-494. LT2MR cells were transfected with miR-494 mimic or hairpin inhibitor and tested for MCC mRNA expression after 24 hours by qRT-PCR. Values normalized to sno202 and expressed relative to control transfected cells. *P < 0.05. (D) MCC protein expression is responsive to miR-494. LT2MR cells were transfected with miR-494 mimic or inhibitor and tested for MCC protein expression after 48 hours by western blotting. Graph is an average of three independent transfections, and values were quantified using a Bio-Rad ChemiDoc (Bio-Rad, Hercules, CA). ***P < 0.001.
We next examined whether miR-494 altered endogenous MCC expression. To test this, we first compared the expression of MCC mRNA in LT2MR cells transfected with either miR-494 mimic or inhibitor. In mimic-transfected cells, we detected a 60% decrease in MCC mRNA abundance. Conversely, MCC mRNA was significantly increased in inhibitor-transfected cells (Fig. 4C). We further analyzed protein expression of MCC in mimic- and inhibitor-transfected cells by western blotting. Consistent with MCC mRNA expression changes, we observed an 80% decrease in MCC protein expression with mimic-transfected cells and a 60% increase in expression with anti-miR-transfected cells (Fig. 4D). Transfection of miR-494 anti-miR also increased MCC protein expression in Hepa1-6 cells (Supporting Fig. 6D). Collectively, these results indicate that MCC is a direct target of miR-494.
MCC Modulates G1/S Transition in Liver Tumor Cells
To assess whether MCC knockdown could mimic the proliferative effect of miR-494, we silenced its expression in LT2MR cells by RNA interference. Similar to miR-494 overexpression, MCC knockdown caused increased proliferation over 4 days (Fig. 5A), accompanied by increased G1/S transition (Fig. 5B,C). Conversely, MCC overexpression caused decreased cell proliferation (Fig. 5A) and was associated with delayed G1/S transition. This was consistent with observations made in cells with reduced miR-494 levels (Fig. 3B,C). We next asked whether MCC was altering p21 and p27 levels, similar to miR-494. From western blotting analysis, we observed an alteration in p27, but not p21, protein expression when cells were transfected with either MCC small interfering RNA (siRNA) or MCC complementary DNA (Fig. 5D). This suggests that the G1/S delay caused by MCC increases p27 expression. However, other targets of miR-494 might be involved in suppressing p21 expression independently of MCC. We next asked whether G1/S transition delay caused by miR-494 knockdown could be rescued by reducing MCC levels. To address this, we assessed BrdU incorporation in cells cotransfected with miR-494 antagonist and MCC siRNA. Accordingly, G1/S transition delay caused by miR-494 knockdown was reversed by cotransfection of MCC siRNA (Fig. 5E). Together, these results indicate that miR-494 causes increased proliferation in LT2MR cells through suppression of MCC expression.
Figure 5.
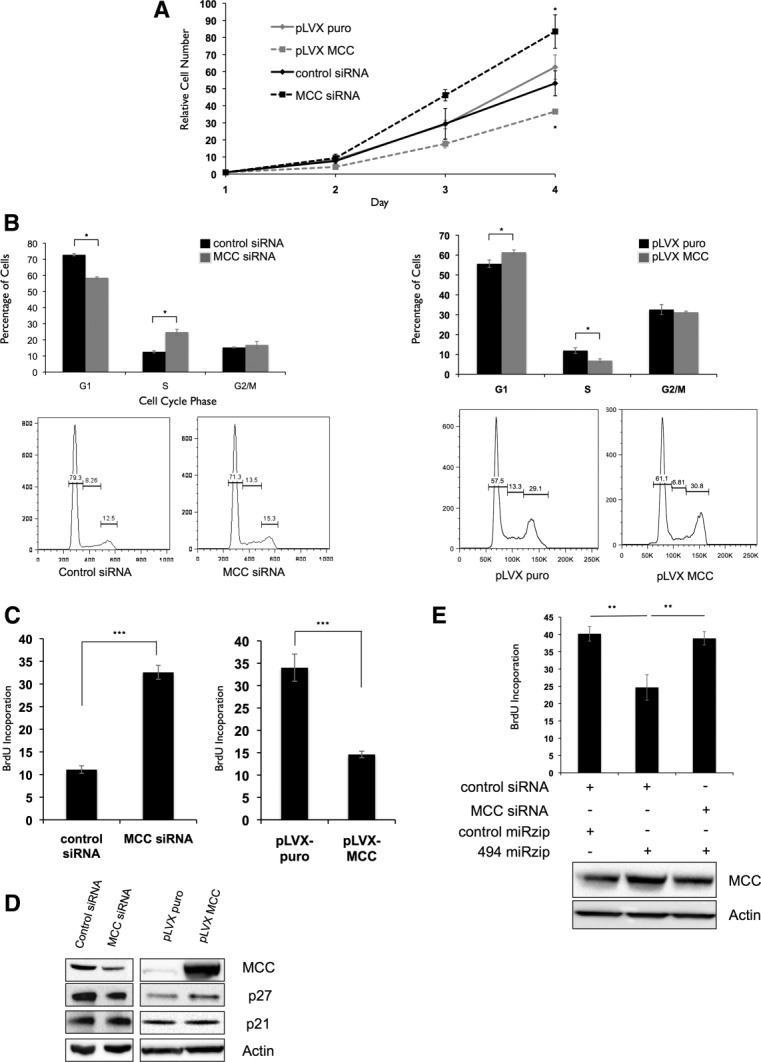
miR-494 modulates G1/S transition through suppression of MCC expression. (A) LT2MR cells undergo increased proliferation with MCC inhibition and decreased proliferation with enforced MCC expression. Experiments were repeated three times, and values are from one representative experiment. (B) LT2MR cells exhibit accelerated G1/S transition with MCC inhibition and G1/S delay with MCC overexpression. LT2MR cells transfected with control or MCC siRNA (top panel), and pLVX puro or pLVX MCC for 48 hours were stained with propidium iodide for fluorescence-activated cell sorting analysis. Cell-cycle profiles were analyzed using FlowJo analysis software (Tree Star, Inc., Ashland, OR). Experiment was done with three replicates per sample, and the figure is representative of three experiments. (C) Increased proliferation is the result of accelerated G1/S transition in MCC siRNA-transfected cells. LT2MR cells were transfected with either control or MCC siRNA (left panel) or pLVX puro or pLVX MCC (right panel) for 48 hours and exposed to BrdU for 40 minutes. Flow cytometry was used to measure BrdU incorporation. Experiment was repeated three times with three replicates per sample, and values are from one representative experiment. ***P < 0.001. (D) Expression of cell-cycle inhibitors corresponds to proliferation rate. LT2MR cells were transfected with either control or MCC siRNA (left panel) or pLVX puro or pLVX MCC (right panel) for 48 hours and tested for expression of p27 and p21 by western blotting. (E) Down-regulation of MCC attenuates the effects of miR-494 inhibition on cell proliferaion. LT2MR cells were transfected with pmiRZip control or pmiRZip 494 and control or MCC siRNA as indicated and tested for MCC expression after 48 hours by western blotting. Cell proliferation was assessed in these cells by measuring BrdU uptake over a period of 40 minutes. **P < 0.01.
The role of MCC in human HCC is poorly understood, although a recent study indicated that it can be silenced by retrotransposon insertions in a subset of patients, suggesting a role as a tumor suppressor in liver cancer.33 We examined the mRNA expression of MCC from two human data sets in which the expression of nontumor liver tissue was also available and found that MCC was dramatically down-regulated in tumors, consistent with its role as a tumor suppressor in HCC (Fig. 6A). Though there may be multiple mechanisms to attenuate MCC expression in HCC, the present study demonstrates that miR-494 is one such way to directly target MCC.
Figure 6.
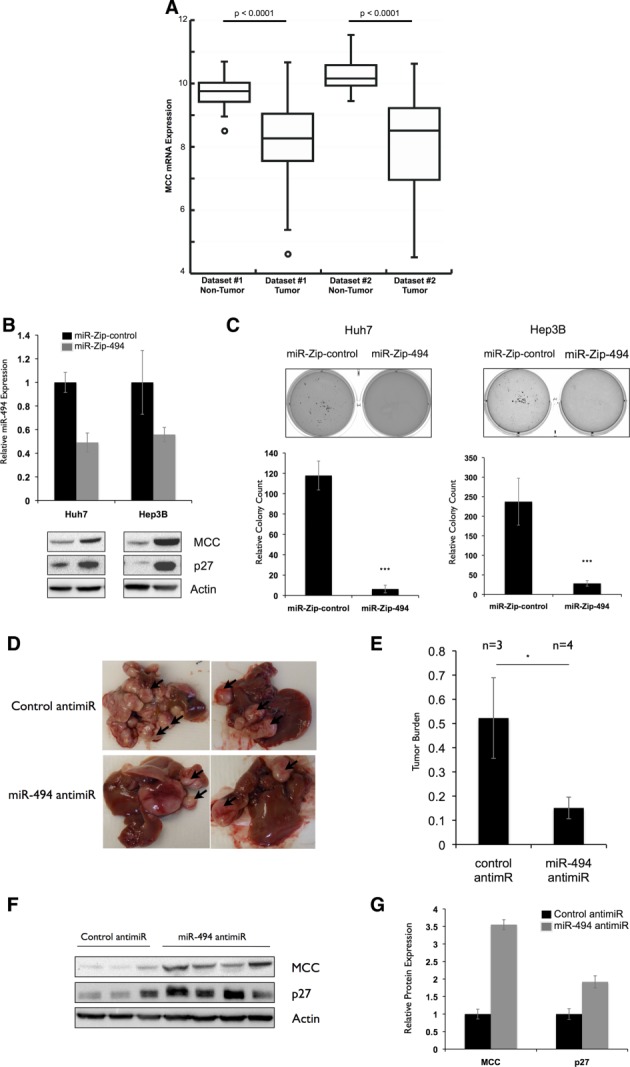
miR-494 inhibition decreases transformation in human and mouse HCC models. (A) Decreased MCC mRNA expression in two human HCC data sets. MCC mRNA expression in tumor versus nontumor tissues is shown for the Burchard (Dataset#1) and TCGA LIHC (Dataset#2). The bottom and top of the boxes indicate the first and third quartiles; the band inside the box is the median value. Whiskers represent the minimum and maximum values; points indicate outliers. (B) miR-494 knockdown increases MCC expression in Huh7 and Hep3B cells. miR-494 was stably knocked down in Huh7 and Hep3B cell lines with p-miR-ZIP-494. miR-494 expression was tested by qRT-PCR and calculated relative to p-miR-ZIP-control cell lines. MCC and p27 expression was tested by western blotting. (C) miR-494 inhibition decreases colony formation in Huh7 and Hep3B cells. Stable p-miR-ZIP control or 494 Huh7 and Hep3B cells were plated in soft agar for 2 weeks. Experiment was repeated three times in triplicate. ***P < 0.001. (D and E) miR-494 inhibition decreases liver tumor growth in vivo. (D) Representative pictures of livers of LT2/MYC mice (35) injected with control (n = 3) or miR-494 (n = 4) anti-miRs over a period of 3 weeks (total 8 weeks off Dox) twice a week. (E) Relative tumor burden in mice as quantified by ImageJ software (National Institutes of Health, Bethesda, MD). *P < 0.05. (F and G) miR-494 inhibition increases MCC and p27 expression in vivo. (F) Protein expression of MCC and p27 in liver tumors of control and miR-494 anti-miR-injected mice. (G) Anti-miR-494-treated tumors show increased MCC and p27 protein expression. Protein expression values were quantified using Bio-Rad ChemiDoc software (Bio-Rad, Hercules, CA). MCC and p27 expression was normalized to actin, and the average expression of each protein was calculated in each treatment group to generate the graph.
miR-494 Knockdown Decreases Transformation of Human HCC Cells
Because our previous observations were made in mouse cells, we wondered whether miR-494 had similar effects in a human context. To test this, we knocked down miR-494 expression in two human HCC cell lines (Huh7 and Hep3B) with elevated miR-494 expression (Supporting Fig. 8A). Stable miR-494 inhibition was accompanied by increased MCC and p27 expression (Fig. 6B). To assess the effects of miR-494 inhibition on transformation, we performed soft agar colony-formation assays and scored the number of colonies formed after 2 weeks. We observed a significant decrease in colony formation in cells with miR-494 inhibition (Fig. 6C). These results indicate that reduction of miR-494 expression increases MCC expression and impairs transformation in human HCC cells.
In Vivo Delivery of an miR-494 Antagonist Attenuates Liver Tumor Formation
Because miR-494 inhibition resulted in diminished proliferation, we reasoned that this might decrease primary tumor formation in vivo. To test this, we initiated de novo liver tumor formation in LT2/MYC mice and treated them with either anti-miRs against miR-494 or a scrambled sequence. Reduction in miR-494 expression was confirmed by qRT-PCR performed on tumor tissue (Supporting Fig. 8B). After 3 weeks, we observed a significantly decreased tumor burden in mice treated with miR-494 anti-miR (Fig. 6D,E). We next asked whether miR-494 inhibition affected MCC expression in vivo. We observed an increase in both MCC and p27 protein expression in tumors of anti-miR-494-treated mice (Fig. 6F,G). Terminal deoxynucleotidyl transferase dUTP nick end labeling staining revealed that there was no significant difference in apoptosis after either treatment, suggesting that miR-494 acts through attenuated cell proliferation, rather than increased apoptosis (Supporting Fig. 8C). Our results indicate that knockdown of miR-494 with a drug-like antagonist can significantly diminish primary HCC tumor formation.
Discussion
Affinity of hepatocytes for small nucleic acids suggests that miRNA antagonist-based therapy might be a promising approach. In this study, we characterized oncogene-specific miRNA expression changes in de novo tumor formation. We report, for the first time, miRNA expression changes associated with liver tumor formation driven by MYC, RAS, and MYC+RAS oncogenes. We find that miR-494 is up-regulated, as part of an miRNA megacluster, in multiple mouse tumor models and clinical human HCC samples. We show that it plays a role in regulating the cell cycle through MCC and demonstrate the therapeutic potential of targeting miR-494 in both human HCC cell lines and de novo tumors.
The common up-regulation of a large megacluster of miRNAs from the Dlk1-Dio3 locus in all three of our liver tumor models was initially surprising to us. However, recent studies have highlighted the increasing importance of this locus in HCC.12,22,34–36 The convergence of these data suggests that Dlk1-Dio3 miRNAs could play an important role in HCC development. In our study, we dissected this cluster in a systematic manner and identified miR-494 as a therapeutic target in HCC. However, our results indicate that other oncogenic miRNAs within this megacluster also play a role in cellular transformation (Fig. 2H). For example, another miRNA from this locus has been shown to be oncogenic in neurobalstoma.37 Whether other Dlk1-Dio3 miRNAs are also crucial to liver tumor formation and could be useful targets for therapy remains to be determined. Interestingly, we find that inhibition of miR-494 can substantially inhibit primary tumor growth, demonstrating its importance as a therapeutic target for HCC.
The role of miR-494 in tumor development appears to be tissue dependent, causing increased proliferation in H460 lung cancer cells and breast and transformed bronchial epithelial cells.38–40 However, it induces cell-cycle arrest in lung cancer and cholangiocarcinoma.41,42 Our results demonstrate that miR-494 increases proliferation in HCC through an acceleration of G1/S transition, but the pleiotropic nature of miRNAs suggests that it could have additional gene targets, which may play other roles in tumorigenesis. miR-494 has been found to target phosphatase and tensin homolog (PTEN),38 and we investigated this in the context of our tumor models. Although we were unable to detect PTEN down-regulation when miR-494 was overexpressed in LT2MR cells (data not shown), we found that miR-494, targets the tumor suppressor, MCC. Importantly, loss of MCC in HCC was also recently found to occur in a subset of human tumors through inactivating insertion of Long Interspersed Nucleotide Element 1 (LINE-1) retrotransposon elements.33 Our study supports the role of MCC as a bona-fide tumor suppressor in HCC that can be a direct target of an oncogenic miRNA. As with other tumor suppressors, it is likely that miR-494 overexpression and LINE-1 insertions may represent just two possible mechanisms to inactivate MCC in liver cancer. Furthermore, although we did not find other candidate tumor suppressor genes as miR-494 targets (Supporting Figure 7), we do not rule out the possibility of them being targets in other cell types, or that miR-494 could have other tumor suppressor targets in HCC.
Most earlier in vivo studies aimed at modulating miRNA expression have been performed using orthotopic transplant models.10,15 The data generated from these models are promising and will no doubt remain a fruitful area of research. However, we felt that treatment of liver tumors, as they form, with an miRNA antagonist would more closely replicate the clinical paradigms in which such therapies could eventually be employed. To this end, we took advantage of LT2/MYC mice, with the ability to form de novo liver tumors driven by MYC. In this same model, AAV-based overexpression of miR-26a, a tumor-suppressive miRNA in HCC, was previously shown to diminish tumor growth.11 To our knowledge, we are the first to demonstrate that therapeutic delivery of an miRNA antagonist is successful at limiting the growth of de novo liver tumors. These findings represent a significant step toward the use of anti-miR-based therapy in vivo and indicate that the delivery of antagonists against other highly up-regulated miRNAs, such as miR-21 and 221, could be a promising therapeutic approach in HCC.43,44 The present study highlights the therapeutic potential of targeting miRNAs, such as miR-494, in HCC.
Acknowledgments
The authors thank Mercedes Joaquin for technical assistance, Eric Marcusson (Regulus Therapeutics) for kindly providing miR-494 antagonists and controls, and the TCGA Research Network for generating the TCGA LIHC data sets.
Glossary
- AAV
adeno-associated virus
- AFP
alpha-fetoprotein
- ANOVA
analysis of variance
- bp
base pair
- BrdU
bromodeoxyuridine
- CDC73
cell division cycle 73
- Dox
doxycycline
- GEO
Gene Expression Omnibus
- HCC
hepatocellular carcinoma
- LAP
Liver-Enriched Activator Protein
- LINE-1
Long Interspersed Nucleotide Element 1
- MCC
Mutated in Colorectal Cancer
- miRNAs
microRNAs
- mRNA
messenger RNA
- nts
nucleotides
- PCA
principal component analysis
- PTEN
phosphatase and tensin homolog
- qRT-PCR
quantitative real-time polymerase chain reaction
- RB1
retinoblastoma 1
- RB1CC1
retinoblastoma-1-inducible coiled-coil 1
- SB
Sleeping Beauty
- siRNA
small interfering RNA
- TACC2
transforming, acidic coiled-coil containing protein 2
- Tg
transgenic
- TGFB2
transforming growth factor, beta 2
- UTR
untranslated region.
Supporting Information
Additional Supporting Information may be found in the online version of this article.
Supporting Information Figure 1. Doxycycline-regulated expression of MYC or/and RAS oncogenes give rise to distinct liver tumors. A. Western blot confirming the expression of MYC and RAS in oncogene driven liver tumors. B. Table summarizing the histological characteristics of tumors driven by respective oncogenes.
Supporting Information Figure 2. Genomic organization of the Dlk1-Dio3 locus showing location of representative miRNAs
Supporting Information Figure 3. A. Schematic of miRNA subcluster cloning from the Dlk1-Dio3 region. B. Western blot showing expression of MYC and RAS in LT2M and LT2MR cell lines. C. Verification of miRNA subscluster expression in LT2MR stable cell lines. qRT-PCR was performed to detect expression of representative miRNAs.
Supporting Information Figure 4. Verification of miR-494 and 495 expression in mouse liver tumors. qRT-PCR was performed to detect expression of respective miRNAs.
Supporting Information Figure 5. Quantification of miR-494 levels in engineered LT2MR cell lines by qRT-PCR.
Supporting Information Figure 6. A. Quantification of miR-494 expression in Hepa1-6 cell lines transfected with either a control or miR-494 antimiR, by qRT-PCR. B. Proliferation assay performed on Hepa1-6 cells transfected with either control or miR-494 antimiR. C. Cell cycle analysis following staining for DNA content performed on Hepa1-6 cells transfected with either control or miR-494 antimiR. D. Western blot analysis of MCC, p27 and p21 expression of Hepa1-6 cells cells transfected with either control or miR-494 antimiR.
Supporting Information Figure 7. Luciferase reporter assay on TACC2, TGFB2, RB1, RB1CC1, CDC73 and WEE1 3′ UTRs.
Supporting Information Figure 8. A. Quantification of miR-494 levels in Huh7 and Hep3B cells relative to normal liver tissue. B. Verification of miR-494 expression in tumors treated with either control or miR-494 antimiR. miR-451 expression was tested as a negative control. qRT-PCR was performed to detect expression of respective miRNAs. C. Quantification of TUNEL staining performed on control and miR-494 antimiR treated animals. Representative pictures are shown.
Supporting Information Table 1. Differential expression of miRNAs (fold change -1 > log2 >1 and p<0.05) sorted by tumor specific expression in transgenic mouse tumor models driven by MYC, RAS or MYC+RAS. miRNAs that are upregulated, downregulated and a part of the 12q cluster are listed in separate worksheets for all three genotypes.
Supporting Information Table 2. Increased expression of miR-494 and miR-495 in transgenic mouse liver tumors. Values are expressed as fold difference compared to normal LT2 liver tissue.
Supporting Information Table 3. Primer sequences used for cloning of 12q subcluster miRNAs and 3′UTR reporter constructs.
Supporting Information
References
- 1.Bosch FX, Ribes J, Díaz M, Cléries R. Primary liver cancer: worldwide incidence and trends. Gastroenterology. 2004;127:S5–S16. doi: 10.1053/j.gastro.2004.09.011. [DOI] [PubMed] [Google Scholar]
- 2.Schlaeger C, Longerich T, Schiller C, Bewerunge P, Mehrabi A, Toedt G, et al. Etiology-dependent molecular mechanisms in human hepatocarcinogenesis. Hepatology. 2008;47:511–520. doi: 10.1002/hep.22033. [DOI] [PubMed] [Google Scholar]
- 3.Gan FY, Gesell MS, Alousi M, Luk GD. Analysis of ODC and c-myc gene expression in hepatocellular carcinoma by in situ hybridization and immunohistochemistry. J Histochem Cytochem. 1993;41:1185–1196. doi: 10.1177/41.8.7687263. [DOI] [PubMed] [Google Scholar]
- 4.Newell P, Toffanin S, Villanueva A, Chiang DY, Minguez B, Cabellos L, et al. Ras pathway activation in hepatocellular carcinoma and anti-tumoral effect of combined sorafenib and rapamycin in vivo. J Hepatol. 2009;51:725–733. doi: 10.1016/j.jhep.2009.03.028. [DOI] [PMC free article] [PubMed] [Google Scholar]
- 5.Calvisi DF, Ladu S, Gorden A, Farina M, Conner EA, Lee JS, et al. Ubiquitous activation of Ras and Jak/Stat pathways in human HCC. Gastroenterology. 2006;130:1117–1128. doi: 10.1053/j.gastro.2006.01.006. [DOI] [PubMed] [Google Scholar]
- 6.Llovet JM, Bruix J. Molecular targeted therapies in hepatocellular carcinoma. Hepatology. 2008;48:1312–1327. doi: 10.1002/hep.22506. [DOI] [PMC free article] [PubMed] [Google Scholar]
- 7.Llovet JM, Ricci S, Mazzaferro V, Hilgard P, Gane E, Blanc JF, et al. Sorafenib in advanced hepatocellular carcinoma. N Engl J Med. 2008;359:378–390. doi: 10.1056/NEJMoa0708857. [DOI] [PubMed] [Google Scholar]
- 8.Zimmermann TS, Lee AC, Akinc A, Bramlage B, Bumcrot D, Fedoruk MN, et al. RNAi-mediated gene silencing in non-human primates. Nature. 2006;441:111–114. doi: 10.1038/nature04688. [DOI] [PubMed] [Google Scholar]
- 9.He L, Hannon GJ. MicroRNAs: small RNAs with a big role in gene regulation. Nat Rev Genet. 2004;5:522–531. doi: 10.1038/nrg1379. [DOI] [PubMed] [Google Scholar]
- 10.Braconi C, Patel T. Non-coding RNAs as therapeutic targets in hepatocellular cancer. Curr Cancer Drug Targets. 2012;12:1073–1080. [PMC free article] [PubMed] [Google Scholar]
- 11.Kota J, Chivukula RR, O’Donnell KA, Wentzel EA, Montgomery CL, Hwang HW, et al. Therapeutic microRNA delivery suppresses tumorigenesis in a murine liver cancer model. Cell. 2009;137:1005–1017. doi: 10.1016/j.cell.2009.04.021. [DOI] [PMC free article] [PubMed] [Google Scholar]
- 12.Donsante A, Miller DG, Li Y, Vogler C, Brunt EM, Russell DW, et al. AAV vector integration sites in mouse hepatocellular carcinoma. Science. 2007;317:477. doi: 10.1126/science.1142658. [DOI] [PubMed] [Google Scholar]
- 13.Elmén J, Lindow M, Silahtaroglu A, Bak M, Christensen M, Lind-Thomsen A, et al. Antagonism of microRNA-122 in mice by systemically administered LNA-antimiR leads to up-regulation of a large set of predicted target mRNAs in the liver. Nucleic Acids Res. 2008;36:1153–1162. doi: 10.1093/nar/gkm1113. [DOI] [PMC free article] [PubMed] [Google Scholar]
- 14.Lanford RE, Hildebrandt-Eriksen ES, Petri A, Persson R, Lindow M, Munk ME, et al. Therapeutic silencing of microRNA-122 in primates with chronic hepatitis C virus infection. Science. 2010;327:198–201. doi: 10.1126/science.1178178. [DOI] [PMC free article] [PubMed] [Google Scholar]
- 15.Park JK, Kogure T, Nuovo GJ, Jiang J, He L, Kim JH, et al. miR-221 silencing blocks hepatocellular carcinoma and promotes survival. Cancer Res. 2011;71:7608–7616. doi: 10.1158/0008-5472.CAN-11-1144. [DOI] [PMC free article] [PubMed] [Google Scholar]
- 16.Chin L, Tam A, Pomerantz J, Wong M, Holash J, Bardeesy N, et al. Essential role for oncogenic Ras in tumour maintenance. Nature. 1999;400:468–472. doi: 10.1038/22788. [DOI] [PubMed] [Google Scholar]
- 17.Kistner A, Gossen M, Zimmermann F, Jerecic J, Ullmer C, Lübbert H, Bujard H. Doxycycline-mediated quantitative and tissue-specific control of gene expression in transgenic mice. Proc Natl Acad Sci U S A. 1996;93:10933–10938. doi: 10.1073/pnas.93.20.10933. [DOI] [PMC free article] [PubMed] [Google Scholar]
- 18.Shachaf CM, Kopelman AM, Arvanitis C, Karlsson A, Beer S, Mandl S. MYC inactivation uncovers pluripotent differentiation and tumour dormancy in hepatocellular cancer. Nature. 2004;431:1112–1117. doi: 10.1038/nature03043. [DOI] [PubMed] [Google Scholar]
- 19.Huber W, von Heydebreck A, Sültmann H, Poustka A, Vingron M, et al. Variance stabilization applied to microarray data calibration and to the quantification of differential expression. Bioinformatics. 2002;18(Suppl 1):S96–S104. doi: 10.1093/bioinformatics/18.suppl_1.s96. [DOI] [PubMed] [Google Scholar]
- 20.Burchard J, Zhang C, Liu AM, Poon RT, Lee NP, Wong KF, et al. microRNA-122 as a regulator of mitochondrial metabolic gene network in hepatocellular carcinoma. Mol Syst Biol. 2010;6:402. doi: 10.1038/msb.2010.58. [DOI] [PMC free article] [PubMed] [Google Scholar]
- 21.Fehniger TA, Wylie T, Germino E, Leong JW, Magrini VJ, Koul S, et al. Next-generation sequencing identifies the natural killer cell microRNA transcriptome. Genome Res. 2010;20:1590–1604. doi: 10.1101/gr.107995.110. [DOI] [PMC free article] [PubMed] [Google Scholar]
- 22.Dupuy AJ, Rogers LM, Kim J, Nannapaneni K, Starr TK, Liu P, et al. A modified sleeping beauty transposon system that can be used to model a wide variety of human cancers in mice. Cancer Res. 2009;69:8150–8156. doi: 10.1158/0008-5472.CAN-09-1135. [DOI] [PMC free article] [PubMed] [Google Scholar]
- 23.Horiuchi D, Kusdra L, Huskey NE, Chandriani S, Lenburg ME, Gonzalez-Angulo AM, et al. MYC pathway activation in triple-negative breast cancer is synthetic lethal with CDK inhibition. J Exp Med. 2012;209:679–696. doi: 10.1084/jem.20111512. [DOI] [PMC free article] [PubMed] [Google Scholar]
- 24.Goga A, Yang D, Tward AD, Morgan DO, Bishop JM. Inhibition of CDK1 as a potential therapy for tumors over-expressing MYC. Nat Med. 2007;13:820–827. doi: 10.1038/nm1606. [DOI] [PubMed] [Google Scholar]
- 25.Cairo S, Armengol C, De Reyniès A, Wei Y, Thomas E, Renard CA, et al. Hepatic stem-like phenotype and interplay of Wnt/beta-catenin and Myc signaling in aggressive childhood liver cancer. Cancer Cell. 2008;14:471–484. doi: 10.1016/j.ccr.2008.11.002. [DOI] [PubMed] [Google Scholar]
- 26.Abou-Alfa GK, Venook AP. The impact of new data in the treatment of advanced hepatocellular carcinoma. Curr Oncol Rep. 2008;10:199–205. doi: 10.1007/s11912-008-0031-x. [DOI] [PubMed] [Google Scholar]
- 27.Yamashita T, Forgues M, Wang W, Kim JW, Ye Q, Jia H, et al. EpCAM and alpha-fetoprotein expression defines novel prognostic subtypes of hepatocellular carcinoma. Cancer Res. 2008;68:1451–1461. doi: 10.1158/0008-5472.CAN-07-6013. [DOI] [PubMed] [Google Scholar]
- 28.He L, Thomson JM, Hemann MT, Hernando-Monge E, Mu D, Goodson S, et al. A microRNA polycistron as a potential human oncogene. Nature. 2005;435:828–833. doi: 10.1038/nature03552. [DOI] [PMC free article] [PubMed] [Google Scholar]
- 29.O’Donnell KA, Wentzel EA, Zeller KI, Dang CV, Mendell JT. c-Myc-regulated microRNAs modulate E2F1 expression. Nature. 2005;435:839–843. doi: 10.1038/nature03677. [DOI] [PubMed] [Google Scholar]
- 30.Stadtfeld M, Apostolou E, Akutsu H, Fukuda A, Follett P, Natesan S, et al. Aberrant silencing of imprinted genes on chromosome 12qF1 in mouse induced pluripotent stem cells. Nature. 2010;465:175–181. doi: 10.1038/nature09017. [DOI] [PMC free article] [PubMed] [Google Scholar]
- 31.Cavaillé J, Seitz H, Paulsen M, Ferguson-Smith AC, Bachellerie JP. Identification of tandemly-repeated C/D snoRNA genes at the imprinted human 14q32 domain reminiscent of those at the Prader-Willi/Angelman syndrome region. Hum Mol Genet. 2002;11:1527–1538. doi: 10.1093/hmg/11.13.1527. [DOI] [PubMed] [Google Scholar]
- 32.Olive V, Bennett MJ, Walker JC, Ma C, Jiang I, Cordon-Cardo C, et al. miR-19 is a key oncogenic component of mir-17-92. Genes Dev. 2009;23:2839–2849. doi: 10.1101/gad.1861409. [DOI] [PMC free article] [PubMed] [Google Scholar]
- 33.Shukla R, Upton KR, Muñoz-Lopez M, Gerhardt DJ, Fisher ME, Nguyen T, et al. Endogenous retrotransposition activates oncogenic pathways in hepatocellular carcinoma. Cell. 2013;153:101–111. doi: 10.1016/j.cell.2013.02.032. [DOI] [PMC free article] [PubMed] [Google Scholar]
- 34.Lempiäinen H, Couttet P, Bolognani F, Müller A, Dubost V, Luisier R, et al. Identification of Dlk1-Dio3 imprinted gene cluster noncoding RNAs as novel candidate biomarkers for liver tumor promotion. Toxicol Sci. 2013;131:375–386. doi: 10.1093/toxsci/kfs303. [DOI] [PubMed] [Google Scholar]
- 35.Luk JM, Burchard J, Zhang C, Liu AM, Wong KF, Shek FH, et al. DLK1-DIO3 Genomic imprinted microRNA cluster at 14q32.2 defines a stemlike subtype of hepatocellular carcinoma associated with poor survival. J Biol Chem. 2011;286:30706–30713. doi: 10.1074/jbc.M111.229831. [DOI] [PMC free article] [PubMed] [Google Scholar]
- 36.Riordan JD, Keng VW, Tschida BR, Scheetz TE, Bell JB, Podetz-Pedersen KM, et al. Identification of rtl1, a retrotransposon-derived imprinted gene, as a novel driver of hepatocarcinogenesis. PLoS Genet. 2013;9:e1003441. doi: 10.1371/journal.pgen.1003441. [DOI] [PMC free article] [PubMed] [Google Scholar]
- 37.Swarbrick A, Woods SL, Shaw A, Balakrishnan A, Phua Y, Nguyen A, et al. miR-380-5p represses p53 to control cellular survival and is associated with poor outcome in MYCN-amplified neuroblastoma. Nat Med. 2010;16:1134–1140. doi: 10.1038/nm.2227. [DOI] [PMC free article] [PubMed] [Google Scholar]
- 38.Liu L, Jiang Y, Zhang H, Greenlee AR, Han Z. Overexpressed miR-494 down-regulates PTEN gene expression in cells transformed by anti-benzo(a)pyrene-trans-7,8-dihydrodiol-9,10-epoxide. Life Sci. 2010;86:192–198. doi: 10.1016/j.lfs.2009.12.002. [DOI] [PubMed] [Google Scholar]
- 39.Liu Y, Lai L, Chen Q, Song Y, Xu S, Ma F, et al. MicroRNA-494 is required for the accumulation and functions of tumor-expanded myeloid-derived suppressor cells via targeting of PTEN. J Immunol. 2012;188:5500–5510. doi: 10.4049/jimmunol.1103505. [DOI] [PubMed] [Google Scholar]
- 40.Romano G, Acunzo M, Garofalo M, Di Leva G, Cascione L, Zanca C, et al. MiR-494 is regulated by ERK1/2 and modulates TRAIL-induced apoptosis in non-small-cell lung cancer through BIM down-regulation. Proc Natl Acad Sci U S A. 2012;109:16570–16575. doi: 10.1073/pnas.1207917109. [DOI] [PMC free article] [PubMed] [Google Scholar]
- 41.Ohdaira H, Sekiguchi M, Miyata K, Yoshida K. MicroRNA-494 suppresses cell proliferation and induces senescence in A549 lung cancer cells. Cell Prolif. 2012;45:32–38. doi: 10.1111/j.1365-2184.2011.00798.x. [DOI] [PMC free article] [PubMed] [Google Scholar]
- 42.Olaru AV, Ghiaur G, Yamanaka S, Luvsanjav D, An F, Popescu I, et al. MicroRNA down-regulated in human cholangiocarcinoma control cell cycle through multiple targets involved in the G1/S checkpoint. Hepatology. 2011;54:2089–2098. doi: 10.1002/hep.24591. [DOI] [PMC free article] [PubMed] [Google Scholar]
- 43.Connolly E, Melegari M, Landgraf P, Tchaikovskaya T, Tennant BC, Slagle BL, et al. Elevated expression of the miR-17-92 polycistron and miR-21 in hepadnavirus-associated hepatocellular carcinoma contributes to the malignant phenotype. Am J Pathol. 2008;173:856–864. doi: 10.2353/ajpath.2008.080096. [DOI] [PMC free article] [PubMed] [Google Scholar]
- 44.Pineau P, Volinia S, McJunkin K, Marchio A, Battiston C, Terris B, et al. miR-221 overexpression contributes to liver tumorigenesis. Proc Natl Acad Sci U S A. 2010;107:264–269. doi: 10.1073/pnas.0907904107. [DOI] [PMC free article] [PubMed] [Google Scholar]
Associated Data
This section collects any data citations, data availability statements, or supplementary materials included in this article.
Supplementary Materials
Supporting Information Figure 1. Doxycycline-regulated expression of MYC or/and RAS oncogenes give rise to distinct liver tumors. A. Western blot confirming the expression of MYC and RAS in oncogene driven liver tumors. B. Table summarizing the histological characteristics of tumors driven by respective oncogenes.
Supporting Information Figure 2. Genomic organization of the Dlk1-Dio3 locus showing location of representative miRNAs
Supporting Information Figure 3. A. Schematic of miRNA subcluster cloning from the Dlk1-Dio3 region. B. Western blot showing expression of MYC and RAS in LT2M and LT2MR cell lines. C. Verification of miRNA subscluster expression in LT2MR stable cell lines. qRT-PCR was performed to detect expression of representative miRNAs.
Supporting Information Figure 4. Verification of miR-494 and 495 expression in mouse liver tumors. qRT-PCR was performed to detect expression of respective miRNAs.
Supporting Information Figure 5. Quantification of miR-494 levels in engineered LT2MR cell lines by qRT-PCR.
Supporting Information Figure 6. A. Quantification of miR-494 expression in Hepa1-6 cell lines transfected with either a control or miR-494 antimiR, by qRT-PCR. B. Proliferation assay performed on Hepa1-6 cells transfected with either control or miR-494 antimiR. C. Cell cycle analysis following staining for DNA content performed on Hepa1-6 cells transfected with either control or miR-494 antimiR. D. Western blot analysis of MCC, p27 and p21 expression of Hepa1-6 cells cells transfected with either control or miR-494 antimiR.
Supporting Information Figure 7. Luciferase reporter assay on TACC2, TGFB2, RB1, RB1CC1, CDC73 and WEE1 3′ UTRs.
Supporting Information Figure 8. A. Quantification of miR-494 levels in Huh7 and Hep3B cells relative to normal liver tissue. B. Verification of miR-494 expression in tumors treated with either control or miR-494 antimiR. miR-451 expression was tested as a negative control. qRT-PCR was performed to detect expression of respective miRNAs. C. Quantification of TUNEL staining performed on control and miR-494 antimiR treated animals. Representative pictures are shown.
Supporting Information Table 1. Differential expression of miRNAs (fold change -1 > log2 >1 and p<0.05) sorted by tumor specific expression in transgenic mouse tumor models driven by MYC, RAS or MYC+RAS. miRNAs that are upregulated, downregulated and a part of the 12q cluster are listed in separate worksheets for all three genotypes.
Supporting Information Table 2. Increased expression of miR-494 and miR-495 in transgenic mouse liver tumors. Values are expressed as fold difference compared to normal LT2 liver tissue.
Supporting Information Table 3. Primer sequences used for cloning of 12q subcluster miRNAs and 3′UTR reporter constructs.
Supporting Information