Abstract
Arginine metabolism in Enterococcus faecium sp. GR7 was enhanced via arginine deiminase pathway. Process parameters including fermentation media and environmental conditions were optimized using independent experiments and response surface methodology (central composite design). Fermentation media (EAPM) were optimized using independent experiments which resulted in 4-fold increase in arginine deiminase specific activity as compared to basal medium. To further enhance arginine deiminase activity in E. faecium sp. GR7 and biomass production including a five-level central composite design (CCD) was employed to study the interactive effect of three-process variables. Response surface methodology suggested a quadratic model which was further validated experimentally where it showed approximately 15-fold increase in arginine metabolism (in terms of arginine deiminase specific activity) over basal medium. By solving the regression equation and analyzing the response surface cartons, optimal concentrations of the media components (g/L) were determined as arginine 20.0; tryptone 15.0; lactose 10.0; K2HPO4 3.0; NaCl 1.0, MnSO4 0.6 mM; Tween 80 1%; pH 6.0 for achieving specific arginine deiminase activity of 4.6 IU/mG with concomitant biomass production of 12.1 mg/L. The model is significant as the coefficient of determination (R 2) was 0.87 to 0.90 for all responses. Enhanced arginine deiminase yield from E. faecium, a GRAS lactic acid bacterial strain, is desirable to explore in vitro therapeutic potential of the arginine metabolizing E. faecium sp. GR7.
1. Introduction
L-arginine is classified as conditionally essential amino acid for protein synthesis that is metabolized through citrulline, ornithine, creatine, proline, and polyamines in human body [1, 2]. It is used by a number of microorganisms to generate ATP fermentatively via arginine deiminase (ADI) pathway which is also known as arginine dihydrolase (ADH) pathway [3]. Arginine is metabolized by three successive enzymatic reactions (Figure 1), involving arginine deiminase (ADI; EC 3.5.3.6) to citrulline and ammonia, ornithine transcarbamylase (EC 2.1.3.3) to ornithine and carbamoyl phosphate and finally to ATP by carbamate kinase (EC 2.7.2.2) [4]. ADI activity is previously reported in many lactic acid bacteria including Enterococcus faecalis, Lactobacillus sp., Lactococcus, Leuconostoc, Oenococcus, Streptococcus, and Weissella [3, 5–10]. In general, arginine induces expression of ADI pathway enzymes, and some carbohydrates such as glucose and galactose are known to control their synthesis by catabolite repression [9].
Figure 1.
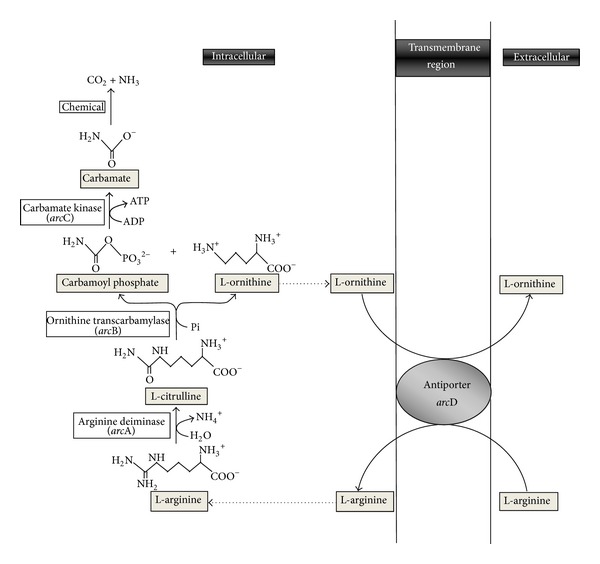
Arginine catabolism in E. faecium.
The present study was aimed to screen and optimize media components that increase ADI activity of Enterococcus sp. RSM, formerly known as Box-Wilson methodology, is the most widely used statistical technique to evaluate relationship between a set of controllable experimental factors and observed results [11]. RSM is capable to find optimum set of experimental factors that produce maximum or minimum value of response and represent the direct and interactive effect of process variables through two-dimensional and three-dimensional graphs. Keeping in view, the great commercial application of ADI as a therapeutic agent; an attempt was made to optimize the composition of the ADI production media for E. faecium sp. GR7 which was carried out in two steps. Independent experiments for the selection of most influential process parameters including fermentation media and environmental conditions were performed followed by application of CCD design for final optimization of media components to enhance ADI activity and biomass production using influential process variables.
2. Materials and Methods
2.1. Bacterial Strain and Culture Medium Used
E. faecium sp. GR7 used in the study was cultured in MAM medium (g/L) consisting of tryptone 10.0; glucose 5.0; yeast extract 5.0; arginine 3.0; KH2PO4 0.5; MgSO4 0.2; MnSO4 0.05; Tween 80 1.0 mL/L; Agar 2.0; pH 6.0 [12]. Optical density of the inoculums was adjusted to 1.0, and 1% v/v culture was used in each experiment. Cultures were incubated at 37°C for 24 h.
2.2. Enzyme Assay
To determine enzyme activity, 24 h-old cultures were centrifuged at 8,000 rpm for 10 min. Cell free supernatant (CFS) was assessed for extracellular protein and enzyme activity. For assaying intracellular ADI activity, cell pellet was resuspended in lysis buffer. Total protein was estimated by measuring absorption at 280 nm using standard curve of BSA. ADI activity was assayed using standard method of De Angelis et al. [12]. Assay mixture consisted of 150 μL of 50 mM arginine, 2.3 mL of 50 mM acetate buffer (pH 5.5), 50 μL of cell wall or cytoplasm preparation, and 3.6 μL of sodium azide (0.05% w/v). Controls without substrate and without enzyme were included. After incubation at 37°C for 1 h, the reaction was stopped by adding 0.5 mL solution of 2N HCl, and precipitated protein was removed by centrifugation. Citrulline content after enzyme assay in CFS was determined by Archibald's method [13]. One milliliter of the supernatant was added to 1.5 mL of an acid mixture of H3PO4-H2SO4 (3/1 v/v) and 250 μL of diacetyl monoxime (1.5% 2, 3 butanedione monoxime) in 10% (v/v) methanol, mixed and boiled in the dark for 30 min. After cooling for 10 min, absorbance was measured at 460 nm and one enzyme unit was calculated as the amount of enzyme required to catalyze formation of 1 μmol citrulline per min. Finally, specific activity was calculated as international enzyme units present per mg (IU/mG) of protein.
2.3. Selection of Basal Medium for ADI Production
Six culture media including MAM [12]; MRS [14]; TGYE [15]; (modified) MRS broth [12]; Enterococcus confirmatory broth [16]; and M9 Minimal salt media [17] each supplemented with arginine (15 mM) were selected to investigate production of ADI in E. faecium sp. GR7. Inoculums were subcultured twice in MAM broth at 37°C for 24 h and used at 1% v/v for each experiment. ADI specific activity was determined following standard procedures of De Angelis et al. [12] and Archibald [13].
2.4. Optimization of Process Parameters for Enhancing ADI Activity
E. faecium sp. GR7 was grown in the selected medium (TGYE) and the effect of various parameters, that is, initial pH (5.0 to 7.0), inoculum size (1 to 5% v/v), subculturing period (1 to 4 days), incubation temperature (25°C to 50°C), and culture incubation conditions, that is, aerobic, anaerobic, shaking (200 rpm) on ADI production was studied individually, by varying one factor at a time. At each step, the selected factor was included in the basal medium (selected from the previous experiment) for getting a set of conditions that enhanced ADI activity in E. faecium sp. GR7. Rest of the conditions and enzyme assays were described previously.
2.5. Effect of Various Nutrients on Enzyme Production
The effect of various carbon and nitrogen sources on enzyme production in E. faecium sp. GR7 was investigated. In the production medium, carbon of the basal media was replaced with glucose, galactose, sucrose, maltose, lactose, and fructose, and nitrogen with yeast extract, peptone, tryptone, and beef extract which were tested at levels ranging from 5 to 20 g/L (w/v).
2.6. Effect of Inducer Concentration
Effect of inducer concentration, that is, arginine on ADI production was studied by supplementing basal medium with different concentrations of arginine from 5 to 20 mM (w/v).
2.7. Effect of Salts and Surfactants on Enzyme Production
Basal medium was supplemented with various salts such as NaCl (0.5–5 g/L) (w/v), K2HPO4 (0.5–5 g/L) (w/v), MnSO4 (0.2–2 mM) (w/v), CuSO4 (0.025–0.075 mM) (w/v), ZnSO4 (2–6 mM) (w/v), and surfactants including CTAB, SDS, Tween 80, and Triton X-100 (0.1% w/v) to investigate their role in improving enzyme production and secretion by E. faecium sp. GR7.
2.8. Experimental Design
Important process variables, identified based on independent experiments, were finally used to optimize composition of the ADI production medium for E. faecium sp. GR7. RSM is a successive and exploratory tool for establishing the influence and interaction among variables on biological activities [18]. Experimental design central composite design (CCD) of RSM using Design Expert Software trial version 8.0.2 statistical software (State-Ease Inc., Minneaopolis, MN, USA) was applied for improving enzyme activity and cell densities in the LAB isolate, that is, E. faecium sp. GR7. A quadratic model obtained by a multiple regression technique for three factors, that is, tryptone, lactose, and arginine was studied at five different levels along with four constant variables, so that, interactions among these variables at different levels could be studied for two responses, that is, ADI activity and biomass (Table 1). During CCD experiments, concentrations of K2HPO4 3 g/L, NaCl 1 g/L, MnSO4 0.6 mM, and Tween-80 1%, pH 6.0, and temperature 30°C for 24 h under aerobic conditions were kept as constant factors. In all the CCD experimental runs, biomass and enzyme activities were assayed using standard protocols as described previously. A total of 20 experiments were employed in CCD to estimate curvature and interaction effects of selected variables, and finally, significance of the obtained model was checked by F-test and goodness of fit by multiple correlation R as well as determination R 2 coefficients. All design matrices were generated and analysed using Design-Expert 8.0.2 to illustrate the relationships between experimental and predicted values, and the results were depicted as 2D contour plots.
Table 1.
Variables and their levels for arginine deiminase production by E. faecium sp. GR7.
| Factor (g/L) | Low level star point (−α) | Low level factorial (−1) | Central point (0) | High level factorial (+1) | High level star point (+α) |
|---|---|---|---|---|---|
| A-tryptone | −0.23 | 0 | 15 | 30 | 40.23 |
| B-lactose | −6.82 | 0 | 10 | 20 | 26.87 |
| C-arginine | −6.82 | 0 | 10 | 20 | 26.817 |
2.9. Experimental Validation of Statistical Model
The response surface model was validated under the predicted conditions in triplicates. On the basis of results obtained in statistical RSM analysis, the optimized medium (g/L) was composed of tryptone 15.0; lactose 10.0; arginine 20.0; MnSO4 0.6 mM; NaCl 1.0; K2HPO4 3.0; Tween 80 1%; pH-6.0. The media were inoculated with E. faecium sp. GR7 (1% v/v) and incubated at 30°C for 24 h. The samples were collected after 4 h intervals to estimate specific ADI activity and growth A 600 for optimized and unoptimized media basal medium.
2.10. Statistical Analysis
One way Anova analysis was carried out, and the results are presented as mean ± standard deviation of three triplicate experiments. A probability value of P value <0.05 was used as the criterion for statistical significance.
3. Results and Discussion
3.1. Selection of Basal Medium for ADI Production
MAM, MRS, TGYE, MRS (modified), Enterococcus confirmatory media, and M9 minimal salt media were selected on the basis of previous literature citations for studying ADI enzyme production in E. faecium sp. GR7. The highest specific ADI activity of 0.182 ± 0.001 IU/mG was observed in TGYE media when supplemented with 15 mM arginine (as shown in Figure 2), which was selected as a basal media for further study of process parameter variables on nutrients, inducers, salts, surfactants, and processing parameters on ADI production of E. faecium sp. GR7.
Figure 2.
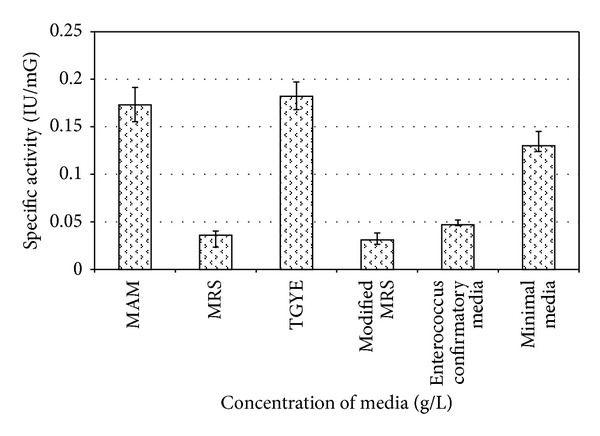
Effect of culture media on specific ADI activity of E. faecium sp. GR7. Results are expressed as the mean ± S.D (n = 3), P value <0.05.
3.2. Effect of Initial pH, Temperature, and Culture Conditions on Arginine Production
When grown in basal media E. faecium sp. GR7 yielded maximum ADI activity of 0.187 IU/mG at pH 6.0 when incubated at 30°C for 24 h (Figures 3 and 4), which was better when the cultures were kept under aerobic and stationary conditions (Figure 5).
Figure 3.
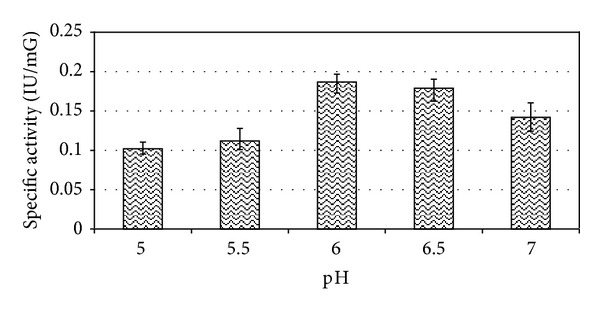
Effect of pH on specific ADI activity of E. faecium sp. GR7. Results are expressed as the mean ± S.D (n = 3), P value <0.05.
Figure 4.
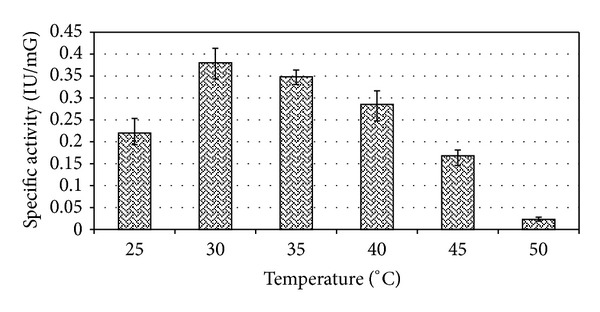
Effect of temperature on ADI enzyme production in E. faecium sp. GR7. Results are expressed as the mean ± S.D (n = 3), P value <0.05.
Figure 5.
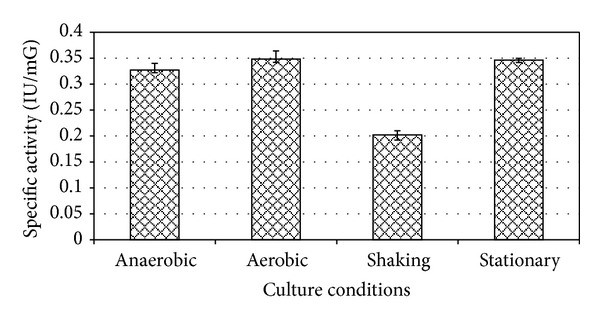
Effect of culture conditions on enzyme production. Results are expressed as the mean ± S.D (n = 3), P value <0.05.
3.3. Effect of Inoculum and Subculturing
Maximum ADI production in E. faecium sp. GR7 was reported with 2% (0.462 IU/mG) inoculum size and after 2nd subculturing period (Figure 6).
Figure 6.
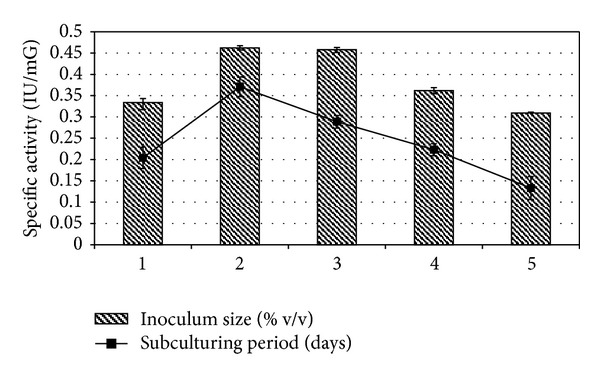
Effect of inoculum size and subculturing period on enzyme production. Results are expressed as the mean ± S.D (n = 3), P-value <0.05.
3.4. Effect of Carbon and Nitrogen Sources
Among the carbon sources, lactose supported a maximum specific ADI activity at concentration (20 g/L) of 0.131 IU/mG (Figure 7). Tryptone gave maximum enzyme activity of 0.306 IU/mG at concentration of 10 g/L (Figure 8).
Figure 7.
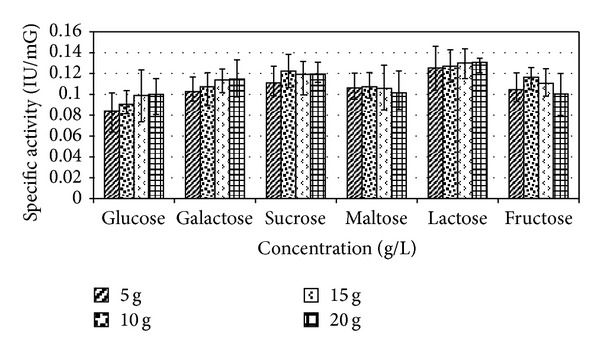
Effect of sugars on enzyme production. Results are expressed as the mean ± S.D (n = 3), P-value <0.05.
Figure 8.
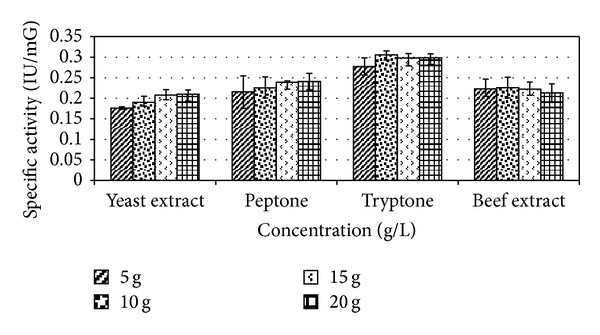
Effect of different nitrogen concentrations on enzyme production. Results are expressed as the mean ± S.D (n = 3), P-value <0.05.
3.5. Effect of Arginine
The ADI pathway is an arginine inducible system in most of the microorganisms [5, 9, 12, 25, 27–29]. In our study, maximum specific ADI activity of 0.464 ± 0.014 IU/mG for E. faecium sp. GR7 was obtained in production media supplemented 15 mM arginine as compared to unsupplemented basal media as shown in Figure 9.
Figure 9.
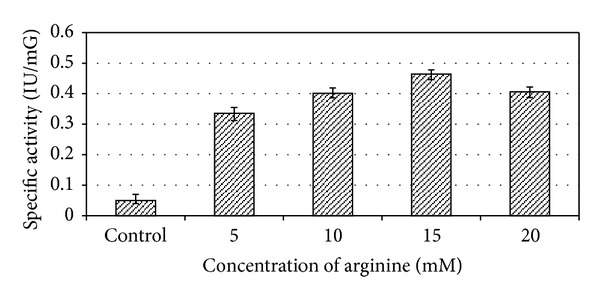
Effect of arginine (inducer) concentration on specific ADI activity of E. faecium sp. GR7. Results are expressed as the mean ± S.D (n = 3), P-value <0.05.
3.6. Effect of Salt and Surfactants
Among varying concentrations of metal salts, that is, MnSO4, CuSO4, and ZnSO4, E. faecium sp. GR7 showed highest ADI activity of 0.186 ± 0.010 IU/mG at the concentration of 0.6 mM (Figure 10). ADI specific activity was also enhanced by NaCl and K2HPO4 salts (Figure 11). Among surface active agents, production media showed highest specific ADI activity (0.318 ± 0.012 IU/mG) when supplemented with 0.1% Tween 80 (Figure 12).
Figure 10.
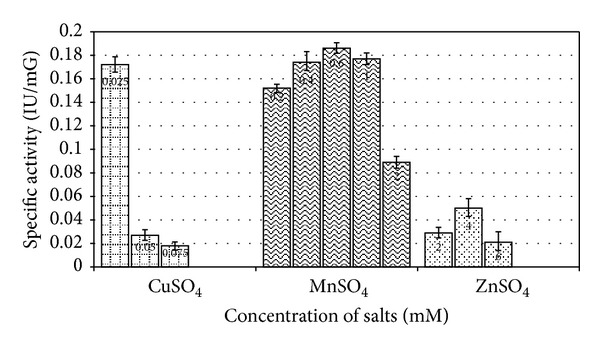
Effect of various metal ions on specific ADI activity. Results are expressed as the mean ± S.D (n = 3), P-value <0.05.
Figure 11.
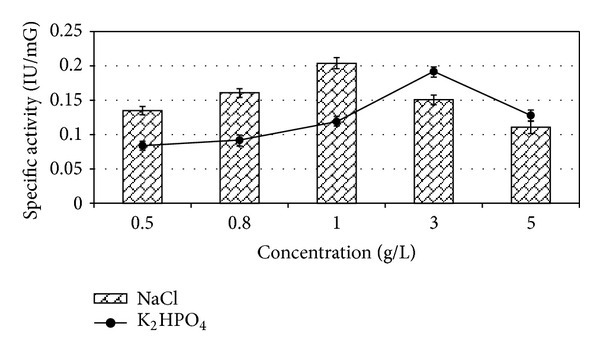
Effect of salt concentrations on specific ADI activity by E. faecium sp. GR7. Results are expressed as the mean ± S.D (n = 3), P-value <0.05.
Figure 12.
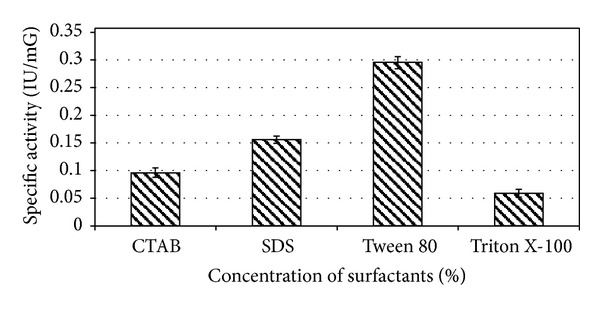
Effect of surfactants on specific ADI activity by E. faecium sp. GR7. Results are expressed as the mean ± S.D (n = 3), P-value <0.05.
A new medium including the best source of carbon, nitrogen, inducer, salts, and surfactants for ADI production was improved, and bacterium E. faecium sp. GR7 was grown in this new medium under optimized process parameters and culture conditions lactose 20 g/L; tryptone 20 g/L; arginine 15 mM; MnSO4 0.6 mM; NaCl 1.0 g/L; K2HPO4 3 g/L; Tween 80 1%; pH-6.0 at 30°C for 24 h under aerobic conditions. The specific ADI activity by E. faecium sp.GR7 was enhanced to 4 folds (0.732 ± 0.006 IU/mG) as compared to TGYE basal media (0.182 ± 0.001 IU/mG).
3.7. Central Composite Design
A new medium was formed by selecting most influencing variables from independent experiments, which was further optimized using RSM to enhance enzyme production. In statistical tool CCD, each selected variable, that is, lactose, tryptone, and arginine while keeping MnSO4, NaCl, K2HPO4, Tween 80, and pH-6 at 30°C for 24 h under aerobic conditions as constant factors was studied at five different levels along with other variables, and therefore, the interaction among the variables at their different levels could be studied. When grown in unoptimized TGYE broth, E. faecium sp. GR7 showed 0.182 IU/mG of specific ADI activity with a growth of 0.823 at A 600 nm after 24 h of incubation at 30°C. In order to enhance specific ADI activity and studying growth, experiments were designed to optimize media constituents.
Results obtained were fed into Design-Expert software and analyzed using analysis of variance (ANOVA) as appropriate to the experimental design used. Based on the CCD, the experimental levels of specific ADI activity under each set of condition were determined and compared with the corresponding predicted levels suggested by Design-Expert 8.0.2 (Table 2). The maximum experimental value for ADI specific activity was 4.27 IU/mG (the average of triplicates), while the value of predicted response is 4.29 IU/mG. Approximately 99% of validity was achieved, indicating the model exerted an adequate prediction on the enzyme activity. The close correlation between the experimental and predicted data indicates the appropriateness of the experimental design. The quality of the model can also be checked using various criteria. The calculated regression equation for the optimization of media constituents assessed the specific activity (Y) and growth (G) as a function of these variables. Multiple regression analysis of the experimental data was carried out, and statistical equation was generated which gives ADI enzyme activity and growth according to (1) and (2), respectively, as follows:
| (1) |
| (2) |
where Y represents specific enzyme activity, G represents growth, and A, B, C are coded values of tryptone, lactose, and arginine, respectively. Tables 5 and 6 show ANOVA results for the RSM quadratic model for Y and G are responses, respectively. According to the present model A, C, AB, BC, A 2 are significant model terms for Y response, and A, B, AB, B 2, C 2 are significant model terms for G response, respectively.
Table 2.
Experimental design and results of central composite design for ADI specific activity and growth from E. faecium sp. GR7.
| Run | Tryptone | Lactose | Arginine | Growth (A 600) | Specific activity (IU/mG) | ||
|---|---|---|---|---|---|---|---|
| (g/L) | (g/L) | (g/L) | Predicted value | Experimental value | Predicted value | Experimental value | |
| 1 | 0 | 0 | 0 | 1.771 | 1.156 | 0.001 | 0.839 |
| 2 | 0 | −α | 0 | 1.822 | 0.103 | 1.153 | 0.172 |
| 3 | 0 | 0 | +α | 0.328 | 0.185 | 2.103 | 0.888 |
| 4 | −1 | −1 | −1 | 1.706 | 0.002 | 0.083 | 0.0002 |
| 5 | +1 | +1 | +1 | 0.029 | 1.607 | 3.332 | 0.643 |
| 6 | −1 | +1 | −1 | 1.232 | 0.054 | 0.835 | 4.169 |
| 7 | −1 | −1 | +1 | 1.232 | 0.022 | 0.835 | 2.406 |
| 8 | +1 | +1 | −1 | −0.102 | 1.377 | 1.906 | 0.251 |
| 9 | 0 | 0 | 0 | 1.232 | 1.249 | 0.835 | 0.839 |
| 10 | +1 | −1 | −1 | 0.237 | 0.259 | 2.103 | 0.295 |
| 11 | 0 | 0 | 0 | 0.548 | 1.156 | 0.261 | 0.839 |
| 12 | 0 | 0 | 0 | 1.232 | 1.249 | 0.835 | 1.056 |
| 13 | 0 | 0 | 0 | 1.232 | 1.26 | 0.835 | 0.779 |
| 14 | +α | 0 | 0 | 0.149 | 2.26 | 0.761 | 0.492 |
| 15 | 0 | +α | 0 | 1.232 | 1.276 | 1.743 | 1.272 |
| 16 | +1 | 0 | +1 | 0.322 | 0.154 | 4.295 | 4.274 |
| 17 | +1 | −1 | +1 | 0.029 | 0.028 | 3.399 | 4.034 |
| 18 | 0 | 0 | 0 | 0.173 | 1.26 | −0.189 | 0.839 |
| 19 | −α | 0 | 0 | 1.068 | 0.041 | 1.743 | 3.109 |
| 20 | 0 | 0 | −α | 0.097 | 0.958 | 3.508 | 0.428 |
Table 5.
Regression analysis (ANOVA) for the growth.
| Source | Sum of squares | Degree of freedom | Mean squares | F value | P value | Prob > F |
|---|---|---|---|---|---|---|
| Model | 8.150 | 9 | 0.960 | 11.228 | 0.0004 | Significant |
| A-tryptone | 3.591 | 1 | 3.591 | 44.527 | <0.0001 | |
| B-lactose | 1.564 | 1 | 1.564 | 19.395 | 0.0013 | |
| C-arginine | 0.099 | 1 | 0.099 | 1.224 | 0.2945 | |
| AB | 0.777 | 1 | 0.777 | 9.633 | 0.0112 | |
| AC | 0.002 | 1 | 0.002 | 0.019 | 0.8928 | |
| BC | 0.012 | 1 | 0.012 | 0.148 | 0.7085 | |
| A∧2 | 0.134 | 1 | 0.134 | 1.664 | 0.2260 | |
| B∧2 | 0.970 | 1 | 0.970 | 12.034 | 0.0060 | |
| C∧2 | 1.308 | 1 | 1.308 | 16.241 | 0.0024 | |
| Residual | 0.806 | 10 | 0.081 | |||
| Lack of fit | 0.793 | 5 | 0.159 | 60.763 | <0.0002 | Significant |
| Pure error | 0.013 | 5 | 0.003 | |||
| Cor total | 8.956 | 9 |
Coefficient of determination (R 2) = 0.909.
Table 6.
Regression analysis (ANOVA) for ADI specific activity.
| Source | Sum of squares | Degree of freedom | Mean squares | F value | P value | Prob > F |
|---|---|---|---|---|---|---|
| Model | 32.586 | 9 | 3.621 | 7.749 | 0.0018 | Significant |
| A-tryptone | 6.692 | 1 | 6.692 | 14.321 | 0.0036 | |
| B-lactose | 1.163 | 1 | 1.163 | 2.489 | 0.1457 | |
| C-arginine | 4.043 | 1 | 4.043 | 8.653 | 0.0147 | |
| AB | 11.249 | 1 | 11.249 | 24.074 | 0.0006 | |
| AC | 0.545 | 1 | 0.545 | 1.166 | 0.3056 | |
| BC | 4.673 | 1 | 4.673 | 10.001 | 0.0101 | |
| A∧2 | 4.030 | 1 | 4.030 | 8.625 | 0.0149 | |
| B∧2 | 0.314 | 1 | 0.314 | 0.671 | 0.4317 | |
| C∧2 | 0.225 | 1 | 0.225 | 0.481 | 0.5038 | |
| Residual | 4.673 | 10 | 0.467 | |||
| Lack of fit | 4.626 | 5 | 0.925 | 99.432 | <0.0001 | Significant |
| Pure error | 0.047 | 5 | 0.009 | |||
| Cor total | 37.258 | 19 |
Coefficient of determination (R 2) = 0.874.
Quadratic model was found to be the “best fit model” for the specific enzyme activity also for growth with the highest F-value when compared to other models (Table 3). ANOVA for ADI specific activity (Y, IU/mG) indicated the “P-value” to be 0.0018, which implies the model to be significant. The “lack of fit F-value” of 99.43 with P-value <0.0001 implies that the lack of fit is significant. There is only a 0.01% chance that a “lack of fit F-value” this large could occur due to noise. ANOVA indicated the R 2 value of 0.8745 for response Y. This ensures a good correlation between observed and expected values of the quadratic model and indicates that this model could explain 87% response variability. The adequate precision which measures the signal-to-noise ratio of 9.227 indicates an adequate signal.
Table 3.
Model fit summary for the growth.
| Source | Sum of squares | Degree of freedom | Mean square | F value | P value | Prob > F |
|---|---|---|---|---|---|---|
| Mean versus total | 12.29 | 1 | 12.29 | |||
| Linear versus mean | 5.25 | 3 | 1.75 | 7.57 | 0.0023 | |
| 2FI versus linear | 0.79 | 3 | 0.26 | 1.18 | 0.3567 | |
| Quadratic versus 2FI | 2.11 | 3 | 0.70 | 8.70 | 0.0039 | Suggested |
| Cubic versus quadratic | 0.43 | 4 | 0.11 | 1.70 | 0.2674 | Aliased |
| Residual | 0.38 | 6 | 0.06 | |||
|
| ||||||
| Total | 21.24 | 20 | 1.06 | |||
Quadratic model is also found to be the “best fit model” for the growth at A 600 with the highest F-value when compared to other models (Table 4). ANOVA for ADI growth (G, A 600) indicated the “P-value” to be 0.0004, which implies the model to be significant. The “lack of fit P-value” of <0.0002 implies the lack of fit is significant. There is only a 0.02% chance that a “lack of fit F-value” this large could occur due to noise. A 91% response variability showed good correlation between observed and expected values of the quadratic model as ANOVA indicated the R 2 value of 0.9099 for response Y. The adequate precision which measures the signal-to-noise ratio of 9.58 indicates an adequate signal.
Table 4.
Model fit summary for ADI specific activity.
| Source | Sum of squares | Degree of freedom | Mean square | F value | P value | Prob > F |
|---|---|---|---|---|---|---|
| Mean versus total | 38.20 | 1 | 38.20 | |||
| Linear versus mean | 11.90 | 3 | 3.97 | 2.50 | 0.0963 | |
| 2FI versus linear | 16.47 | 3 | 5.49 | 8.02 | 0.0028 | Suggested |
| Quadratic versus 2FI | 4.22 | 3 | 1.41 | 3.01 | 0.0811 | Suggested |
| Cubic versus quadratic | 1.81 | 4 | 0.45 | 0.95 | 0.4966 | Aliased |
| Residual | 2.86 | 6 | 0.48 | |||
|
| ||||||
| Total | 75.46 | 20 | 3.77 | |||
E. faecium sp. GR7 shows very poor specific ADI activity (0.182 ± 0.001 IU/mG) in unoptimized TGYE broth, which was enhanced to 0.732 ± 0.006 IU/mG in new media and finally raised to 15 folds (4.27 IU/mG) in RSM optimized media (run 16) as shown in Table 2. The 2D contour plots based on the interactions between these variables show correlation between increase in specific ADI activity versus concentration of each variable that reaches the optimum level of enzyme activity and growth at concentration (g/L) lactose 10; tryptone 15; arginine 20 beyond which a decline was observed (Figures 13(d), 13(e), and 13(f)). 2D contour plots were obtained by plotting any two variables on x and y-axis while keeping the other third variable at their central value, that is, lactose 10 g/L, 15 g/L tryptone, and arginine 10 g/L. CCD employed has revealed that tryptone at concentration of 15 g/L was optimal for maximum enzyme activity. This nitrogen source plays important role in ADI specific activity and biomass production, as growth increases with the concomitant increase in tryptone concentration (Figures 13(a), 13(b), 13(d), and 13(e)). Results indicate a central value of lactose as 10 g/L for optimal enzyme production. In present study, similar effect was observed in case of lactose, as the concentration of lactose increases their is an increase in biomass production (Figures 13(a) and 13(c)). But it represses ADI enzyme activity as its concentration increases beyond 10 g/L (Figures 13(d) and 13(f)). Concentration of arginine in the culture medium also has profound effect on specific activity of arginine deiminase (Figures 13(e) to 13(f)), but it is not required for bacterial growth.
Figure 13.

2D contour plot showing effects and interaction of (a) lactose (g/L) and tryptone (g/L) (b) arginine (g/L) and tryptone (g/L) (c) arginine (g/L) and lactose (g/L) on growth at A 600 of E. faecium isolate GR7 and (d) lactose (g/L) and tryptone (g/L) (e) arginine (g/L) and tryptone (g/L) (f) arginine (g/L) and lactose (g/L) on specific ADI activity of E. faecium sp. GR7.
E. faecium sp. GR7 when grown in media containing different nutrients resulted in different growth profiles. The growth (A 600) was mostly influenced by an increase in the concentration of tryptone and lactose (Figure 13(a)). Presence of arginine in the culture medium has a least contribution towards growth of E. faecium sp. GR7 (Figures 13(b) and 13(c)), although it is important for inducing ADI activity (Figures 13(e) and 13(f)). Based on the results obtained, optimized medium designed with the components (g/L) tryptone 15; lactose 10; arginine 20; NaCl 1.0; K2HPO4 3.0; MnSO4 0.6 mM; Tween 80 1%; pH-6.0 at 30°C for 24 h under aerobic conditions. Figure 14 illustrates comparative growth profiles of the E. faecalis strain in basal (TGYE) and optimal media. Biomass concentration of the bacteria cultivated in optimal medium in batch culture conditions reached 0.751 at A 600 (12.1 mg/L) after 20 h of incubation with concomitant production of 4.27 IU mG−1 IU/mG specific ADI activity. This being higher in comparison with bacteria in TGYE medium with 0.32 at A 600 (5.17 mg/L) biomass after 20 h of incubation with specific ADI activity of 0.20 IU/mG. Though the biomass yield is lesser in optimized medium but higher specific ADI activity is having more significance from industrial perspective.
Figure 14.
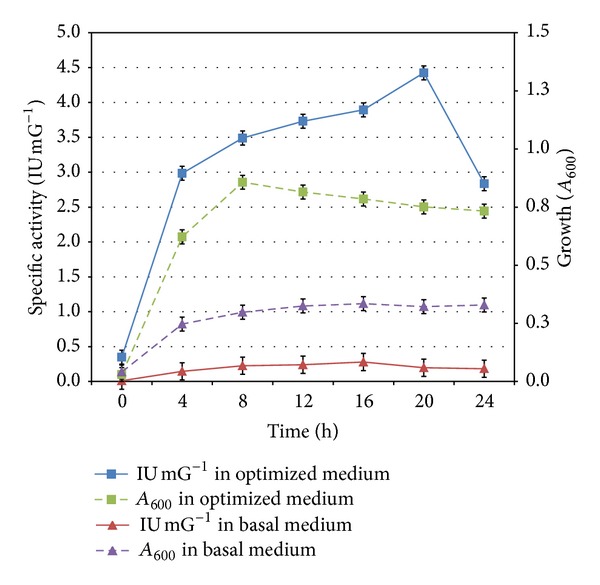
Time course of specific ADI activity and growth of E. faecium sp. GR7 in optimized and basal (TGYE) medium. Results are expressed as the mean ± S.D (n = 3), P-value <0.05.
4. Discussion
ADI pathway of bacteria provides number of functions such as sole energy provider (ATP) for the growth of a variety of microorganisms in various environmental conditions, especially arginine as main catabolite for nonfermenting bacteria, allowing anaerobic growth of strict aerobic bacteria, growth of fermentative bacteria when sugars are not available or at low sugar concentration, to supply carbamoyl phosphate for biosynthesis of citrulline or pyrimidines and to protect bacteria against acid or starvation environmental stress conditions [12, 30]. Therefore, expression of ADI pathway is widely reported among prokaryotic organisms including prominent bacterial species such as Clostridium [19], Enterococcus [20], Halobacterium [31], Lactobacillus [21], Lactococcus [6], Leuconostoc [7], Mycoplasma [22], Pseudomonas [25], Streptococcus [26], and Weissella [27]. Arginine catabolism by the ADI pathway has been explored in several industrial lactic acid bacterial species, mainly regarding their genetic and physiological aspect and enzymology of the ADI pathway. The increase in acid resistance of homofermentative and heterofermentative LAB may be due to the restoration of the optimum intercellular pH through arginine utilization and ammonia production [12]. Few reports emphasizing the role of the media constituents for enhancing ADI activity in bacterial species are available [23, 24, 27]. More knowledge about the influence of media components on ADI production, especially in GRAS LAB, is desired, which populate different food environments. In the present work, production of arginine deiminase in E. faecium sp. GR7 was enhanced to 4 folds in fermentation media (EAPM) using independent experiments which was further raised by 15 folds in RSM optimized media supplemented with 15 mM arginine in comparison to basal medium. Specific ADI activities reported in GRAS LAB range from 0.10 to 2.80 IU/mG (Table 7). Previous reports on Lactobacillus buchneri CUC-3 [32], Lactobacillus buchneri NCDO110 [29], Lactobacillus sanfranciscensis CB1 [12], Streptococcus lactis [9], Weissella confusa GR7 [27], Weissella koreensis MSI-3 [10], and Weissella koreensis MSI-14 [10] have suggested the role of arginine in enhancing ADI activity in various LAB strains. Although, arginine contributes little to the growth of E. faecium sp. GR7 but its involvement in induction of ADI activity is reported in the present study. The nature as well as concentration of the sugars was found to affect ADI production in case of lactose metabolizing E. faecium sp. GR7. Other sugars such as glucose, galactose, sucrose, maltose, and fructose did not suppress induction of ADI which was reported earlier in other LAB strains such as Lactobacillus buchneri NCDO110 (glucose) [29], Lactobacillus sake (above 0.6 mM glucose) [31], Lactobacillus sanfranciscensis CB1 (above 54 mM glucose) [12], and Streptococcus lactis (glucose, lactose) [9]. Fructose was known to suppress ADI activity in Leuconostoc oenos, Streptococcus mitis, and Weissella confusa GR7 [27, 33, 34]. Tryptone showed highest ADI production in E. faecium sp. GR7 at (10 g/L) which was approximately 11.57 and 8.05 times higher than yeast extract, and peptone respectively, as reported earlier in E. faecalis NJ402 [21]. ADI pathways also exhibit salt dependence as MnSO4, NaCl, and K2HPO4 are reported to magnify their activity [35].
Table 7.
Specific ADI activity in different microorganisms.
| Native microorganism | Specific ADI activity (IU/mG) | Reference |
|---|---|---|
| Clostridium sporogenes | 2.0 | [19] |
| Enterococcus faecalis NJ402 | 0.238 | [20] |
| Halobacterium salinarum | 0.33 nKat/mg | [31] |
| Lactobacillus sake | 1.5 U/mL | [21] |
| Lactobacillus buchneri CUC-3 | 1.01 | [7] |
| L. sanfranciscensis CB1 | 16.20 (from 10 times concentrated suspension) | [12] |
| Lactococcus lactis ssp. lactis ATCC 7962 | 2.16 | [6] |
| Leuconostoc oenos OENO | 0.10 | [7] |
| Mycoplasma arginini ATCC 23243 | 1.91 | [22] |
| Mycoplasma arginini G-230 | 1.37 | |
| Mycoplasma arginini strain leonis | 0.78 | |
| Mycoplasma arthritidis | 1.2 | |
| Mycoplasma fermentans | 0.28 | |
| Mycoplasma gallinarum | 1.3 | |
| Mycoplasma hominis ATCC 14027 | 2.0 | |
| Mycoplasma hominis | 2.9 | |
| Pseudomonas plecoglossicida CGMCC2039 | ||
| Wild type strain | ||
| Before media optimization | 0.96 U/mL | [23] |
| After media optimization | 1.6 U/mL | |
| Mutant strain | ||
| At pH 6.0 | 16.7 | [24] |
| At pH 6.5 | 21.7 | |
| Pseudomonas putida | 1.52 | [25] |
| Streptococcus faecalis 13398 | 1.60 | [26] |
| Streptococcus faecium A-2 | 0.11 | [26] |
| Streptococcus lactis ML3 | 0.28 | [9] |
| Weissella confusa GR7 | [27] | |
| Before media optimization | 0.27 | |
| After media optimization | 2.808 | |
| Enterococcus faecium GR7 | Present research work | |
| Before media optimization | 0.182 | |
| After media optimization | 4.27 |
Conventional processes of optimization are usually time consuming and expensive. The single factor optimization cannot explain the actual interactions of the parameters of the experimental data because the interaction between different factors is overlooked, leading to a misinterpretation of the results. In this study, optimization of multiple factors yielded more accurate results from which one could choose the correct value of each response factor individually with a high certainty. Fermentation media (EAPM) optimized using single factor based independent experiments resulted in 4-fold increase in ADI specific activity; however, a 15-fold increase was observed in RSM optimized medium when compared with basal medium. The optimized media components could be selected as the best condition for further studies on the development of a cost effective and viable industrial fermentation process. Thus, this work demonstrated the advantage of statistical media optimization methods for enzyme production with a minimum number of experimental trials, simultaneously with a reduction in laborious and time-consuming media composition analysis strategies.
5. Conclusion
A new strain of an Enterococcus was found to be a potential producer of ADI enzyme. In this study, result of bioprocess was optimized for future scaleup of ADI production process in E. faecium sp. GR7. A statistical strategy of CCD was used successfully to find out optimum values of significant response factors, which resulted in 15-fold increase in ADI production in RSM optimized media over basal media in E. faecium sp. GR7. It is interesting to report a novel lactic acid bacterial strain; that is, E. faecium having arginine metabolizing capacity can be ideally explored for production as a class of therapeutic enzyme against arginine auxotrophic cancers at low cost where the industrial needs are satisfied. The progress in the ADI research will undoubtedly facilitate the use of amino acid depriving enzymes in an innovative strategy in therapy of specific auxotrophic tumors and have profound influence on human health.
Conflict of Interests
The authors declare no conflict of interests.
Acknowledgments
Authors acknowledge UGC, New Delhi and Government of India for funding and Maulana Azad National Fellowship for Minority Students no. F.40-116(M/S)/2009(SA-III/MANF).
References
- 1.Ikeda M, Mitsuhashi S, Tanaka K, Hayashi M. Reengineering of a corynebacterium glutamicum L-arginine and L-citrulline producer. Applied and Environmental Microbiology. 2009;75(6):1635–1641. doi: 10.1128/AEM.02027-08. [DOI] [PMC free article] [PubMed] [Google Scholar]
- 2.Utagawa T. Production of arginine by fermentation. Journal of Nutrition. 2004;134(10):28545–28575. doi: 10.1093/jn/134.10.2854S. [DOI] [PubMed] [Google Scholar]
- 3.Zúñiga M, Miralles MMC, Pérez-Martínez G. The product of arcR, the sixth gene of the arc operon of Lactobacillus sakei, is essential for expression of the arginine deiminase pathway. Applied and Environmental Microbiology. 2002;68(12):6051–6058. doi: 10.1128/AEM.68.12.6051-6058.2002. [DOI] [PMC free article] [PubMed] [Google Scholar]
- 4.Galkin A, Kulakova L, Sarikaya E, Lim K, Howard A, Herzberg O. Structural insight into arginine degradation by arginine deiminase, an antibacterial and parasite drug target. The Journal of Biological Chemistry. 2004;279(14):14001–14008. doi: 10.1074/jbc.M313410200. [DOI] [PubMed] [Google Scholar]
- 5.Barcelona-Andrés B, Marina A, Rubio V. Gene structure, organization, expression, and potential regulatory mechanisms of arginine catabolism in Enterococcus faecalis . Journal of Bacteriology. 2002;184(22):6289–6300. doi: 10.1128/JB.184.22.6289-6300.2002. [DOI] [PMC free article] [PubMed] [Google Scholar]
- 6.Kim JE, Jeong DW, Lee HJ. Expression, purification, and characterization of arginine deiminase from Lactococcus lactis ATCC 7962 in Escherichia coli BL21. Protein Expression and Purification. 2007;53(1):9–15. doi: 10.1016/j.pep.2006.12.002. [DOI] [PubMed] [Google Scholar]
- 7.Liu SQ, Pritchard GG, Hardman MJ, Pilone GJ. Arginine catabolism in wine lactic acid bacteria: is it via the arginine deiminase pathway or the arginase-urease pathway? Journal of Applied Bacteriology. 1996;81(5):486–492. [Google Scholar]
- 8.de Orduna RM, Patchett ML, Liu SQ, Pilone GJ. Growth and arginine metabolism of the wine lactic acid bacteria Lactobacillus buchneri and Oenococcus oeni at different pH values and arginine concentrations. Applied and Environmental Microbiology. 2001;67(4):1657–1662. doi: 10.1128/AEM.67.4.1657-1662.2001. [DOI] [PMC free article] [PubMed] [Google Scholar]
- 9.Crow VL, Thomas TD. Arginine metabolism in lactic Streptococci . Journal of Bacteriology. 1982;150(3):1024–1032. doi: 10.1128/jb.150.3.1024-1032.1982. [DOI] [PMC free article] [PubMed] [Google Scholar]
- 10.Yu JJ, Oh SH. Isolation and characterization of lactic acid bacteria strains with ornithine producing capacity from natural sea salt. Journal of Microbiology. 2010;48(4):467–472. doi: 10.1007/s12275-010-0204-9. [DOI] [PubMed] [Google Scholar]
- 11.Kennedy M, Krouse D. Strategies for improving fermentation medium performance: a review. Journal of Industrial Microbiology and Biotechnology. 1999;23(6):456–475. [Google Scholar]
- 12.de Angelis M, Mariotti L, Rossi J, et al. Arginine catabolism by sourdough lactic acid bacteria: purification and characterization of the arginine deiminase pathway enzymes from Lactobacillus sanfranciscensis CB1. Applied and Environmental Microbiology. 2002;68(12):6193–6201. doi: 10.1128/AEM.68.12.6193-6201.2002. [DOI] [PMC free article] [PubMed] [Google Scholar]
- 13.Archibald RM. Determination of citrulline and allantoin and demonstration of citrulline in blood plasma. The Journal of Biological Chemistry. 1944;156:121–142. [Google Scholar]
- 14.de Man JC, Rogosa M, Sharpe ME. A medium for the cultivation of lactobacilli. Journal of Applied Bacteriology. 1960;23:130–135. [Google Scholar]
- 15.Shekh RM, Roy U. Biochemical characterization of an anti-Candida factor produced by Enterococcus faecalis . BMC Microbiology. 2012;12:132–147. doi: 10.1186/1471-2180-12-132. [DOI] [PMC free article] [PubMed] [Google Scholar]
- 16.Edwards MS, Baker CJ. Principles and Practice of Infectious Diseases. 3rd edition. New York, NY, USA: Churchill Livingstone; 1990. [Google Scholar]
- 17.Davis LG, Dibner MD, Battey JF. Basic Methods in Molecular Biology. New York, NY, USA: Elsevier; 1986. [Google Scholar]
- 18.Dandavate V, Jinjala J, Keharia H, Madamwar D. Production, partial purification and characterization of organic solvent tolerant lipase from Burkholderia multivorans V2 and its application for ester synthesis. Bioresource Technology. 2009;100(13):3374–3381. doi: 10.1016/j.biortech.2009.02.011. [DOI] [PubMed] [Google Scholar]
- 19.Venugopal V, Nadkarni GB. Regulation of the arginine dihydrolase pathway in Clostridium sporogenes . Journal of Bacteriology. 1977;131(2):693–695. doi: 10.1128/jb.131.2.693-695.1977. [DOI] [PMC free article] [PubMed] [Google Scholar]
- 20.Li J, Cao Y, Qian S, Liu Y, Qian L, Jiao Q. Study on fermentation process of arginine deiminase producing strain. Chinese Journal of Chemical Engineering. 22(1):43–47. [Google Scholar]
- 21.Montel MC, Champomier MC. Arginine catabolism in Lactobacillus sake isolated from meat. Applied and Environmental Microbiology. 1987;53(11):2683–2685. doi: 10.1128/aem.53.11.2683-2685.1987. [DOI] [PMC free article] [PubMed] [Google Scholar]
- 22.Fenske JD, Kenny GE. Role of arginine deiminase in growth of Mycoplasma hominis . Journal of Bacteriology. 1976;126(1):501–510. doi: 10.1128/jb.126.1.501-510.1976. [DOI] [PMC free article] [PubMed] [Google Scholar]
- 23.Liu YM, Sun ZH, Ni Y, Zheng P, Liu YP, Meng FJ. Isolation and identification of an arginine deiminase producing strain Pseudomonas plecoglossicida CGMCC2039. World Journal of Microbiology and Biotechnology. 2008;24(10):2213–2219. [Google Scholar]
- 24.Ni Y, Liu Y, Schwaneberg U, et al. Rapid evolution of arginine deiminase for improved anti-tumor activity. Applied Microbiology and Biotechnology. 2011;90(1):193–201. doi: 10.1007/s00253-010-3051-z. [DOI] [PubMed] [Google Scholar]
- 25.Shibatani T, Kakimoto T, Chibata I. Crystallization and properties of L-arginine deiminase of Pseudomonas putida . The Journal of Biological Chemistry. 1975;250(12):4580–4583. [PubMed] [Google Scholar]
- 26.Mackey JK, Jr., Beck RW. Activities of arginine dihydrolase and phosphatase in Streptococcus faecalis and Streptococcus faecium . Applied Microbiology. 1968;16(10):1543–1547. doi: 10.1128/am.16.10.1543-1547.1968. [DOI] [PMC free article] [PubMed] [Google Scholar]
- 27.Kaur B, Kaur R. Statistical screening of media components for the production of arginine deiminase by Weissella confusa GR7. International Journal Food Fermentation Technology. 2012;2(3):81–89. [Google Scholar]
- 28.Rimaux T, Rivière A, Illeghems K, Weckx S, de Vuyst L, Leroy F. Expression of the arginine deiminase pathway genes in Lactobacillus sakei is strain dependent and is affected by the environmental pH. Applied Environmental Microbiology. 2012;78(14):4874–4883. doi: 10.1128/AEM.07724-11. [DOI] [PMC free article] [PubMed] [Google Scholar]
- 29.de Nadra MCM, de Ruiz Holgado AAP, Oliver G. Arginine dihydrolase pathway on Lactobacillus buchneri: a review. Biochimie. 1988;70(3):367–374. doi: 10.1016/0300-9084(88)90209-x. [DOI] [PubMed] [Google Scholar]
- 30.Casiano-Colon A, Marquis RE. Role of the arginine deiminase system in protecting oral bacteria and an enzymatic basis for acid tolerance. Applied and Environmental Microbiology. 1988;54(6):1318–1324. doi: 10.1128/aem.54.6.1318-1324.1988. [DOI] [PMC free article] [PubMed] [Google Scholar]
- 31.Monstadt GM, Holldorf AW. Arginine deiminase from Halobacterium salinarium. Purification and properties. Biochemical Journal. 1991;273(3):739–745. doi: 10.1042/bj2730739. [DOI] [PMC free article] [PubMed] [Google Scholar]
- 32.de Orduña RM, Liu SQ, Patchett ML, Pilone GJ. Ethyl carbamate precursor citrulline formation from arginine degradation by malolactic wine lactic acid bacteria. FEMS Microbiology Letters. 2000;183(1):31–35. doi: 10.1111/j.1574-6968.2000.tb08929.x. [DOI] [PubMed] [Google Scholar]
- 33.Liu SQ, Pritchard GG, Hardman MJ, Pilone GJ. Occurrence of arginine deiminase pathway enzymes in arginine catabolism by wine lactic acid bacteria. Applied and Environmental Microbiology. 1995;61(1):310–316. doi: 10.1128/aem.61.1.310-316.1995. [DOI] [PMC free article] [PubMed] [Google Scholar]
- 34.Hiraoka BY, Mogi M, Fukasawa K, Harada M. Coordinate repression of arginine aminopeptidase and three enzymes of the arginine deiminase pathway in Streptococcus mitis . Biochemistry International. 1986;12(6):881–887. [PubMed] [Google Scholar]
- 35.Li J, Cao Y, Liu Y, Qian S, Jiao Q. Activity and stability of arginine deiminase for producing L-citrulline. Chinese Journal of Chemical Engineering. 2005;13(6):841–844. [Google Scholar]


