

Abstract
The patterns of polymorphisms in genomes are imprints of the evolutionary forces at play in nature. In particular, polymorphisms have been extensively used to infer the fitness effects of mutations and their dynamics of fixation. However, the role and contribution of molecular biophysics to these observations remain unclear. Here, we couple robust findings from protein biophysics, enzymatic flux theory, the selection against the cytotoxic effects of protein misfolding, and explicit population dynamics simulations in the polyclonal regime. First, we recapitulate results on the dynamics of clonal interference and on the shape of the DFE, thus providing them with a molecular and mechanistic foundation. Second, we predict that if evolution is indeed under the dynamic equilibrium of mutation–selection balance, the fraction of stabilizing and destabilizing mutations is almost equal among single-nucleotide polymorphisms segregating at high allele frequencies. This prediction is proven true for polymorphisms in the human coding region. Overall, our results show how selection for protein folding stability predominantly shapes the patterns of polymorphisms in coding regions.
Keywords: SNPs, polymorphism, protein folding stability, DFE, clonal interference
Introduction
How and why the observed patterns of DNA polymorphisms arise in the genome, and what are their molecular and phenotypic effects, is central to our understanding of the evolutionary forces at play in nature. In public health and medicine, polymorphisms are crucial in inferring the origin of diseases and genetic traits (McCarthy et al. 2008) and in understanding the spread of pathogens such as viruses (Vignuzzi et al. 2006).
A major utility of polymorphisms is in estimating the distribution of fitness effects (DFE) of mutations. Although the DFE has been measured for viruses (Sanjuan et al. 2004), its measurement in living organisms is difficult and resolution-limited (Eyre-Walker and Keightley 2007). Thus, studies on the DFE have largely relied on Bayesian maximum-likelihood approaches to fit population dynamic and demographic models to patterns of polymorphisms and amino acid differences between species (Bustamante et al. 2005; Eyre-Walker et al. 2006; Sawyer et al. 2007; Kryukov et al. 2009). A consensus result is that the DFE is characteristically skewed and can be described by a gamma distribution (Bustamante et al. 2005; Eyre-Walker et al. 2006; Kryukov et al. 2009). There is, however, a debate on the magnitude and relative balance between the types of substitutions that fix in the population—some consider them to be neutral or near neutral (Ohta 1973; Nei et al. 2010), whereas others consider them to be predominantly adaptive and beneficial (Smith and Eyre-Walker 2002; Eyre-Walker and Keightley 2007). Indeed, there is a longstanding debate (with patterns of polymorphisms used as empirical support by all sides) on whether evolution is primarily neutral (Kimura 1968; Ohta 1973; Nei et al. 2010), adaptive (McDonald and Kreitman 1991; Smith and Eyre-Walker 2002), or driven by drift (Lynch and Conery 2003). Distinguishing adaptive, neutral, and nearly neutral modes of molecular evolution remains challenging (Akashi et al. 2012) because the predictions are overlapping.
The patterns of polymorphisms can also be used to gain insight into the dynamics of allele segregation and in determining which mutations are eventually fixed or lost in evolution (for a practical example, see Strelkowa and Lassig 2012). In general, the dynamics is expectedly complicated because of the intrinsic stochasticity of drift and mutation, compounded by history and demography of the evolving population. The trajectories of mutations in polyclonal populations are dynamically rich because of potential clonal interference, hitchhiking, and/or background selection. Major advances have been described in recent years to infer the dynamics (Gerrish and Lenski 1998; Wilke 2004; Desai and Fisher 2007), but their connection to molecular biophysics is still unclear.
Most of the approaches in the studies above assume the DFE and then infer the possible dynamics (Gerrish and Lenski 1998; Desai and Fisher 2007) or assume the possible dynamics and then infer the DFE (McDonald and Kreitman 1991; Bustamante et al. 2002; Smith and Eyre-Walker 2002). This poses a potential limitation because demography and the DFE are intrinsically coupled (Silander et al. 2007). More importantly, these approaches lack explicit connection to the molecular properties of segregating polymorphisms, such as folding stability, or to the widely accepted selective constraints on protein evolution, such as avoidance of protein misfolding and misinteraction (Pal et al. 2006; Drummond and Wilke 2008; Zhang et al. 2008; Koonin and Wolf 2010).
An alternative and complementary approach is to develop an evolutionary framework based on a realistic genotype–phenotype relationship and allow the patterns of polymorphisms, mutational dynamics, and the DFE to be consequences of the model. Knowledge of the genotype–phenotype relationship entails systematic accounting of the molecular properties encoded by the genome and the extensive mapping of their interactions whether physical, biochemical, or genetic. Although these relationships are overall complex, at least for coding regions, there is a general consensus that the fitness of the organism is a function of the metabolic output (Edwards et al. 2001; Duarte et al. 2007), itself also a function of the biophysical properties of proteins (Bar-Even et al. 2010). Another emerging constraint on protein evolution is the global selection against the cytotoxic effect of aggregated, presumably misfolded proteins (Bucciantini et al. 2002). The universality of such a constraint is manifested in the consistent correlation between the rate of protein evolution and cellular abundance (Drummond and Wilke 2008; Yang et al. 2010; Serohijos et al. 2012).
To arrive at a more mechanistic origin of the patterns of polymorphisms that explicitly account for their biophysical effects, we coupled molecular biophysics, the emerging knowledge of the genotype–phenotype relationship, and explicit population dynamics simulations. First, we show that the DFE is not constant but a dynamic consequence of the evolutionary process. Specifically, under the equilibrium of mutation–selection balance and because of the epistatic interactions between mutational effects on protein folding stability, the DFE evolves to be concentrated around effective near neutrality with the characteristic gamma distribution (Kryukov et al. 2009). Second, even under equilibrium, we observe pervasive background selection and hitchhiking that expand the regime of effective near neutrality, consistent with prior studies (e.g., McVean and Charlesworth 2000; Neher and Shraiman 2011). Because we base our premise on molecular biophysics and emerging genotype–phenotype relationships, our approach could provide a molecular foundation to these observations. More importantly, we could also relate these findings in evolutionary biology to predictions of their molecular consequences. In particular, we predict that if evolution is indeed under equilibrium, the fraction of stabilizing and destabilizing mutations are almost equal among single-nucleotide polymorphisms (SNPs) segregating at high allele frequencies. Despite some simplifying assumptions, this prediction is proven true for polymorphisms in the human coding region.
Results
Coupling Biophysics and Population Dynamics in the Polyclonal Regime
To couple population dynamics and molecular biophysics, we model an evolving population of Ne = 103 organisms with explicit genomic sequences consisting of ten open reading frames that code enzymes from the folate biosynthetic pathway (fig. 1A and supplementary table S1, Supplementary Material online), an essential biochemical pathway for amino acid synthesis. These model genes have corresponding 3D structures from the protein databank that can be used in estimating the biophysical effects of mutations (see Materials and Methods). We assume that the fitness f of the organism or its probability of replication is a function of both the total metabolic output (Dykhuizen et al. 1987) and the total number of misfolded proteins in the cell; the latter accounts for the cytotoxicity of misfolded proteins (Drummond and Wilke 2008). Thus, the total fitness is
| (1) |
Fig. 1.

Model of protein evolution that couples biophysics and population dynamics in the polyclonal regime. (A) A model of organism composed of ten genes from the folate biosynthetic pathway (supplementary table S1, Supplementary Material online). Cellular fitness f is proportional to the effective metabolic output of this pathway and the total number misfolded proteins (eqs. 1–3). The population is subject to mutation, drift, and purifying selection. Mutations can change the folding stability ΔG of a gene and hence the fitness of the cell (see Materials and Methods). Effective population size is Ne = 103. (B) Fitness under mutation–selection balance. (C) Detailed trajectory of the folding stability of each gene in individuals in the population. Individual cells are indexed along the y axis, where spatial proximity is proportional to kinship.
From linear pathway theory, the flux term may be expressed as (see Materials and Methods)
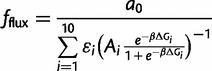 |
(2) |
where εi is the enzyme efficiency, Ai is the cellular abundance, and ΔGi is the folding free energy. The index i is for each gene in the model. We make the simplifying assumption that all enzymes have the same efficiency εi = 1. The factor β = 1/kBT (kBT = 0.593 kcal/mol) and a0 is a normalizing constant (see Materials and Methods). The contribution to fitness of the misfolding toxicity may be expressed as (Serohijos et al. 2012)
 |
(3) |
where c = 10−4 is the fitness cost per misfolded protein (Drummond and Wilke 2008). In this formulation, the optimal fitness is 1 and occurs in the regime where proteins are very stable (supplementary fig. S1, Supplementary Material online). Equations (1)–(3) constitute an explicit biophysics-based genotype–phenotype relationship. The model also features epistasis between genes because they are all coupled in the fitness function (eqs. 1–3).
We coupled the genotype–phenotype relationship to an evolutionary dynamics model that includes mutation, selection, and drift (see Materials and Methods and supplementary fig. S2, Supplementary Material online). Specifically, at each replication event, a cell divides into two daughter cells, each can potentially mutate at the rate of µ = 0.01/genome/replication (1.5 × 10⁻⁶/base pair/replication). If the mutation is nonsynonymous, we estimate the change in folding stability (ΔΔG = ΔGmutant − ΔGwildtype) using a physical force field (Yin et al. 2007) and then update the fitness of the organism (see Materials and Methods). We ran our simulation until it achieved mutation–selection balance (fig. 1B). Throughout the simulation run, we saved the full history of all arising mutations and the genomes of all surviving individuals (see Materials and Methods). Analysis was performed only in the regime of mutation–selection balance.
Mutation–Selection Balance Under Pervasive Clonal Interference
We then analyzed the various types of mutations and the dynamics of their segregation in the population. Because the simulations are performed at high mutation rate, there is pervasive clonal interference (fig. 1C). We classified all arising mutations according to their fitness effect, quantified by the selection coefficient s = (fmutant − fwildtype)/fwildtype. Because the fitness function is protein-centric, mutations that increase folding stability (ΔΔG < 0) are beneficial, whereas those that decrease stability (ΔΔG > 0) are deleterious. Synonymous substitutions are considered neutral. In figure 2A, we show typical trajectories of mutations that eventually fixed in the population (see also supplementary fig. S3, Supplementary Material online). In the regime of high mutation rate, several mutations arise over the lifetime of a segregating allele (fig. 1C and 2A). The distribution of minor allele frequencies for the SNPs in simulation and the human coding region are shown in supplementary figure S4, Supplementary Material online.
Fig. 2.

Mutation–selection balance under pervasive clonal interference. (A) Sample history of mutations that reached fixation. Time interval corresponds to figure 1C. Arrows indicate the correlated fixation of mutations. (Only three genes are shown; see supplementary fig. S3, Supplementary Material online, for the complete trajectory.) (B) Selection coefficients of mutations that successfully fixed. (C) Extent of polymorphism in the evolving population. Drop in diversity accompany clonal sweeps. (D) Distribution of SNPs in the simulation. All SNPs (blue); SNPs with allele frequencies ≥1% (black).
Our simulations exhibit clonal sweeps, characterized by the correlated fixation of mutations, usually driven by a beneficial mutation (fig. 2B). Such clonal sweeps are typically characterized by a slow rise followed by a rapid drop in polymorphisms (fig. 2C). The anatomy of such sweeps entails deleterious mutations hitchhiking on the beneficial mutations; consequently, these deleterious mutations now have a significant probability of fixation compared with the monoclonal regime (fig. 3). Beneficial mutations, however, do not fix as likely as in the monoclonal regime because they now arise in the context of many deleterious mutations (fig. 4A, C, and E; supplementary fig. S3, Supplementary Material online). The deleterious hitchhikers effectively dampen a beneficial mutation’s overall fitness effect, thus lowering its probability of fixation (fig. 3). The extent of hitchhiking by destabilizing mutations on stabilizing ones can be estimated from the distribution of ΔΔG for all possible arising nonsynonymous mutations available to a wildtype sequence. This distribution appears to be universal across types of protein folds (Tokuriki et al. 2007). Approximately 20% of nonsynonymous mutations are stabilizing (ΔΔG < 0), whereas the rest are destabilizing (Tokuriki et al. 2007; Zeldovich et al. 2007); see also the blue curve in (fig. 6B). The extent of hitchhiking and background selection is generally a function of mutation rate and population size; nonetheless, from purely biophysical considerations, there are potentially four destabilizing mutations that could hitchhike for every stabilizing mutation.
Fig. 3.

Probability of an arising mutation to reach an allele frequency λ. λ = 1 corresponds to fixation. Red line is the probability of fixation in the monoclonal regime. Fixation probability of a neutral mutation in the monoclonal regime (1/2Ne) is indicated. Interference among clones takes two specific forms: background selection and hitchhiking.
Fig. 4.

Influence of epistasis in the mapping between the molecular effect of a mutation ΔΔG to its phenotypic effect s. X axis is the premutation ΔG. Mutations are colored according to the magnitude of the ΔΔG (see leftmost panel for color assignment). (A) Arising random beneficial (stabilizing) mutations. (B) Fixed beneficial mutations. (C) Arising random deleterious (destabilizing) mutations. (D) Fixed deleterious mutations. In panels (A)–(D), premutation ΔG modulates the magnitude of s for a given ΔΔG such that mutations are more neutral when it occurs in more stable proteins. (E) Solid line is the distribution of arising beneficial mutations (panel A) while dashed line is the distribution of arising deleterious mutations (panel C). Each histogram is normalized to the total number of mutations. (F) Similar to panel E but for fixed mutations. In the stable regime, drift dominates, whereas in the unstable regime, selection dominates. For the sake of clarity, we plot only 1/102 or 1/(10Ne) of the total number of arising mutations sampled randomly.
Fig. 6.

Stability effects of nonsynonymous SNPs segregating at various allelic frequencies. (A) λ is the maximum frequency that a segregating SNP attains over its lifetime. Selection shifts the distribution of higher frequency alleles toward more stabilizing SNPs. (B) ΔΔG of SNPs in the coding region of the human genome estimated using FoldX (Schymkowitz et al. 2005) and compiled by the database SNPeffect (De Baets et al. 2012) (see Materials and Methods). Allele frequency is taken from dBSNP. For arising ΔΔG, we use the empirically measured ΔΔG from a diverse set of proteins in the ProTherm database (Kumar et al. 2006; Tokuriki et al. 2007). Enclosed in parentheses are the number of SNPs for the indicated frequency cutoff.
We also show the probability that a mutation reaches an allele frequency λ (fig. 3). Interestingly, alleles segregating at ∼50% are almost determined to fix (fig. 3). We note that the pervasive clonal interference in our simulation occurs under mutation–selection balance and is distinct from the more common treatment of clonal interference in literature, which is only among beneficial mutations and specifically in the context of adaptation (Gerrish and Lenski 1998; Fogle et al. 2008).
Fitness and Molecular Effects of Mutations Under Mutation–Selection Balance
As noted earlier, one of the primary utilities of the patterns of polymorphism in genomes is quantitatively estimating the DFE. Thus, we next explore the resulting DFE from our simulation and compare the distribution with estimates from Bayesian approaches.
In the genotype–phenotype relationship defined by equations (1)–(3), epistatic interactions on folding stability play a crucial role in determining the fitness effects of mutations (fig. 4). Specifically, in our model, the fitness effect of a mutation with a molecular effect ΔΔG depends on the folding stability of the current wildtype or ΔGpremutation (fig. 4). The same ΔΔG can have very near neutral effect if it occurs in proteins that are stable but can have sizable effects if it occurs in proteins that are unstable. For example, a destabilizing mutation of ΔΔG = 1 kcal/mol occurring in genes with ΔGpremutation = −8 kcal/mol has a fitness effect of  ; however, the same mutation occurring in genes with ΔGpremutation = −0.5 is lethal. A stabilizing mutation of ΔΔG = −1 kcal/mol occurring in genes with ΔGpremutation = −8 kcal/mol has a fitness effect of
  ; however, if it occurs in genes with ΔGpremutation = −0.5 kcal/mol, the mutation is extremely beneficial
  . Thus, in the regime where proteins are stable, both destabilizing and stabilizing mutations have
  ; however, because of the larger supply of destabilizing than stabilizing mutations, most mutations that fix are destabilizing. This imbalance gives rise to a mutational drift of ΔG toward less stable proteins and away from the flatter part of the fitness landscape (fig. 4f and supplementary fig. S2, Supplementary Material online). In the regime where proteins are less stable, selection for stabilizing and selection against destabilizing mutations lead to fixation of a larger fraction of stabilizing mutations (fig. 4f and supplementary fig. S2, Supplementary Material online). This dominance of selection drives ΔG toward more stable proteins and away from the less fit part of the fitness landscape (supplementary fig. S2, Supplementary Material online). The balance between selection and drift occurs at some intermediate folding stability (fig. 4f, ∼4 kcal/mol), where stabilizing and destabilizing mutations have equal likelihood of being fixed.
Because mutation–selection balance is a dynamic equilibrium, the protein finds itself on the left or right hand side of ∼4 kcal/mol, but on average, it resides in this neighborhood, giving rise to the observation that proteins are “marginally stable” (Taverna and Goldstein 2002; Bloom et al. 2007; Zeldovich et al. 2007). The balance between drift and selection defines the mode of the equilibrium distribution of folding stabilities (fig. 4E). This equilibrium distribution is in agreement with the empirically measured ΔG distribution in ProTherm (Kumar et al. 2006), as pointed out in earlier works (Zeldovich et al. 2007; Wylie and Shakhnovich 2011). Additionally, for protein coding regions, the strictly neutral regime (s = 0) is not a stable attractor in protein evolution because mutational drift due to nonsynonymous substitutions always drives proteins toward marginal stability (figs. 4F and 5) (Taverna and Goldstein 2002).
Fig. 5.

Fitness and molecular effects of mutations under mutation–selection balance. (A) Mapping of ΔΔG to the selection coefficient among fixed mutations. Dots are colored similar to figure 4. (B) Arising random mutations are predominantly deleterious (fig. 4A, C). The deleterious and beneficial DFE are both characteristically leptokurtic and fits a gamma distribution. Stricly lethal mutations (Ns = −103) are excluded in the fit to a gamma distribution. (C) The consequence of mutation–selection balance is a bimodal distribution of s and, in particular, equal number of fixed beneficial and deleterious mutations. Strict neutrality (s = 0) is not a stable fix point because mutational drift drives proteins to destabilization (fig. 4F). (D) Bimodal and equal fraction of fixed beneficial and deleterious s (panel C) maps into a symmetric distribution ΔΔG.
Because the folding stability ΔG evolves as consequence of mutation–selection balance, so should the fitness effect s, which itself is a function of folding stability. Thus, the DFE is expectedly a dynamic consequence of the resulting population dynamics. Shown in figure 5B and C are the resulting DFE of arising random mutations and fixed nonsynonymous substitutions. The DFE of fixed deleterious mutations is bounded on one side by drift away from the neutral regime (i.e., drift from stable ΔG) and on another side by selection (fig. 4C). The DFE of fixed beneficial mutations is more nuanced. It is bounded on one side by drift and limited on the other side by the supply of stabilizing mutations. These stabilizing and beneficial mutations have only effectively near neutral effect in the background of the folding stability values under mutation–selection balance (fig. 4B). In short, the observation of marginal folding stabilities of proteins is coupled to the effective near neutrality of the fitness effects of fixed amino acid substitutions.
Additionally, under mutation–selection balance, the magnitude of the selection coefficient is of near neutral effect, whereas the magnitude of the folding stability changes is far from neutral (fig. 5A). The nonneutrality of the molecular effect (ΔΔG) and the near neutrality of fitness effect s are due to the background ΔG, which evolves to an equilibrium distribution that ensures the near neutrality of the fixed deleterious and beneficial mutations (fig. 5A). The effective near neutral theory, originally a postulate (Ohta 1973), finds a solid and mechanistic foundation in protein biophysics and the selection against protein misfolding and selection for function due to metabolic flux.
We note that the resulting DFE from simulations is skewed and can be fitted to a gamma distribution (fig. 5C and D), in agreement with studies that estimated the DFE using maximum likelihood methods on human and in flies (Bustamante et al. 2005; Eyre-Walker et al. 2006; Kryukov et al. 2009). Similar works have also shown that most mutations could be of near neutral effect (Bustamante et al. 2005; Eyre-Walker et al. 2006; Sawyer et al. 2007; Kryukov et al. 2009); however, the molecular basis was unclear. Our work provides a molecular and mechanistic origin of these observations based on the emerging genotype–phenotype relationships (eqns. 1–3).
Mutation–selection balance is a dynamic equilibrium; thus, there should be equal numbers of fixed beneficial and deleterious mutations, a result hypothesized as early as 1930 by Fisher (1930) and articulated recently in the monoclonal regime by some groups (Sella and Hirsh 2005; Mustonen and Lassig 2009). Our own simulations in the monoclonal regime with a biophysics-based genotype–phenotype relationship (Serohijos et al. 2012) also confirm this hypothesis (supplementary figs. S7 and S8, Supplementary Material online). We show that despite the more complicated dynamics in the polyclonal regime, this inference is robust as manifested by the bimodal distribution of the selection coefficients of fixed mutations (fig. 5C). In strictly monoclonal populations, the boundary of near neutrality is at N|s|∼ 1 (Sella and Hirsh 2005; Goldstein 2011; see also supplementary figs. S7 and S8, Supplementary Material online). However, in the polyclonal regime, because of extensive hitchhiking and background selection that effectively lead to a flatter probability of fixation (fig. 3), the bounds of effective near neutrality extend beyond N|s|∼ 1 (fig. 5A, C).
Stability Effects of Nonsynonymous SNPs Segregating at Various Allelic Frequencies
We have shown that the inferred DFE (Bustamante et al. 2005; Eyre-Walker et al. 2006; Kryukov et al. 2009) can be explained under mutation–selection balance. Because this result from simulations seem to contradict the large body of literature arguing for a predominantly adaptive (hence, out of equilibrium) tempo of protein evolution (McDonald and Kreitman 1991; Smith and Eyre-Walker 2002), we then sought to establish another empirical support for our analysis.
We know the full history of all mutations, thus we can relate the stability effects (ΔΔG) of SNPs to their allele frequencies (fig. 6A). Most arising mutations are destabilizing, and those SNPs segregating at low frequencies are still predominantly destabilizing (fig. 6A). This high fraction of destabilizing mutations among low-frequency SNPs is directly supported by explicit biophysical measurements of the stability effects of SNPs from a diverse set of 16 human enzymes (Allali-Hassani et al. 2009) and by bioinformatics analysis (Yue and Moult 2006). This result is also in agreement with the observation that disease-associated SNPs, because of their very deleterious effects, segregate at lower frequencies than regular polymorphisms (De Baets et al. 2012). On the other hand, among SNPs segregating at higher allele frequencies, the fraction of destabilizing SNPs decreases because of purifying selection. In particular, for SNPs segregating at 40% allele frequency, close to the probability of fixation (fig. 3), the fraction of stabilizing and destabilizing SNPs are almost equal (fig. 6A). The estimates of the folding stability effects of SNPs in the human coding region (fig. 6B) indeed show the increasing manifestation of purifying selection among SNPs of higher allele frequencies. Most importantly, arguing for mutation–selection balance (at least for protein evolution), SNPs that are close to fixation approach the limit of equal fraction of stabilizing and destabilizing ΔΔG (fig. 6B).
Discussion
By developing an evolutionary model based on molecular biophysics and on an intuitive genotype–phenotype relationship, we provide a more mechanistic and molecular understanding on how polymorphisms could arise and segregate in the coding region of genomes. Several works have tried to bridge molecular biophysics and population genetics both in coding (DePristo et al. 2005; Bloom et al. 2007; Drummond and Wilke 2008; Goldstein 2011; Serohijos et al. 2012) and noncoding (Mustonen et al. 2008) regions of genomes. However, these studies are in the monoclonal regime and do not explore the relevance of biophysics to polymorphisms as we do here.
The DFE is not a constant in evolution but an evolvable property and a consequence of the evolutionary dynamics. In this work, we showed how, in the context of coding region evolution, the protein folding stability evolves to ensure the near neutrality of the fitness effects of stabilizing mutations, reaching a dynamic steady state defined by the mutation–selection balance. Specifically, the DFE evolves to be centered around effective near neutrality with a characteristic skewed gamma distribution. The boundaries of effective near neutrality are strongly determined by the population dynamics; in this case, pervasive clonal interference leads to weakened selection that expands the regime of near neutrality. This effective weakening of selection due to hitchhiking has been described previously (e.g., McVean and Charlesworth 2000; Neher and Shraiman 2011). However, here, we provide a mechanistic and direct connection on how it can arise in the context of protein evolution. The extent of the weakening of selection is expectedly a function of population size and mutation rate (Neher and Shraiman 2011; Wylie and Shakhnovich 2011)—in this work, we chose the population size of 103 organisms, which we tried to be as close the human effective population size (104) (Lynch and Conery 2003) but still computationally tractable.
Under this dynamic equilibrium of mutation–selection balance, the near neutral theory (Ohta 1973) is not a postulate but a robust consequence of the interplay between biophysics and evolutionary dynamics. The standard molecular argument for the claimed neutrality of most mutations is that a significant fraction of residues in a protein (∼85%) do not participate in the active site thus unrelated to function. However, this is inconsistent with molecular biophysics where mutations are never neutral, as they always affect folding stability (Tokuriki et al. 2007; Zeldovich et al. 2007) and other molecular properties of proteins such as their interactions with other proteins in cytoplasm (Vavouri et al. 2009; Heo et al. 2011). Here, we have shown the despite the nonneutral effects of mutations at the level of macromolecules, the population evolve to ensure the near neutrality of their fitness effects (fig. 5).
We also note the major distinctions between our work and the theoretical models that advocate selection for mutational robustness (van Nimwegen et al. 1999; Wilke et al. 2001). First, these neutral network models assume that mutations are either neutral or lethal. The relative fraction of neutral to lethal neighbors defines the degree of mutational robustness. In our model, no a priori assumptions are made on the DFE. As argued above, the same ΔΔG mutations could have a fitness effect of be  or
or  depending on background ΔGpremutation.
Second, these theoretical and computational models also assume that there are multiple peaks in the fitness landscape—the flattest, most mutationally robust peak is distinct from the highest peak, which could be less robust. In our, genotype–phenotype model based on the thermodynamics of protein folding stability, the regime that is most robust is also the regime that is most fit (supplementary fig. S2, Supplementary Material online), and this is the regime of high folding stability. We note, however, that under our model of mutation–selection balance, proteins evolve toward marginal stability, hence organisms are not optimally fit (supplementary fig. S2, Supplementary Material online).
Third, in the models arguing for mutational robustness, under low mutation rate, the population evolves to higher peaks even if less robust. Under high mutation rate, the population evolves to the flatter peaks, because selection for mutational robustness outweighs selection for fitness, hence the “survival of the flattest.” In both cases of high and low mutation rates, evolution is always a process of optimization—high robustness at high mutation rate or high fitness under low mutation rate. In our model, however, the evolution is always toward mutation–selection balance, where proteins are marginally stable (fig. 4), the fitness effects are near neutral (fig. 5), and the organisms are not optimally fit (supplementary fig. S2, Supplementary Material online). This evolution toward marginal folding stability and suboptimal fitness holds under low mutation rate, where the bounds of near neutrality is N|s|∼ 1 (supplementary figs. S7 and S8), and under high mutation rate, where the bounds of near neutrality is greater than N|s|∼ 1 because of hitchhiking and background selection (fig. 5). Of course, when the mutation rate is very high or when the population size is too small, the condition for mutation–selection balance may not be satisfied leading to extinction (Zeldovich et al. 2007; Wylie and Shakhnovich 2011). In short, in our model, evolution is not necessarily a process of optimization.
Fourth, in the neutral network models of sequence evolution, the most neutral part of the landscape represents a stable attractor. In our model, however, the flattest part of the landscape is not an attractor because of mutational drift. Thus, evolution proceeds “toward near neutrality” is the correct description rather than simply “toward neutrality.”
Altogether, the terms neutral and near neutral is rather unfortunate, because they suggest that the latter is simply an update or a correction to the neutral theory. However, as noted above, there are fundamental mechanistic and conceptual differences between the two, and it is the near neutral theory that is most consistent with protein biophysics.
We have also shown that the patterns of polymorphisms, when framed in very direct observables such as changes in folding stability, in fact, support the argument for a predominantly nonadaptive tempo of evolution (Bustamante et al. 2005), contrary to prior claims resulting from the so-called tests of neutrality (McDonald and Kreitman 1991; Smith and Eyre-Walker 2002). In the future, to further reconcile the adaptive view of evolution and the effective near neutrality (as argued here), an extensive analysis of polymorphisms generated from our approach and the McDonald–Kreitman tests must follow. Additionally, biophysical analysis of SNPs in model organisms across all kingdoms of life will systematically test the universality of the results demonstrated in figure 6B.
We explicitly discussed the mechanism for how the DFE of coding region mutations becomes centered around effective near neutrality under mutation–selection balance. This result may be extended to the noncoding region because the emergent near neutrality under mutation–selection balance is robust to the details of the fitness function, as long as the genotype–phenotype relationship features a convex curved functional form reflecting the diminishing fitness improvement upon further optimization of molecular properties (Akashi et al. 2012). In the noncoding region, a “curved” genotype–phenotype relationship arises from the ability of replication-related proteins (such as polymerases, transcription factors) to bind to DNA or RNA (Mustonen and Lassig 2009). In this respect, the thermodynamics of protein–DNA interaction is analogous to the thermodynamics of protein folding.
The molecular view of mutation–selection balance described here also clarifies a meaningful distinction (previously pointed out in Mustonen and Lassig [2009]) between positive selection (existence of beneficial mutations that eventually outcompetes wildtype) and true adaptation (moving selection target). Indeed, here, there is an ample supply of beneficial mutations originating from constantly arising stabilizing mutations; however, these beneficial mutations are not truly adaptive but only maintain mutation–selection balance. That is, the observation among biophysicists that proteins are marginally stable (Privalov 1979; Taverna and Goldstein 2002; Kumar et al. 2006; Bloom et al. 2007; Zeldovich et al. 2007) and the observation in evolutionary biology that coding region evolution is predominantly nonadaptive (e.g., in human; Bustamante et al. 2005) are the molecular and phenotypic manifestation of the balance between drift and selection for folding stability.
The nature and shape of the DFE should depend on the mutation rate, population size, and number of genes in the organism. However, the natural expectation is that the higher population sizes and higher mutation rates increase the extent of clonal interference and thus could in principle further expand the bounds of near neutrality. The systematic effects of mutation rate, population, and the number of genes on polymorphisms in the context of this biophysics-based population dynamics model will be explored in future studies.
The approach we present here can only be improved as we become more quantitative and systematic in our understanding of the genotype–phenotype relationship and integrate it into a comprehensive cellular model (Karr et al. 2012). The explicit genotype–phenotype relationship could be the starting point for investigating the evolutionary consequences of the cellular quality control machinery (chaperones and proteases) that can modulate the fitness effects of mutations and hence the expected patterns of polymorphisms. Additionally, a realistic cellular model representing more complete proteomic and metabolic network information could explore the relationship between the DFE per gene and the DFE on the whole organism (Soskine and Tawfik 2010).
We note that this approach of coupling molecular biophysics and population genetics has already been crucial in explaining other emerging genomic patterns, such as why highly abundant proteins consistently evolve slowly (Pal et al. 2001; Drummond and Wilke 2008; Yang et al. 2010; Serohijos et al. 2012) or tend to be more stable (Drummond and Wilke 2008; Cherry 2010; Serohijos et al. 2012, 2013). Because the representation of the evolving population is explicit, our approach could also provide a framework to account for the role of changing environments. We also believe that this approach could provide an explicit, mechanistic null model for statistically inferring mutations that are truly functional and adaptive (Kumar et al. 2012).
Materials and Methods
Fitness Function
To begin with the most basic model of evolution that has some semblance of realism in accounting for the biophysical properties of proteins and the genotype–phenotype relationship, we choose to model an organism (supplementary table S1, Supplementary Material online) based on a core metabolic pathway and postulate that its fitness is proportional to the metabolic flux (Milo and Last 2012). Assuming that all the enzymes follow a linear metabolic pathway, the fitness due to flux 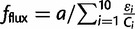 , where a is the number of input metabolites, εi is the enzymatic efficiency, and Ci is the number of functional copies. The functional copies correspond to number of enzymes in the folded (native) state Ci = AiPnat,i, where Pnat,i is the Boltzmann probability of the protein i to be in the native state and Ai is the total concentration of protein i in the cell. Assuming a two-state folding thermodynamics
 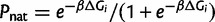 (Privalov 1979).
Another emerging constraint in protein evolution is the global selection against the cytotoxicity of protein misfolding (Drummond and Wilke 2008; Serohijos et al. 2013). Formally, the fitness due to toxicity is 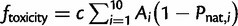 , where c = 10−4, the fitness cost per misfolded protein (Drummond and Wilke 2008; Geiler-Samerotte et al. 2011). Altogether, the total fitness is described by equation (1). Without loss of generality, we require that fitness is optimally 1 at very stable regimes,
  , leading to
  . When ftoxicity > fflux, the fitness is defined to be f = 0, hence
  . The resulting fitness defined by equations (1)–(3) is essentially parameter-free.
In our earlier work (Serohijos et al. 2012), the goal was to determine whether selection against the cytotoxity of protein misfolding is sufficient to explain the widely observed abundance–evolutionary rate correlation (Drummond and Wilke 2008). Thus, to make an explicit comparison and connection with earlier literature, we only focused on the selection against protein misfolding. In this study, we generalize the fitness function to include the notion of selection for more functional copies, motivated by numerous works that map metabolic output to fitness (Edwards et al. 2001; Duarte et al. 2007), which depends on the biophysical properties of proteins (Bar-Even et al. 2010).
We note that in our model, there is epistasis between genes because they are coupled in the nonlinear fitness function (eqs. 1–3). In the fitness effect 
 , the value of fpremutation is determined by the biophysical properties of all genes in the cell. Thus, the quantitative effect of a prior mutation in one gene could influence the fitness effect of the current mutation in another gene. The epistasis is strongest when mutations fall on the genes with low folding stability, because this is where the curvature of the fitness landscape is most pronounced (supplementary fig. S2, Supplementary Material online).
Evolutionary Dynamics with Mutation, Selection, and Drift
We follow the standard Moran process in the evolutionary simulations (supplementary fig. S2, Supplementary Material online). The fitness function (eq. 1) defines the replication rate. We make no prior assumption on the dynamics and/or the resulting DFE. To update the evolution of the organism, we use the Gillespie algorithm: At each replication event, the replicating cell splits into two daughter cells, each can potentially mutate at the rate of µ = 0.01/genome/replication. If the mutation is nonsynonymous, the folding stability of the mutated gene is updated with ΔΔG values estimated using a physical force field and the 3D structures as input (discussed later). We performed this simulation of mutation, selection, and drift toward the dynamic equilibrium imposed by mutation–selection balance (fig. 1B).
All the genes are initialized with folding stability ΔG0 = −5 kcal/mol at time t = 0. This dynamic equilibrium of mutation–selection balance is robust to the choice of starting ΔG0. When the proteins are initialized at the very stable regime, these genes will migrate toward less stable regime because of drift. On the other hand, when the proteins are initialized in the less stable regime, the genes migrate toward greater folding stability because of selection. All analysis reported are performed only after the population has reached mutation–selection balance (fig. 1).
After the simulation reaches mutation–selection balance, we save the information of all arising mutations, including their location in the genome, nucleotide change, ΔΔG, and s. We also save the genomes of all cells in the population every 10 generations (i.e., every 10Ne replication events). The information allows us to reconstruct the trajectories and all arising mutations.
In our earlier work (Serohijos et al. 2012), where Nµ ≪ 1 and the population is monoclonal, we employed Wright–Fisher’s discrete nonoverlapping generations model. Also, in the earlier work, we defined the fitness as  following Drummond and Wilke (2008). In the present work, where we wish to determine the dynamics of segregation and clonal interference between alleles, we perform our simulations in the overlapping generations model where the fitness (eq 1) is of the Malthusian type. Both fitness definitions satisfy the transformation
  (Orr 2009).
Updating the Folding Stability During Nonsynonymous Substitutions
When a nonsynonymous substitution occurs, we update the folding stability according to  , where ΔG0 is the stability of the protein at time t = 0, ΔΔGi is the estimated change in folding stability due to a single point mutation, and n is the total number of amino acid differences of the current sequence with respect to the sequence at time = 0. ΔΔG is estimated using a physical force field (Yin et al. 2007). Our protocol assumes that the effect on folding stability of multiple mutations is simply the additive effect of all mutations acting independently (Fersht et al. 1992).
This assumption cannot accurately predict the ΔG of a sequence that is significantly diverged from the sequence at time = 0. Indeed, we do not claim that when a specific sequence from simulation is experimentally expressed and purified, the measured ΔG is similar to the one predicted in simulation. Ideally, one could calculate the ΔΔG using the 3D structure as input as soon as these mutations arise in the population during an evolutionary run. However, this implementation is currently computationally intractable because estimation of the ΔΔG of one mutation takes ∼5 min per mutation, and the evolutionary simulation evaluates 108 mutations. The assumption of linearity, however, does not compromise biophysical correctness because the model captures the essential features of protein evolution.
First, these force fields coupled with selection for folding stability can recapitulate the extent of per site amino acid conservation among naturally occurring homologous sequences (Ding and Dokholyan, 2006). Indeed, this is one important test during the development of these biophysical tools.
Second, for any “wildtype” sequence in our simulation, the distribution of ΔΔG for all arising single amino acid mutations is consistent with the ΔΔG distribution for random mutations in naturally occuring sequences (Tokuriki et al. 2007). This feature is important because it quantitatively determines the balance between the supply of destabilizing and stabilizing mutations and the strength of the mutational drift.
Analysis of Simulation Trajectories
After simulation, we trace the history of each arising mutation by counting the number of individuals that exhibit the mutation in the future generations. The tracing of mutational history ends when the mutation fixes in the population or is lost to random drift (fig. 2 and supplementary fig. S3, Supplementary Material online). From these trajectories, we calculate the correlated fixation events (fig. 2B). To estimate the probability of fixation (fig. 3), we group the trajectories according to their allele frequencies and selection coefficients. The estimated probability is the number of trajectories that reached a given allele frequency  divided by all arising trajectories of that given selection coefficient.
We use Matlab to fit a gamma distribution to the DFE. Also, we follow the standard procedure in evolutionary biology to model the demography of an asexual organism in estimating the DFE among sexual organisms such as human and flies (Bustamante et al. 2005; Eyre-Walker et al. 2006; Kryukov et al. 2009).
Bioinformatics Analysis
For bioinformatics analysis of the SNPs in the human genome, we use the database dBSNP (Sherry et al. 2001) for allele frequency information and SNPEffect (De Baets et al. 2012) for biophysical estimation of the ΔΔG. SNPEffect used the 3D structure of the protein as input to FoldX (Schymkowitz et al. 2005). We group the SNPs according to their allele frequencies and plotted the distribution of their ΔΔG (fig. 6B). For arising ΔΔG (fig 6B, blue line), we use the empirically measured ΔΔG from a diverse set of proteins in the ProTherm database (Kumar et al. 2006; Tokuriki et al. 2007).
Simulations in Monoclonal Populations as Control
To serve as a control and show that the results in this study are robust to the modeling of the cell or to the formal equation of the fitness function, we perform simulations of an evolving monoclonal population. The methods are described in greater detail in a recent work (Serohijos et al. 2012). Briefly, in the monoclonal simulations, the cell is composed of 103 genes, each with protein abundances ranging from 10 to 106 copies per cell to recapitulate the broad distribution of abundances in real organisms (Ghaemmaghami et al. 2003; Ishihama et al. 2008). The effective population size in the monoclonal simulation is Ne = 104. Effects of folding stability are estimated from the Gaussian distribution of ΔΔG whose parameters are derived from the ProTherm database (Kumar et al. 2006). The evolutionary dynamics likewise include mutation, selection, and drift (see Serohijos et al. [2012] for details). This specific approach, which recapitulates the universal observation of highly expressed proteins evolving slowly (Drummond and Wilke 2008; Serohijos et al. 2012) or that highly expressed proteins tend to be more stable (Cherry 2010; Serohijos et al. 2013), also exhibits the near neutrality of the fixed beneficial mutations (supplementary figs. S7 and S8, Supplementary Material online) and the equal partitioning of fixed mutations into ΔΔG > 0 and ΔΔG < 0.
Supplementary Material
Supplementary figures S1–S8 and table S1 are available at Molecular Biology and Evolution online (http://www.mbe.oxfordjournals.org/).
Acknowledgments
The authors are very grateful to Dan Hartl, Michael Lynch, and Shamil Sunyaev for discussions and comments on the manuscript. This work was funded by NIH (RO1 068670).
References
- Akashi H, Osada N, Ohta T. Weak selection and protein evolution. Genetics. 2012;192:15–31. doi: 10.1534/genetics.112.140178. [DOI] [PMC free article] [PubMed] [Google Scholar]
- Allali-Hassani A, Wasney GA, Chau I, et al. (13 co-authors) A survey of proteins encoded by non-synonymous single nucleotide polymorphisms reveals a significant fraction with altered stability and activity. Biochem J. 2009;424:15–26. doi: 10.1042/BJ20090723. [DOI] [PubMed] [Google Scholar]
- Bar-Even A, Noor E, Lewis NE, Milo R. Design and analysis of synthetic carbon fixation pathways. Proc Natl Acad Sci U S A. 2010;107:8889–8894. doi: 10.1073/pnas.0907176107. [DOI] [PMC free article] [PubMed] [Google Scholar]
- Bloom JD, Raval A, Wilke CO. Thermodynamics of neutral protein evolution. Genetics. 2007;175:255–266. doi: 10.1534/genetics.106.061754. [DOI] [PMC free article] [PubMed] [Google Scholar]
- Bucciantini M, Giannoni E, Chiti F, Baroni F, Formigli L, Zurdo J, Taddei N, Ramponi G, Dobson CM, Stefani M. Inherent toxicity of aggregates implies a common mechanism for protein misfolding diseases. Nature. 2002;416:507–511. doi: 10.1038/416507a. [DOI] [PubMed] [Google Scholar]
- Bustamante CD, Fledel-Alon A, Williamson S, et al. (14 co-authors) Natural selection on protein-coding genes in the human genome. Nature. 2005;437:1153–1157. doi: 10.1038/nature04240. [DOI] [PubMed] [Google Scholar]
- Bustamante CD, Nielsen R, Sawyer SA, Olsen KM, Purugganan MD, Hartl DL. The cost of inbreeding in Arabidopsis. Nature. 2002;416:531–534. doi: 10.1038/416531a. [DOI] [PubMed] [Google Scholar]
- Cherry JL. Highly expressed and slowly evolving proteins share compositional properties with thermophilic proteins. Mol Biol Evol. 2010;27:735–741. doi: 10.1093/molbev/msp270. [DOI] [PMC free article] [PubMed] [Google Scholar]
- De Baets G, Van Durme J, Reumers J, Maurer-Stroh S, Vanhee P, Dopazo J, Schymkowitz J, Rousseau F. SNPeffect 4.0: on-line prediction of molecular and structural effects of protein-coding variants. Nucleic Acids Res. 2012;40:D935–D939. doi: 10.1093/nar/gkr996. [DOI] [PMC free article] [PubMed] [Google Scholar]
- DePristo MA, Weinreich DM, Hartl DL. Missense meanderings in sequence space: a biophysical view of protein evolution. Nat Rev Genet. 2005;6:678–687. doi: 10.1038/nrg1672. [DOI] [PubMed] [Google Scholar]
- Desai MM, Fisher DS. Beneficial mutation selection balance and the effect of linkage on positive selection. Genetics. 2007;176:1759–1798. doi: 10.1534/genetics.106.067678. [DOI] [PMC free article] [PubMed] [Google Scholar]
- Ding F, Dokholyan NV. Emergence of protein fold families through rational design. PLoS Comput Biol. 2006;2:e85. doi: 10.1371/journal.pcbi.0020085. [DOI] [PMC free article] [PubMed] [Google Scholar]
- Drummond DA, Wilke CO. Mistranslation-induced protein misfolding as a dominant constraint on coding-sequence evolution. Cell. 2008;134:341–352. doi: 10.1016/j.cell.2008.05.042. [DOI] [PMC free article] [PubMed] [Google Scholar]
- Duarte NC, Becker SA, Jamshidi N, Thiele I, Mo ML, Vo TD, Srivas R, Palsson BO. Global reconstruction of the human metabolic network based on genomic and bibliomic data. Proc Natl Acad Sci U S A. 2007;104:1777–1782. doi: 10.1073/pnas.0610772104. [DOI] [PMC free article] [PubMed] [Google Scholar]
- Dykhuizen DE, Dean AM, Hartl DL. Metabolic flux and fitness. Genetics. 1987;115:25–31. doi: 10.1093/genetics/115.1.25. [DOI] [PMC free article] [PubMed] [Google Scholar]
- Edwards JS, Ibarra RU, Palsson BO. In silico predictions of Escherichia coli metabolic capabilities are consistent with experimental data. Nat Biotechnol. 2001;19:125–130. doi: 10.1038/84379. [DOI] [PubMed] [Google Scholar]
- Eyre-Walker A, Keightley PD. The distribution of fitness effects of new mutations. Nat Rev Genet. 2007;8:610–618. doi: 10.1038/nrg2146. [DOI] [PubMed] [Google Scholar]
- Eyre-Walker A, Woolfit M, Phelps T. The distribution of fitness effects of new deleterious amino acid mutations in humans. Genetics. 2006;173:891–900. doi: 10.1534/genetics.106.057570. [DOI] [PMC free article] [PubMed] [Google Scholar]
- Fersht AR, Matouschek A, Serrano L. The folding of an enzyme. I. Theory of protein engineering analysis of stability and pathway of protein folding. J Mol Biol. 1992;224:771–782. doi: 10.1016/0022-2836(92)90561-w. [DOI] [PubMed] [Google Scholar]
- Fisher RA. The genetical theory of natural selection. Oxford: The Clarendon Press; 1930. [Google Scholar]
- Fogle CA, Nagle JL, Desai MM. Clonal interference, multiple mutations and adaptation in large asexual populations. Genetics. 2008;180:2163–2173. doi: 10.1534/genetics.108.090019. [DOI] [PMC free article] [PubMed] [Google Scholar]
- Geiler-Samerotte KA, Dion MF, Budnik BA, Wang SM, Hartl DL, Drummond DA. Misfolded proteins impose a dosage-dependent fitness cost and trigger a cytosolic unfolded protein response in yeast. Proc Natl Acad Sci U S A. 2011;108:680–685. doi: 10.1073/pnas.1017570108. [DOI] [PMC free article] [PubMed] [Google Scholar]
- Gerrish PJ, Lenski RE. The fate of competing beneficial mutations in an asexual population. Genetica. 1998;102–103:127–144. [PubMed] [Google Scholar]
- Ghaemmaghami S, Huh WK, Bower K, Howson RW, Belle A, Dephoure N, O’Shea EK, Weissman JS. Global analysis of protein expression in yeast. Nature. 2003;425:737–741. doi: 10.1038/nature02046. [DOI] [PubMed] [Google Scholar]
- Goldstein RA. The evolution and evolutionary consequences of marginal thermostability in proteins. Proteins. 2011;79:1396–1407. doi: 10.1002/prot.22964. [DOI] [PubMed] [Google Scholar]
- Heo M, Maslov S, Shakhnovich E. Topology of protein interaction network shapes protein abundances and strengths of their functional and nonspecific interactions. Proc Natl Acad Sci U S A. 2011;108:4258–4263. doi: 10.1073/pnas.1009392108. [DOI] [PMC free article] [PubMed] [Google Scholar]
- Ishihama Y, Schmidt T, Rappsilber J, Mann M, Hartl FU, Kerner MJ, Frishman D. Protein abundance profiling of the Escherichia coli cytosol. BMC Genomics. 2008;9:102. doi: 10.1186/1471-2164-9-102. [DOI] [PMC free article] [PubMed] [Google Scholar]
- Karr JR, Sanghvi JC, Macklin DN, Gutschow MV, Jacobs JM, Bolival B, Jr, Assad-Garcia N, Glass JI, Covert MW. A whole-cell computational model predicts phenotype from genotype. Cell. 2012;150:389–401. doi: 10.1016/j.cell.2012.05.044. [DOI] [PMC free article] [PubMed] [Google Scholar]
- Kimura M. Evolutionary rate at the molecular level. Nature. 1968;217:624–626. doi: 10.1038/217624a0. [DOI] [PubMed] [Google Scholar]
- Koonin EV, Wolf YI. Constraints and plasticity in genome and molecular-phenome evolution. Nat Rev Genet. 2010;11:487–498. doi: 10.1038/nrg2810. [DOI] [PMC free article] [PubMed] [Google Scholar]
- Kryukov GV, Shpunt A, Stamatoyannopoulos JA, Sunyaev SR. Power of deep, all-exon resequencing for discovery of human trait genes. Proc Natl Acad Sci U S A. 2009;106:3871–3876. doi: 10.1073/pnas.0812824106. [DOI] [PMC free article] [PubMed] [Google Scholar]
- Kumar MD, Bava KA, Gromiha MM, Prabakaran P, Kitajima K, Uedaira H, Sarai A. ProTherm and ProNIT: thermodynamic databases for proteins and protein–nucleic acid interactions. Nucleic Acids Res. 2006;34:D204–D206. doi: 10.1093/nar/gkj103. [DOI] [PMC free article] [PubMed] [Google Scholar]
- Kumar S, Filipski AJ, Battistuzzi FU, Kosakovsky Pond SL, Tamura K. Statistics and truth in phylogenomics. Mol Biol Evol. 2012;29:457–472. doi: 10.1093/molbev/msr202. [DOI] [PMC free article] [PubMed] [Google Scholar]
- Lynch M, Conery JS. The origins of genome complexity. Science. 2003;302:1401–1404. doi: 10.1126/science.1089370. [DOI] [PubMed] [Google Scholar]
- McCarthy MI, Abecasis GR, Cardon LR, Goldstein DB, Little J, Ioannidis JPA, Hirschhorn JN. Genome-wide association studies for complex traits: consensus, uncertainty and challenges. Nat Rev Genet. 2008;9:356–369. doi: 10.1038/nrg2344. [DOI] [PubMed] [Google Scholar]
- McDonald JH, Kreitman M. Adaptive protein evolution at the Adh locus in Drosophila. Nature. 1991;351:652–654. doi: 10.1038/351652a0. [DOI] [PubMed] [Google Scholar]
- McVean GA, Charlesworth B. The effects of Hill-Robertson interference between weakly selected mutations on patterns of molecular evolution and variation. Genetics. 2000;155:929–944. doi: 10.1093/genetics/155.2.929. [DOI] [PMC free article] [PubMed] [Google Scholar]
- Milo R, Last RL. Achieving diversity in the face of constraints: lessons from metabolism. Science. 2012;336:1663–1667. doi: 10.1126/science.1217665. [DOI] [PubMed] [Google Scholar]
- Mustonen V, Kinney J, Callan CG, Jr, Lassig M. Energy-dependent fitness: a quantitative model for the evolution of yeast transcription factor binding sites. Proc Natl Acad Sci U S A. 2008;105:12376–12381. doi: 10.1073/pnas.0805909105. [DOI] [PMC free article] [PubMed] [Google Scholar]
- Mustonen V, Lassig M. From fitness landscapes to seascapes: non-equilibrium dynamics of selection and adaptation. Trends Genet. 2009;25:111–119. doi: 10.1016/j.tig.2009.01.002. [DOI] [PubMed] [Google Scholar]
- Neher RA, Shraiman BI. Genetic draft and quasi-neutrality in large facultatively sexual populations. Genetics. 2011;188:975–996. doi: 10.1534/genetics.111.128876. [DOI] [PMC free article] [PubMed] [Google Scholar]
- Nei M, Suzuki Y, Nozawa M. The neutral theory of molecular evolution in the genomic era. Annu Rev Genomics Hum Genet. 2010;11:265–289. doi: 10.1146/annurev-genom-082908-150129. [DOI] [PubMed] [Google Scholar]
- Ohta T. Slightly deleterious mutant substitutions in evolution. Nature. 1973;246:96–98. doi: 10.1038/246096a0. [DOI] [PubMed] [Google Scholar]
- Orr HA. Fitness and its role in evolutionary genetics. Nat Rev Genet. 2009;10:531–539. doi: 10.1038/nrg2603. [DOI] [PMC free article] [PubMed] [Google Scholar]
- Pal C, Papp B, Hurst LD. Highly expressed genes in yeast evolve slowly. Genetics. 2001;158:927–931. doi: 10.1093/genetics/158.2.927. [DOI] [PMC free article] [PubMed] [Google Scholar]
- Pal C, Papp B, Lercher MJ. An integrated view of protein evolution. Nat Rev Genet. 2006;7:337–348. doi: 10.1038/nrg1838. [DOI] [PubMed] [Google Scholar]
- Privalov PL. Stability of proteins: small globular proteins. Adv Protein Chem. 1979;33:167–241. doi: 10.1016/s0065-3233(08)60460-x. [DOI] [PubMed] [Google Scholar]
- Sanjuan R, Moya A, Elena SF. The distribution of fitness effects caused by single-nucleotide substitutions in an RNA virus. Proc Natl Acad Sci U S A. 2004;101:8396–8401. doi: 10.1073/pnas.0400146101. [DOI] [PMC free article] [PubMed] [Google Scholar]
- Sawyer SA, Parsch J, Zhang Z, Hartl DL. Prevalence of positive selection among nearly neutral amino acid replacements in Drosophila. Proc Natl Acad Sci U S A. 2007;104:6504–6510. doi: 10.1073/pnas.0701572104. [DOI] [PMC free article] [PubMed] [Google Scholar]
- Schymkowitz J, Borg J, Stricher F, Nys R, Rousseau F, Serrano L. The FoldX web server: an online force field. Nucleic Acids Res. 2005;33:W382–W388. doi: 10.1093/nar/gki387. [DOI] [PMC free article] [PubMed] [Google Scholar]
- Sella G, Hirsh AE. The application of statistical physics to evolutionary biology. Proc Natl Acad Sci U S A. 2005;102:9541–9546. doi: 10.1073/pnas.0501865102. [DOI] [PMC free article] [PubMed] [Google Scholar]
- Serohijos AW, Lee SY, Shakhnovich EI. Highly abundant proteins favor more stable 3D structures in yeast. Biophys J. 2013;104:L1–L3. doi: 10.1016/j.bpj.2012.11.3838. [DOI] [PMC free article] [PubMed] [Google Scholar]
- Serohijos AW, Rimas Z, Shakhnovich EI. Protein biophysics explains why highly abundant proteins evolve slowly. Cell Rep. 2012;2:249–256. doi: 10.1016/j.celrep.2012.06.022. [DOI] [PMC free article] [PubMed] [Google Scholar]
- Sherry ST, Ward MH, Kholodov M, Baker J, Phan L, Smigielski EM, Sirotkin K. dbSNP: the NCBI database of genetic variation. Nucleic Acids Res. 2001;29:308–311. doi: 10.1093/nar/29.1.308. [DOI] [PMC free article] [PubMed] [Google Scholar]
- Silander OK, Tenaillon O, Chao L. Understanding the evolutionary fate of finite populations: the dynamics of mutational effects. PLoS Biol. 2007;5:e94. doi: 10.1371/journal.pbio.0050094. [DOI] [PMC free article] [PubMed] [Google Scholar]
- Smith NG, Eyre-Walker A. Adaptive protein evolution in Drosophila. Nature. 2002;415:1022–1024. doi: 10.1038/4151022a. [DOI] [PubMed] [Google Scholar]
- Soskine M, Tawfik DS. Mutational effects and the evolution of new protein functions. Nat Rev Genet. 2010;11:572–582. doi: 10.1038/nrg2808. [DOI] [PubMed] [Google Scholar]
- Strelkowa N, Lassig M. Clonal interference in the evolution of influenza. Genetics. 2012;192:671–682. doi: 10.1534/genetics.112.143396. [DOI] [PMC free article] [PubMed] [Google Scholar]
- Taverna DM, Goldstein RA. Why are proteins marginally stable? Proteins. 2002;46:105–109. doi: 10.1002/prot.10016. [DOI] [PubMed] [Google Scholar]
- Tokuriki N, Stricher F, Schymkowitz J, Serrano L, Tawfik DS. The stability effects of protein mutations appear to be universally distributed. J Mol Biol. 2007;369:1318–1332. doi: 10.1016/j.jmb.2007.03.069. [DOI] [PubMed] [Google Scholar]
- van Nimwegen E, Crutchfield JP, Huynen M. Neutral evolution of mutational robustness. Proc Natl Acad Sci U S A. 1999;96:9716–9720. doi: 10.1073/pnas.96.17.9716. [DOI] [PMC free article] [PubMed] [Google Scholar]
- Vavouri T, Semple JI, Garcia-Verdugo R, Lehner B. Intrinsic protein disorder and interaction promiscuity are widely associated with dosage sensitivity. Cell. 2009;138:198–208. doi: 10.1016/j.cell.2009.04.029. [DOI] [PubMed] [Google Scholar]
- Vignuzzi M, Stone JK, Arnold JJ, Cameron CE, Andino R. Quasispecies diversity determines pathogenesis through cooperative interactions in a viral population. Nature. 2006;439:344–348. doi: 10.1038/nature04388. [DOI] [PMC free article] [PubMed] [Google Scholar]
- Wilke CO. The speed of adaptation in large asexual populations. Genetics. 2004;167:2045–2053. doi: 10.1534/genetics.104.027136. [DOI] [PMC free article] [PubMed] [Google Scholar]
- Wilke CO, Wang JL, Ofria C, Lenski RE, Adami C. Evolution of digital organisms at high mutation rates leads to survival of the flattest. Nature. 2001;412:331–333. doi: 10.1038/35085569. [DOI] [PubMed] [Google Scholar]
- Wylie CS, Shakhnovich EI. A biophysical protein folding model accounts for most mutational fitness effects in viruses. Proc Natl Acad Sci U S A. 2011;108:9916–9921. doi: 10.1073/pnas.1017572108. [DOI] [PMC free article] [PubMed] [Google Scholar]
- Yang JR, Zhuang SM, Zhang J. Impact of translational error-induced and error-free misfolding on the rate of protein evolution. Mol Syst Biol. 2010;6:421. doi: 10.1038/msb.2010.78. [DOI] [PMC free article] [PubMed] [Google Scholar]
- Yin S, Ding F, Dokholyan NV. Eris: an automated estimator of protein stability. Nat Methods. 2007;4:466–467. doi: 10.1038/nmeth0607-466. [DOI] [PubMed] [Google Scholar]
- Yue P, Moult J. Identification and analysis of deleterious human SNPs. J Mol Biol. 2006;356:1263–1274. doi: 10.1016/j.jmb.2005.12.025. [DOI] [PubMed] [Google Scholar]
- Zeldovich KB, Chen P, Shakhnovich EI. Protein stability imposes limits on organism complexity and speed of molecular evolution. Proc Natl Acad Sci U S A. 2007;104:16152–16157. doi: 10.1073/pnas.0705366104. [DOI] [PMC free article] [PubMed] [Google Scholar]
- Zhang J, Maslov S, Shakhnovich EI. Constraints imposed by non-functional protein-protein interactions on gene expression and proteome size. Mol Syst Biol. 2008;4:210. doi: 10.1038/msb.2008.48. [DOI] [PMC free article] [PubMed] [Google Scholar]
Associated Data
This section collects any data citations, data availability statements, or supplementary materials included in this article.