

Abstract
We describe the comprehensive analysis of the yeast proteome in just over one hour of optimized analysis. We achieve this expedited proteome characterization with improved sample preparation, chromatographic separations, and by using a new Orbitrap hybrid mass spectrometer equipped with a mass filter, a collision cell, a high-field Orbitrap analyzer, and, finally, a dual cell linear ion trap analyzer (Q-OT-qIT, Orbitrap Fusion). This system offers high MS2 acquisition speed of 20 Hz and detects up to 19 peptide sequences within a single second of operation. Over a 1.3 h chromatographic method, the Q-OT-qIT hybrid collected an average of 13,447 MS1 and 80,460 MS2 scans (per run) to produce 43,400 (x̄) peptide spectral matches and 34,255 (x̄) peptides with unique amino acid sequences (1% false discovery rate (FDR)). On average, each one hour analysis achieved detection of 3,977 proteins (1% FDR). We conclude that further improvements in mass spectrometer scan rate could render comprehensive analysis of the human proteome within a few hours.
The ability to measure differences in protein expression has become key to understanding biological phenomena (1, 2). Owing to cost, speed, and accessibility, transcriptomic analysis is often used as a proteomic proxy (3, 4). That said, mRNA is a genetic intermediary and cannot inform on the myriad of post-translational regulation processes (5–7). For the past decade considerable effort has been invested in maturing proteomic technology to deliver information at a rate and cost commensurate to transcriptomic technologies.
Historically yeast, with its 6600 open reading frames, has been the preferred proteomic technology test-bed (8). In 2003, Weissmann and colleagues measured approximate expression levels of each yeast gene using either GFP or TAP tags (9). This seminal work established that ∼4500 proteins are expressed during log-phase yeast growth. Subsequent mass spectrometry-based studies have confirmed this early estimate (9–12). With this knowledge, we hereby define comprehensive proteome analysis as an experiment that detects ∼90% of the expressed proteome (≥ 4000 proteins for yeast). Note others have used the term “nearly complete” for this purpose; we posit that comprehensive has identical meaning (i.e. including many, most, or all things) (13).
Initial MS-based proteomic analyses of yeast, each identifying up to a few hundred proteins, were conducted using a variety of separation and MS technologies (14–16). Yates and co-workers reported the first large-scale yeast proteome study in 2001 with the identification of 1483 proteins following ∼ 68 h of mass spectral analysis, i.e. 0.4 proteins were identified per minute (17). Their method—two dimensional chromatography coupled with tandem mass spectrometry—has provided a template for large-scale protein analysis for the past decade (18–20). By incorporating an offline first dimension of separation with more extensive fractionation (80 versus 15) Gygi et al. expanded on this work in 2003 (21). That said, the modest increase in identified proteins (1504) required 135 h of analysis, reducing the protein per minute count to 0.2. Armed with a faster hybrid mass spectrometer capable of accurate mass measurement, Mann and colleagues achieved detection of 2003 yeast proteins in an impressive 48 h (0.7 proteins/minute) in 2006 (22).
From these three pioneering studies we begin to see the impact of mass spectrometer acquisition rate on the depth and rate of proteome analysis. The most recent application of such technology to the yeast proteome, however, The Mann work used a hybrid linear ion trap-ion cyclotron resonance Fourier transform instrument (LTQ-FT) that delivered MS2 scans at a rate of ∼650 ms (23). The earlier studies, i.e. Yates and Gygi, relied on the considerably slower scanning (1–3 s/scan) three-dimensional ion trap technology. In 2008, using the novel Orbitrap hybrid mass spectrometer, Mann and colleagues reported on the first comprehensive analysis of the yeast proteome by identifying nearly 4000 proteins (10). Extensive fractionation (24) and triplicate analysis of each fraction rendered the study a considerable time investment at ∼144 analysis hours (0.5 proteins/minute). In 2010 our group achieved similar comprehensive analysis, but improved sequence coverage, using fractionation and multiple proteases (24). That work, however, required even longer analysis time (0.2 proteins/min).
And that was the state-of-the-art as recently as three years ago. Doubtless we, the proteomics community, had achieved one momentous goal—comprehensive coverage of the yeast proteome. Still, obtaining this depth was not routine as it mandated days of MS analysis and a considerable amount of expert labor. In 2012, with new, even faster scanning, quadrupole-Orbitrap technology (Q-OT, Q-Exactive), Mann and colleagues dispatched the concept of fractionation, improved the quality of sample preparation, and placed emphasis on higher quality online separations (25). With their streamlined method they achieved detection of just over 3900 yeast proteins following four hours of MS analysis. Even more impressive this strategy translated to the identification of 16.3 proteins per minute—a 33-fold improvement over the next best comprehensive study. This success was a remarkable achievement and illustrates that comprehensive proteomic technology can indeed be executed in a time efficient manner.
Time-of-flight hybrid systems, of course, can deliver very high MS2 acquisition rates, up to 100 Hz in some reports. In 2011, Muddiman and colleagues reported yeast proteome analysis using a quadrupole-TOF system (i.e. TripleTOF) operating at a much lower rate (20 Hz) MS2 scan rate (26). Even at this reduced rate, only 16% of the spectra were mapped to unique sequences and 1112 unique proteins identified. Because of reduced MS2 spectral quality (i.e. low signal-to-noise, S/N), even fewer unique peptide identifications were achieved at higher MS2 acquisition rates. Other studies using TOF technologies report similar results (27, 28). For maximal proteome depth, we conclude that increased scan speed must not come at the cost of reduced spectral quality. Recently, a new Orbitrap hybrid mass spectrometer having a mass filter, a collision cell, a high-field Orbitrap analyzer, and, finally, a dual cell linear ion trap analyzer was described (Q-OT-qIT, Orbitrap Fusion) (29, 30). This system offers high MS2 acquisition speed of 20 Hz—double that of the Q-OT system used by Mann and colleagues. We postulated that this fresh system, with its fast scan rate, could provide comprehensive proteome analysis in record time. To maximize performance we developed an optimized cellular lysis approach, employed trypsin digestion, and used dimethyl sulfoxide (DMSO, 5%) as an LC additive to increase abundance of acidic peptides and unify charge state (31, 32). Using this novel system we report the comprehensive analysis of the yeast proteome (4002 with 1% FDR) following 1.3 h of nLC-MS2 analysis (70 min gradient). These experiments delivered an extraordinary 67 proteins per minute and demonstrate that complete analysis of the yeast proteome can be routinely performed in approximately one hour.
EXPERIMENTAL PROCEDURES
Yeast Culture and Lysis
Saccharomyces cerevisiae strain BY4741 was grown in yeast extract peptone dextrose media (1% yeast extract, 2% peptone, 2% dextrose). Four liters of media was divided between four two-liter flasks and inoculated with a starter culture (OD600 = 2.58). Cells were allowed to propagate for ∼12 generations (20 h) to an OD600 ∼2 (average of 2.18). The cells were harvested by centrifugation at 5000 rpm for 5 min, supernatant decanted, resuspended in chilled NanoPure water and all pellets were pooled together. The cells were washed two more times and centrifuged for the final pelleting at 5000 rpm for 10 min. A pellet corresponding to 5% of the total cells grown, was resuspended in lysis buffer composed of 50 mm Tris pH8, 8 m urea, 75 mm sodium chloride, 100 mm sodium butyrate, protease (Roche) and phosphatase inhibitor tablet (Roche). Yeast cells were lysed by glass bead milling (Retsch). Briefly, 2 ml of acid washed glass beads were combined with 2.5 ml of resuspended yeast cells in a stainless steel container and shaken 8 times at 30 hz for 4 min with a 1 min rest in between.
Protein Digestion
Lysate protein concentration was measured by BCA (Thermo Pierce). Protein was reduced by addition of 5 mm dithiothreitol and incubated for 45 min at 55 °C. The mixture was cooled to room temperature, followed by alkylation of free thiols by addition of 15 mm iodoacetamide in the dark for 30 min. The alkylation reaction was quenched with 5 mm dithiothreitol. Urea concentration was diluted to 1.5 m with 50 mm Tris pH 8.0. Proteolytic digestion was performed by addition of Trypsin (Promega, Madison, WI), 1:50 enzyme to protein ratio, and incubated at ambient temperature overnight. An additional 1:50 bolus of trypsin was added in the morning and incubated at ambient temperature for 1 h. The digestion was quenched by addition of TFA and desalted over a tC18 Sep-Pak (Waters, Milford, MA).
nLC-MS2 Analysis
Reversed phase columns were prepared in-house. Briefly, a 75–360 μm inner-outer diameter bare-fused silica capillary, with a laser pulled electrospray tip, was packed with 1.7 μm diameter, 130 Å pore size, Bridged Ethylene Hybrid C18 particles (Waters) to a final length of 35 cm. The column was installed on a nanoAcquity UPLC (Waters) using a stainless steel ultra-high pressure union formatted for 360 μm outer diameter columns (IDEX) and heated to 60 °C for all runs. Mobile phase buffer A was composed of water, 0.2% formic acid, and 5% DMSO. Mobile phase B was composed of acetonitrile, 0.2% formic acid, and 5% DMSO. Samples were loaded onto the column for 12 min at 0.35 μl/min. Mobile phase B increases to 4% in the first 0.1 min then to 12% B at 32 min, 22% B at 60 min, and 30% B at 70 min, followed by a 5 min wash at 70% B and a 20 min re-equilibration at 0%B.
Eluting peptide cations were converted to gas-phase ions by electrospray ionization and analyzed on a Thermo Orbitrap Fusion (Q-OT-qIT, Thermo). Survey scans of peptide precursors from 300 to 1500 m/z were performed at 60K resolution (at 200 m/z) with a 5 × 10⁵ ion count target. Tandem MS was performed by isolation at 0.7 Th with the quadrupole, HCD fragmentation with normalized collision energy of 30, and rapid scan MS analysis in the ion trap. The MS2 ion count target was set to 104 and the max injection time was 35 ms. Only those precursors with charge state 2–6 were sampled for MS2. The dynamic exclusion duration was set to 45 s with a 10 ppm tolerance around the selected precursor and its isotopes. Monoisotopic precursor selection was turned on. The instrument was run in top speed mode with 5 s cycles, meaning the instrument would continuously perform MS2 events until the list of nonexcluded precursors diminishes to zero or 5 s, whichever is shorter. Elite runs were performed with Survey scans of peptide precursors from 300 to 1500 m/z 60K resolution (at 200 m/z) with a 1 × 10⁶ ion count target. Tandem MS was performed by isolation at 1.8 Th with the ion-trap, CAD fragmentation with normalized collision energy of 35, and rapid scan MS analysis in the ion trap. The data dependent top 20 precursors were selected for MS2. MS2 ion count target was set to 5 × 10³ and the max injection time was 125 ms. Only those precursors with charge state +2 or higher were sampled for MS2. The dynamic exclusion duration was set to 40 s with a 10 ppm tolerance around the selected precursor and its isotopes. Monoisotopic precursor selection was turned on.
Data Analysis
The raw data was processed using Proteome Discoverer (version 1.4.0.288, Thermo Fischer Scientific). MS2 spectra were searched with SEQUEST engine against a database of 6632 yeast open reading frames (ORFs)1 (www.yeastgenome.com, February 3, 2011) (33). Peptides were generated from a tryptic digestion with up to two missed cleavages, carbamidomethylation of cysteines as fixed modifications, and oxidation of methionines and protein N-terminal acetylation as variable modifications. Precursor mass tolerance was 20 ppm and product ions were searched at 0.35 Da tolerances. Peptide spectral matches (PSM) were validated using percolator based on q-values at a 1% FDR (34). With proteome Discoverer, peptide identifications were grouped into proteins according to the law of parsimony and filtered to 1% FDR (35). For cumulative protein group identification, PSMs passing the FDR were exported to a text file and processed by a modified version of Protein Hoarder (version 2.4.1) (36). The PSMs were iteratively processed in successive 1 min windows and grouped into proteins using the law of parsimony at a 1% FDR.
RESULTS
Considerable gains in the depth and rate of proteomic analysis have been realized over the past decade (vide supra). These improved results stem from routine use of high mass accuracy and resolution, but also from a steady increase in MS2 acquisition rate. In the decade spanning the seminal Yates publication in 2001 and the single-shot proteome work of Mann et al. in 2012, MS2 sampling rates rose from ∼0.75 Hz to nearly 10 Hz (17, 25). Here we report on an even newer generation of mass spectrometer that comprises a mass resolving quadrupole, Orbitrap, collision cell, and linear ion trap (Q-OT-qIT, Fusion, Fig. 1) (29, 30). In this system, MS acquisition rate is not only boosted by the presence of a very fast scanning dual cell linear ion trap, but also by a control environment having multiple, independent processing units. The new system is equipped with a sophisticated control system that parallelizes the processes of ion injection, precursor isolation, fragmentation, and mass analysis to achieve a ∼2× boost in acquisition rates. We reasoned that this Q-OT-qIT configuration, with its 20 Hz MS2 acquisition rate, could afford a considerable gain for rapid, whole proteome analysis.
Fig. 1.

Schematic of the Q-OT-qIT hybrid mass spectrometer (Fusion). The system differs from previous generations of quadrupole ion trap/Orbitrap hybrids by introduction of a resolving quadrupole mass filter and rearrangement of the geometry to place the linear ion traps to the rear of the collision cell. The reconfigured geometry relieves the linear ion trap of two of its former functions—precursor ion isolation and dissociation. The consequence is both improved and faster operation.
The Q-OT-qIT System
To test this hypothesis we began by performing a parametric evaluation using a complex mixture of yeast tryptic peptides eluted into the system over a 70 min gradient. We examined several settings including collisional activation mode (i.e. HCD or trap CAD), MS1 resolution, collision energy, maximum inject time, and dynamic exclusion settings. Detailed plots highlighting these results are included in Supplemental Information. Briefly, we found that MS2 analysis using HCD followed by ion trap mass analysis (low-res HCD; 80,626 MS2 events with 33,127 unique PSMs) generated more identifications compared with ion trap CAD with ion trap mass analysis (CAD; 75,973 MS2 events with 31,820 unique PSMs). This is not surprising as HCD tends to offer more random backbone fragmentation and, with the Q-OT-qIT geometry, can be accomplished slightly faster. Operation of the system with an MS1 resolving power setting of 60,000 (@ m/z 200) afforded a 20% increase in detected unique peptides over 15,000 resolving power (supplemental Fig. S1). We conclude the boosted resolving power elevates precursor signal-to-noise (S/N) ratios, allowing for improved selection of low abundance precursors, and can potentially separate otherwise unresolved precursors so that multiple MS2 events can be acquired. Of course, in this scenario such closely spaced precursors would be co-isolated (0.7 m/z isolation width); however, the selected precursor m/z annotated in the MS2 scan would be different and would facilitate identification from a chimeric MS2 scan. Increasing MS1 resolving power above 60,000 did not provide any apparent benefit for increased identifications. Thirty-five milliseconds was the optimal maximum injection time (supplemental Fig. S2). Decreasing the maximum injection time to 30 msec, or increasing it to 45 msec caused a 10% decrease in peptide identifications. We found only slight variations in peptide identifications among dynamic exclusion settings of 30, 45, and 60 s (supplemental Fig. S3). Quadrupole isolation widths from 0.5 to 1.5 m/z were examined, the best results were achieved at a value of 0.7 m/z (supplemental Fig. S4). MS1 and MS2 automatic gain control (AGC) target values of 500,000 and 7000, respectively, produced the maximum number of peptide identifications (supplemental Figs. S5 and S6).
Lysis, Chromatography, and Additives
Yeast cell lysis is a critical step in achieving comprehensive proteome detection and must be executed with care. Detergents, such as SDS, or bead beating are typical approaches for yeast lysis (37–39). The SDS method, used in the Mann yeast studies, has produced excellent results, but requires removal of the detergent before MS sampling. The bead beating method mixes glass beads and yeast cells in a buffer slurry, which is shaken for three, 1–4 min cycles, at 30 hz. This approach, however, can be too gentle to sufficiently lyse the yeast and, in our hands, does not efficiently extract all proteins. We aimed to avoid use of detergents and investigated a more vigorous bead beating procedure. By simply extending the number of cycles to eight (4 min each) we achieved considerably improved results (supplemental Fig. S7). Finally, we note increased identifications when lysates were not cleared of insoluble material. Zubarev and colleagues recently reported similar findings for mammalian cell culture samples (40).
Previous single-shot yeast proteome analyses utilized long capillary LC columns (50 cm) and lengthy gradients (240 min) (25, 40, 41) We aimed to achieve comparable or better coverage using a much shorter gradient (70 min). We found that capillary LC columns of 30 cm packed with 1.7 μm BEH particles (Waters Corporation) operating at flow rates of 350–375 nL/minute offered consistent elution across the one hour gradient. To accommodate this flow rate, a home-built column heater was maintained at a temperature of 60 °C throughout the separation. Sample was loaded directly onto the column to avoid losses.
Recent work by Kuster et al. described that addition of ∼5% DMSO to the mobile phase solvents boosted precursor S/N, providing up to a 20% increase in protein identifications (31, 32). We tested addition of DMSO to our chromatography solvents by comparing the number of yeast peptide and protein identifications obtained over our 70 min gradient either with or without DMSO. In our hands the presence of DMSO increased the average precursor signal, from ∼2.8 × 10⁷ to 4.8 × 10⁷ (arbitrary units) and increased the total ion current by 170% (supplemental Fig. S8). This amplified signal afforded a 9% increase in unique peptide identifications and 5% more proteins. We conclude that DMSO can indeed improve performance, with no apparent downside, and included it for all subsequent experiments.
Whole Yeast Proteome Analysis
To test our supposition that the faster scanning Q-OT-qIT hybrid could deliver comprehensive yeast proteome analysis within ∼1 h, we sequentially analyzed trypsin-digested, yeast cell lysate in quintuplicate. Each replicate began by loading ∼1.4 μg of sample and followed by analysis over a 70 min gradient. Allowing for sample loading, column washing, and equilibration, the five consecutive analyses consumed ∼8 h; however, actual instrument acquisition times were ∼1.3 h per experiment. As anticipated, the Q-OT-qIT hybrid posted a considerable number of scans: on average 13,447 MS1 and 80,460 MS2 events per run. As a point of reference, state-of-the-art analysis in 2003, by Gygi et al., recorded 162,000 MS2 events following 135 h of MS operation. The Q-OT-qIT hybrid delivered this number of scans in two and a half hours! Next, we analyzed the yeast sample on the most recently introduced quadrupole linear ion trap Orbitrap system (i.e. qIT-OT or Orbitrap Elite) using the identical chromatographic conditions (42). That mass spectrometer produced only about a quarter of the MS1 scans, as compared with the Q-OT-qIT (3635), and half the MS2 events (39,447).
Fig. 2 presents a series of MS2 scans acquired by the Q-OT-qIT MS over a 1 s period. In this example, 22 precursors were selected for MS2 analysis from MS1 scan #59,211. All 22 product ion spectra were acquired, individually, within 1 s and are presented in the lower portion of Fig. 2. Nineteen of these 22 scans were mapped to sequence (1% FDR). On database searching, each one hour experiment (Q-OT-qIT system) produced 43,400 (x̄) peptide spectral matches (PSMs) and 34,255 (x̄) peptides with unique amino acid sequences (1% FDR, Table I). Batched analysis of the five experiments yielded 47,624 unique peptides. In each analysis, over half of the 80,460 MS2 scans were mapped to sequence (54%). Despite the swift Q-OT-qIT scan rate (∼20 Hz), we conclude the system routinely delivers spectra of high quality.
Fig. 2.

Overview of Q-OT-qIT scan cycle. At a retention time of 57.88 min scan #59,211, an MS1, was acquired and presented several spectral features for MS2 analysis. Triangles indicate the 22 precursors that were selected for subsequent MS2 sampling—all of which were acquired within 1 s of scan #59,211. 19 of these 22 MS2 spectra were subsequently mapped to sequence.
Table I. Summary of identification results for the quintuplicate one hour yeast proteome experiments using the Q-OT-qIT mass spectrometer. Note SGD stems from the Saccharomyces Genome Database (www.yeastgenome.org).
| Experiment | PSMs | Peptides | Proteins | SGD verified | SGD un-characterized | SGD dubious |
|---|---|---|---|---|---|---|
| 1 | 43,423 | 34,535 | 4002 | 3630 | 337 | 8 |
| 2 | 43,622 | 34,495 | 3966 | 3608 | 331 | 7 |
| 3 | 42,339 | 33,450 | 3959 | 3595 | 334 | 3 |
| 4 | 43,326 | 34,347 | 3968 | 3602 | 337 | 8 |
| 5 | 43,343 | 34,449 | 3991 | 3623 | 341 | 4 |
| Total | 216,256 | 47,624 | 4395 | 3976 | 381 | 16 |
On average, each of the quintuplicate analyses achieved detection of 3,977 proteins (1% FDR), 13.5% (538, x̄) of which originate from single peptides (Fig. 3A). Combination of the data reduces single peptide proteins to 460 while deepening coverage to 4395 protein groups. 3643 of these proteins (83%) were present in all five 1-h experiments and 3853 (88%) were found in four of five (Fig. 3B). Median sequence coverage was 18.4% and 23.7% for the individual and combined experiments, respectively (Fig. 3C), with a median of seven identified peptide sequences per protein. Yeast contains ∼800 dubious ORFs. These ORFs, which are believed not to encode a corresponding protein, are commonly used to verify the FDR of proteomic data sets. For the one hour experiments, between three and eight dubious ORFs were identified per dataset (Table I), confirming these data are indeed well below the 1% FDR threshold.
Fig. 3.

Performance metrics for one hour analysis, performed in quintuplicate, of a yeast trypic digest using the Q-OT-qIT hybrid. On average, 3977 yeast proteins were identified in each experiment (1% FDR) with only 13.5% (538, x̄) originating from single peptide identifications (A). 4395 proteins were detected across all experiments—3643 of which were present in all five one hour experiments (B). C, presents the median sequence coverage for the individual and combined experiments. D, displays the overlap in our identified proteins versus known expression level information derived from published tagging experiments.
To directly contrast the performance of the Q-OT-qIT hybrid to the most recent comprehensive yeast analysis we analyzed the same samples using a 240 min gradient. This longer method mimics the 2012 study of Mann and colleagues (vide infra). With the extended gradient conditions the Q-OT-qIT system identified 46,381 unique peptide sequences corresponding to 4392 protein groups (1% FDR), providing a median sequence coverage of 24.1% (average sequence coverage = 28.0%).
To estimate the dynamic range of the one hour experiments we compared our mass spectrometry-based identifications to those mapped by either tandem affinity (TAP) or green fluorescent protein (GFP) tagging experiments. From our one hour experiment data we identify 89% of proteins for which there is abundance data, including 73% of proteins present at less than 125 copies/cell (Fig. 3D) (9). We also note detection of 886 proteins lacking abundance data. Next, we benchmarked the dynamic range of our global analysis to a recent multiple reaction monitoring (MRM) study. There, Aebersold et al. targeted 152 yeast proteins, spanning the full concentration range including several proteins never observed in public proteomic data sets, using synthetic peptides and triple quadrupole MRM technology (43). A single one hour Q-OT-qIT experiment, batched analysis of all five 1-h experiments, and our four hour analysis netted 122, 133, and 132 of the 152 Aebersold targets, respectively. The Aebersold work detected 137 of these protein targets likely following dozens of MRM experiments. We conclude that our one hour method, using the Q-OT-qIT hybrid, provides dynamic range and sensitivity comparable to state-of-the-art MRM studies, but with whole proteome depth. We also note that the system, with its quadrupole mass filter, offers considerable promise for parallel reaction monitoring (44, 45).
DISCUSSION
The data presented above provides a deep view of the yeast proteome. Equally important is that this depth is achieved within an unprecedented time-scale. To understand how these gains were realized we plotted the number of identified peptide sequences per second as a function of elution time (Fig. 4A) for both the Q-OT-qIT (red) and the previous generation qIT-OT (black) hybrids. Remarkably, this plot reveals that the Q-OT-qIT hybrid (Orbitrap Fusion) routinely identifies ∼8 peptides per second with occasions where up to 19 peptide sequences are detected in a single 1 s window. These stunning metrics are approximately double that achieved by the qIT-OT (Orbitrap Elite). Further, the speed of the Q-OT-qIT allows for deeper MS2 sampling of the MS1. The mean precursor depth sampled by the Q-OT-qIT is the 349th most abundant m/z peak in the MS1 scan whereas the qIT-OT system achieves an average depth of only 202 (Fig. 4B). The Q-OT-qIT frequently samples m/z peaks that are the 800th or weaker in intensity rank.
Fig. 4.

Analytical metrics of yeast proteome analysis using the Q-OT-qIT (Fusion) as compared with qIT-OT (Orbitrap Elite) and Q-OT (Q-Exactive) hybrids. The Q-OT-qIT (panel A, red) achieves identification of up to 19 peptides per second as compared with 10 with the qIT-OT system (A, black). Peak depth is likewise considerably higher on account of the faster MS2 scanning rate of the Q-OT-qIT system (B). C, plots the pace of unique yeast peptide identifications for the three instruments. For the one hour analysis, the Q-OT-qIT posts almost twice as many unique peptide identifications as compared with the qIT-OT. Similar data, except for unique proteins, is shown in D.
To further examine the effect of Q-OT-qIT scan speed we plotted the cumulative number of unique peptide sequence identifications as a function of retention time (Fig. 4C, I/L ambiguity removed). Almost linearly across the 70 min gradient and wash period the Q-OT-qIT (solid red) accumulates unique peptide identifications at a rate considerably faster than the qIT-OT (solid black)—8.3 versus 4.3 unique sequences per second, respectively (linear fit between 10 and 80 min). Use of a four hour gradient on this same system slightly reduces the slope (3.7 unique sequences per second, linear fit between 10 and 200 min, dotted red), but allows for considerably deeper analysis and again outpaces the qIT-OT system (2.3 unique sequences per second, dotted black). For reference we plotted these same data for the 2012 Mann et al. study using the Q-OT hybrid (Q-Exactive, dotted blue). That system posts the shallowest slope (1.7 unique sequences per second) and approximately half the number of unique peptide sequences as compared with the Q-OT-qIT (Orbitrap Fusion) for the same analysis time. Note that Mann used a Lys-C digest in this work. Panel D of Fig. 4 compares unique protein identification rates for the same data sets. Again the Q-OT-qIT system is the top performer, even when comparing the one hour analysis (solid red) to four hour experiments on either of the other systems (dotted black and blue).
Here we described new mass spectrometer technology that is capable of achieving comprehensive yeast proteome coverage within an unprecedented time-scale. Doubtless over the past decade many improvements to sample preparation, chromatography, and MS hardware have contributed to making this achievement possible. Among all these, we attribute increased mass spectrometer scan speed as the primary reason for the acceleration in proteome analysis speed and depth. Fig. 5 illustrates the pace of protein identifications for several large-scale yeast proteomic analyses as a function of the mass spectrometer MS2 scan rate. Note the rapid ascent in protein identification rates scales correlates with increasing MS2 scan rate.
Fig. 5.
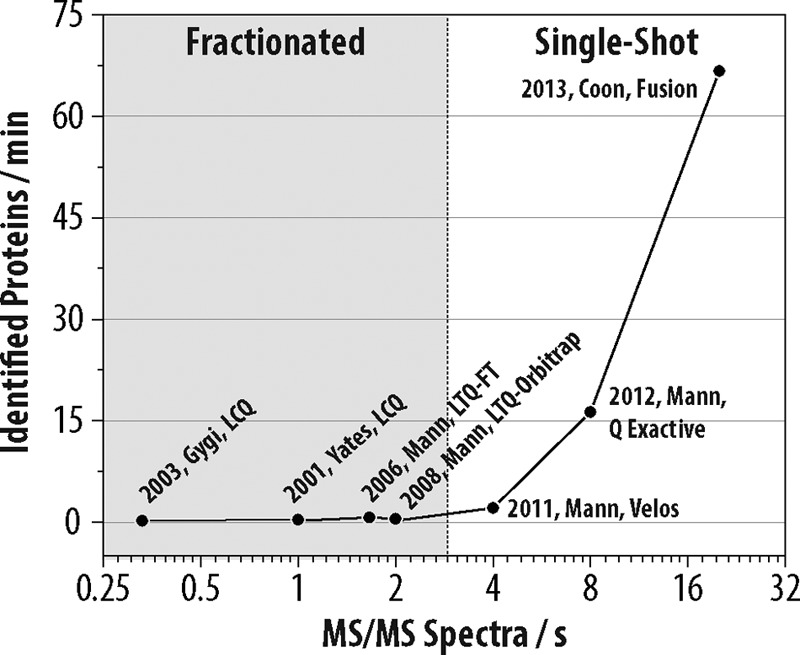
Rate of protein identifications as a function of mass spectrometer scan rate for selected large-scale yeast proteome analyses over the past decade. Each data point is annotated with the year, corresponding author, type of MS system used, and reference number.
The correlation depicted in Fig. 5 was somewhat surprising to us as we expected that ionization suppression of lower abundance peptides would become increasingly dominant as complex peptide mixtures comprising whole proteomes are separated over shorter gradients - i.e. from four to one hour (46, 47). In other words, as the separation duration of the online chromatography is compressed, increased co-elution must occur. With increased co-elution one might expect that, regardless of the MS speed or sensitivity, ionization suppression would prevent a considerable fraction of peptides from becoming gas-phase ions - a requisite for MS detection. The results shown here refute this hypothesis and confirm that further improvements in MS sensitivity and speed will continue to reduce whole proteome analysis time, most likely to less than one hour for relatively simple proteomes like yeast.
Finally, we conclude that comprehensive analysis of mammalian proteomes within several hours is now within our technical reach. Consider that recent estimates suggest between 10,000 and 12,000 proteins are expressed at any given time for human cells in culture (48–50). That is only approximately three to four times the complexity of the yeast proteome. Thus, our current efforts are aimed at achieving comprehensive coverage of mammalian system within just a few hours of analysis. Looking forward, one more doubling of MS2 acquisition rate, i.e. from 20 to 40 Hz, has potential to deliver detection of the whole human proteome in just one to two hours. And, given the history and rate of MS innovation, such capability is likely only a few years away.
Supplementary Material
Acknowledgments
We thank Graeme McAlister, Steve Gygi, Jae Schwartz, John Syka, Jens Griep-Raming, Vlad Zabrouskov, Mike Senko, and Jesse Canterbury for helpful discussions. We are grateful to Anna Merrill for yeast production and for critical reading of the manuscript. We thank Audrey Gasch for assistance with yeast growth.
Footnotes
Author Contributions: A.S.H. and A.L.R. designed, performed research, analyzed data, and wrote the paper; D.J.B. contributed analysis tools, analyzed data and wrote the paper; A.U. and E.E. contributed materials; M.S.W. analyzed data; J.J.C. designed research and wrote the paper.
* This work was supported by the National Institutes of Health (R01 GM080148) and the National Science Foundation (0701846). A.L.R. gratefully acknowledges support from a National Institutes of Health-funded Genomic Sciences Training Program (5T32HG002760).
 This article contains supplemental Figs. S1 to S8.
Data available at ChorusProject.org under project name SingleShot_Fusion or with the following links: https://chorusproject.org/anonymous/download/experiment/-8823069691100997209 and https://chorusproject.org/anonymous/download/experiment/449795368199176159.
1 The abbreviations used are:
- ORF
- open reading frame
- FDR
- false discovery rate
- PSM
- peptide spectral matches
- MRM
- multiple reaction monitoring.
REFERENCES
- 1. Walther T. C., Mann M. (2010) Mass spectrometry–based proteomics in cell biology. J. Cell Biol. 190, 491–500 [DOI] [PMC free article] [PubMed] [Google Scholar]
- 2. Mallick P., Kuster B. (2010) Proteomics: a pragmatic perspective. Nat. Biotechnol. 28, 695–709 [DOI] [PubMed] [Google Scholar]
- 3. Schena M., Shalon D., Davis R. W., Brown P. O. (1995) Quantitative monitoring of gene-expression patterns with a complementary-DNA microarray. Science 270, 467–470 [DOI] [PubMed] [Google Scholar]
- 4. DeRisi J. L., Iyer V. R., Brown P. O. (1997) Exploring the metabolic and genetic control of gene expression on a genomic scale. Science 278, 680–686 [DOI] [PubMed] [Google Scholar]
- 5. Gygi S. P., Rochon Y., Franza B. R., Aebersold R. (1999) Correlation between protein and mRNA abundance in yeast. Mol. Cell. Biol. 19, 1720–1730 [DOI] [PMC free article] [PubMed] [Google Scholar]
- 6. Grimsrud P. A., Swaney D. L., Wenger C. D., Beauchene N. A., Coon J. J. (2010) Phosphoproteomics for the Masses. Chem. Biol. 5, 105–119 [DOI] [PMC free article] [PubMed] [Google Scholar]
- 7. Hebert Alexander S., Dittenhafer-Reed Kristin E., Yu W., Bailey Derek J., Selen Ebru S., Boersma Melissa D., Carson Joshua J., Tonelli M., Balloon Allison J., Higbee Alan J., Westphall Michael S., Pagliarini David J., Prolla Tomas A., Assadi-Porter F., Roy S., Denu John M., Coon Joshua J. (2013) Calorie restriction and sirt3 trigger global reprogramming of the mitochondrial protein acetylome. Mol. Cell 49, 186–199 [DOI] [PMC free article] [PubMed] [Google Scholar]
- 8. Cherry J. M., Hong E. L., Amundsen C., Balakrishnan R., Binkley G., Chan E. T., Christie K. R., Costanzo M. C., Dwight S. S., Engel S. R., Fisk D. G., Hirschman J. E., Hitz B. C., Karra K., Krieger C. J., Miyasato S. R., Nash R. S., Park J., Skrzypek M. S., Simison M., Weng S., Wong E. D. (2012) Saccharomyces Genome Database: the genomics resource of budding yeast. Nucleic Acids Res. 40, D700–D705 [DOI] [PMC free article] [PubMed] [Google Scholar]
- 9. Ghaemmaghami S., Huh W.-K., Bower K., Howson R. W., Belle A., Dephoure N., O'Shea E. K., Weissman J. S. (2003) Global analysis of protein expression in yeast. Nature 425, 737–741 [DOI] [PubMed] [Google Scholar]
- 10. de Godoy L. M. F., Olsen J. V., Cox J., Nielsen M. L., Hubner N. C., Frohlich F., Walther T. C., Mann M. (2008) Comprehensive mass-spectrometry-based proteome quantification of haploid versus diploid yeast. Nature 455, 1251–1254 [DOI] [PubMed] [Google Scholar]
- 11. Wu R., Dephoure N., Haas W., Huttlin E. L., Zhai B., Sowa M. E., Gygi S. P. (2011) Correct Interpretation of Comprehensive Phosphorylation Dynamics Requires Normalization by Protein Expression Changes. Mol. Cell. Proteomics 10, M111.009654. [DOI] [PMC free article] [PubMed] [Google Scholar]
- 12. Webb K. J., Xu T., Park S. K., Yates J. R. (2013) Modified MuDPIT separation identified 4488 proteins in a system-wide analysis of quiescence in yeast. J. Proteome Res. 12, 2177–2184 [DOI] [PMC free article] [PubMed] [Google Scholar]
- 13. Merriam-Webster's Dictionary 2004, 11th Ed [Google Scholar]
- 14. Figeys D., Ducret A., Yates J. R., Aebersold R. (1996) Protein identification by solid phase microextraction[mdash]capillary zone electrophoresis[mdash]microelectrospray[mdash]tandem mass spectrometry. Nat Biotech 14, 1579–1583 [DOI] [PubMed] [Google Scholar]
- 15. Shevchenko A., Jensen O. N., Podtelejnikov A. V., Sagliocco F., Wilm M., Vorm O., Mortensen P., Shevchenko A., Boucherie H., Mann M. (1996) Linking genome and proteome by mass spectrometry: Large-scale identification of yeast proteins from two dimensional gels. Proc. Natl. Acad. Sci. U. S. A. 93, 14440–14445 [DOI] [PMC free article] [PubMed] [Google Scholar]
- 16. Link A. J., Eng J., Schieltz D. M., Carmack E., Mize G. J., Morris D. R., Garvik B. M., Yates J. R. (1999) Direct analysis of protein complexes using mass spectrometry. Nat. Biotech. 17, 676–682 [DOI] [PubMed] [Google Scholar]
- 17. Washburn M. P., Wolters D., Yates J. R. (2001) Large-scale analysis of the yeast proteome by multidimensional protein identification technology. Nat. Biotech. 19, 242–247 [DOI] [PubMed] [Google Scholar]
- 18. Beausoleil S. A., Jedrychowski M., Schwartz D., Elias J. E., Villen J., Li J. X., Cohn M. A., Cantley L. C., Gygi S. P. (2004) Large-scale characterization of HeLa cell nuclear phosphoproteins. Proc. Natl. Acad. Sci. U.S.A. 101, 12130–12135 [DOI] [PMC free article] [PubMed] [Google Scholar]
- 19. Zanivan S., Gnad F., Wickstrom S. A., Geiger T., Macek B., Cox J., Fassler R., Mann M. (2008) Solid tumor proteome and phosphoproteome analysis by high resolution mass spectrometry. J. Proteome Res. 7, 5314–5326 [DOI] [PubMed] [Google Scholar]
- 20. Ledvina A. R., Beauchene N. A., McAlister G. C., Syka J. E. P., Schwartz J. C., Griep-Raming J., Westphall M. S., Coon J. J. (2010) Activated-ion electron transfer dissociation improves the ability of electron transfer dissociation to identify peptides in a complex mixture. Anal. Chem. 82, 10068–10074 [DOI] [PMC free article] [PubMed] [Google Scholar]
- 21. Peng J., Elias J. E., Thoreen C. C., Licklider L. J., Gygi S. P. (2002) Evaluation of multidimensional chromatography coupled with tandem mass spectrometry (LC/LC-MS/MS) for large-scale protein analysis: the yeast proteome. J. Proteome Res. 2, 43–50 [DOI] [PubMed] [Google Scholar]
- 22. de Godoy L. M. F., Olsen J. V., de Souza G. A., Li G. Q., Mortensen P., Mann M. (2006) Status of complete proteome analysis by mass spectrometry: SILAC labeled yeast as a model system. Genome Biol. 7, R50. [DOI] [PMC free article] [PubMed] [Google Scholar]
- 23. Syka J. E. P., Marto J. A., Bai D. L., Horning S., Senko M. W., Schwartz J. C., Ueberheide B., Garcia B., Busby S., Muratore T., Shabanowitz J., Hunt D. F. (2004) Novel linear quadrupole ion trap/FT mass spectrometer: Performance characterization and use in the comparative analysis of histone H3 post-translational modifications. J. Proteome Res. 3, 621–626 [DOI] [PubMed] [Google Scholar]
- 24. Swaney D. L., Wenger C. D., Coon J. J. (2010) Value of using multiple proteases for large-scale mass spectrometry-based proteomics. J. Proteome Res. 9, 1323–1329 [DOI] [PMC free article] [PubMed] [Google Scholar]
- 25. Nagaraj N., Alexander Kulak N., Cox J., Neuhauser N., Mayr K., Hoerning O., Vorm O., Mann M. (2012) System-wide perturbation analysis with nearly complete coverage of the yeast proteome by single-shot ultra HPLC runs on a bench top orbitrap. Mol. Cell. Proteomics 11, M111.013722. [DOI] [PMC free article] [PubMed] [Google Scholar]
- 26. Andrews G. L., Simons B. L., Young J. B., Hawkridge A. M., Muddiman D. C. (2011) Performance Characteristics of a New Hybrid Quadrupole Time-of-Flight Tandem Mass Spectrometer (TripleTOF 5600). Anal. Chem. 83, 5442–5446 [DOI] [PMC free article] [PubMed] [Google Scholar]
- 27. Cristobal A., Hennrich M. L., Giansanti P., Goerdayal S. S., Heck A. J. R., Mohammed S. (2012) In-house construction of a UHPLC system enabling the identification of over 4000 protein groups in a single analysis. Analyst 137, 3541–3548 [DOI] [PubMed] [Google Scholar]
- 28. Geromanos S., Hughes C., Ciavarini S., Vissers J. C., Langridge J. (2012) Using ion purity scores for enhancing quantitative accuracy and precision in complex proteomics samples. Anal. Bioanal. Chem. 404, 1127–1139 [DOI] [PubMed] [Google Scholar]
- 29. Senko M. W., Remes P., Song Q., Canterbury J., Blethrow J., Zabrouskov V., Lange O., Makarov A. (2013) Improving data dependent MSn Performance with a Multitasking Mass Spectrometer. Proceedings of the 61ST ASMS Conference on Mass Spectrometry, Minneapolis, MN, American Society for Mass Spectrometry [Google Scholar]
- 30. Senko M., Remes P., Canterbury J., Mathur R., Song Q., Eliuk S., Mullen C., Earley L., Hardman H., Blethrow J., Bui H., Specht A., Lange O., Denisov E., Makarov A., Horning S., Zabrouskov V. Novel parallelized quadrupole/linear ion trap/orbitrap tribrid mass spectrometer improves proteome coverage and peptide identification rates. Analytical Chemistry [DOI] [PubMed] [Google Scholar]
- 31. Meyer J., A. Komives E. (2012) Charge state coalescence during electrospray ionization improves peptide identification by tandem mass spectrometry. J. Am. Soc. Mass Spectrom. 23, 1390–1399 [DOI] [PMC free article] [PubMed] [Google Scholar]
- 32. Hahne H., Pachl F., Ruprecht B., Maier S. K., Klaeger S., Helm D., Medard G., Wilm M., Lemeer S., Kuster B. (2013) DMSO enhances electrospray response, boosting sensitivity of proteomic experiments. Nat. Meth. 10, 989–991 [DOI] [PubMed] [Google Scholar]
- 33. Eng J. K., McCormack A. L., Yates Iii J. R. (1994) An approach to correlate tandem mass spectral data of peptides with amino acid sequences in a protein database. J. Am. Soc. Mass Spectrom. 5, 976–989 [DOI] [PubMed] [Google Scholar]
- 34. Brosch M., Yu L., Hubbard T., Choudhary J. (2009) Accurate and Sensitive Peptide Identification with Mascot Percolator. J. Proteome Res. 8, 3176–3181 [DOI] [PMC free article] [PubMed] [Google Scholar]
- 35. Nesvizhskii A. I., Aebersold R. (2005) Interpretation of shotgun proteomic data: the protein inference problem. Mol. Cell. Proteomics 4, 1419–1440 [DOI] [PubMed] [Google Scholar]
- 36. Wenger C. D., Phanstiel D. H., Lee M. V., Bailey D. J., Coon J. J. (2011) COMPASS: A suite of pre- and post-search proteomics software tools for OMSSA. Proteomics 11, 1064–1074 [DOI] [PMC free article] [PubMed] [Google Scholar]
- 37. Wisniewski J. R., Zougman A., Nagaraj N., Mann M. (2009) Universal sample preparation method for proteome analysis. Nat. Meth. 6, 359–362 [DOI] [PubMed] [Google Scholar]
- 38. Dephoure N., Gygi S. P. (2012) Hyperplexing: A method for higher-order multiplexed quantitative proteomics provides a map of the dynamic response to rapamycin in yeast. Sci. Signal. 5, rs2-rs-52 [DOI] [PMC free article] [PubMed] [Google Scholar]
- 39. Hebert A. S., Merrill A. E., Bailey D. J., Still A. J., Westphall M. S., Strieter E. R., Pagliarini D. J., Coon J. J. (2013) Neutron-encoded mass signatures for multiplexed proteome quantification. Nat. Meth. 10, 332–334 [DOI] [PMC free article] [PubMed] [Google Scholar]
- 40. Pirmoradian M., Budamgunta H., Chingin K., Zhang B., Astorga-Wells J., Zubarev R. A. (2013) Rapid and deep human proteome analysis by single-dimension shotgun proteomics. Mol. Cell. Proteomics 12, 3330–3338 [DOI] [PMC free article] [PubMed] [Google Scholar]
- 41. Thakur S. S., Geiger T., Chatterjee B., Bandilla P., Frohlich F., Cox J., Mann M. (2011) Deep and highly sensitive proteome coverage by LC-MS/MS without prefractionation. Mol. Cell. Proteomics 10, M110.003699. [DOI] [PMC free article] [PubMed] [Google Scholar]
- 42. Michalski A., Damoc E., Lange O., Denisov E., Nolting D., Müller M., Viner R., Schwartz J., Remes P., Belford M., Dunyach J.-J., Cox J., Horning S., Mann M., Makarov A. (2012) Ultra high resolution linear ion trap orbitrap mass spectrometer (Orbitrap Elite) facilitates top down LC MS/MS and versatile peptide fragmentation modes. Mol. Cell. Proteomics 11, O111.013698. [DOI] [PMC free article] [PubMed] [Google Scholar]
- 43. Picotti P., Bodenmiller B., Mueller L. N., Domon B., Aebersold R. (2009) Full dynamic range proteome analysis of S. cerevisiae by targeted proteomics. Cell 138, 795–806 [DOI] [PMC free article] [PubMed] [Google Scholar]
- 44. Peterson A. C., Russell J. D., Bailey D. J., Westphall M. S., Coon J. J. (2012) Parallel reaction monitoring for high resolution and high mass accuracy quantitative, targeted proteomics. Mol. Cell. Proteomics 11, 1475–1488 [DOI] [PMC free article] [PubMed] [Google Scholar]
- 45. Gallien S., Duriez E., Crone C., Kellmann M., Moehring T., Domon B. (2012) Targeted proteomic quantification on quadrupole-orbitrap mass spectrometer. Mol. Cell. Proteomics 11, 1709–1728 [DOI] [PMC free article] [PubMed] [Google Scholar]
- 46. King R., Bonfiglio R., Fernandez-Metzler C., Miller-Stein C., Olah T. (2000) Mechanistic investigation of ionization suppression in electrospray ionization. J. Am. Soc. Mass Spectrom. 11, 942–950 [DOI] [PubMed] [Google Scholar]
- 47. Annesley T. M. (2003) Ion suppression in mass spectrometry. Clin. Chem. 49, 1041–1044 [DOI] [PubMed] [Google Scholar]
- 48. Beck M., Schmidt A., Malmstroem J., Claassen M., Ori A., Szymborska A., Herzog F., Rinner O., Ellenberg J., Aebersold R. (2011) The quantitative proteome of a human cell line. Mol. Syst. Biol. 7, 549. [DOI] [PMC free article] [PubMed] [Google Scholar]
- 49. Nagaraj N., Wisniewski J. R., Geiger T., Cox J., Kircher M., Kelso J., Paabo S., Mann M. (2011) Deep proteome and transcriptome mapping of a human cancer cell line. Mol. Syst. Biol. 7, 548. [DOI] [PMC free article] [PubMed] [Google Scholar]
- 50. Mann M., Kulak Nils A., Nagaraj N., Cox J. (2013) The coming age of complete, accurate, and ubiquitous proteomes. Mol. Cell 49, 583–590 [DOI] [PubMed] [Google Scholar]
Associated Data
This section collects any data citations, data availability statements, or supplementary materials included in this article.