Abstract
Many types of cancer and neurodegenerative diseases are caused by abnormalities and variations in the genome. We have designed a high-resolution imaging technique with high throughput and low cost for determining structural variations of genes related to genetic diseases. We initially mapped all seven nicking sites of Nb.BbvCI endonuclease enzyme on lambda DNA. Then we resolved densely labeled patterns of 107 nicking sites on human BAC DNA that is digested by Nb.BsmI and Nb.BbvCI endonuclease enzymes. This high density resulted in several dyes being closer together than the diffraction limit. Overall, detailed DNA nicking sites mapping with 100bp resolution was achieved, which has the potential to reveal information about genetic variance and to facilitate medical diagnosis of several genetic diseases.
Keywords: Super-resolution, optical DNA mapping, genomic variations, copy-number variations, SHRImP, SHREC, DNA
It has become increasingly apparent that structural variation plays an important role in human health and common diseases.1,2 In general, these variations are defined as being longer than 500bp.3,4 Despite their importance, most genome-wide approaches for detecting copy number variations (CNVs) are indirect, depending on signal intensity differences between samples and controls to predict regions of variation in DNA. They therefore provide limited quantitative signal and positional information and cannot detect balanced events such as inversions and translocations. Nonuniform sensitivity, specificity, and probe density of these platforms often lead to conflicting results even with identical samples.5,6 This qualitative measurement requires further validation by low throughput detection methods, such as PCR and FISH.
Physical mapping of long single DNA molecules, either by using gaps generated by digestion with restriction endonu-cleases,7 or using fluorescent tags bound to specific sequence-motif sites as landmarks,8,9 has provided new ways for comparatively rapid and direct whole-genome characterization and visualization for structural variation studies. However, due to the optical nature of the mapping, they are limited in their ability to resolve motifs that are closer than about ~1.5kbp.9 This generally requires selecting restriction site frequencies of at least 10kb per site to avoid significant portions of genome with stretches of unresolvable sites being left out. The method described elsewhere by Ming Xiao and colleagues and being commercialized by BioNano Genomics overcomes some of these limitations by constraining DNA in nanochannels, allowing for more uniform and consistent measurement of single- or multicolor labeling and targeted hybridization-based labeling.11,33 These demonstrations of genome mapping using nanochannels confirmed the method’s sub-2kb resolution and ability to detect sub-100kb CNVs. Improving resolution further, for example, down to 100bp, would have advantages for detecting even smaller structural variation and increasing the information density of the output.
In this study, we describe a DNA mapping method based on localization of multiple sequence-motifs with 100bp resolution. We achieve this by employing two super-resolution techniques, both of which have been shown to have 10 nm resolution on DNA (and other samples).10,11 Specifically, they are two-color SHRImP (Single molecule-High Resolution Imaging with Photobleaching), and two-color SHREC (Single-molecule High-Resolution Co-localization), both corrected for chromatic aberration. SHRImP resolves adjacent fluorophores of the same color by using the quantal photobleaching behavior of single fluorescent dye molecules. SHREC uses two chromatically different fluorophores and images them with high-resolution in separate channels by using a dual-view system. Both SHRImP and SHREC can be extended to three or more dyes. Using more colors will increase the number of resolved distances between individual molecules.
We successfully generated two color sequence-motif maps of 180kb BAC clones (GCTGAGG and GCTCTTC) at 100bp resolution.
Demonstration of One and Two Color SHRImP and SHREC Imaging
A 741bp dsDNA template was constructed by PCR with one Cy3 labeled primer (Figure 1a) at the 5′ end. Additional Cy3 fluorophores were introduced at specific locations 94bp and 172bp from the 5′ end by nick-labeling.10,11 After stretching and linearizing DNA on a glass surface, we applied SHRImP and measured distances between dyes. Our measured distances were 27, 61, and 95 nm, which are in good agreement with the expected distances between Cy3 dyes of 32 nm (94bp), 58 nm (172bp), and 90 nm (266bp) (Figure 1b). The results also demonstrate that three fluorophores of the same color can be imaged in SHRImP simultaneously.
Figure 1.
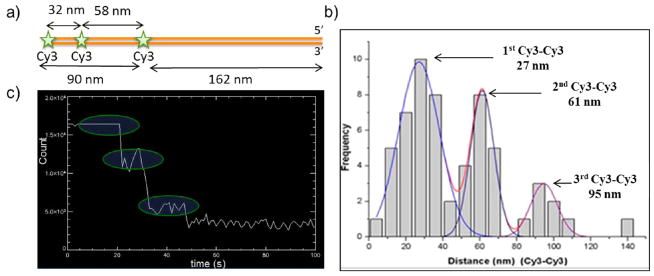
(a) Diagram of a DNA molecule with 3 Cy3 dyes to test the SHRImP method (b) Histogram of SHRImP distances between Cy3 dyes shows that the 3 distances between Cy3 pairs are 27, 61, and 95 nm, which are in good agreement with expected distances. (c) Three step photobleaching of the sample.
To test the feasibility of simultaneously using SHRImP and SHREC, a similar 741bp dsDNA model system was constructed with a Cy5 labeled PCR primer at the 5′ end and two Cy3 molecules, at positions 32 nm (94bp) and 58 nm (172bp) from the Cy5 (Figure 2a). The positions of the dyes were localized using a dual-view imaging system as described in the methods. The distances between the two Cy3-Cy5 pairs were determined to be 34 ± 1 nm (32 nm expected) and 88 ± 1 nm (90 nm expected). The distance between the Cy3-Cy3 pair was 56 ± 2 nm (58 nm expected) (Figure 2b). This demonstrated that the combination of SHRImP and SHREC can resolve the distances beyond the diffraction limit between multiple fluorophores of different colors.
Figure 2.
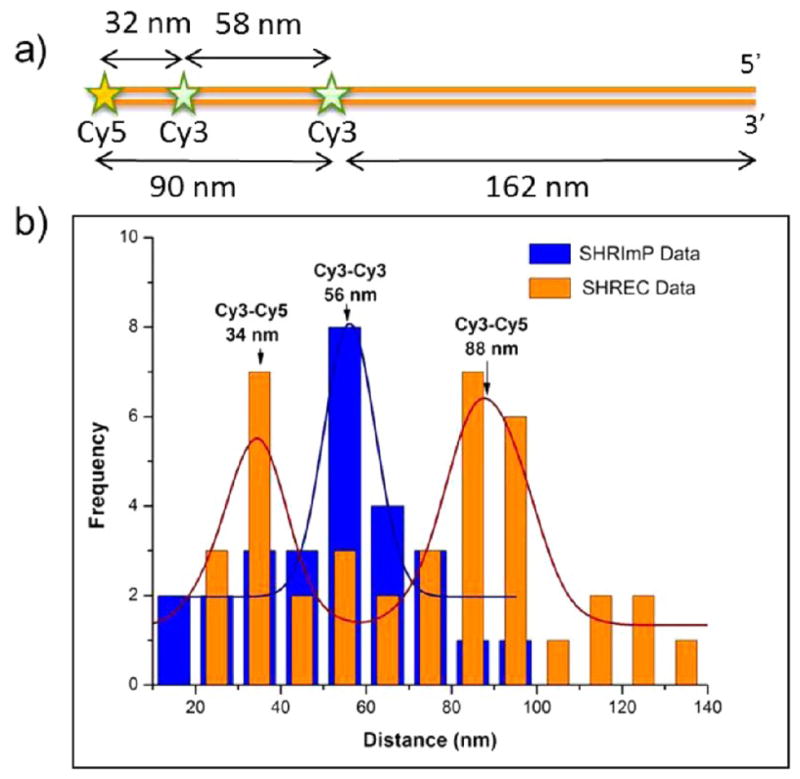
(a) Diagram of a DNA molecule that has Cy5-Cy3-Cy3 dyes on it. (b) Combined histogram of SHREC (red) and SHRImP (blue) analysis indicates that SHRImP distance between two Cy3 dye molecules is 56 nm, and two SHREC distances between Cy5-Cy3 molecules is 34 and 88 nm.
One Color Super-Resolution DNA Mapping
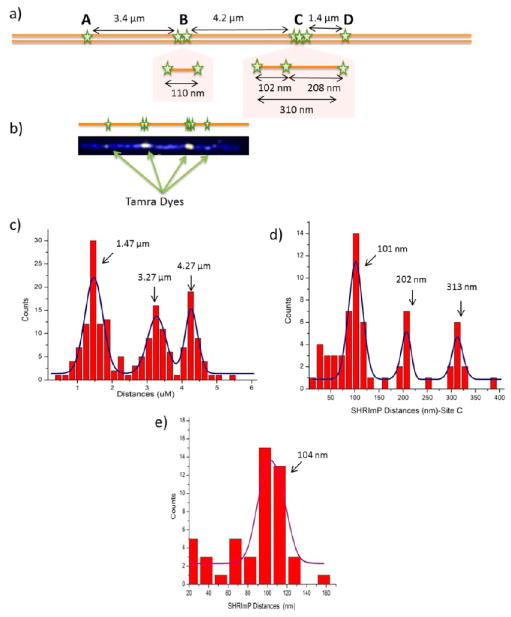
Lambda DNA (48.5kb) was nick-labeled using Nb.BbvCI and Tamra-ddUTP, which has seven nicking sites along each molecule. In a previous study by Xiao et al., four sites were resolved.9 The two nicking sites clustered at location B (Figure 3a) and three nicking sites clustered at location C (Figure 3a) could not be resolved as containing multiple sites due to their close proximity within the diffraction limit. The seven nicking sites are reduced to four resolvable locations and distances are measured as in Figure 3c with 1.47, 3.27, and 4.27 μm respectively, which are in good agreement with expected distances.
Figure 3.
Resolving the Lambda DNA nicking pattern. (a) Lambda DNA nicking pattern by the enzyme Nb.BbvCI. Green stars show the expected location of labeled nicked sites. Site-B has two dyes and Site-C has three dyes in diffraction limited spots (b) an image of Tamra labeled nicking sites on YOYO stained Lambda DNA backbone. (c) Histogram of non-SHRImP distances. Peaks are at 1.47, 3.27, and 4.27 μm, which are close to the expected distances. (d) Histogram of SHRImP distances for site-C that has three peaks at 101, 202 and 312 nm, which is in good agreement with the expected distances of 104, 209, and 313 nm. (e) Histogram of SHRImP distances for site-B which has a peak at 104 nm that is also close to the expected distance of 110 nm.
Using SHRImP, the clustered sites at B and C can be clearly resolved. Figure 3d shows the distances between the two nicking sites at the B location to be 104 nm, which agrees well with 108 nm (318bp) predicted distance. The distances between three clustered nicking sites at location C are also resolved to be 101, 202, and 313 nm, which are in close agreement with expected distances of 102, 208, and 310 nm (Figure 3c).
Two Color Super-Resolution DNA Mapping
Nicking sequence-motifs for Nb.BsmI and Nb.BbvCI occur on average every 2kb across the human genome. With the resolution of regular fluorescent microscopy, many of the sites within 2kb would not be resolved with even two-color labeling of both motifs. Here we applied DNA-mapping with two-color super-resolution techniques and constructed a Nb.BsmI and Nb.BbvCI sequence-motif map of a 180kb BAC clone containing human sequence. Nb.BsmI has 71 recognition sequences (GCATTC) and Nb.BbvCI has 36 recognition sequences (GCTGAGG) across the 180kb BAC clone.
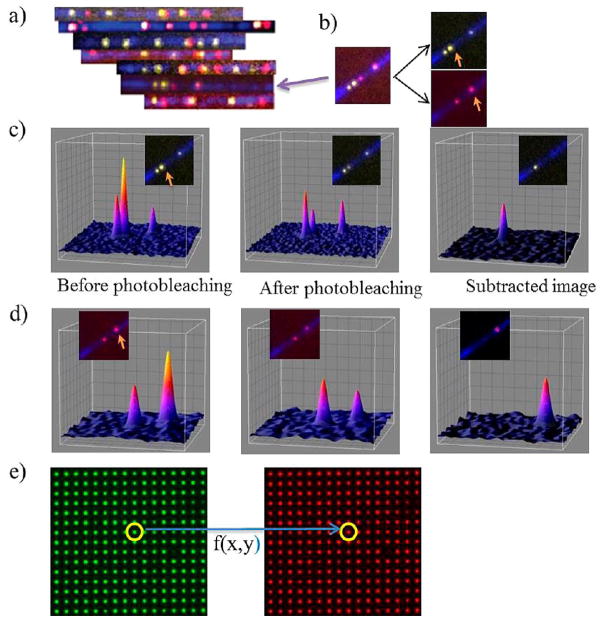
Figure 4 shows nick-labeling of Nb.BsmI sites with the green dye Tamra and Nb.BbvCI sites with the red dye Cy5. The DNA backbone is stained with YOYO-1. Three-color images were generated by using sequential excitation of Tamra (at 532 nm), Cy5 (at 642 nm), and YoYo-1 (at 488 nm). A few typical overlapping DNA fragments are shown in Figure 4a. The distances between each neighboring spot of the same color are then calculated separately by using SHRImP analysis (Figure 4b–d). To correlate the red and green channel with minimal chromatic aberration, Tamra and Cy5 labeled sites were analyzed together by using SHREC analysis. For this, both Tamra and Cy5 channels were merged after making chromatic aberration correction by using nanoholes as fiduciary marker, which are 100 nm in diameter and 1.5 μm apart (Figure 4e). The color spatial-correlation function was created for each image frame based on the nanohole fiduciary; this color correlation function has 5 nm resolution. By using the color correlation function, all Cy5 spots were mapped to the Tamra channel. A true two-color super-resolution image was created with minimum chromatic aberration. Each DNA fragment was then mapped to the BAC clone reference sequences.
Figure 4.
Two-color super-resolution imaging of DNA molecules. (a) Diffraction limited imaging of BAC DNA fragments. DNA backbone is shown in blue (YOYO-1 staining). Nb.BsmI nicking sites are in yellow and Nb.BbvCI sites are in red. DNA fragments are rotated to be aligned with all others based on the nicking pattern. (b) Image of a single DNA fragment (the fragment on panel a shown with an arrow). The image on the left is the superposition of the green and red images on the right. Excitations in the green and red channels are done alternatively. Arrows show SHRImP spots in each channel. (c) Gaussian profiles of spots in the green channel on the DNA fragment. Colors in the profiles shows varying intensities (blue to yellow is low to high intensities). The graph includes Gaussian profiles of the SHRImP spot (shown with arrow) before and after photobleaching (first and second graph). Third graph is the Gaussian profile of the second dye on the SHRImP spot. It is found by subtracting spot’s intensity profile after photobleaching from that of before photobleaching (d) Gaussian profiles of dyes on the red channel on the same DNA fragment. Spot shown with arrow is a SHRImP spot. Gaussian profiles of the spot with before and after photobleaching are shown in first two graphs. Third one is Gaussian profile of the second dye on the SHRImP spot. (e) Fiduciary markers, which are 100 nm in diameter and 1.5 μm apart from each other, are used to map the green channel onto red channel to perform SHREC analysis. Alternating images of the fiduciary marker are taken in green and red channels. Then, a mapping matrix is produced by localization of every spot on the illumination area according to the algorithm in Goshtasby et al.12,13
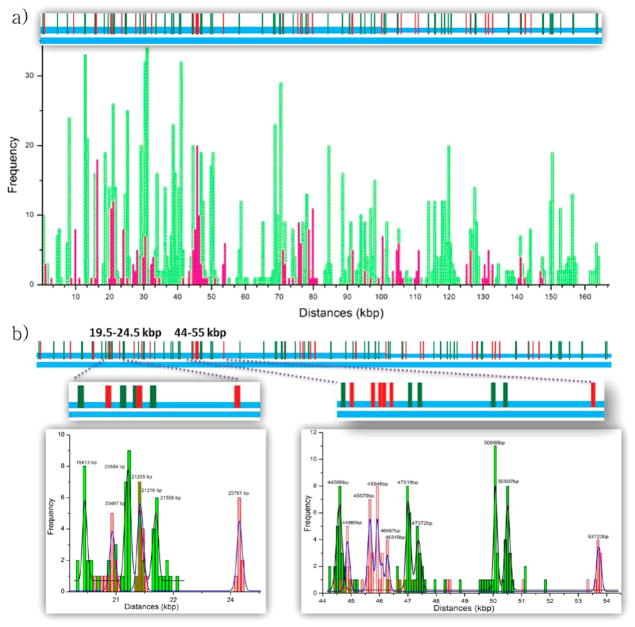
The predicted sequence-motif map was generated using the reference sequence as shown in the top graph of Figure 5a. The experimentally derived histogram of the sequence-motif map is shown in the bottom graph of Figure 5a. The histogram is created with bin sizes of 200 nm (diffraction limit) by using over 1000 DNA fragments and its range covers the whole BAC length. Overall, one-third of the DNA fragments were used in the final map. Unused DNA fragments are mostly under-stretched or overstretched fragments judging by the uneven backbone stain. Experimentally localized nick-labels for Tamra and Cy5 dyes are shown in green and red, respectively. The experimental map agrees well with the reference sequence map (Figure 5a). The peak height of each individual peak correlates well with the density of the nicking sites. More dense regions have higher peaks than other regions. Figure 5b shows two different regions analyzed with two-color SHRImP analysis. One region covers from 44kb (15 μm) to 54kb (18.5 μm). There are five Nb.BsmI sites labeled with Tamra and six Nb.BbvCI sites labeled with Cy5. The closest distance measured between the same color (same sequence-motif) and different colors (different sequence-motif) are 134bp (46 nm) and 313bp (106 nm), respectively. This agrees well with the reference sequences. The other region shown in Figure 5b covers from 19kb to 24kb; in this region, all four Nb.BsmI and three Nb.BbvCI nicking sites were resolved at their expected locations.
Figure 5.
BAC DNA mapping with two-color SHRImP analysis. (a) Locations of experimentally determined nicking sites on BAC DNA are shown above the histogram. DNA was nicked by Nb.BsmI at 71 locations (labeled by Tamra dyes) and by Nb.BbvCI at 35 locations (labeled by Cy5 dyes). The histogram is created with bin sizes of 200 nm. Experimentally located nicking sites for Tamra and Cy5 dyes are shown with green and red bars, respectively. (b) The histogram on the left shows the region from 19.5kb to 24.5kb in which four Tamra and three Cy5 labeled sites are resolved as expected. The histogram on the right has 11 nicking sites and covers an 11kb region from 44kb to 55kb. Five Tamra and six Cy5 labeled sites are resolved with two-color SHRImP in expected locations.
Out of a total 107 Nb.BsmI and Nb.BbvCI sites, the super-resolution map resolves 91 sites compared to 65 sites with regular DNA mapping of 2kb resolution. Some of the sites could not be resolved due to the 30 nm resolution limitation as well as having more than two dyes within the diffraction limit. Supporting Information Table S1 shows the complete super-resolution map.
The full super-resolution two-color sequence-motif map with SHREC analysis is also shown in the Supporting Information Figure S4.
Discussion
Despite recent advances in next-generation sequencing technologies, de novo genome assembly, structural variant, and haplotype analysis using “short read” shotgun sequencing remain challenging. Consequently, most medical resequencing projects rely on mapping the sequencing data to the reference human genome sequence to identify sequences and variants of clinical relevance.14 One approach to address the sequence assembly challenge is optical mapping, an approach pioneered by David Schwartz and colleagues. Optical mapping has been used to construct ordered restriction sites for whole genomes and has proven to be useful in providing scaffolds for shotgun sequence assembly and validation.7,15–20 However, the information content and mapping capabilities are limited by low resolution and use of only a single restriction enzyme.18 The resolution of optical mapping is traditionally limited by the optical resolution (diffraction limit). Small fragments, or neighboring motif sites below 2kb, are hard to measure,9,11,18 resulting in false negatives. Additionally, optical mapping is limited in practical use by low throughput, imprecise DNA length measurement, and high error rates.
Genome mapping using nanochannel technology overcomes some of these limitations by uniform stretching and linearization of the DNA molecules in solution for multiple cycles of imaging, and permitting multienzyme multicolor measurements (unpublished data). Such new genome mapping methods are now enabling numerous analyses in complex genomes, allowing visualization of a significantly larger portion of genomic variation than previously possible. Further improvements in resolution would further increase the information content and decrease the possibility of desert regions in some genomes (genomic regions without sequence-motifs) and also permit the ability of detecting genomic features smaller than CNVs as commonly defined.
We have shown here a multicolor super-resolution DNA mapping method, which provides more detailed DNA sequence information. Single color SHRImP can measure up to three dyes21,22 within the diffraction limit. The two-color SHRImP method is shown to perform as efficiently as single-color SHRImP. To correlate the two color channels for precise distance measurement, we developed a modified SHREC procedure with a nanohole fiduciary marker to minimize the chromatic aberration. The accuracy between different colors reaches 30 nm (100bp). Super-resolution DNA mapping provides significantly higher uniqueness when compared to existing optical DNA mapping technologies for a given molecule length because more dense sequence-motif information can be obtained. This not only helps in de novo sequence assembly and physical map generation, since smaller contigs and less overlap between molecules is needed, it also reduces the current requirement for sample preparation of extremely long DNA molecules. Moreover, the method can potentially generate sequence-motif maps for damaged DNA samples, such as paraffin embedded (FFPE) samples.
In our two-color nick-labeling scheme, the high specificity for sequence recognition is determined by both the enzymatic nicking reaction and the fluorescent nucleotide incorporation reaction. More colors could be incorporated with additional nicking-endonucleases or in combination with other DNA labeling schemes (e.g., polyamides, Bis-PNA, methyltransferase23–25). Using photoswitchable dyes could further increase the labeling density, though it would require a different dsDNA labeling chemistry if STORM like pairs Cy3-Cy526,27 are used. Other photoswitching dyes may also be used.28,29 Improved labeling technologies together with the advance of multicolor super-resolution imaging techniques can provide a DNA sequence-motif map of unprecedented detail. This map can be used to resolve smaller genetic variations over long distances, helping to resolve haplotypes, and can approach sequencing resolution.
Supplementary Material
Acknowledgments
This work in part was supported by NIH 068625 and NSF DBI-02-15869 and 082265 (P.R.S.); NIH R01-HG005946 (P. K., M.X.). We would also like to acknowledge support from the Network for Computational Nanotechnology at Illinois and nanohub.org. Preparation of silver nanoholes was carried out in part in the Frederick Seitz Materials Research Laboratory Central Facilities, University of Illinois.
Footnotes
The authors declare no competing financial interest.
ASSOCIATED CONTENT
Detailed descriptions of materials and methods, figures, and information on algorithms. References 12, 13, and 30–32 appear in the Supporting Information. This material is available free of charge via the Internet at http://pubs.acs.org.
References
- 1.Gonzalez E, Kulkarni H, Bolivar H, Mangano A, Sanchez R, Catano G, Nibbs RJ, Freedman BI, Quinones MP, Bamshad MJ, Murthy KK, Rovin BH, Bradley W, Clark RA, Anderson SA, O’connell RJ, Agan BK, Ahuja SS, Bologna R, Sen L, Dolan MJ, Ahuja SK. Science. 2005;307:1434–1440. doi: 10.1126/science.1101160. [DOI] [PubMed] [Google Scholar]
- 2.Hollox EJ, Huffmeier U, Zeeuwen PLJM, Palla R, Lascorz J, Rodijk-Olthuis D, van de Kerkhof PCM, Traupe H, de Jongh G, den Heijer M, Reis A, Armour JAL, Schalkwijk J. Nat Genet. 2008;40:23–25. doi: 10.1038/ng.2007.48. [DOI] [PMC free article] [PubMed] [Google Scholar]
- 3.Sebat J, Lakshmi B, Troge J, Alexander J, Young J, Lundin P, Månér S, Massa H, Walker M, Chi M, Navin N, Lucito R, Healy J, Hicks J, Ye K, Reiner A, Gilliam TC, Trask B, Patterson N, Zetterberg A, Wigler M. Science. 2004;305:525–528. doi: 10.1126/science.1098918. [DOI] [PubMed] [Google Scholar]
- 4.Wong KK, deLeeuw RJ, Dosanjh NS, Kimm LR, Cheng Z, Horsman DE, MacAulay C, Ng RT, Brown CJ, Eichler EE, Lam WL. Am J Hum Genet. 2007;80:91–104. doi: 10.1086/510560. [DOI] [PMC free article] [PubMed] [Google Scholar]
- 5.Conrad DF, Andrews TD, Carter NP, Hurles ME, Pritchard JK. Nat Genet. 2005;38:75–81. doi: 10.1038/ng1697. [DOI] [PubMed] [Google Scholar]
- 6.Locke DP, Sharp AJ, McCarroll SA, McGrath SD, Newman TL, Cheng Z, Schwartz S, Albertson DG, Pinkel D, Altshuler DM, Eichler EE. Am J Hum Genet. 2006;79:275–290. doi: 10.1086/505653. [DOI] [PMC free article] [PubMed] [Google Scholar]
- 7.Jing J, Reed J, Huang J, Hu X, Clarke V, Edington J, Housman D, Anantharaman TS, Huff EJ, Mishra B, Porter B, Shenker A, Wolfson E, Hiort C, Kantor R, Aston C, Schwartz DC. Proc Natl Acad Sci USA. 1998;95:8046–8051. doi: 10.1073/pnas.95.14.8046. [DOI] [PMC free article] [PubMed] [Google Scholar]
- 8.Xiao M, Gordon MP, Phong A, Ha C, Chan TF, Cai D, Selvin PR, Kwok PY. Hum Mutat. 2007;28:913–921. doi: 10.1002/humu.20528. [DOI] [PubMed] [Google Scholar]
- 9.Xiao M, Phong A, Ha C, Chan TF, Cai D, Leung L, Wan E, Kistler AL, DeRisi JL, Selvin PR, Kwok PY. Nucleic Acids Res. 2007;35:e16–e16. doi: 10.1093/nar/gkl1044. [DOI] [PMC free article] [PubMed] [Google Scholar]
- 10.Morgan RD, Calvet C, Demeter M, Agra R, Kong H. Biol Chem. 2000;381:1123–1125. doi: 10.1515/BC.2000.137. [DOI] [PubMed] [Google Scholar]
- 11.Das SK, Austin MD, Akana MC, Deshpande P, Cao H, Xiao M. Nucleic Acids Res. 2010;38:e177. doi: 10.1093/nar/gkq673. [DOI] [PMC free article] [PubMed] [Google Scholar]
- 12.Goshtasby A. Image Vision Comput. 1988;6:255–261. [Google Scholar]
- 13.Goshtasby A. Pattern Recognit. 1986;19:459–466. [Google Scholar]
- 14.Ley TJ, Mardis ER, Ding L, Fulton B, McLellan MD, Chen K, Dooling D, Dunford-Shore BH, McGrath S, Hickenbotham M, Cook L, Abbott R, Larson DE, Koboldt DC, Pohl C, Smith S, Hawkins A, Abbott S, Locke D, Hillier LW, Miner T, Fulton L, Magrini V, Wylie T, Glasscock J, Conyers J, Sander N, Shi X, Osborne JR, Minx P, Gordon D, Chinwalla A, Zhao Y, Ries RE, Payton JE, Westervelt P, Tomasson MH, Watson M, Baty J, Ivanovich J, Heath S, Shannon WD, Nagarajan R, Walter MJ, Link DC, Graubert TA, DiPersio JF, Wilson RK. Nature. 2008;456:66–72. doi: 10.1038/nature07485. [DOI] [PMC free article] [PubMed] [Google Scholar]
- 15.Zhou S, Wei F, Nguyen J, Bechner M, Potamousis K, Goldstein S, Pape L, Mehan MR, Churas C, Pasternak S, Forrest DK, Wise R, Ware D, Wing RA, Waterman MS, Livny M, Schwartz DC. PLoS Genet. 2009;5:e1000711. doi: 10.1371/journal.pgen.1000711. [DOI] [PMC free article] [PubMed] [Google Scholar]
- 16.Zhou S, Bechner MC, Place M, Churas CP, Pape L, Leong SA, Runnheim R, Forrest DK, Goldstein S, Livny M, Schwartz DC. BMC Genomics. 2007;8:278. doi: 10.1186/1471-2164-8-278. [DOI] [PMC free article] [PubMed] [Google Scholar]
- 17.Church DM, Goodstadt L, Hillier LW, Zody MC, Goldstein S, She X, Bult CJ, Agarwala R, Cherry JL, DiCuccio M, Hlavina W, Kapustin Y, Meric P, Maglott D, Birtle Z, Marques AC, Graves T, Zhou S, Teague B, Potamousis K, Churas C, Place M, Herschleb J, Runnheim R, Forrest D, Amos-Landgraf J, Schwartz DC, Cheng Z, Lindblad-Toh K, Eichler EE, Ponting CP The Mouse Genome Sequencing Consortium. PLoS Biol. 2009;7:e1000112. doi: 10.1371/journal.pbio.1000112. [DOI] [PMC free article] [PubMed] [Google Scholar]
- 18.Teague B, Waterman MS, Goldstein S, Potamousis K, Zhou S, Reslewic S, Sarkar D, Valouev A, Churas C, Kidd JM, Kohn S, Runnheim R, Lamers C, Forrest D, Newton MA, Eichler EE, Kent-First M, Surti U, Livny M, Schwartz DC. Proc Natl Acad Sci USA. 2010;107:10848–10853. doi: 10.1073/pnas.0914638107. [DOI] [PMC free article] [PubMed] [Google Scholar]
- 19.Wu C, Schramm TM, Zhou S, Schwartz DC, Talaat AM. BMC Genomics. 2009;10:25. doi: 10.1186/1471-2164-10-25. [DOI] [PMC free article] [PubMed] [Google Scholar]
- 20.Latreille P, Norton S, Goldman BS, Henkhaus J, Miller N, Barbazuk B, Bode HB, Darby C, Du Z, Forst S, Gaudriault S, Goodner B, Goodrich-Blair H, Slater S. BMC Genomics. 2007;8:321. doi: 10.1186/1471-2164-8-321. [DOI] [PMC free article] [PubMed] [Google Scholar]
- 21.Qu X, Wu D, Mets L, Scherer NF. Proc Natl Acad Sci USA. 2004;101:11298–11303. doi: 10.1073/pnas.0402155101. [DOI] [PMC free article] [PubMed] [Google Scholar]
- 22.Gordon MP, Ha T, Selvin PR. Proc Natl Acad Sci USA. 2004;101:6462–6465. doi: 10.1073/pnas.0401638101. [DOI] [PMC free article] [PubMed] [Google Scholar]
- 23.Neely RK, Dedecker P, Hotta J, Urbanavičiūtė G, Klimašauskas S, Hofkens J. Chem Sci. 2010;1:453–460. [Google Scholar]
- 24.Dervan PB, Bürli RW. Curr Opin Chem Biol. 1999;3:688–693. doi: 10.1016/s1367-5931(99)00027-7. [DOI] [PubMed] [Google Scholar]
- 25.Chan EY, Goncalves NM, Haeusler RA, Hatch AJ, Larson JW, Maletta AM, Yantz GR, Carstea ED, Fuchs M, Wong GG, Gullans SR, Gilmanshin R. Genome Res. 2004;14:1137–1146. doi: 10.1101/gr.1635204. [DOI] [PMC free article] [PubMed] [Google Scholar]
- 26.Bates M, Huang B, Dempsey GT, Zhuang X. Science. 2007;317:1749–1753. doi: 10.1126/science.1146598. [DOI] [PMC free article] [PubMed] [Google Scholar]
- 27.Rust MJ, Bates M, Zhuang X. Nat Methods. 2006;3:793–796. doi: 10.1038/nmeth929. [DOI] [PMC free article] [PubMed] [Google Scholar]
- 28.Linde S, van de Löschberger A, Klein T, Heidbreder M, Wolter S, Heilemann M, Sauer M. Nat Protoc. 2011;6:991–1009. doi: 10.1038/nprot.2011.336. [DOI] [PubMed] [Google Scholar]
- 29.van de Linde S, Krstić I, Prisner T, Doose S, Heilemann M, Sauer M. Photochem Photobiol Sci. 2011;10:499. doi: 10.1039/c0pp00317d. [DOI] [PubMed] [Google Scholar]
- 30.Kartalov EP, Unger MA, Quake SR. BioTechniques. 2003;34:505–510. doi: 10.2144/03343st02. [DOI] [PubMed] [Google Scholar]
- 31.Aitken CE, Marshall RA, Puglisi JD. Biophys J. 2008;94:1826–1835. doi: 10.1529/biophysj.107.117689. [DOI] [PMC free article] [PubMed] [Google Scholar]
- 32.Rasnik I, McKinney SA, Ha T. Nat Methods. 2006;3:891–893. doi: 10.1038/nmeth934. [DOI] [PubMed] [Google Scholar]
- 33.Lam ET, Hastie A, Lin C, Ehrlich D, Das SK, Austin MD, Deshpande P, Cao H, Nagarajan N, Xiao M, Kwok P-Y. Nat Biotechnol. 2012 doi: 10.1038/nbt.2303. accepted forpublication. [DOI] [PMC free article] [PubMed] [Google Scholar]
Associated Data
This section collects any data citations, data availability statements, or supplementary materials included in this article.


