

Abstract
Long INterspersed Element-1 (LINE-1 or L1) retrotransposons are the only autonomously active transposable elements in the human genome. The average human genome contains ∼80-100 active L1s, but only a subset of these L1s are highly active or ‘hot’. Human L1s are closely related in sequence, making it difficult to decipher progenitor/offspring relationships using traditional phylogenetic methods. However, L1 mRNAs can sometimes bypass their own polyadenylation signal and instead utilize fortuitous polyadenylation signals in 3′ flanking genomic DNA. Retrotransposition of the resultant mRNAs then results in lineage specific sequence ‘tags’ (i.e., 3′ transductions) that mark the descendants of active L1 progenitors. Here, we developed a method (Transduction-Specific Amplification Typing of L1 Active Subfamilies or TS-ATLAS) that exploits L1 3′ transductions to identify active L1 lineages in a genome-wide context. TS-ATLAS enabled the characterisation of a putative active progenitor of one L1 lineage that includes the disease causing L1 insertion L1RP, and the identification of new retrotransposition events within two other ‘hot’ L1 lineages. Intriguingly, the analysis of the newly discovered transduction lineage members suggests that L1 polyadenylation, even within a lineage, is highly stochastic. Thus, TS-ATLAS provides a new tool to explore the dynamics of L1 lineage evolution and retrotransposon biology.
Keywords: human, retrotransposon, transduction, polyadenylation, genome
Introduction
Long INterspersed Element-1 (LINE-1 or L1) sequences are autonomously mobile non-LTR retrotransposons that are ubiquitous in mammalian genomes (reviewed in (Beck et al., 2011)). In humans, L1s comprise ∼17% of the genome and are responsible for the genesis of at least another 10% of DNA through the mobilisation of non-autonomous retrotransposons (e.g., Alu and SVA elements), certain non-coding RNAs, and cellular mRNAs, which leads to the creation of processed pseudogenes (Esnault et al., 2000; Lander et al., 2001; Wei et al., 2001; Buzdin et al., 2002; Dewannieux et al., 2003; Ostertag et al., 2003; Bennett et al., 2004; Gilbert et al., 2005; Weber, 2006; Garcia-Perez et al., 2007; Hancks et al., 2011). Despite their prevalence, there is a profound dearth of knowledge regarding the active L1s segregating in human populations.
In silico studies have been instrumental in identifying active (i.e., retrotransposition competent or RC-L1s) human L1elements. RC-L1s contain an intact 5′ UTR harbouring an internal RNA polymerase II promoter (Swergold, 1990) that drives transcription of an mRNA containing two open reading frames (ORF1 and ORF2) (Dombroski et al., 1991; Scott et al., 1987). The L1-encoded proteins (ORF1p and ORF2p) are required for retrotransposition (Moran et al., 1996; Feng et al., 1996) and biochemical and genetic studies indicate that both proteins preferentially act in cis to mobilize their encoding transcript (Esnault et al., 2000; Wei et al., 2001; Kulpa and Moran, 2006).
The development of a cultured-cell retrotransposition assay (Moran et al., 1996) allowed quantification of the retrotransposition efficiency of individual L1s. In 2003, analysis of the Human Genome Working Draft (HGWD) sequence (Lander et al., 2001) indicated that 90 L1s had two intact open reading frames (ORFs) (Myers et al., 2002; Brouha et al., 2003). When 82 of the 90 potential RC-L1s were tested in the retrotransposition assay, 40 were active (Brouha et al., 2003). The majority of these 40 L1s were weakly active; however, 6 elements, termed ‘hot’ L1s, displayed robust retrotransposition activity in HeLa cells (Brouha et al., 2003). Subsequent genome-wide studies have indicated that there are significantly more ‘hot’ L1s in the human population than previously appreciated, and that ongoing L1 retrotransposition contributes significantly to human genetic diversity (Badge et al., 2003; Beck et al., 2010; Iskow et al., 2010; Huang et al., 2010; Ewing and Kazazian, 2010; Kidd et al., 2010; Mills et al., 2011), reviewed in (Beck et al., 2011)).
We previously developed a transposon display system (Amplification Typing of L1 Active Subfamilies or ATLAS) to selectively amplify human-specific L1 insertions (Badge et al., 2003). Interestingly, 3 of 7 (∼43%) full-length elements in this study were ‘hot’ L1s, which contrasts with the relatively low number of ‘hot’ L1s in the HGWD (Brouha et al., 2003). Thus, a combination of in silico analyses, transposon display approaches, and a cultured cell retrotransposition assay can identify polymorphic, active L1s segregating in human populations.
Human-specific L1 subfamilies are evolutionarily young and are closely related in sequence – for example, the oldest human-specific L1 subfamily (pre-Ta) originated around 4.4 MYA and its members are on average 99.4% identical at the nucleotide level (Boissinot et al., 2000; Marchani et al., 2009). Thus, it often is difficult to discern progenitor/offspring relationships among L1s by comparing their sequences. Previous work revealed that the transcription machinery frequently bypasses the native L1 polyadenylation (poly (A)) signal and instead terminates at a poly (A) signal in 3′ flanking genomic DNA (Moran et al., 1996; Holmes et al., 1994; Moran et al., 1999; Pickeral et al., 2000; Goodier et al., 2000). The resultant retrotransposition events therefore acquire a sequence ‘tag’ known as a 3′ transduction (Moran et al., 1996; Holmes et al., 1994; Moran et al., 1999; Pickeral et al., 2000; Goodier et al., 2000).
In principle, shared 3′ transductions can be used to identify related L1s and establish progenitor/offspring relationships. In silico studies suggest that ∼15% of L1s contain 3′ transductions, and that 3′ transductions are responsible for generating between 19 and 30.5 Mb of human genomic sequence (Pickeral et al., 2000; Goodier et al., 2000). Moreover, 3′ transductions have enabled the identification of putative progenitors of disease-producing L1 insertions and a number of ‘hot’ L1 lineages (Beck et al., 2010; Kidd et al., 2010; Holmes et al., 1994; Goodier et al., 2000; van den Hurk et al., 2003; van den Hurk et al., 2007; Brouha et al., 2002; Seleme Mdel et al., 2006; Solyom et al., 2012).
Here, we describe a system called Transduction-Specific ATLAS (TS-ATLAS) that allows the amplification of L1s containing shared 3′ transduced sequences. We report the discovery of new L1s related to three ‘hot’ L1 lineages: L1RP (AF148856), AC002980, and LRE3 (AC067958) (Brouha et al., 2002; Seleme Mdel et al., 2006; Schwahn et al., 1998; Kimberland et al., 1999). Notably, we identified a likely progenitor of a lineage of elements that includes a disease-causing L1 insertion (L1RP) (Schwahn et al., 1998; Kimberland et al., 1999) and demonstrated that this L1 is highly active in a cultured human cell retrotransposition assay. The AC002980 and LRE3 lineages are extensive (with 10 and 8 members respectively) and generally are polymorphic. They also have highly variable allele frequencies (from putatively “Private” insertions present in a single individual to 0.495), suggesting they have expanded in recent human history. Within the AC002980 lineage there is evidence for ongoing variation in poly (A) site selection, suggesting this may be a plastic feature of L1 evolution. Together, the above data reveal that ongoing L1 retrotransposition contributes to human genetic diversity and strongly suggest that these three lineages remain active in human populations.
Materials and Methods
Identification of L1s Related to AC002980, LRE3, and RP in Human Genomic Sequence Resources
BLAT searches of the UCSC genome (http://genome.ucsc.edu) Human March 2006 (NCBI 36/hg18) assembly (hereafter referred to as the Human Genome Reference, HGR) and BLAST searches of the NCBI non-redundant nucleotide databases (nr) (http://www.ncbi.nih.gov) were both performed using AC002980, LRE3 (Accession Number: AC067958), and L1RP (Accession Number: AF148856) 3′ transduction sequences as probes (Kent, 2002; Altschul et al., 1990). Sequences with >95% identity that were preceded by an L1HS were aligned by hand to L1.3 (Accession Number: L19088 (Dombroski et al., 1993)) using the SIMMONIC sequence analysis package (Simmonds and Smith, 1999) to enable detailed examination of L1 length and structural hallmarks such as target-site duplications (TSDs) and poly (A) tails. L1 elements were named according to the accession number of the sequence into which they inserted.
Transduction-Specific (TS) ATLAS DNA Samples and Extraction
TS-ATLAS was performed using peripheral blood lymphocyte and ejaculated sperm derived genomic DNA (gDNA) from 9 healthy, anonymous volunteers, collected with informed consent under ethical approval from Leicestershire, Northamptonshire, and Rutland Research Ethics Committee (LNRREC Ref. No. 6659 UHL). After collection, assigning randomised identifiers anonymised the blood and sperm samples. Lymphoblastoid cell line genomic DNAs from 1 CEPH/FRENCH and 5 CEPH/UTAH pedigrees, obtained from the Centre d'Etude du Polymorphisme Humain (CEPH)/Fondation Jean Dausset were also utilised (Supp. Methods). Genomic DNA was isolated using the Gentra Puregene Blood kit (Qiagen) following the manufacturer's instructions. DNA integrity was assessed by fractionation on 0.8% (w/v) agarose gels alongside intact bacteriophage λ DNA. DNA was visualized by ethidium bromide (0.5μg/mL) staining under UV illumination.
TS- ATLAS
TS-ATLAS is a modification of ATLAS (Badge et al., 2003) that uses transduction specific primers to selectively amplify loci containing transduced sequences from oligonucleotide-linkered genomic libraries. All oligonucleotides (Supp. Table S1) were HPLC purified by the manufacturer (Sigma) and re-suspended at 50μM in 5mM TrisHCl, pH 7.5. All pre-PCR reaction set up was carried out in a Class II laminar flow hood (Walker), decontaminated by UV exposure for at least 30 min prior to use.
Library Construction and Amplification
The method described below is the VspI-specific protocol for the L1RP transduction lineage (Supp. Methods Protocol 1 and Supp. Figure S1). Variations required for the MspI-specific L1RPtransduction lineage assay and AC002980 and LRE3 lineages are described in the Supp. Methods (Protocols 2- 5 and Supp. Figures S2-S4). Briefly, 600ng of genomic DNA were digested to completion with 20 units of VspI (Promega) in the manufacturer's recommended buffer at 37°C for 3 hours. After incubation, reactions were heated to 65°C for 20 minutes to inactivate the restriction enzyme. Prior to setting up the ligation reaction, linker oligonucleotides were freshly annealed by mixing equal volumes of 20μM RBMSL2 and RBD3, heating to 65°C for 10 minutes, and then cooling to room temperature. An aliquot (100ng) of the digested DNA was ligated to a 40-fold molar excess of the annealed suppression linker (2.7μl of 10μM annealed linker for VspI libraries) with 4 weiss units T4 DNA ligase (Promega) in 1× Ligase Buffer (Invitrogen) overnight (∼16hrs) at 15°C, in a final volume of 20μl. After ligation the reaction was heated to 70°C for 10 minutes to inactivate the ligase. Excess linkers and short DNA fragments (i.e., < 100 bp) were removed with the Qiaquick PCR purification system (Qiagen) following the manufacturer's protocol, but eluting the DNA in 30μl 5mM Tris HCl pH7.5. In our hands the purification is ∼80% efficient, resulting in a purified library containing approximately 2.7ng/μl of genomic DNA. Libraries are sensitive to freeze/thaw, and so were aliquotted and stored frozen at -20°C. An aliquot (1μl) of ligated genomic DNA was amplified in 10μl PCR reactions containing 1 × PCR buffer (45mM Tris HCl pH 8.8, 11mM NH4SO4, 0.9mM MgCl2, 6.7mMβ-mercaptoethanol, 113 μg/ml BSA, 1mM dNTPs), 1.25μM RBX4 primer, 1.25μM RB3PA1 primer, and 0.4 units Taq DNA polymerase (ABgene). Reactions were cycled in a Tetrad 2 Thermal Cycler (MJ Research/Biorad) using the following conditions: 96°C -1min; 30 × [96°C -30s; 58°C -30s; 72°C -1min]; 72°C -10min. Primary suppression PCR reactions were diluted 1:50 in Single Molecule Dilution Diluent (SMDD: 5mM Tris HCl pH7.5, 5ng/μl sonicated E. coligenomic DNA), and 1μl diluted PCR reaction was added to 9μl secondary PCR reactions containing 1 × PCR buffer, 0.625mM RBY1 primer (Linker specific), 0.625mM 011TD1 (L1RP transduction specific), and 0.4 units Taq DNA polymerase (ABgene). Reactions were cycled in a Tetrad 2 Thermal Cycler (MJ Research) using the following conditions: 96°C -1min; 30 × [96°C -30s; 58°C -30s; 72°C -1min]; 72°C -10min.
Recovery and Analysis of TS-ATLAS Products
An aliquot (10μl) of secondary TS-ATLAS PCR products was fractionated on 2% Seakem LE (Cambrex) 0.5× TBE agarose gels alongside the 100bp ladder (NEB) size marker and visualised by ethidium bromide (0.5 μg/ml) staining. Novel PCR products were excised from the gel and purified using the Qiagen Minelute system (Qiagen) following the manufacturer's protocol, but eluting the DNA in 10μl of 5mM Tris HCl pH7.5. Purified PCR products were directly sequenced with ABI BigDye Ver. 3.1 ReadyReaction, using 3.3μM RBY1 as the primer. Sequencing reactions were purified using Performa DTR spin columns (Edge BioSystems & VWR Bio Ltd) and the sequencing data collected using an ABI 3730 capillary sequencer by the PNACL core DNA sequencing service (University of Leicester). The sequences of the TS-ATLAS amplicons were imported into the CHROMAS sequence viewer and the L1 3′ transduction flanking sequences mapped to the HGR using BLAT (http://genome.ucsc.edu)(Kent, 2002). Accession numbers of the DNA sequences encompassing the L1 insertion locations were verified using the National Center for Biotechnology Information (NCBI) BLASTN program (http://www.ncbi.nih.gov)(Altschul et al., 1990). Recovered L1 elements that had previously been reported (Myers et al., 2002; Beck et al., 2010; Boissinot et al., 2000; Goodier et al., 2000) are listed in Supp. Table S2. Putative novel insertions were named using the convention followed in Badge et al., 2003 and Beck et al., 2010: The insertions were assigned to the accession of the completely sequenced large insert clone (BAC/PAC) containing the insertion empty site sequence, as represented in the human genome reference sequence (hg18), and are listed in Table 1.
Table 1. TS-ATLAS and Related Loci.
| Accession/L1 | Family-Library | Presence in HGR | Detected in 1000G? | Location Chr (position) | Length | TSDs | Transduction Length (nt) | Allele Freq5 |
|---|---|---|---|---|---|---|---|---|
|
| ||||||||
| AL0503081 | RP-VspI | - | Y | Xq27.2 (140342939, -) | FL | AAAAAGTTTTAAATTT | 0 | 0.149 |
| AC0058881 | RP-MspI | - | Y | 12q24.31 (125221192, +) | 5′Truncated | AAAGAAATAAGG | 11 | Polymorphic |
| AC005939 | RP | + | NA | 17q24.3 (65966692, +) | FL | AAGATTTTGTG | 10 | 0.327 |
| AC093861 | RP | + | NA | 4p13 (44202069, -) | 5′Truncated | None detected | 11 | NT |
| AL5900113 | RP | - | N | 6q13 (72856236, +) | FL | TAAGAAAATGTGGCACA | 11 | 0.2103 |
| AC0192883 | RP | - | Y | 15q14 (33441423, -) | FL | AAAAAATGAAAATC | 11 | 0.0023 |
| RP4 | RP | - | NA | Xp11.3 (46582227, +) | FL | AAGACTGTAAGGTG | 11 | Private |
| AL118519 | 2980-VspI | + | NA | 6q13 (70776960, +) | FL | CAAAACAAAACAAAGCAAAC | 0 | Polymorphic |
| AC002980 | 2980-NlaIII | + | NA | Xp22.2 (11869357, -) | FL | AAAAAAAATCACCA | 174 | 0.495 |
| AC010387 | 2980-VspI | + | NA | 5p14.2 (24409194, -) | 5′Truncated | AAATTTTGTTTTA | 222 | Polymorphic |
| AC0047401,3 | 2980-NlaIII | - | Y | 7p21.3 (8853240, +) | FL | AACAATATGTA | 222 | 0.0633 |
| AP0016041 | 2980-NlaIII | - | N | 21q21.3 (27594286, -) | 5′Truncated | AGAAAGTGCCCTGTAG | 222 | 0.056 |
| AC0483821 | 2980-NlaIII | - | Y | 15q25.2 (82941913, +) | FL | AAGATGTAAGTAGAAA | 181 | 0.025 |
| AP0010291,3 | 2980-NlaIII | - | Y | 18p11.21 (12481262, +) | FL | AAGAAAATCCT | 173 | 0.0163 |
| AC0690231 | 2980-NlaIII | - | NA | 10p12.33 | Undetermined | In Duplicon | 174 | NT |
| AC1163111 | 2980-VspI | - | N | 5q21.1 (100553773, +) | 5′Truncated | AGAAATAATGTAA | 406 | 0.037 |
| AC0107491 | 2980-NlaIII | - | Y | 7p21.1 (17061239, +) | 5′Truncated | TAAAACAATTGTTC | 173 | Polymorphic |
| LRE3/AC0679581,4 | LRE3-MseI | - | Y | 2q24.1 (156236094, +) | FL | GAAAGAAAGAAAGAA | 0 | 0.328 |
| BX9273592 | LRE3-MseI | - | N | 14q32.23 (104052295, +) | FL | AAAATGAAATAAAAT | 257 | 0.016 |
| AC0911382 | LRE3-MseI | - | N | 18q22.3 (68673030,-) | 5′Truncated | GAAAGAATAAGATATTTTG | 273 | 0.016 |
| AC0682861 | LRE3-MseI | - | N | 2p24.3 (14899793, +) | FL | AGAAATAAGTGTCTA | 263 | 0.0 |
| AL5921821 | LRE3-MseI | - | N | 1p33 (50455323, +) | FL | AGAAAACAACAGAGGGG | 263 | 0.0 |
| AL0315841 | LRE3-MseI | - | N | Xp11.3 (45671041, +) | 5′Truncated | AAATCAACCACAGAAAACAAACC | 263 | 0.04 |
| AL3536853 | LRE3 | - | N | 9q31.1 (106675844, +) | FL | GAACAAGCCTGG | 278 | 0.03 |
| CYBB4 | LRE3 | - | NA | Xp11.4 (37538956, +) | 5′Truncated | AA | 280 | Private |
Identified in blood donor panel (this study)
Identified in CEPH panel (this study)
Described in (Beck et al., 2010)
Described as disease causing insertions (Brouha et al., 2002; Kimberland et al., 1999)
Whether an element was detected in our analysis of the 1000 Genomes dataset is recorded in column 4 as: Y = Yes, N = No, and NA = Not Analysed (because the element is in the HGR, private to an individual with a disease causing insertion or not mapped uniquely). Allele frequencies are listed in this study as determined in a panel of 129 unrelated CEPH individuals, or when previously described (Beck et al., 2010) with their reported allele frequency. Loci discovered in one member of the blood donor panel, but absent from the CEPH genotyping panel, are listed with allele frequencies of 0.0, as the relatedness between the donor panel and CEPH panel is not known. Loci are described as “polymorphic” if they were not fully genotyped, but were present or absent in more than one individual in the blood donor or CEPH panels. Disease causing de novo insertions are described as “Private”. FL = full length, NT = not tested.
Primer Design for Novel L1 Insertions Related to RP, AC002980, and LRE3
Upon identification of the insertion sites of novel L1s, flanking DNA sequences were obtained from the HGR, the repeats were masked using RepeatMasker (http://www.repeatmasker.org/), and PCR primers were designed using Primer 3 (http://frodo.wi.mit.edu/cgi-bin/primer3/primer3_www.cgi). Primers were designed so that the 3′ flanking primer (downstream of the L1 poly (A) tail) was 3′ of the restriction site to which the library linker was ligated, which enabled independent verification of the ligation point. Where flanking sequence was highly repetitive, primers were positioned across the junction of repeats.
Verification of Novel L1s Containing 3′ Transductions
The presence of L1s preceding 3′ transductions related to RP, AC002980, orLRE3 was verified by PCR amplification using a unique 3′ flanking primer and the primer RP3PA2, which is specific to the 3′ end of human-specific L1s. Primer sequences are listed in Supp. Table S1. PCR products were separated on 2% agarose gels, purified using the Qiagen Minelute system (Qiagen), cloned using the pGEM-T easy kit (Promega), and transformed into ultra competent DH5α E. coli cells. Plasmid DNA was recovered using a QIAprep Spin miniprep kit (Qiagen). An aliquot (20-30ng/kb) of plasmid DNA was sequenced using the Big Dye Terminator v3.1 as above with 3.3μM sequencing primer (M13F or M13R) to determine the insert sequence.
Length and 5′ Target Site Duplications of Novel L1 Loci
The length of novel L1 insertions was confirmed by amplifying with a unique 5′ flanking primer and the primer RB5PA2 specific to the 5′ end of a human specific L1s. Primer sequences are listed in Supp. Table S1. Where novel L1 insertions appeared to be 5′ truncated such that no 5′ specificamplicon was produced, the entire element was amplified using the unique 5′ and 3′ flanking DNA primers. In principle this strategy would enable amplification of elements with 5′ inversions, but none were detected in this study. Target site duplications (TSDs) and the L1 insertion site in the HGR were determined by excising amplicons from 2% agarosegels, purifying the DNA using the Qiagen Minelute system (Qiagen), and directly sequencing with ABI BigDye Ver. 3.1 ReadyReactions as described above, using the flanking region primers.
Presence/Absence Polymorphism
Dimorphism of L1 insertions related to L1RP, AC002980, or LRE3 was determined using two PCR assays: the “filled” site reaction amplified the 3′ end of the L1 and its 3′ flanking DNA, while the “empty” site reaction amplified the DNA flanking the L1 insertion point in the absence of the L1, as described previously (Badge et al., 2003; Sheen et al., 2000). A panel of unrelated Northern European CEPH genomic DNAs (n=129) was used to estimate L1 insertion allele frequency. This subset was derived from unrelated individuals (grandparents and parents) from CEPH families 02, 12, 17, 21, 23, 28, 35, 37, 45, 66, 102, 104, 884, 1331, 1332, 1333, 1340, 1341, 1344, 1345, 1346, 1347, 1349, 1350, 1362 1375, 1377, 1408, 1413, 1416, 1418, 1420, 1421, 1423, 1424, 13291, 13292, 13293. The primers used are listed in Supp. Table S1.
Amplification and Sequencing of L1 AL050308
The full-length putative L1RP progenitorAL050308 was amplified using a 5′ primer positioned across the junction of the L1 and its 5′ flanking genomic DNA and a 3′ primer unique to the 3′ flanking genomic DNA of AL050308 (primer sequences listed in Supp. Table S1). An aliquot (40ng) of sperm genomic DNA from a male donor who is hemizygous for the AL050308 insertion was subjected to long-range PCR amplification in 10μl PCR reactions containing 1 × PCR buffer, 0.0625μM of each primer, and 0.05 units/μl Taq/Pfu mixed in the ratio 10:1 (ABgene/Stratagene). Reactions were cycled in a Tetrad 2 Thermal Cycler (MJ Research/Biorad) using the following conditions: 96°C -1min; 28 × [94°C -15s; 68°C -10min]; 72°C -10min. PCR products were separated on a 1% agarose gel and purified using a QIAquick gel extraction kit (Qiagen). The PCR products were directly sequenced using the flanking genomic primers and a set of L1 sequencing primers designed to the L1.3 (L19088) reference sequence.
AL050308 Cloning and Retrotransposition Assays
L1 AL050308 was amplified from volunteer donor sperm gDNA by long-range PCR using flanking genomic primers JM0308D and CM0308A. To enable amplification of error-free PCR products, long-range PCR using the Expand Long Range polymerase system (Roche) was employed using 50ng of template DNA and buffer 2. PCR products were then cloned by digesting PCR fragments with AccI, performing PCR clean up with the Zymoclean DNA gel recovery kit (Zymo Research), and ligation of fragments into appropriate restriction sites in the pBluescript-based vector pJCC9 containing the mneoI retrotransposition indicator cassette (Beck et al., 2010). Cloned L1RP progenitor elements were sequenced in their entirety (∼4× coverage) to identify clones with minimal sequence variation from the directly determined consensus.
Clones were tested for retrotransposition activity relative to L1.3 (accession L19088) alongside the retrotransposition defective negative control construct pJCC9 L1.3 D702A (RT-) as previously described (Wei et al., 2001; Moran et al., 1996; Beck et al., 2010; Wei et al., 2000). HeLa cells were cultured as previously described (Moran et al., 1996; Beck et al., 2010). Six-well tissue culture plates were seeded with approximately 5×10³, 2×10⁴, or 2×10⁵cells, and 24 hours later, three wells of each cell concentration were transfected with 1μg of plasmid using Fugene 6 transfection reagent (Roche) and Opti-mem media (Gibco). Approximately 18-24 hours post transfection culture media was aspirated and replaced. Media was replaced daily from 72 hours post transfection with media plus 400μg/mL G418 (Gibco). Fourteen days after transfection, cells were washed, fixed, and stained with 0.1% crystal violet as previously described (Beck et al., 2010). G418-resistant colonies were counted on the 5×10³ or 2×10⁴ plates. Transfection efficiencies were obtained using 2×10⁴ and 2×10⁵ cells transfected with pCEP/green fluorescent protein (GFP) as per the transient retrotransposition assay protocol (Moran et al., 1996; Beck et al., 2010; Wei et al., 2000).
Screening for Transduction Lineage elements within the 1000 Genomes Pilot data
Briefly, Roche 454-acquired genomic sequence data (from 375 individuals) from the 1000 Genomes Project Pilots 1-3 (1000 Genomes Project Consortium, 2010) was downloaded and filtered to exclude very short reads (<45bp) resulting in database of ∼1.6 billion reads. MegaBLAST (Zhang et al., 2000) searches using genomic sequences flanking the insertion points of novel TS-ATLAS-discovered elements were used to identify reads mapping to these loci. These reads were analysed to find junctions between genomic DNA and L1 or transduction sequences. These junction reads were validated by re-alignment and manual inspection. The detailed computational procedure is described in the Supporting Information and reads supporting the presence of novel TS-ATLAS insertions in the 1000 Genomes dataset listed in Supp. Table S3.
Results
Principle of TS-ATLAS
We modified 3′ ATLAS (Badge et al., 2003) to selectively amplify L1s with shared 3′ transduction sequences. These L1s were amplified from oligonucleotide-linkered genomic libraries in a method termed transduction-specific ATLAS (or TS-ATLAS). Figure 1A illustrates this procedure as developed for the L1RP transduction lineage, and is designed to equally amplify all members of the lineage. Other lineages (AC002980 and LRE3) required modifications that prevented the amplification of common lineage members. For example, the efficient amplification of AC002980 can outcompete novel lineage members with longer transductions (detailed in the Supp. Methods, Protocols 3 and 4).
Figure 1. Schematic of RP-Specific TS-ATLAS and Activity of L1 AL050308.
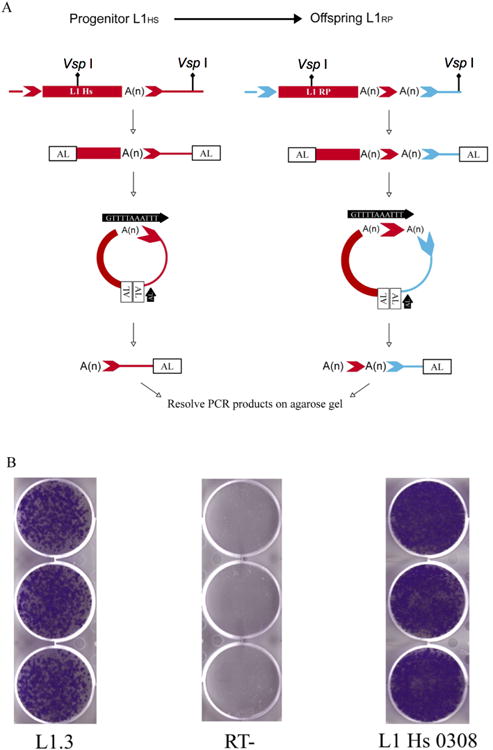
A. TS-ATLAS Using a Primer Specific to the RP Transduction
Shown on the right is an offspring L1 (red rectangle, labeled “L1 RP”) of a progenitor L1 (red rectangle to the left, labelled “L1 Hs”), which carries two poly (A) tails (A(n).) These poly (A) tails are separated by a short transduced sequence consisting of the progenitor's target site duplication sequence (red chevron), and flanked by distinct TSDs (light blue chevrons). PCR reactions containing linker specific (Black arrow, labelled “AL”) and transduction specific primers (Black arrow, labelled with RP transduction sequence) and using linkered genomic DNA libraries as a template enable specific amplification of both types of element. Offspring elements are identifiable by the presence of a poly (A) tail downstream of the transduction sequence (red chevron), while progenitor elements lack this. Sequencing of transduction PCR products enables their 3′ flanking genomic DNA to be used to determine if they originate from novel insertions.
B. Retrotransposition of Putative Lineage Progenitor L1 AL050308
TS-ATLAS was used to identify a putative novel progenitor for the RP lineage, inserted into genomic accession AL050308. The three panels show the results of representative duplicate cell culture based retrotransposition assays using L1 elements cloned into standard assay vectors. L1.3 (Accession L10988) is a reference element: its ability to generate G418 resistant HeLa cell colonies (left panel) was compared to that of the putative L1RP progenitor, AL050308 (right panel). This clone of the AL050308 element has no nucleotide changes from the genomic consensus sequence of the L1, and retrotransposes at ∼170% the rate of L1.3 (n=6). As a negative control an L1 construct with an inactivating mutation in the RT domain of ORF2p in L1.3 (Wei et al., 2001; Wei et al., 2000) was assayed under the same conditions (middle panel, RT-).
Briefly, genomic DNA was digested to completion with restriction enzymes (Figure 1A, diamond tipped lines) generating fragments containing L1 termini and their immediate 3′ flanking genomic sequences. The digested DNA was then ligated to a GC-rich double stranded ATLAS linker (Figure 1A, AL) and suppression PCR was performed using either anL1 3′ UTR or 3′ transduction specific primer in conjunction with a linker specific primer. Intra-molecular annealing of DNA fragments that have linkers attached to both ends leads to the formation of stable ‘panhandle’ structures that suppress PCR amplification (Badge et al., 2003; Lavrentieva et al., 1999; Broude et al., 2001). This suppression is relieved if a 3′ UTR or transduction specific primer anneals within the loop of the panhandle structure and is extended by Taq DNA polymerase, generating an amplicon with only one linkered end. The resultant amplicon then can serve as an exponential amplification template. For the L1RP lineage, the primary PCR utilised the L1 3′ UTR specific primer RB3PA1 and a secondary nested PCR was employed to enrich for DNA fragments containing the L1RP specific 3′ transduction (Figure 1A, black arrow) and its associated flanking DNA sequences. In the case of L1RP lineage elements that are not the progenitor, (Figure 1A, right panel) this procedure generates fragments containing the L1RP transduction sequence, upstream of a poly (A) tract and the 3′ genomic DNA flanking the L1 insertion. In contrast a putative progenitor of the L1RPinsertion would terminate in its poly (A) tail, and the 3′ flanking sequence subsequently identified as a transduction in offspring elements. This ‘transduction’ sequence will be followed by 3′ flanking genomic DNA which does not contain a second poly (A) tract, enabling its identification as a putative progenitor. Notably, TS-ATLAS amplification schemes also were developed for the 3′ transduction sequences flanking AC002980 and LRE3 (Supp. Methods, Protocols 3-5). To validate the reproducibility of TS-ATLAS, three-generation CEPH pedigrees showing segregation of AC002980 (CEPH Families 12, 1333, 1340, 1424, and 1347) and LRE3 (CEPH families 1333, 1340, 1424, and 13291) were analysed using lineage-specific TS-ATLAS and insertion specific genotyping. In all cases TS-ATLAS amplification patterns were entirely concordant with the genotypes of all family members (data not shown). The L1RP specific amplification scheme was not applied to CEPH pedigrees as initial screening of unrelated donors revealed only one novel amplicon (see below).
Discovery of a Putative RP Lineage Progenitor
Application of the L1RP lineage specific TS-ATLAS scheme to genomic DNA from a small panel of unrelated DNA donors (n=9) resulted in the recovery of a PCR product from one donor with a sequence consistent with it being a progenitor of the L1RP lineage. Subsequent genotyping of a panel of 129 unrelated CEPH DNAs showed this progenitor was not rare (allele frequency = 0.149). Long-range PCR and direct sequencing confirmed that the allele from the original donor had intact open reading frames. Low-error rate long-range PCR was used to amplify representative PCR products and these were cloned into a retrotransposition assay vector, making use of conserved AccI sites at the element's termini (Beck et al., 2010; Sassaman et al., 1997). Ten clones were sequenced at ∼four-fold coverage and assayed for retrotransposition activity. One clone showed no nucleotide variation from the directly determined sequence and retrotransposed at ∼170% the rate (n=6) of a reference active L1 element (L1.3, L19088 (Dombroski et al., 1993)), as illustrated in Figure 1B.
Analyses of the above data, searches of sequence databases, and identification of L1RP lineage members from the literature suggest that the L1RP transduction family is comprised of at least 7 members (Table 1, and Figure 2A). AC005939 and AC093861 are present in the human genome reference (HGR) sequence (Myers et al., 2002), whereas AL050308 and AC005888 were discovered in this study. Two L1RP-related full length polymorphic L1s (AL059011 and AC019288) were previously detected using a fosmid-based, paired-end DNA sequencing strategy (Beck et al., 2010). In summary, the L1RP transduction family contains the private mutagenic insertion L1RP, its likely progenitor (AL050308), at least 3 additional polymorphic full-length elements (AC005939, AL059011, AC019288), and two 5′ truncated L1s (AC005888, AC093861), whose allele frequencies range from 0.002 to 0.210.
Figure 2. L1 Transduction Families.
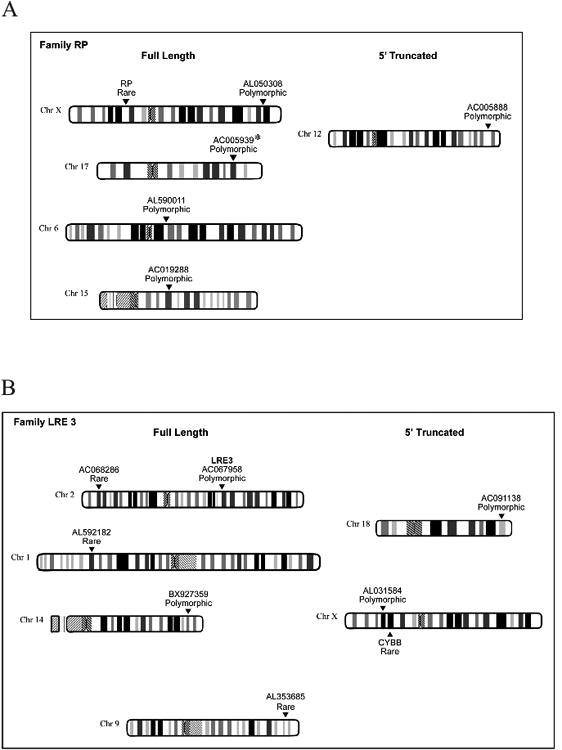
Data presented in Figure 3 are compiled from this and other studies (Myers et al., 2002; Beck et al., 2010; Goodier et al., 2000; Brouha et al., 2002; Kimberland et al., 1999). Ideograms were adapted from the NCBI map viewer website (http://www.ncbi.nlm.nih.gov/projects/mapview/).
A. Transduction Family RP.
The RP family is characterised by a transduction putatively derived from the L1 locus AL050308. AL050308, AL590011, AC005939, AL019288, and L1RP are full length and AC005888 is 5´ truncated. L1RP is a disease causing insertion (Kimberlandet al., 1999). Asterisks (*) denote L1s present in the human genome reference assembly (hg18). Insertion AC093861 is not included as the absence of TSDs (see Table 1) means we cannot exclude a non-TPRT mechanism for its mobilisation.
B. Transduction Family LRE3.
The LRE3 family is characterised by a transduction originally derived from the L1 locus LRE3. LRE3, BX927359, AC068286, AL592182, and AL353685 are full length. AC091138 and AL031584 are 5´ truncated. L1CYBB is a disease causing insertion (Meischlet al., 2000).
TS-ATLAS with Common Allele Suppression
Next we developed TS-ATLAS schemes for two other disease causing lineages, AC002980 and LRE3 (Myers et al., 2002; Brouha et al., 2002). Unlike the L1RP lineage, members of these families are known to be common within human populations (Brouha et al., 2002; Seleme Mdel et al., 2006). As suppression PCR is competitive, amplification of a common insertion potentially jeopardises amplification of novel elements with longer transductions or with restriction sites (for linker addition) distant from the L1. To overcome this technical hurdle, we suppressed amplification of known common lineage members by digesting the linkered libraries with a rare cutting restriction enzyme predicted to cut between the end of the transduced sequence and the flanking linker ligated restriction site. In the case of L1 AC002980 this was MunI, as illustrated in Figure 3A. Lack of MunI digestion allowed amplification only of AC002980 itself (Figure 3B, lane 16), while libraries derived from our 9 gDNA donors, pre-digested with MunI, yielded a constellation of potential AC002980 family members (Figure 3B, lanes 1-9).
Figure 3. Schematic of TS-ATLAS with Common Allele Suppression.
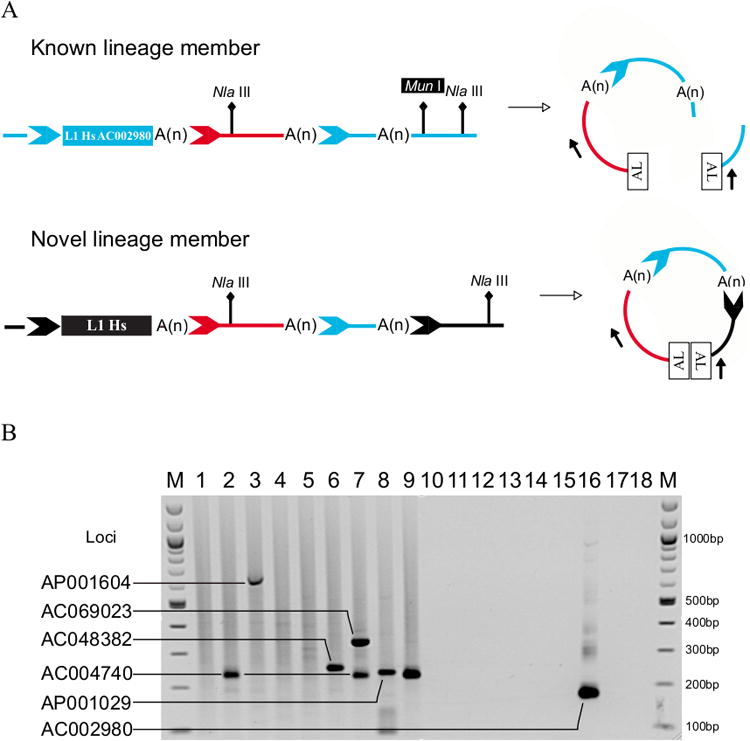
A. Amplification of L1 AC002980 is Prevented by Digestion with Mun I.
A commonly known transduction family member (upper panel, blue rectangle, labelled “L1Hs AC002980”) carries a lineage specific transduction (red line and chevron) and is flanked by distinct TSDs (light blue chevrons). L1 AC002980 competes with the amplification of novel lineage members. By selecting a rare restriction site (MunI) in the 3′ flanking DNA of this element, upstream of the NlaIII linker site, pre-digestion of linkered genomic libraries suppresses its amplification. Novel lineage members directly derived from L1 AC002980 carry the lineage specific transduction (red line and chevron) and a second transduction (light blue line and chevron) and are flanked by distinct TSDs (black chevron). Novel members most likely lack the combination of the rare cutting (MunI) restriction enzyme upstream of a very common NlaIII site, and so their amplification is not suppressed.
B. Representative TS-ATLAS Display Gel Showing the Results of Applying the AC002980-Specific (NlaIII) Assay. Lanes 1-9 show display patterns of 9 unrelated individuals each of whom carries the AC002980 L1. Control reactions in lanes 11, 13, 14, and 16 were setup using the same library sample as is shown in Lane 9. Lane 16 shows the amplification of the AC002980 locus, which is suppressed by digestion with MunI in lanes 1-9. Lanes 2, 7, and 9 show amplification of the AC004740 locus. Lane 3 shows amplification of the AP001604 locus. Lane 6 shows amplification of the AC048382 locus. Lane 7 shows amplification of the AC069023 locus. Lane 8 shows amplification of the AP001029 locus. Lane 10 - Reaction in the absence of genomic DNA. Lane 11 - Reaction in the absence of restriction enzyme (NlaIII). Lane 12 - Reaction in the absence of genomic DNA. Lane 13 - Reaction in the absence of T4 Ligase. Lane 14 - Reactions in the absence of linker. Lane 15 - Reaction in the absence of digested genomic DNA. Lane 16 - Reaction in the absence of supression enzyme digestion (MunI). Lane 17 - Control for primary PCR with DNA omitted. Lane 18 - Control for secondary PCR with DNA omitted. MW - molecular weight marker (100bp ladder (NEB)). All labelled bands were sequenced to verify their origin.
L1 Transduction Family: AC002980
TS-ATLAS identified 10 elements with transductions consistent with the AC002980 lineage. Three elements were present in the HGR (AC002980, AL118519, AC010387), including the putative lineage progenitor AL118519 and a related L1, AC010387 (Table 1). We identified seven other L1s that share the AC002980 3′ transduction, two of which, AC004740 and AP001029, were previously detected by fosmid end sequencing (Beck et al., 2010). Five of the L1s were full-length and four were 5′ truncated, and all contained discernable TSDs (Table 1, and Figure 4A). Also nine of the 10 L1s in the AC002980 lineage were dimorphic with respect to presence/absence, with allele frequencies ranging from 0.016 to 0.485 (Table 1). The tenth AC002980 member (AC069023) was embedded in a segmental duplication and thus, was intractable for genotyping and determination of L1 length (Table 1). Two additional members (ABC9_21 and ABC13_100) of the AC002980 family identified previously (Beck et al., 2010) were not detected in our panel using TS-ATLAS, likely due to the small number of individuals screened (n=9).
Figure 4. Variable Transduction Lengths in the AC002980 Family.
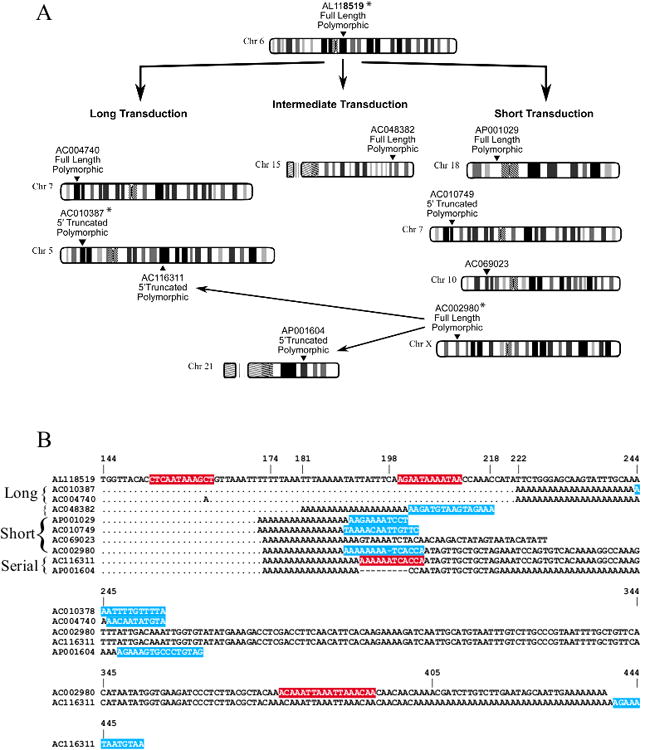
A. Characteristics and Putative Relationships of the AC002980 Family
Data presented here are compiled from this study and other publications (Myers et al., 2002; Beck et al., 2010; Goodier et al., 2000; Brouha et al., 2002; Kimberland et al., 1999). Putative relationships of L1 loci are indicated by arrows. Ideograms were adapted from the NCBI map viewer (http://www.ncbi.nlm.nih.gov/projects/mapview/). The AC002980 family contains elements characterized by alternative polyadenylation resulting in variable lengths of transduced sequence. The long, intermediate, and short transductions are derived from the progenitor locus AL118519. Loci AC004740 and AC010387 retain the long transduction, AC048382 contains an intermediate length transduction, while AP001029, AC010749, AC068023, and AC002980 have a shorter transduction. AP001604 and AC116311 contain sequences putatively derived from the AC002980locus. Asterisks (*) denote L1s present in the human genome reference assembly (hg18).
B. Multiple Alignment Showing Variable Transduction Lengths and Putative Polyadenylation Sites in the AC002980 Lineage. Dots represent identical nucleotides and dashes are gaps in the alignment. The alignment begins 144bp downstream from the start of the transduced sequence. Initially the alignment (bases 144-222) is against the 3′ flanking sequence of the progenitor locus AL118519, starting within the transduced region and showing transduction length variants derived from locus AL118519. Short transduction lengths end at bases 173/174, The intermediate transduction of AC048382 ends at base 181, and long transduction lengths end at base 222. Following this (bases 198-405) the alignment shows the direct offspring of the AC002980 locus, with AP001604 ending at base 218 and AC116311 base 405. Sections highlighted in red are predicted poly(A) signal regions determined using the Hamming-Clustering (HC) network analysis (http://zeus2.itb.cnr.it/∼webgene/wwwHC_poly(A).html). Target Site Duplications (TSDs), confirmed by sequencing, are highlighted in blue.
L1 Transduction Family: LRE3
TS-ATLAS revealed five novel L1 insertions that share the 3′transduction flanking the likely progenitor of a disease-producing insertion into the CYBB gene (MIM#300481), LRE3 ((Brouha et al., 2002), Table 1, and Figure 2B). Three insertions, BX927359, AC068286, and AL592182are full-length and represent potentially active L1s. Two of these, AC068286 and AL592182, appear to be rare as they were absent from the CEPH genotyping panel of 129 unrelated individuals. As these LRE3 lineage insertions occurred in a single donor also carrying the LRE3 progenitor element (AC067958) the sequence of the microsatellite region of the progenitor and offspring was compared to determine whether the progenitor had directly given rise to the novel element, as described previously (van den Hurk et al., 2007). In both cases at least two independent changes (microsatellite repeat number and substitutions) were observed between the progenitor allele and putative offspring elements (data not shown). Given the high error rate of the L1 RT (Gilbert et al., 2005) and the established instability of the LRE3 microsatellite (van den Hurk et al., 2007) we cannot absolutely exclude a direct descent relationship, but together these changes make this seem unlikely in these cases. L1s BX927359 and the 5′ truncatedAC091138are both present at a very low allele frequency of 0.016. The 5′ truncated element AL031584 is located on the X chromosome and has an allele frequency of 0.04. In summary, the LRE3 family appears to be the youngest transduction family examined by TS-ATLAS: 87.5% (7 of 8 tested) of its member L1s (including the CYBB disease causing insertion) are rare (present in only one individual) or at low allele frequencies (allele frequency < 0.04) within the human population analysed (Beck et al., 2010; Brouha et al., 2002).
Variable Polyadenylation of AC002980 Lineage Members
Inspection of the 3′ transduction sequences of the AC002980 lineage revealed evidence for alternative polyadenylation. In some cases, polyadenylation occurred within the 3′ transduction sequence. The most parsimonious explanation of these data is that the putative progenitor of this transduction family, AL118519, gave rise to three sub-lineages with long, intermediate, or short transductions (Figure 4A). Long transduction elements (insertions AC004740 and AC010387) likely utilise a predicted poly (A) site (highlighted in red in Figure 4B) located 200nts downstream of the native L1 poly (A) site. The single member of the intermediate transduction length sub-lineage, AC048382 (Figure 4B, top alignment section and Supp. Figure S5), likely utilised a predicted poly (A) site located 153 nucleotides downstream of the native L1 poly (A) site, but generated a transduction derived from AL118519, which is 41 nucleotides shorter than the long transductions. This transduction is 7-8 bp longer than the short transduction elements, which could equally be accounted for by variation in the reverse transcription initiation site, or variation in the position of the poly (A) addition site.
The four members of the short sub-lineage, AP001029, AC010749, AC069023 and AC002980 are polyadenylated within one nucleotide of each other, and likely use the same polyadenylation signal as the intermediate length L1 AC048382 (Figure 4B, top alignment section and Supp. Figure S5). Finally the ‘hot’ prototype element of this lineage, AC002980, has given rise to a lineage that includes two 5′ truncated elements that share sequences flanking the 3′ end of the 3′ TSD; these L1s also have different poly (A) tail lengths (Figure 4A and B and Supp. Figure S5). Insertion AC116311 apparently used a predicted poly (A) site378 nucleotides downstream of the native AC002980 poly (A) site, whereas AP001604 apparently used a predicted poly (A) site 193 nucleotides downstream of the native L1 poly (A) site. Together, these data suggest that although the presence of a poly (A) tail is critical for retrotransposition, the usage of particular poly (A) sites is highly variable and apparently local sequence context dependent, explaining why many L1s are flanked by 3′ transduced sequences. However the L1RP and LRE3 lineage members analysed here show stable poly (A) site utilisation (Supp. Figures S6 and S7), so this phenomenon could be peculiar to the AC002980 lineage.
Screening the 1000 Genomes pilot data for novel TS-ATLAS identified L1 insertions
Notably, none of the novel elements reported here was recovered in the 1016 novel insertions reported by Ewing and Kazazian's analyses of the pilot 1000 Genomes Project dataset (Ewing and Kazazian, 2011). This may be a result of the difficulty of unambiguously mapping NGS-generated short reads derived from transduced sequences which are, by definition, not single copy Additionally the lack of identification of transduction-containing elements could be due to the low sequence coverage of the pilot data. To distinguish these possibilities we screened the 1000 Genomes data for junction reads that corresponded to the sequences of TS-ATLAS identified novel (i.e. absent from the HGR) insertions. This revealed that 8 of 18 non-reference insertions (excluding L1RP and L1CYBB) were supported by junction reads (Table 1), indicating that their novelty is not due to low genome sequencing coverage. The eight insertions identified (AL050308, AC005888, AC019288, AC004740, AC048382, AC010749, AP001029 and AC067958) have a range of allele frequencies, from 0.002 to 0.328, demonstrating the 1000 Genomes dataset's ability to capture both common and rare insertions.
Discussion
The 3′ transduction of genomic sequences by L1 is a relatively common event. For example, there are at least five instances where L1s carrying3′ transductions have disrupted human genes: APC (MIM# 611731) (Miki et al., 1992); Dystrophin, DMD (MIM#300377) (Holmes et al., 1994), CYBB (MIM#300481) (Meischl et al., 2000); RP2 (MIM#300757) (Schwahn et al., 1998); and CHM (MIM#300390) (van den Hurk et al., 2003; van den Hurk et al., 2007). Here, TS-ATLAS was combined with previously published data (Myers et al., 2002; Beck et al., 2010; Goodier et al., 2000; Brouha et al., 2002; Kimberland et al., 1999) to enable the identification of 25 L1s from three active L1 transduction lineages (L1RP, AC002980, and LRE3). In genotyping the novel elements revealed by TS-ATLAS we noted that none of the elements reported here was recovered in the study by Ewing and Kazazian analysing the pilot 1000 Genomes Project dataset (Ewing and Kazazian, 2011), despite some overlap between the study participants and our genotyping panel. Screening the 1000 Genomes data for junction reads that corresponded to the sequences of TS-ATLAS-identified insertions (Supp. Table S3), revealed 8 of 18 insertions were supported by junction reads, indicating that their novelty is not due to low genome coverage in the pilot data. Thus without lineage-specific molecular genomic approaches, capturing L1 transduction lineages in genome sequencing data will require refinement of existing bioinformatic approaches.
These results demonstrate that adapting transposon display methods is an effective means to selectively analyse active L1 lineages. Additionally, for some loci, the use of frequently cutting restriction enzymes can enable more comprehensive coverage of the human genome, allowing for the identification of more lineage members. For example, whole genome in silico restriction analyses showed that only ∼12% of the genome is within suppression PCR range (<∼1000bp) when libraries are constructed with VspI, but that ∼80% of the genome is accessible using NlaIII. The relatively small number of co-amplifying fragments generated in TS-ATLAS makes fractionation and isolation of novel loci by agarose gel electrophoresis straightforward. In principle TS-ATLAS could be enhanced by the use of multiple restriction enzymes (dependent upon the particular transduction sequence), as used in a related display technique developed to analyse LTR retrotransposons in the mouse genome (Ray et al., 2011).
The application of TS-ATLAS to a small panel of 9 unrelated individuals allowed the identification of 20 novel L1s. Strikingly the majority (11) of these elements were full-length raising the possibility that these lineages are not only adept at propagating 3′ transductions but also generating full-length insertions. To estimate the rate of full-length offspring element production across the three lineages we excluded putative progenitor elements that are necessarily full-length (AL050308, AL118519, AC067958 and AC002980), as well as disease causing elements that may be more likely to be full-length due to acquisition bias (L1RP and L1CYBB), and elements of unknown length (AC069023). This results in 59% (10 of 17) of novel elements observed here being full-length, a stark contrast with the ∼30% of genomic Ta elements that are of similar size (Boissinot et al., 2000). However it is very likely that full-length insertions are selected against (Boissinot et al., 2001), leading to a reduction in average insert length over evolutionary time. To test whether the high fraction of full-length elements in transducing lineages is an intrinsic property of these elements or simply reflects their evolutionary young age could be tested using comparative quantitative retrotransposition assays of the progenitor elements, as carried out for L1RP and LRE3 previously (Farley et al., 2004, Gilbert et al., 2005).
Of these 20 L1s, one (AL050308) is the putative progenitor of a mutagenic insertion (L1RP) into the X-linked retinitis pigmentosa RP2 gene (Schwahn et al., 1998) and retrotransposes at ∼170% of the level of a ‘hot’ reference element, L1.3 (L19088 (Dombroski et al., 1993)). The allele frequency (0.149) and activity of AL050308 suggest that the L1RP lineage is actively amplifying in human populations. Previously reported members of the L1RPlineage (AL590011 and AC019288, Table 1) show activities (∼69% and ∼120% respectively, compared to L1.3) and allele frequencies (0.21 and 0.002, respectively) consistent with this hypothesis (Beck et al., 2010).
Comparison of L1s from the AC002980 transduction lineage revealed diversity in the site of L1 polyadenlyation. Of the 9 L1s related to the progenitor element, AL118519, two pairs of events used precisely the same poly (A) addition site (AC010378/AC004740, AC010749/AP001029) but the 5 other sites were used only once. Thus 9 events utilised 7 distinct poly (A) addition sites. These data are consistent with the notion that L1 polyadenylation is dependent upon local primary sequence context and can occur either at its native site or at suitable sites downstream of the L1 insertion. Indeed, these data are consistent with the observation of serial transductions, where sequences from multiple loci are sequentially mobilised by a particular L1 lineage (Holmes et al., 1994; Pickeral et al., 2000; Goodier et al., 2000; van den Hurk et al., 2003; Brouha et al., 2002). Such events are well described in the case of the LRE3 lineage and are also apparent in AC002980 and L1RP lineages (Beck et al., 2010). A consequence of a highly variable, stochastic polyadenylation mechanism is that L1 3′ ends might be expected to expand rapidly over evolution, eventually leading to the decay of the canonical Cleavage Polyadenylation Stimulating Factor 1 (CPSF1) binding site upstream of the encoded poly (A) tract. However, experimental observations suggest that the priming of Target-Primed Reverse Transcription (TPRT) in L1 retrotransposition is not strictly dependent upon a terminally located adenosine nucleotide, but can occur at internal sites in the L1 poly (A) tail (Kulpa and Moran, 2006; Ovchinnikov et al., 2001; Kopera et al., 2011). As a result, in principle, TPRT could initiate within other poly (A) tracts, such as the “original” terminal poly (A) tract, upstream of transduced sequences, a process that has been observed for Alu constructs in cell culture assays (Wagstaff et al., 2012). Such priming events would lead to loss of the transduced sequences that distinguish the lineage. A closely related group of 3 elements that may exemplify this process is transduction lineage IV (c.f. Figure 5 Beck et al. 2010 (Beck et al., 2010)). Two elements (ABC11_27 and ABC11_35) share a short 3′ transduction, which the third element lacks (ABC11_8). As the 3′ transduction in this lineage does not include the TSD of ABC11_8, we can exclude the possibility that ABC11_8 is the progenitor of ABC11_27 and ABC11_35. Another possibility is that all three elements derive from the same progenitor, but ABC11_8 has been polyadenylated at the canonical L1 CPSF1 binding site, removing the transduced sequence. Thus, populations of L1 elements, some carrying 3′ transductions and some with a canonical structure, might be maintained at equilibrium by these opposing processes. A theoretical consequence of such equilibrium would be a systematic underestimation of the number of elements belonging to particular active L1 lineages, even when applying technical innovations such as TS-ATLAS.
By selectively amplifying related active L1 elements only, we can simultaneously reduce the complexity of linkered PCR libraries and so increase their sensitivity. With effective destruction of known transduction primer targets by enzymatic suppression, the possibility of amplifying fragments present at less than constitutional levels arises. We are currently applying variants of these techniques to germline (sperm) and foetal DNA pools to detect germline and somatic mosaicism. Such mosaicism is likely to be common if endogenous elements retrotranspose in early embryogenesis (Garcia-Perez et al., 2007; van den Hurk et al., 2007; Kano et al., 2009). Moreover, three highly active transduction-containing L1s are associated with additional events, indicating they are donor ‘hotspots’ and have been active in modern human genomes (Beck et al., 2010; Kidd et al., 2010). Phylogenetic analysis of novel, active L1 elements detected by fosmid end sequencing also captured additional transduction lineages (Beck et al., 2010). Thus, application of TS-ATLAS to additional transduction families, and the use of this method within larger pedigrees will directly provide data on the activity of L1 lineages in the human population. Furthermore, as certain transduction lineages include some of the most active L1s in human populations, TS-ATLAS could be adapted to screen distinct cellular populations for elements that have retrotransposed in a tissue specific manner. Brain regions where endogenous L1 activity appears to be elevated (Muotri et al., 2005; Coufal et al., 2009; Muotri et al., 2010; Baillie et al., 2011) could be illuminating targets.
In conclusion, by utilising 3′ transduction sequences specific for active lineages it is possible to efficiently capture related active L1s. In addition TS-ATLAS is flexible and can be readily adapted to analyse different lineages of interest. One unexpected discovery enabled by TS-ATLAS is the apparent plasticity of the polyadenylation location within a transduction family. Therefore, TS-ATLAS both readily identifies amplifying lineages of L1 across multiple individuals and provides novel insights into the mechanism of endogenous L1 retrotransposition.
Supplementary Material
Acknowledgments
We thank colleagues at the University of Leicester and University of Michigan for constructive review of earlier drafts of the manuscript. J.V.M. would like to thank Dr. José Luis Garcia Perez, Mr. William Giblin, and Ms. Nancy Leff for editorial assistance.
Grant Funding: This work was supported by a Wellcome Trust Project Grant [Grant number 075163/Z/04/Z] awarded to R.M.B/Prof Sir Alec Jeffreys FRS.
C.R.B. was supported in part by National Institutes of Health training grants [Grant numbers T32GM7544, T32000040].
C.M.M was supported, in part, by a Wellcome Trust VIP Award.
J.F.W is supported by a BBSRC Doctoral Training Grant [Grant number BB/F016727/1]
J.V.M. is supported by a National Institutes of Health grant [Grant number GM060518]. The University of Michigan Cancer Center Support Grant [Grant number 5P30CA4659] helped defray sequencing costs incurred in this study. J.V.M. is an Investigator of the Howard Hughes Medical Institute.
Footnotes
Conflict of Interests Statement: The authors assert that there are no Conflicts of Interest associated with the reported research. In the interests of full disclosure J.V.M. is an inventor on the following patent: Compositions and methods of use of human retrotransposons. Application No. 60/006,831; Patent number 6,150,160; Issued November 21, 2000. His involvement with this patent is disclosed voluntarily and does not influence the content or conclusions of this study.
References
- 1000 Genomes Project Consortium. Abecasis GR, Altshuler D, Auton A, Brooks LD, Durbin RM, Gibbs RA, Hurles ME, McVean GA. A map of human genome variation from population-scale sequencing. Nature. 2010 2010 Oct 28;467(7319):1061–73. doi: 10.1038/nature09534. [DOI] [PMC free article] [PubMed] [Google Scholar]
- Altschul SF, Gish W, Miller W, Myers EW, Lipman DJ. Basic local alignment search tool. J MolBiol. 1990;215:403–10. doi: 10.1016/S0022-2836(05)80360-2. [DOI] [PubMed] [Google Scholar]
- Badge RM, Alisch RS, Moran JV. ATLAS: A system to selectively identify human-specific L1 insertions. Am J Hum Genet. 2003;72:823–38. doi: 10.1086/373939. [DOI] [PMC free article] [PubMed] [Google Scholar]
- Baillie JK, Barnett MW, Upton KR, Gerhardt DJ, Richmond TA, De Sapio F, Brennan PM, Rizzu P, Smith S, Fell M, Talbot RT, Gustincich S, Freeman TC, Mattick JS, Hume DA, Heutink P, Carninci P, Jeddeloh JA, Faulkner GJ. Somatic retrotransposition alters the genetic landscape of the human brain. Nature. 2011;479:534–537. doi: 10.1038/nature10531. [DOI] [PMC free article] [PubMed] [Google Scholar]
- Beck CR, Collier P, Macfarlane C, Malig M, Kidd JM, Eichler EE, Badge RM, Moran JV. LINE-1 retrotransposition activity in human genomes. Cell. 2010;141:1159–1170. doi: 10.1016/j.cell.2010.05.021. [DOI] [PMC free article] [PubMed] [Google Scholar]
- Beck CR, Garcia-Perez JL, Badge RM, Moran JV. LINE-1 elements in structural variation and disease. Annu Rev Genomics Hum Genet. 2011;12:187–215. doi: 10.1146/annurev-genom-082509-141802. [DOI] [PMC free article] [PubMed] [Google Scholar]
- Bennett EA, Coleman LE, Tsui C, Pittard WS, Devine SE. Natural genetic variation caused by transposable elements in humans. Genetics. 2004;168:933–951. doi: 10.1534/genetics.104.031757. [DOI] [PMC free article] [PubMed] [Google Scholar]
- Boissinot S, Chevret P, Furano AV. L1 (LINE-1) retrotransposon evolution and amplification in recent human history. Mol Biol Evol. 2000;17:915–28. doi: 10.1093/oxfordjournals.molbev.a026372. [DOI] [PubMed] [Google Scholar]
- Boissinot S, Entezam A, Furano AV. Selection against deleterious LINE-1-containing loci in the human lineage. Mol Biol Evol. 2001;18(6):926–35. doi: 10.1093/oxfordjournals.molbev.a003893. [DOI] [PubMed] [Google Scholar]
- Broude NE, Zhang L, Woodward K, Englert D, Cantor CR. Multiplex allele-specific target amplification based on PCR suppression. Proc Natl Acad Sci U S A. 2001;98:206–11. doi: 10.1073/pnas.98.1.206. [DOI] [PMC free article] [PubMed] [Google Scholar]
- Brouha B, Meischl C, Ostertag E, de Boer M, Zhang Y, Neijens H, Roos D, KH H., Jr Evidence consistent with human L1 retrotransposition in maternal meiosis I. Am J Hum Genet. 2002;71:327–36. doi: 10.1086/341722. [DOI] [PMC free article] [PubMed] [Google Scholar]
- Brouha B, Schustak J, Badge RM, Lutz-Prigge S, Farley AH, Moran JV, KH H., Jr Hot L1s account for the bulk of retrotransposition in the human population. Proc Natl Acad Sci U S A. 2003;100:5280–5. doi: 10.1073/pnas.0831042100. [DOI] [PMC free article] [PubMed] [Google Scholar]
- Buzdin A, Ustyugova S, Gogvadze E, Vinogradova T, Lebedev Y, Sverdlov E. A new family of chimeric retrotranscripts formed by a full copy of U6 small nuclear RNA fused to the 3′ terminus of l1. Genomics. 2002;80:402–6. doi: 10.1006/geno.2002.6843. [DOI] [PubMed] [Google Scholar]
- Coufal NG, Garcia-Perez JL, Peng GE, Yeo GW, Mu Y, Lovci MT, Morell M, O'Shea KS, Moran JV, Gage FH. L1 retrotransposition in human neural progenitor cells. Nature. 2009;460:1127–1131. doi: 10.1038/nature08248. [DOI] [PMC free article] [PubMed] [Google Scholar]
- Dewannieux M, Esnault C, Heidmann T. LINE-mediated retrotransposition of marked alu sequences. Nat Genet. 2003;35:41–8. doi: 10.1038/ng1223. [DOI] [PubMed] [Google Scholar]
- Dombroski BA, Mathias SL, Nanthakumar E, Scott AF, H KH., Jr Isolation of an active human transposable element. Science. 1991;254:1805–8. doi: 10.1126/science.1662412. [DOI] [PubMed] [Google Scholar]
- Dombroski BA, Scott AF, KH H., Jr Two additional potential retrotransposons isolated from a human L1 subfamily that contains an active retrotransposable element. Proc Natl Acad Sci U S A. 1993;90:6513–7. doi: 10.1073/pnas.90.14.6513. [DOI] [PMC free article] [PubMed] [Google Scholar]
- Esnault C, Maestre J, Heidmann T. Human LINE retrotransposons generate processed pseudogenes. Nat Genet. 2000;24:363–7. doi: 10.1038/74184. [DOI] [PubMed] [Google Scholar]
- Ewing AD, Kazazian HH., Jr High-throughput sequencing reveals extensive variation in human-specific L1 content in individual human genomes. Genome Res. 2010;20:1262–70. doi: 10.1101/gr.106419.110. [DOI] [PMC free article] [PubMed] [Google Scholar]
- Ewing AD, Kazazian HH., Jr Whole-genome resequencing allows detection of many rare LINE-1 insertion alleles in humans. Genome Res. 2011;21:985–990. doi: 10.1101/gr.114777.110. [DOI] [PMC free article] [PubMed] [Google Scholar]
- Farley AH, Luning Prak ET, Kazazian HH., Jr More active human L1 retrotransposons produce longer insertions. Nucleic Acids Res. 2004 Jan 23;32(2):502–10. doi: 10.1093/nar/gkh202. [DOI] [PMC free article] [PubMed] [Google Scholar]
- Feng Q, Moran JV, KH H, Jr, Boeke JD. Human L1 retrotransposon encodes a conserved endonuclease required for retrotransposition. Cell. 1996;87:905–16. doi: 10.1016/s0092-8674(00)81997-2. [DOI] [PubMed] [Google Scholar]
- Garcia-Perez JL, Marchetto MC, Muotri AR, Coufal NG, Gage FH, O'Shea KS, Moran JV. LINE-1 retrotransposition in human embryonic stem cells. Hum Mol Genet. 2007;16:1569–1577. doi: 10.1093/hmg/ddm105. [DOI] [PubMed] [Google Scholar]
- Gilbert N, Lutz S, Morrish TA, Moran JV. Multiple fates of L1 retrotransposition intermediates in cultured human cells. Mol Cell Biol. 2005;25:7780–7795. doi: 10.1128/MCB.25.17.7780-7795.2005. [DOI] [PMC free article] [PubMed] [Google Scholar]
- Goodier JL, Ostertag EM, KH H., Jr Transduction of 3′-flanking sequences is common in L1 retrotransposition. Hum Mol Genet. 2000;9:653–7. doi: 10.1093/hmg/9.4.653. [DOI] [PubMed] [Google Scholar]
- Hancks DC, Goodier JL, Mandal PK, Cheung LE, Kazazian HH., Jr Retrotransposition of marked SVA elements by human L1s in cultured cells. Hum Mol Genet. 2011;20:3386–3400. doi: 10.1093/hmg/ddr245. [DOI] [PMC free article] [PubMed] [Google Scholar]
- Holmes SE, Dombroski BA, Krebs CM, Boehm CD, KH H., Jr A new retrotransposable human L1 element from the LRE2 locus on chromosome 1q produces a chimaeric insertion. Nat Genet. 1994;7:143–8. doi: 10.1038/ng0694-143. [DOI] [PubMed] [Google Scholar]
- Huang CR, Schneider AM, Lu Y, Niranjan T, Shen P, Robinson MA, Steranka JP, Valle D, Civin CI, Wang T, Wheelan SJ, Ji H, Boeke JD, Burns KH. Mobile interspersed repeats are major structural variants in the human genome. Cell. 2010;141:1171–1182. doi: 10.1016/j.cell.2010.05.026. [DOI] [PMC free article] [PubMed] [Google Scholar]
- Iskow RC, McCabe MT, Mills RE, Torene S, Pittard WS, Neuwald AF, Van Meir EG, Vertino PM, Devine SE. Natural mutagenesis of human genomes by endogenous retrotransposons. Cell. 2010;141:1253–1261. doi: 10.1016/j.cell.2010.05.020. [DOI] [PMC free article] [PubMed] [Google Scholar]
- Kano H, Godoy I, Courtney C, Vetter MR, Gerton GL, Ostertag EM, Kazazian HH., Jr L1 retrotransposition occurs mainly in embryogenesis and creates somatic mosaicism. Genes Dev. 2009;23:1303–1312. doi: 10.1101/gad.1803909. [DOI] [PMC free article] [PubMed] [Google Scholar]
- Kent WJ. BLAT--the BLAST-like alignment tool. Genome Res. 2002;12:656–664. doi: 10.1101/gr.229202. [DOI] [PMC free article] [PubMed] [Google Scholar]
- Kidd JM, Graves T, Newman TL, Fulton R, Hayden HS, Malig M, Kallicki J, Kaul R, Wilson RK, Eichler EE. A human genome structural variation sequencing resource reveals insights into mutational mechanisms. Cell. 2010;143:837–847. doi: 10.1016/j.cell.2010.10.027. [DOI] [PMC free article] [PubMed] [Google Scholar]
- Kimberland ML, V D, Prchal J, Schwahn U, Berger W, H KH., Jr Full-length human L1 insertions retain the capacity for high frequency retrotransposition in cultured cells. Hum Mol Genet. 1999;8:1557–60. doi: 10.1093/hmg/8.8.1557. [DOI] [PubMed] [Google Scholar]
- Kopera HC, Moldovan JB, Morrish TA, Garcia-Perez JL, Moran JV. Similarities between long interspersed element-1 (LINE-1) reverse transcriptase and telomerase. Proc Natl Acad Sci U S A. 2011;108:20345–20350. doi: 10.1073/pnas.1100275108. [DOI] [PMC free article] [PubMed] [Google Scholar]
- Kulpa DA, Moran JV. Cis-preferential LINE-1 reverse transcriptase activity in ribonucleoprotein particles. Nat Struct Mol Biol. 2006;13:655–60. doi: 10.1038/nsmb1107. [DOI] [PubMed] [Google Scholar]
- Lander ES, Linton LM, Birren B, Nusbaum C, Zody MC, Baldwin J, Devon K, Dewar K, et al. Initial sequencing and analysis of the human genome. Nature. 2001;409:860–921. doi: 10.1038/35057062. [DOI] [PubMed] [Google Scholar]
- Lavrentieva I, Broude NE, Lebedev Y, G II, Lukyanov SA, Smith CL, Sverdlov ED. High polymorphism level of genomic sequences flanking insertion sites of human endogenous retroviral long terminal repeats. FEBS Lett. 1999;443:341–7. doi: 10.1016/s0014-5793(99)00004-6. [DOI] [PubMed] [Google Scholar]
- Marchani EE, Xing J, Witherspoon DJ, Jorde LB, Rogers AR. Estimating the age of retrotransposon subfamilies using maximum likelihood. Genomics. 2009;94:78–82. doi: 10.1016/j.ygeno.2009.04.002. [DOI] [PMC free article] [PubMed] [Google Scholar]
- Meischl C, Boer M, Ahlin A, Roos D. A new exon created by intronic insertion of a rearranged LINE-1 element as the cause of chronic granulomatous disease. Eur J Hum Genet. 2000;8:697–703. doi: 10.1038/sj.ejhg.5200523. [DOI] [PubMed] [Google Scholar]
- Miki Y, Nishisho I, Horii A, Miyoshi Y, Utsunomiya J, Kinzler KW, Vogelstein B, Nakamura Y. Disruption of the APC gene by a retrotransposal insertion of L1 sequence in a colon cancer. Cancer Res. 1992;52:643–645. [PubMed] [Google Scholar]
- Mills RE, Walter K, Stewart C, Handsaker RE, Chen K, Alkan C, Abyzov A, Yoon SC, Ye K, Cheetham RK, Chinwalla A, Conrad DF, Fu Y, Grubert F, Hajirasouliha I, Hormozdiari F, Iakoucheva LM, Iqbal Z, Kang S, Kidd JM, Konkel MK, Korn J, Khurana E, Kural D, Lam HY, Leng J, Li R, Li Y, Lin CY, Luo R, Mu XJ, Nemesh J, Peckham HE, Rausch T, Scally A, Shi X, Stromberg MP, Stutz AM, Urban AE, Walker JA, Wu J, Zhang Y, Zhang ZD, Batzer MA, Ding L, Marth GT, McVean G, Sebat J, Snyder M, Wang J, Ye K, Eichler EE, Gerstein MB, Hurles ME, Lee C, McCarroll SA, Korbel JO 1000 Genomes Project. Mapping copy number variation by population-scale genome sequencing. Nature. 2011;470:59–65. doi: 10.1038/nature09708. [DOI] [PMC free article] [PubMed] [Google Scholar]
- Moran JV, DeBerardinis RJ, KH H., Jr Exon shuffling by L1 retrotransposition. Science. 1999;283:1530–4. doi: 10.1126/science.283.5407.1530. [DOI] [PubMed] [Google Scholar]
- Moran JV, Holmes SE, Naas TP, DeBerardinis RJ, Boeke JD, KH H., Jr High frequency retrotransposition in cultured mammalian cells. Cell. 1996;87:917–27. doi: 10.1016/s0092-8674(00)81998-4. [DOI] [PubMed] [Google Scholar]
- Muotri AR, Chu VT, Marchetto MC, Deng W, Moran JV, Gage FH. Somatic mosaicism in neuronal precursor cells mediated by L1 retrotransposition. Nature. 2005;435:903–10. doi: 10.1038/nature03663. [DOI] [PubMed] [Google Scholar]
- Muotri AR, Marchetto MC, Coufal NG, Oefner R, Yeo G, Nakashima K, Gage FH. L1 retrotransposition in neurons is modulated by MeCP2. Nature. 2010;468:443–446. doi: 10.1038/nature09544. [DOI] [PMC free article] [PubMed] [Google Scholar]
- Myers JS, Vincent BJ, Udall H, Watkins WS, Morrish TA, Kilroy GE, Swergold GD, Henke J, Henke L, Moran JV, Jorde LB, Batzer MA. A comprehensive analysis of recently integrated human ta L1 elements. Am J Hum Genet. 2002;71:312–26. doi: 10.1086/341718. [DOI] [PMC free article] [PubMed] [Google Scholar]
- Ostertag EM, Goodier JL, Zhang Y, H KH., Jr SVA elements are nonautonomousretrotransposons that cause disease in humans. Am J Hum Genet. 2003;73:1444–51. doi: 10.1086/380207. [DOI] [PMC free article] [PubMed] [Google Scholar]
- Ovchinnikov I, Troxel AB, Swergold GD. Genomic characterization of recent human LINE-1 insertions: Evidence supporting random insertion. Genome Research. 2001;11:2050–8. doi: 10.1101/gr.194701. [DOI] [PMC free article] [PubMed] [Google Scholar]
- Pickeral OK, Makalowski W, Boguski MS, Boeke JD. Frequent human genomic DNA transduction driven by LINE-1 retrotransposition. Genome Res. 2000;10:411–5. doi: 10.1101/gr.10.4.411. [DOI] [PMC free article] [PubMed] [Google Scholar]
- Ray A, Rahbari R, Badge RM. IAP display: A simple method to identify mouse strain specific IAP insertions. Mol Biotechnol. 2011;47:243–252. doi: 10.1007/s12033-010-9338-6. [DOI] [PMC free article] [PubMed] [Google Scholar]
- Sassaman DM, Dombroski BA, Moran JV, Kimberland ML, Naas TP, DeBerardinis RJ, Gabriel A, Swergold GD, KH H., Jr Many human L1 elements are capable of retrotransposition. Nat Genet. 1997;16:37–43. doi: 10.1038/ng0597-37. [DOI] [PubMed] [Google Scholar]
- Schwahn U, Lenzner S, Dong J, Feil S, Hinzmann B, van Duijnhoven G, Kirschner R, Hemberger M, Bergen AA, Rosenberg T, Pinckers AJ, Fundele R, Rosenthal A, Cremers FP, Ropers HH, Berger W. Positional cloning of the gene for X-linked retinitis pigmentosa 2. Nat Genet. 1998;19:327–32. doi: 10.1038/1214. [DOI] [PubMed] [Google Scholar]
- Scott AF, Schmeckpeper BJ, Abdelrazik M, Comey CT, O'Hara B, Rossiter JP, Cooley T, Heath P, Smith KD, Margolet L. Origin of the human L1 elements: Proposed progenitor genes deduced from a consensus DNA sequence. Genomics. 1987;1:113–25. doi: 10.1016/0888-7543(87)90003-6. [DOI] [PMC free article] [PubMed] [Google Scholar]
- Seleme Mdel C, Vetter MR, Cordaux R, Bastone L, Batzer MA, KH H., Jr Extensive individual variation in L1 retrotransposition capability contributes to human genetic diversity. Proc Natl Acad Sci U S A. 2006;103:6611–6. doi: 10.1073/pnas.0601324103. [DOI] [PMC free article] [PubMed] [Google Scholar]
- Sheen FM, Sherry ST, Risch GM, Robichaux M, Nasidze I, Stoneking M, Batzer MA, Swergold GD. Reading between the LINEs: Human genomic variation induced by LINE-1 retrotransposition. Genome Res. 2000;10:1496–508. doi: 10.1101/gr.149400. [DOI] [PMC free article] [PubMed] [Google Scholar]
- Simmonds P, Smith DB. Structural constraints on RNA virus evolution. J Virol. 1999;73:5787–5794. doi: 10.1128/jvi.73.7.5787-5794.1999. [DOI] [PMC free article] [PubMed] [Google Scholar]
- Solyom S, Ewing AD, Hancks DC, Takeshima Y, Awano H, Matsuo M, Kazazian HH., Jr Pathogenic orphan transduction created by a nonreference LINE-1 retrotransposon. Hum Mutat. 2012;33:369–371. doi: 10.1002/humu.21663. [DOI] [PMC free article] [PubMed] [Google Scholar]
- Swergold GD. Identification, characterization, and cell specificity of a human LINE- 1 promoter. Mol Cell Biol. 1990;10:6718–29. doi: 10.1128/mcb.10.12.6718. [DOI] [PMC free article] [PubMed] [Google Scholar]
- van den Hurk JA, Meij IC, Seleme MC, Kano H, Nikopoulos K, Hoefsloot LH, Sistermans EA, de Wijs IJ, Mukhopadhyay A, Plomp AS, de Jong PT, Kazazian HH, Cremers FP. L1 retrotransposition can occur early in human embryonic development. Hum Mol Genet. 2007;16:1587–1592. doi: 10.1093/hmg/ddm108. [DOI] [PubMed] [Google Scholar]
- van den Hurk JA, van de Pol DJ, Wissinger B, van Driel MA, Hoefsloot LH, de Wijs IJ, van den Born LI, Heckenlively JR, Brunner HG, Zrenner E, Ropers HH, Cremers FP. Novel types of mutation in the choroideremia (CHM) gene: A full-length L1 insertion and an intronic mutation activating a cryptic exon. Hum Genet. 2003;113:268–75. doi: 10.1007/s00439-003-0970-0. [DOI] [PubMed] [Google Scholar]
- Wagstaff BJ, Hedges DJ, Derbes RS, Campos Sanchez R, Chiaromonte F, Makova KD, Roy-Engel AM. Rescuing alu: Recovery of new inserts shows LINE-1 preserves alu activity through A-tail expansion. PLoS Genet. 2012;8:e1002842. doi: 10.1371/journal.pgen.1002842. [DOI] [PMC free article] [PubMed] [Google Scholar]
- Weber MJ. Mammalian small nucleolar RNAs are mobile genetic elements. PLoS Genet. 2006;2:e205. doi: 10.1371/journal.pgen.0020205. [DOI] [PMC free article] [PubMed] [Google Scholar]
- Wei W, Gilbert N, Ooi SL, Lawler JF, Ostertag EM, Kazazian HH, Boeke JD, Moran JV. Human L1 retrotransposition: Cis preference versus trans complementation. Mol Cell Biol. 2001;21:1429–39. doi: 10.1128/MCB.21.4.1429-1439.2001. [DOI] [PMC free article] [PubMed] [Google Scholar]
- Wei W, Morrish TA, Alisch RS, Moran JV. A transient assay reveals that cultured human cells can accommodate multiple LINE-1 retrotransposition events. Anal Biochem. 2000;284:435–8. doi: 10.1006/abio.2000.4675. [DOI] [PubMed] [Google Scholar]
- Zhang Z, Schwartz S, Wagner L, Miller W. A greedy algorithm for aligning DNA sequences. J Comput Biol. 2000;1-2:203–14. doi: 10.1089/10665270050081478. [DOI] [PubMed] [Google Scholar]
Associated Data
This section collects any data citations, data availability statements, or supplementary materials included in this article.