

Abstract
It has been observed experimentally that cells from failing hearts exhibit elevated levels of reactive oxygen species (ROS) upon increases in energetic workload. One proposed mechanism for this behavior is mitochondrial Ca2+ mismanagement that leads to depletion of ROS scavengers. Here, we present a computational model to test this hypothesis. Previously published models of ROS production and scavenging were combined and reparameterized to describe ROS regulation in the cellular environment. Extramitochondrial Ca2+ pulses were applied to simulate frequency-dependent changes in cytosolic Ca2+. Model results show that decreased mitochondrial Ca2+uptake due to mitochondrial Ca2+ uniporter inhibition (simulating Ru360) or elevated cytosolic Na+, as in heart failure, leads to a decreased supply of NADH and NADPH upon increasing cellular workload. Oxidation of NADPH leads to oxidation of glutathione (GSH) and increased mitochondrial ROS levels, validating the Ca2+ mismanagement hypothesis. The model goes on to predict that the ratio of steady-state [H2O2]m during 3Hz pacing to [H2O2]m at rest is highly sensitive to the size of the GSH pool. The largest relative increase in [H2O2]m in response to pacing is shown to occur when the total GSH and GSSG is close to 1 mM, whereas pool sizes below 0.9 mM result in high resting H2O2 levels, a quantitative prediction only possible with a computational model.
Introduction
Oxidative stress has been shown in patients experiencing heart failure (HF) through elevated levels of biomarkers in the bloodstream and pericardial fluid (1–3). In animal models of HF, oxidative stress is also present and has been proposed to be a consequence of both increased mitochondrial reactive oxygen species (ROS) production (4) and decreased antioxidant capacity (5–7). Moreover, expression of a mitochondrially targeted H2O2 scavenger enzyme, catalase, has been shown to attenuate age-related cardiac dysfunction, oxidative damage, and mortality (8).
Frequent changes in heart rate equating to changes in cardiac workload require tight regulation of ATP supply and demand. This regulation of ATP is carried out by ADP and Ca2+ signals. Experimental data shows that changes in [Ca2+]i and [ADP]i induced by changes in pacing frequency exert differing control on the mitochondrial NADH redox state, sometimes referred to as push and pull, respectively. Increases in cytosolic ADP (pull conditions) are conveyed to the mitochondria via the adenine nucleotide transporter and activation of the ATP synthase, which stimulates the respiratory rate and oxidizes NADH. At the same time, increased cytosolic Ca2+ transients lead to increased mitochondrial Ca2+ via the mitochondrial Ca2+ uniporter (mCU). Elevated mitochondrial Ca2+ stimulates the Ca2+-sensitive enzymes of the tricarboxylic acid (TCA) cycle, leading to enhanced production of NADH. These two complementary processes serve to maintain homeostasis of NADH redox potential so that mitochondrial energy production can be maintained. NADH levels in the mitochondrial matrix are linked to NADPH levels through the proton-translocating transhydrogenase (THD). Nicotinamide adenine dinucleotide phosphate (NADPH) can also be produced in the matrix by the actions of the NADP+-dependent isocitrate dehydrogenase and malic enzyme, two enzymes that also depend on TCA cycle intermediates. NADPH plays a critical role in maintaining antioxidant capacity through the NADPH-dependent enzymes glutathione reductase (GR) and thioredoxin reductase (TrxR), maintaining the reduced state of the glutathione (GSH) and thioredoxin (Trx) antioxidant pools, which are oxidized as a consequence of H2O2 scavenging by glutathione peroxidase and peroxiredoxin, respectively. [Ca2+]m thus plays a key role in regulating mitochondrial ROS scavenging through coupling between the generation of redox equivalents for energy generation and the antioxidant pathways.
Cytosolic Na+ levels have been shown to be elevated in HF (9–11), and contribute to mitochondrial ROS production (12–14). Elevated cytosolic Na+ increases the rate of the mitochondrial Na+-Ca2+ exchanger (mNCE), which promotes mitochondrial Ca2+ efflux and decreases the mitochondria’s ability to accumulate Ca2+ during pacing. Without Ca2+-induced TCA cycle stimulation, NADH and NADPH become more oxidized and are unable to recharge the antioxidant systems, which is hypothesized to lead to the high ROS emission seen in HF cells at high pacing frequencies (15). This proposed mechanism of energy insufficiency in HF emphasizes the importance of Ca2+ signaling at the cellular and mitochondrial levels.
Previous work (16,17) has endeavored to demonstrate the impact of variations in scavenging capacity on observed ROS overflow from mitochondria. Although the models furthered the understanding of the contribution of ROS scavenging to ROS overflow, none of them included a physiological model of ROS production. Several models of ROS production exist (18–25), each having various strengths and weaknesses. We recently developed a model of ROS production (25) that constrained respiratory rate, electron transport chain (ETC) redox state, and ROS production rates from complexes I and III using experimental data. This model of ROS production was chosen as a module for the model presented here because of its extensive validation using experimental data from cardiac mitochondria wherever possible. In this work we combine detailed models of ROS scavenging and ROS production to understand how these two mechanisms control ROS levels in HF.
Methods
Model description
Fig. 1 depicts the components of the cardiac ROS production and scavenging pathways represented in the model. Briefly, the electron transport chain with ROS production comes from the Gauthier et al. (25) electron transport chain and reactive oxygen species (ETC-ROS) model. The only modifications were scaling ROS production to agree with experimental data in the absence of scavenging (16) and slight changes to complex I for the cellular model (see the Supporting Material for details). ROS scavenging was derived from the Kembro et al. (17) mitochondrial energetic-redox (ME-R) model with some changes to parameters as noted in the Supporting Material. Both of these models represent guinea pig cardiac mitochondria and were fit to data from such preparations wherever possible.
Figure 1.
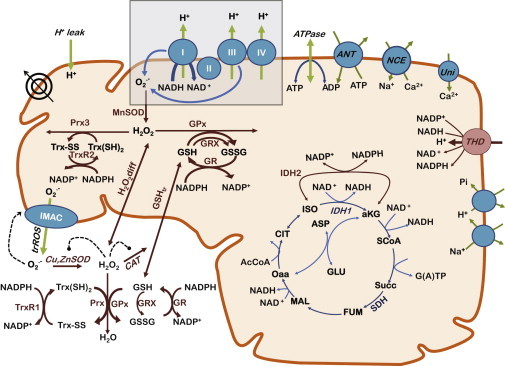
Overview of the mitochondrial model, including ROS production and scavenging pathways. The model presented here builds upon the model of Kembro et al. (17) by incorporating a detailed, mechanistic model of the ETC (gray box) by Gauthier et al. (25) that determines respiratory and superoxide production fluxes. The combined model features mechanistic ROS production from the ETC, mitochondrial matrix scavenging, transport of H2O2 across the inner mitochondrial membrane, extramitochondrial scavenging, NADH, and NADPH production by the TCA cycle, NAD+/NADH and NADP+/NADPH interconversion by THD, and mitochondrial ion handling. For simulations of cellular behavior, the extramitochondrial space represents the cytosol. See the Supporting Material for specific parameter changes. To see this figure in color, go online.
Computational methods
The mitochondrial model introduced here consists of 37 nonlinear ordinary differential equations. The equations were implemented in MATLAB 7.1 (The MathWorks, Natick, MA). Model parameters were optimized using the fmincon function from MATLAB. For the protocols described, the model was run from steady-state resting initial conditions, when the magnitude of each time derivative was ≤10−5 mM/ms. Initial conditions are given in the Supporting Material.
Model integration
The ETC-ROS model was successfully incorporated into the ME-R isolated mitochondria model with minimal changes. It was necessary to add explicit dependence on succinate and malate and inhibition by oxaloacetate to the equation for succinate dehydrogenase to couple the enzyme to the TCA cycle. ROS production rates were scaled to match those of the ME-R model. The behavior of isolated mitochondria is often compared between state 4 respiration (energized with substrates, but in the absence of ADP) and state 3 respiration (energized with substrates in the presence of ADP) to deduce the effects of rapid respiration rates associated with ATP production in state 3. A comparison of state 4 and state 3 steady-state behaviors from experimental data, the ME-R model, and the combined ME-R and ETC-ROS model are presented in Table 1.
Table 1.
Quantitative comparison of energetic measurements in the absence of scavenging
| Variable | Experimental |
Kembro et al. model |
New model |
|||
|---|---|---|---|---|---|---|
| St 4 | St 3 | St 4 | St 3 | St 4 | St 3 | |
| Respiration (nmol/mg protein/min) | 46 ± 2.6 | 152 ± 8.5 | 27.92 | 58.52 | 34.78 | 59.41 |
| H2O2 emission (nmol/mg protein/min) | 0.56 ± 0.01 | 0.48 ± 0.06 | 0.48 | 0.46 | 0.2582 | 0.1949 |
| H2O2 emission as % of respiratory flux | 0.74 | 0.29 | 1.7 | 0.78 | 0.74 | 0.33 |
| ΔΨm (mV) | 167 ± 7 | 142 ± 2 | 192.5 | 168 | 194.5 | 168.9 |
| NADH (%) | 98 ± 4 | 78 ± 5 | 96.5 | 61.3 | 94.6 | 65.2 |
Energetic and ROS-related measurements are compared across experimental data from Aon et al. (16), the Kembro et al. model (17), and the model presented here. For simulations state 4 ADP = 0.01 mM and state 3 ADP = 1.0 mM. Kembro et al. (17) data were simulated from code supplied by the authors. The shunt value for that code was 0.018 for state 4 and 0.008 for state 3. A scale factor of 2 × 60e3 was used to convert from mM/ms to nmol/min/mg protein.
A significant achievement of this model is that ROS production is modulated between state 3 and state 4 without a change in the model parameters. This is also evident in Fig. S1 in the Supporting Material showing the effect of inhibition of the GSH or Trx scavenging systems in state 3 and state 4. The present model maintains the proportional control established by Kembro et al. (17) such that inhibition of the Trx system leads to higher H2O2 emission fluxes than inhibition of the GSH system, as has been shown experimentally for guinea pig (17). The dynamics of the ME-R model were also maintained after incorporation of the ETC-ROS model. See Fig. S2 for the comparison of substrate and ADP addition protocols before and after the incorporation of the ETC-ROS model.
Parameter fitting for mitochondrial model in the myocyte
The ROS scavenging model introduced in Kembro et al. (17) was originally parameterized to reproduce steady-state ROS emission data from isolated mitochondria. To reproduce kinetic data on ROS emission from isolated myocytes, some parameters were refit. Isocitrate dehydrogenase NADP+ (IDH2) was refit using in vitro parameters from Popova et al. 2007 (26). The random bi-bi enzyme kinetics model describing the activity of the THD based on the randomly ordered binding of two substrates and the randomly ordered unbinding of two products presented in Kembro et al. (17) was modified to satisfy the thermodynamic constraint from Sazanov and Jackson (27). Kinetic parameters for glutathione peroxidase were refit to improve GSH sensitivity as compared to GSH-dependence data from Aon et al. 2010 (28) (their Fig. 10 D). The Michaelis-Menten constant of glutathione reductase for NADPH was increased to improve sensitivity over the range of observed NADPH values in the model. Other model parameters were modified to better represent the conditions of the mitochondria in isolated myocytes. Refer to the Supporting Material for more details.
Stimulus protocols
During pacing, the mitochondrial model was subjected to changes of extramitochondrial Ca2+ and ADP concentrations to simulate a change in energetic workload stimulated by the increased demand for ATP during contraction. [Ca2+]i transients were simulated as rectangular pulses of Ca2+ from a diastolic level of 0.1–1 μM with a width of 200 ms. Cytosolic ADP was increased from a basal level of 0.1–1.0 mM with a time constant of 2 min to simulate the energy consumption by the contractile machinery in the cytosol. Isoproterenol was present in the experiments used for comparison to accelerate the increase of [Ca2+]i transient peaks from rest to the steady-state pacing value near 1 μM. The effects of isoproterenol were not explicitly simulated in the model other than to use the 1 μM value for peak cytosolic Ca2+. For the myocyte model simulations, pH and mitochondrial phosphate were held constant.
Results
Altered Ca2+ regulation by Ru360 increases ROS
A comparison of model behavior from rest to 3Hz pacing, with or without 90% uniporter block (to simulate Ru360, a mCU blocker), is shown in Fig. 2, along with experimental data for the same protocol from Kohlhaas et al. (15). For control conditions, the onset of pacing increases cytosolic transients (Fig. 2, A - model and B - experiment), which leads to elevation of mitochondrial Ca2+, as shown in the model (Fig. 2 C, gray) and experiment (Fig. 2 D, open symbols). However, if mitochondrial Ca2+ regulation is altered by a decrease in mCU flux, mitochondrial Ca2+ uptake is then severely compromised, as shown in the model (Fig. 2 C, black) and in experiment (of Fig. 2 D, solid symbols). In the event of altered Ca2+ regulation, NADH control is also compromised. In this case, there is no Ca2+-induced stimulation of the TCA cycle and NADH becomes oxidized, as shown in the model (Fig. 2 E, black) and in experiment (Fig. 2 F, solid). As in the experimental data (15) shown in Fig. 2 F (open symbols), model control NADH levels show only a small variation after the onset of pacing (Fig. 2 E, gray). In contrast, simulations with mCU inhibition show a significant decline in NADH upon pacing with little to no recovery (Fig. 2 E, black). Insufficient NADH in the mCU inhibition protocol is associated with increased H2O2 over control, as shown in the model (Fig. 2 G) and in experiment (Fig. 2 H).
Figure 2.
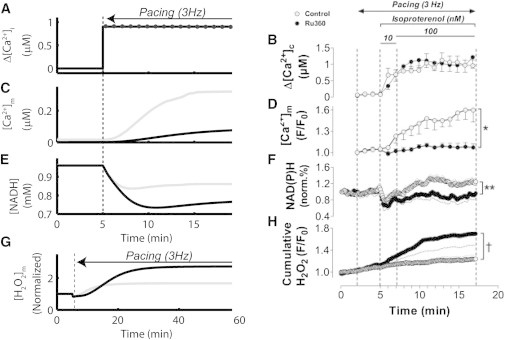
Ru360 inhibits Ca2+ uptake, decreases NADH supply, and increases H2O2 release at high workloads. (A) Model cytosolic Ca2+ was held constant at 0.1 μM before pacing and simulated after the onset of pacing as 200 ms periodic pulses of 1 μM from a resting level of 0.1 μM. (B) Experimental [Ca2+]i transients exhibit similar values before pacing and after the addition of isoproterenol. (C) Control [Ca2+]m in the model accumulates to over 0.3 μM for control (gray), whereas uniporter block limits accumulation to below 0.1 μM for the first 15 min of pacing (black). (D) Fluorescence signal for [Ca2+]m shows similar kinetics to model data. (E) In simulations, uniporter inhibition (black) results in more extensive oxidation of NADH than for control (gray) resulting in 0.86 mM NADH after 15 min pacing for control compared to 0.77 mM for mCU inhibition. (F) Experimental NADH for Ru360 (solid symbols) is ∼80% oxidized during pacing with control NADH (open symbols) recovering to levels higher than at rest. (G) Although an increase in workload elevates mitochondrial [H2O2] for both control (gray) and uniporter block (black) simulations, ROS for uniporter block conditions is 2.7× higher after pacing than at rest compared to 1.67× for control. (H) Experimental data also show elevated [H2O2] for Ru360 compared to control, but with faster kinetics. Note that panel (C) of simulations shows a longer simulation. Experimental data reproduced from Kohlhaas et al. (15) 90% reduction in mCU flux is used to simulate Ru360 application in the model.
NADPH plays a critical role in the mitochondrial scavenging system. As NADH becomes oxidized after the onset of pacing at 5 min (Fig. 2 E), THD transfers electrons from NADPH to NAD+, thus decreasing NADPH levels as shown in Fig. 3 A. For simulations with mCU block, the NADH depletion during pacing is larger, leading to a more substantial decrease in NADPH (Fig. 3 A, gray line). As NADPH levels decrease, the rate of GR activity decreases and GSH becomes more oxidized, as shown in Fig. 3 B. A similar mechanism applies to TrxR and Trx (see Fig. S3), though to a lesser degree. It is the decrease in GSH concentration that links the oxidation of NADH to increased ROS release from the mitochondria. As GSH becomes oxidized, the scavenging abilities of the mitochondria are decreased, leading to an accumulation of H2O2 in the matrix and a higher rate of release into the cytosol. Note that the GSH redox potentials at rest and during pacing predicted by the model agree well with the 280–250 mV range of GSH redox potential measured experimentally in isolated mitochondria by Aon et al. (28) in response to a similar protocol in which antioxidant depletion increases ROS release (their Fig. 10 D).
Figure 3.
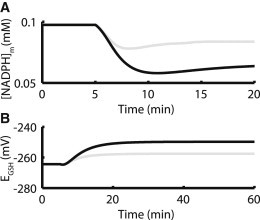
mCU inhibition prevents NADPH recovery after onset of pacing, which depletes GSH. (A) Model simulations predict that NADPH is ∼40% oxidized in the presence of 90% mCU inhibition (black), compared to an approximate 20% decrease for control (gray). (B) Decreases in NADPH drive oxidation of GSH, which is more extensive in the presence of mCU inhibition. GSH redox potentials for mCU inhibition correspond well with the range given in Fig. 10 of Aon et al. 2010 for ROS overflow in isolated mitochondria.
Development of the isolated ETC-ROS model included validation of steady-state ROS production against different constant NADH levels and ΔΨ values obtained from experimental data in isolated mitochondria (25). Results from this previous study show that ROS production increases with ΔΨ and with increased reduction of NADH. After this model was incorporated into the dynamically varying mitochondrial environment, Ca2+ and ADP transients were applied to simulate pacing. Immediately after the onset of pacing, ΔΨ and NADH decreased. The immediate drop in both of these variables leads to an abrupt decrease in ROS production with and without mCU inhibition, according to the model (Fig. 4). As mitochondrial Ca2+ increases in control simulations, NADH production is stimulated. Higher NADH concentrations increase the activity of complex I of the ETC, which uses electrons from NADH to reduce ubiquinone (Q) to ubiquinol (QH2). As the total mitochondrial ubiquinone pool (Q pool) becomes more reduced ROS production is increased, leading to a new, to our knowledge, steady-state level slightly above the resting rate. With decreased Ca2+ stimulation of NADH production in the mCU inhibition simulations, the extent of reduction of the Q pool is not as great and steady-state ROS production remains lower than at rest. To observe the increased ROS release for Ru360 shown experimentally, the decrease in scavenging capacity (see Fig. 3) must outweigh the decrease in ROS production (Fig. 4). This observation helps explain the slow kinetics of model [H2O2]m accumulation under mCU block. Even though GSH oxidation after the onset of pacing reduces scavenging, the drop in ROS production shown in Fig. 4 initially outweighs the decrease in scavenging. However, as GSH continues to oxidize (Fig. 3 B) the decrease in scavenging begins to overcome the decrease in ROS production, leading to the slow increase in [H2O2]m shown in Fig. 2 G.
Figure 4.
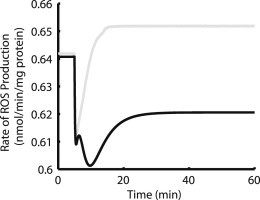
Control ROS production increases upon pacing, whereas mCU inhibition causes decrease. Gray line is control and black line is 90% mCU block. For mCU block, ΔΨ decreases more upon stimulation than for control. ΔΨ has more control over ROS production than NADH in this model. The combination of these two factors and the different rates at which they change also accounts for the complex kinetics between 5 and 10 min.
Elevated [Na+]i alters Ca2+ regulation and increases ROS
Cytosolic Na+ has been experimentally shown to be elevated in both guinea pig models of HF (12) and myocardium from failing human hearts (29). Kohlhaas et al. (15) hypothesized that this may be a key factor in the increased levels of ROS emission observed from myocytes isolated from failing hearts. The mNCE produces a Ca2+ extrusion flux that opposes influx through the mCU. In conditions of elevated [Na+]I, the mNCE rate increases, counteracting the mCU flux and leading to an overall result similar to the block of mCU by Ru360.
Fig. 5 shows simulation results for elevated cytosolic Na+ compared with experimental results from (15). For control cells, 60 min after the onset of 3Hz pacing, mitochondrial H2O2 levels increased 67% in the model (Fig. 5 A, gray) compared to a 67% increase after 20 min observed in experiments (Fig. 5 B, open symbols). For cells with cytosolic Na+ increased to 15 mM, model simulations show a 115% increase in [H2O2]m after 60 min (Fig. 5 A, black) compared to 148% over 20 min in experiment (Fig. 5 B, solid symbols). Similar to the mCU inhibition intervention, 15 mM [Na+]i leads to compromised mitochondrial Ca2+ handling and decreased scavenging capacity (Fig. 6, A and B, and Fig. S4), which in turn leads to increased mitochondrial H2O2. As in the case of mCU inhibition, for elevated [Na+]i, ROS production is also decreased after the change in workload (Fig. 6 C).
Figure 5.
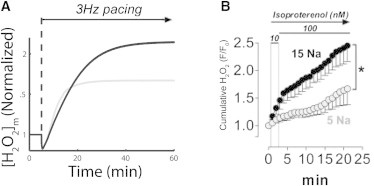
Elevated [Na+]i increases ROS levels. (A) Model cytosolic Na+ was increased from a control level of 5 mM (gray) to 15 mM (black), within the range associated with HF. After the onset of 3Hz pacing at 5 min, both simulations show elevated [H2O2]m, though high Na+ continues to increase beyond the steady state for control. (B) Experimental data from Kohlhaas et al. (15) show a quantitatively similar trend, though with faster kinetics.
Figure 6.
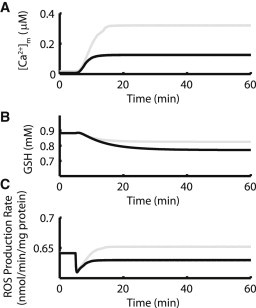
Elevated [Na+]i limits mitochondrial Ca2+ uptake and depletes scavengers. (A) Mitochondrial Ca2+ accumulation is blunted in the presence of 15 mM [Na+]i (black) compared to control (gray). (B) 15 mM [Na+]i conditions (black) lead to increased GSH oxidation compared to control (gray). (C) Elevated cytosolic Na+ (black) leads to decreased ROS production compared to control (gray), similar to mCU inhibition results.
Under the hypothesis that mNCE is the primary link between elevated [Na+]I and altered mitochondrial Ca2+ regulation, inhibition of the mNCE is expected to restore some degree of the control of ROS emission. Simulations were performed with model [Na+]I at 15 mM and mNCE flux reduced by 85% to simulate application of CGP37157. This decrease in mitochondrial Ca2+ export flux successfully counteracts the [Na+]i-dependent increase and restores [H2O2]m to control levels, as shown in Fig. 7 A. Fig. 7 B shows experimental data from control and HF cells with or without CGP37157 and demonstrates a similar effect.
Figure 7.
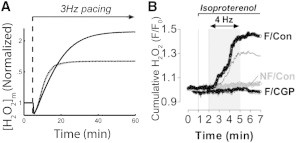
Block of mNCE with CGP reduces ROS overflow in high [Na+]i conditions. (A) Model simulations using 15 mM [Na+]i and 85% inhibition of mNCE flux to simulate CGP37157 block (dotted line) restore [H2O2]m to control levels (gray line). 15 mM [Na+]i trend without CGP37157 (black) is shown for comparison. Simulations were started from rest with 3Hz pacing initiated at 5 min. (B) Experimental data in nonfailing cells (NF/Con), untreated failing cells (F/Con), and failing cells treated with CGP37157 (F/CGP) shows a similar response. Panel B reproduced from (15).
Increased GSH pool reduces ROS overflow
Many experiments investigating the role of oxidative stress in ischemia have shown that addition of exogenous antioxidants, such as GSH, can ameliorate pathological symptoms (30,31). This mechanism was tested in the model. Fig. 8 shows that, compared to a control total matrix GSH/GSSG pool in the model of 1 mM, increasing the pool size by 25% and by 75% both result in a decrease of the ROS overflow associated with the increase in pacing frequency. Mitochondrial H2O2 increases by 67% after pacing compared to rest for control, 21.9% for 1.25 mM GSH pool, and 10.5% for 1.75 mM GSH pool. ROS production remains unchanged for the three protocols (not shown). The quantitative comparison of the results in Fig. 8 shows that the ROS overflow behavior of the model is very sensitive to the size of the GSH pool. Further analysis over a range of 0.5–mM GSH pool size shows that ROS overflow is the most sensitive to changes in GSH pool size near 1 mM, which is the control size in the model (Fig. 9). For pool sizes <0.9 mM, the relative increase in [H2O2]m appears to decrease. This effect is derived largely from the trend in resting [H2O2]m levels. Steady-state [H2O2]m at rest increases slightly with decreasing GSH pool size until the pool size drops below 0.9 mM, at which point resting [H2O2]m increases almost exponentially with decreasing pool size (see Fig. S5). This is indicative of GSH scavenging capacity being increasingly compromised at rest. With reduced available GSH scavenging capacity, the resting [H2O2]m level is already high and the increase after pacing represents a smaller relative increase. Such a comparison is difficult to quantify experimentally because GSH is usually applied to the extracellular medium, making it challenging to determine how much GSH is transported into the cytosol and the mitochondrial matrix. In the context of a computational model, many protocols are available that are not possible in an experimental setting.
Figure 8.
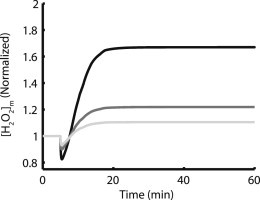
Increasing mitochondrial GSH pool size reduces the effect of increased workload in [H2O2]m. Simulations were started from rest with 3Hz pacing initiated at 5 min. Control (1 mM pool) is black, dark gray is 25% increase in pool size, and light gray is 75% increase. ROS production for these different GSH cases is identical.
Figure 9.
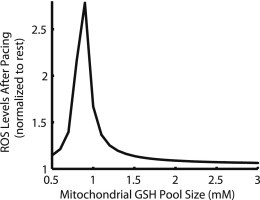
Dependence of ROS increase with pacing on mitochondrial GSH pool size. For large pools of GSH (≥1.9 mM) the increase in [H2O2]m after onset of 3Hz pacing is <10%. As the mitochondrial GSH pool decreases beyond 1.9 mM, pacing-induced ROS elevation increases to a maximum of ∼2.8× near 0.9 mM. For smaller pools than 0.9 mM, resting [H2O2]m is significantly elevated such that pacing induces a smaller increase.
Discussion
In this work, we have combined a detailed model of ROS scavenging within the mitochondrial environment with a validated model of ROS production from the mitochondrial ETC. Together, the ROS production and scavenging components provide a biophysically accurate representation of the control of ROS levels in the mitochondria. This combined mitochondrial model is able to reproduce i), state 3 and state 4 steady-state energetics values and the proportion of respiratory flux diverted to ROS, ii), the proportional control of GSH and Trx systems on mitochondrial ROS emission, and iii), the magnitude and kinetics of ΔΨ and NADH during a transition protocol from state 0 to state 4 to state 3. After these validation steps, some parameters of the model were modified (see Methods) to better simulate a mitochondrion within the cellular environment. This model is able to replicate cellular data describing i), NADH oxidation and increased H2O2 emission for increased workload after mCU inhibition, ii), NADH oxidation and increased H2O2 emission for increased workload with elevated cytosolic Na+, iii), effective reversal of elevated [Na+]i effects by CGP37157, and iv), decreased H2O2 emission for increased GSH pool size.
Model predictions
The similar fluorescence properties and disparity in size between the NAD+/NADH and NADP+/NADPH pools, with the NAD+/NADH pool estimated to be at least 4–7× larger (32,33), lead to the measurement of an NAD(P)H signal that is more closely representative of NADH than NADPH. As such, to the authors’ knowledge, the kinetics of NADPH levels in the cardiac myocyte during workload transitions have never been reported experimentally. The model presented here offers predictions of NADPH during such a protocol. These predictions are based on the use of in vitro parameters from the experimental data to constrain the rate of conversion of NADH to NADPH by THD and the validation of NADH transients against experimental data (see Fig. 2). The model predicts that although NADPH may be more reduced than NADH at rest, as NADH levels drop for the mCU inhibition and elevated [Na+]i protocols, NADPH becomes more oxidized than NADH and the GSH and Trx scavenging systems become compromised. The proton motive force (PMF)-dependence and reversibility of the THD are key to this behavior; in well-energized mitochondria with ample TCA cycle capacity, the THD serves to bolster the antioxidant defenses, but the same enzyme can contribute to depletion of the NADPH pool when the rate of NADH oxidation exceeds its production. Given that model pH is held constant, PMF drops upon the increase in workload associated with the onset of pacing. The forward, NADPH-producing reaction of the THD is driven by the free energy of the transfer of protons in the direction of the PMF. As PMF decreases, the rate of the forward reaction decreases. At the same time, the decrease in mitochondrial Ca2+ drives an oxidation of NADH. The model predicts that, although IDH and αKGDH both serve as Ca2+-sensitive NADH reductases, αKGDH plays a larger part in NADH control. A 10% decrease in the rate of αKGDH causes a further 3% oxidation in NADH after the onset of pacing in the uniporter block protocol, whereas a 10% decrease in IDH activity does not cause a significant change in NADH levels (not shown). The combined effects of NADH oxidation and decrease in PMF lead to a reversal of the THD and decrease in NADPH levels, which ultimately drives the ROS overflow behavior.
Although GSH/GSSG redox potential can be measured experimentally, the concentrations of GSSG and GSH are more important in analyzing the enzyme kinetics of the scavenging reactions. These concentrations are difficult to ascertain from the redox potential without a precise measurement of the size of the GSH pool, which has been estimated to vary significantly across different energetic conditions, including starvation and oxidative stress (34). The model predicts that depletion of NADPH associated with the oxidation of NADH causes an oxidation of GSH from 0.88 mM at rest to 0.83 mM for control, 0.74 mM for 90% mCU block, and 0.77 mM for high [Na+]i during the workload transition, which results in increased H2O2 emission for all protocols. Given the increasing adoption of redox-sensing GFP probes (35,36), quantitative assessment of GSH and GSSG levels in vivo should be possible in the near future. A parametric study of total mitochondrial GSH pool size in the model shows that the amount of increase in H2O2 after onset of pacing is very sensitive to the total amount of GSH and GSSG available for pools near 1 mM. Gilbert (34) cites ∼2.4 mM GSH pool in the cytoplasm of rat heart cells and asserts that cytosolic and matrix concentrations are approximately equal, based on the amount of GSH localized to the matrix of rat liver mitochondria and the volumetric ratio of the cytoplasm and mitochondrial matrix. This is in good agreement with the measurement of 2.7 mM total cytoplasmic GSH by Aon et al. (37). However, direct measurement of matrix GSH in guinea pig heart cells by Stanley et al. (38) gives a value between 1 and 1.5 mM total GSH. The model, which uses a value of 1 mM, is in good agreement with the model.
The Trx and GSH scavenger pathways both make a major contribution to cardiac mitochondrial ROS scavenging, and their individual contributions vary to some extent with species (16). Deficiencies in one pathway can be partially compensated by the other pathway, but both depend on NADPH supply. The present model not only allows one to examine the independent behaviors of the two scavenger pathways, but is the first, to our knowledge, to describe how both are coupled to the pyridine nucleotide redox potential, the proton motive force, and mitochondrial oxidative phosphorylation. Moreover, in addition to ROS scavenging, the complex effects of these factors on ROS production are taken into account by model. With respect to relative contributions of Trx and GSH to ROS scavenging rates, Fig. 3 B and Fig. S3 show the effects of pacing on the mitochondrial scavenging systems of control cells and those with the mCU inhibited. Both GSH and Trx show an approximate 15 mV oxidation of their redox potentials for the mCU inhibition case due to the dependence of both GR and TrxR on NADPH. However, throughout these two protocols, ETrx remains more negative than EGSH, reflecting a greater reducing potential for Trx compared to GSH, as initially suggested by the work of Aon et al. (16). Although some scavenging parameters differ between the mitochondrial and cellular models presented here, the results of scavenging inhibition for the mitochondrial model (Fig. S1) also support the greater role of Trx. Aon et al. (16) used auranofin and dinitrochlorobenzene to progressively inhibit the Trx and GSH systems, respectively, in isolated mitochondria, but more work will need to be carried out in myocytes to examine the contribution of each scavenger pathway to global ROS accumulation in the cell. Nonmitochondrial sources of ROS must also be taken into consideration in future models.
Perhaps the most significant prediction arising from the model results regards the changes in ROS production after workload transition. Although a naive interpretation of the increase in ROS after pacing for Ru360-incubated cells might attribute it to an increase in ROS production, the model results show that the increase in ROS levels occurs by a decrease in ROS production and an even larger decrease in ROS scavenging (Figs. 3 and 4). Future experimental studies in antioxidant-depleted cells could help validate this prediction.
Cellular control of ROS production
From experimental data, it is evident that ROS emission levels from cardiac myocytes increase after an increase in workload, but separating the role of ROS production from the role of ROS scavenging presents a challenge. We expect that ROS scavenging is compromised to some extent by the oxidation of NADH. However, there is a wide array of concomitant changes to ROS production and scavenging that will produce the same overall ROS levels. The model predicts that ROS production for the 90% mCU inhibition and elevated [Na+]i protocols will decrease after the workload transition. The decrease in ROS production is attributable to the effects of NADH oxidation and ΔΨ depolarization that occur during ADP addition. This follows from the mechanism of ROS Production used in the Gauthier et al. (25) ETC model, which requires high mitochondrial membrane potential and a highly reduced Q pool. ROS production during pacing for mCU inhibition and high [Na+]i protocols is lower with respect to control because of the more oxidized NADH pool for those protocols with compromised Ca2+ handling, which results in a more oxidized Q pool and less driving force for ROS production.
The ROS production mechanism from complex III in the ETC-ROS model depends on the accumulation of an unstable semiquinone (SQ) on the cytosolic-side quinone binding site of complex III. The concentration of this SQ builds up as the net flux through complex III’s Q cycle stagnates. Under physiological conditions, this occurs due to elevated ΔΨ, reducing the rate of electron transfer through the membrane from complex III’s bL heme to its bH heme. Both hemes become reduced, leading electrons to stagnate upstream at the cytosolic SQ. The unpaired electron from SQ seeks stability by escaping to reduce oxygen, forming superoxide, a reactive oxygen species. Since the older models of ROS production used as the basis for the ETC-ROS model were developed, new mechanisms of ROS production from complex III have been proposed (39,40). These mechanisms do not rely on a high concentration of cytosolic-side SQ and require the availability of a threshold amount of ubiquinone to accept electrons in the reverse reaction from reduced heme bL. This version of the model corrects the legacy value of 10 mM total NAD+/NADH pool from Magnus and Keizer (41) that was used in the original Gauthier et al. model (25) by changing it to the 1 mM value used in Wei et al. (42) 1 mM total NAD+/NADH pool yields better control of NAD+- and NADH-dependent TCA cycle enzymes and is in good agreement with the ≈0.82 mM mitochondrial NAD+ + NADH pool size measured in the heart (43). With this updated value of the total NAD+/NADH pool size, the accumulation of cytosolic-side SQ is dramatically reduced compared to Gauthier et al. (25). However, the ROS production model used here still requires a highly reduced Q pool. It is possible that incorporation of a different mechanism might change the workload-dependence of ROS production, which is a topic for future investigation.
Previous modeling and critique of the model
The model presented here builds on the well-validated scavenging network of Kembro et al. (17), but with dynamic ROS production adapted from Gauthier et al. (25) that varies with changes in the mitochondrial energetic state. Although Gauthier et al. (25) demonstrated the interaction of their ROS production model with a minimal model of scavenging, to the authors’ knowledge, the model presented here is the first to combine dynamic ROS production and scavenging, both controlled by mitochondrial ΔΨ and redox state. It is still important to note the existence of other ROS production or scavenging models in the literature. Models by Adimora et al. (44) and Antunes et al. (45) describe dynamic ROS scavenging, but their analyses do not include scavenging in the mitochondrial matrix or endogenous H2O2. Detailed modeling of ROS production was performed by Selivanov et al. (20–23) and Demin et al. (18,19), but without taking into account the mitochondrial mechanisms for degradation of ROS.
Achieving quantitative agreement between the model and the experimental data is hindered by the inability to calibrate experimental fluorescence signals representing some signaling components and the inability to measure other components at all. Q pool redox state is difficult to monitor continuously, especially in a cellular preparation. The mechanism controlling ROS production changes after pacing (described previously) might be counterintuitive, but poses just one mechanism to explain the experimental observation that ROS release from the mitochondria increases in control cells as well as cells with compromised Ca2+ handling. The ROS production component of the cellular model is difficult to validate experimentally and would benefit from future experimental protocols in cells depleted of both matrix and cytosolic scavenging systems.
Much remains unknown about the mitochondrial environment within the cell, though it is known that compartmentation and buffering of metabolites like ATP in the extramitochondrial space differs in cellular preparations compared to isolated mitochondria (46,47). Changes in ATP, Pi, pH, and the protonmotive force will affect the other ionic species of the mitochondria (Ca2+, Na+, H+) via the mitochondrial ion circuits involving transporters like the phosphate carrier, mNCE, and mitochondrial Na+/H+ exchanger. The control of the ion circuits that was well fit in the model of Wei et al. (42) (a precursor to the ME-R model) was likely to be compromised at the high pacing frequencies associated with stimulation of isolated myocytes. For this reason, in this work, pH and [Pi]m were clamped in the cellular simulations (see Methods). Additionally, it is known that some aspects of control change with respect to that of the isolated mitochondrion (48,49). As such, it is likely that other processes are still unaccounted for in the model. For example, the β-adrenergic activation employed in the experiments of Kohlhaas et al. (15) might impact complex I function and ROS production (50). Additionally, secondary ROS effects, such as redox modulation of transporters, and changes in the permeability of the inner mitochondrial membrane may play a role in the experimental results observed. However, these more minor mechanisms would not be expected to affect the overall qualitative trends of the model or experimental results.
The mitochondrial effects of acute β-adrenergic stimulation in cardiac myocytes have been historically most closely studied via changes in Ca2+ signaling. The relatively recent discovery of the mitochondrial A-kinase anchor protein has focused new efforts on elucidating the phosphorylation-dependent regulatory mechanisms of the mitochondria, though the effects of direct protein kinase A (PKA) phosphorylation on mitochondria are still controversial (see (51) for review). A mitochondrial isoform of PKA is anchored to the outer mitochondrial membrane, where it is activated by elevated cytosolic cAMP levels derived from the addition of isoproterenol (52). Activated PKA phosphorylates several targets involved in cell survival, steroid metabolism, and oxidative phosphorylation (52). Although signaling pathways related to the apoptotic cascade operate on the timescale of several hours (53), cAMP-dependent regulation of complex I activity (54) and complex IV activity (55) may be relevant at the timescale of the simulations performed here. Phosphorylation pathways regulated by kinases other than PKA have also been shown to regulate mitochondrial KATP channels and the voltage-dependent anion channel (56). This first study, to our knowledge, shows the qualitative relationship of increased workload and ROS overflow using on Ca2+-mediated beta-adrenergic changes, but the incorporation of mitochondrial phosphorylation pathways could pose an interesting direction for future work.
The simulations presented here do not represent a comprehensive analysis of all the processes involved in HF. In addition to elevated cytosolic Na+, myocytes from failing hearts also exhibit decreased Ca2+ load in the sarcoplasmic reticulum (57) and smaller cytosolic Ca2+ transients (58). Although these mechanisms were not examined here, we hypothesize that they would further contribute to reduced mitochondrial Ca2+ uptake and depletion of ROS scavenging systems, exacerbating the elevated [Na+]i effects examined here. These additional aspects of the HF phenotype could pose interesting directions for further study.
Conclusion
The integration and adaptation of previously published, dynamic models of ROS production (25) and scavenging (17) provides insight into the control of ROS levels in failing myocytes. Disruption of normal Ca2+ handling either by application of Ru360 or by elevated [Na+]i, as in HF, leads to oxidation of the mitochondrial ROS scavenging systems upon increasing workload. Although the net effect is an increase in ROS levels, the model predicts that ROS production for compromised mitochondria decreases with an increase in pacing frequency. The findings based on this model confirm the hypothesis that cells with compromised mitochondrial Ca2+-handling have decreased scavenging resources, leading to increased ROS emission after workload transitions. Results from the model also suggest further experimental investigation into ROS production in the whole myocyte.
Acknowledgments
This work was supported by National Institutes of Health grants R01HL052160 (R.L.W.), R33HL87345 (R.L.W.), and R37HL54598 (B.O’R.). L.D.G. was supported by NDSEG and NSF graduate fellowships.
Supporting Material
References
- 1.Belch J.J., Bridges A.B., Chopra M. Oxygen free radicals and congestive heart failure. Br. Heart J. 1991;65:245–248. doi: 10.1136/hrt.65.5.245. [DOI] [PMC free article] [PubMed] [Google Scholar]
- 2.Mallat Z., Philip I., Tedgui A. Elevated levels of 8-iso-prostaglandin F2α in pericardial fluid of patients with heart failure: a potential role for in vivo oxidant stress in ventricular dilatation and progression to heart failure. Circulation. 1998;97:1536–1539. doi: 10.1161/01.cir.97.16.1536. [DOI] [PubMed] [Google Scholar]
- 3.McMurray J., Chopra M., Dargie H.J. Evidence of oxidative stress in chronic heart failure in humans. Eur. Heart J. 1993;14:1493–1498. doi: 10.1093/eurheartj/14.11.1493. [DOI] [PubMed] [Google Scholar]
- 4.Ide T., Tsutsui H., Takeshita A. Mitochondrial electron transport complex I is a potential source of oxygen free radicals in the failing myocardium. Circ. Res. 1999;85:357–363. doi: 10.1161/01.res.85.4.357. [DOI] [PubMed] [Google Scholar]
- 5.Dhalla A.K., Singal P.K. Antioxidant changes in hypertrophied and failing guinea pig hearts. Am. J. Physiol. 1994;266:H1280–H1285. doi: 10.1152/ajpheart.1994.266.4.H1280. [DOI] [PubMed] [Google Scholar]
- 6.Hill M.F., Singal P.K. Antioxidant and oxidative stress changes during heart failure subsequent to myocardial infarction in rats. Am. J. Pathol. 1996;148:291–300. [PMC free article] [PubMed] [Google Scholar]
- 7.Hill M.F., Singal P.K. Right and left myocardial antioxidant responses during heart failure subsequent to myocardial infarction. Circulation. 1997;96:2414–2420. doi: 10.1161/01.cir.96.7.2414. [DOI] [PubMed] [Google Scholar]
- 8.Dai D.F., Santana L.F., Rabinovitch P.S. Overexpression of catalase targeted to mitochondria attenuates murine cardiac aging. Circulation. 2009;119:2789–2797. doi: 10.1161/CIRCULATIONAHA.108.822403. [DOI] [PMC free article] [PubMed] [Google Scholar]
- 9.Despa S., Islam M.A., Bers D.M. Intracellular Na(+) concentration is elevated in heart failure but Na/K pump function is unchanged. Circulation. 2002;105:2543–2548. doi: 10.1161/01.cir.0000016701.85760.97. [DOI] [PubMed] [Google Scholar]
- 10.Murphy E., Eisner D.A. Regulation of intracellular and mitochondrial sodium in health and disease. Circ. Res. 2009;104:292–303. doi: 10.1161/CIRCRESAHA.108.189050. [DOI] [PMC free article] [PubMed] [Google Scholar]
- 11.Pieske B., Maier L.S., Houser S. Rate dependence of [Na+]i and contractility in nonfailing and failing human myocardium. Circulation. 2002;106:447–453. doi: 10.1161/01.cir.0000023042.50192.f4. [DOI] [PubMed] [Google Scholar]
- 12.Liu T., O’Rourke B. Enhancing mitochondrial Ca2+ uptake in myocytes from failing hearts restores energy supply and demand matching. Circ. Res. 2008;103:279–288. doi: 10.1161/CIRCRESAHA.108.175919. [DOI] [PMC free article] [PubMed] [Google Scholar]
- 13.Maack C., Cortassa S., O’Rourke B. Elevated cytosolic Na+ decreases mitochondrial Ca2+ uptake during excitation-contraction coupling and impairs energetic adaptation in cardiac myocytes. Circ. Res. 2006;99:172–182. doi: 10.1161/01.RES.0000232546.92777.05. [DOI] [PMC free article] [PubMed] [Google Scholar]
- 14.Liu T., Brown D.A., O’Rourke B. Role of mitochondrial dysfunction in cardiac glycoside toxicity. J. Mol. Cell. Cardiol. 2010;49:728–736. doi: 10.1016/j.yjmcc.2010.06.012. [DOI] [PMC free article] [PubMed] [Google Scholar]
- 15.Kohlhaas M., Liu T., Maack C. Elevated cytosolic Na+ increases mitochondrial formation of reactive oxygen species in failing cardiac myocytes. Circulation. 2010;121:1606–1613. doi: 10.1161/CIRCULATIONAHA.109.914911. [DOI] [PMC free article] [PubMed] [Google Scholar]
- 16.Aon M.A., Stanley B.A., Cortassa S. Glutathione/thioredoxin systems modulate mitochondrial H2O2 emission: an experimental-computational study. J. Gen. Physiol. 2012;139:479–491. doi: 10.1085/jgp.201210772. [DOI] [PMC free article] [PubMed] [Google Scholar]
- 17.Kembro J.M., Aon M.A., Cortassa S. Integrating mitochondrial energetics, redox and ROS metabolic networks: a two-compartment model. Biophys. J. 2013;104:332–343. doi: 10.1016/j.bpj.2012.11.3808. [DOI] [PMC free article] [PubMed] [Google Scholar]
- 18.Demin O.V., Goryanin I.I., Westerhoff H.V. Kinetic modeling of energy metabolism and superoxide generation in hepatocyte mitochondria. Mol. Biol. 2001;35:940–949. [PubMed] [Google Scholar]
- 19.Demin O.V., Kholodenko B.N., Skulachev V.P. A model of O2.-generation in the complex III of the electron transport chain. Mol. Cell. Biochem. 1998;184:21–33. [PubMed] [Google Scholar]
- 20.Selivanov V.A., Cascante M., Votyakova T.V. Multistationary and oscillatory modes of free radicals generation by the mitochondrial respiratory chain revealed by a bifurcation analysis. PLOS Comput. Biol. 2012;8:e1002700. doi: 10.1371/journal.pcbi.1002700. [DOI] [PMC free article] [PubMed] [Google Scholar]
- 21.Selivanov V.A., Votyakova T.V., Cascante M. Reactive oxygen species production by forward and reverse electron fluxes in the mitochondrial respiratory chain. PLOS Comput. Biol. 2011;7:e1001115. doi: 10.1371/journal.pcbi.1001115. [DOI] [PMC free article] [PubMed] [Google Scholar]
- 22.Selivanov V.A., Votyakova T.V., Cascante M. Bistability of mitochondrial respiration underlies paradoxical reactive oxygen species generation induced by anoxia. PLOS Comput. Biol. 2009;5:e1000619. doi: 10.1371/journal.pcbi.1000619. [DOI] [PMC free article] [PubMed] [Google Scholar]
- 23.Selivanov V.A., Zeak J.A., Votyakova T.V. The role of external and matrix pH in mitochondrial reactive oxygen species generation. J. Biol. Chem. 2008;283:29292–29300. doi: 10.1074/jbc.M801019200. [DOI] [PMC free article] [PubMed] [Google Scholar]
- 24.Jin Q., Bethke C.M. Kinetics of electron transfer through the respiratory chain. Biophys. J. 2002;83:1797–1808. doi: 10.1016/S0006-3495(02)73945-3. [DOI] [PMC free article] [PubMed] [Google Scholar]
- 25.Gauthier L.D., Greenstein J.L., Winslow R.L. A computational model of reactive oxygen species and redox balance in cardiac mitochondria. Biophys. J. 2013;105:1045–1056. doi: 10.1016/j.bpj.2013.07.006. [DOI] [PMC free article] [PubMed] [Google Scholar]
- 26.Popova T., Pinheiro de Carvalho M.A., Medvedeva L. Regulation of mitochondrial NADP-isocitrate dehydrogenase in rat heart during ischemia. Mol. Cell. Biochem. 2007;294:97–105. doi: 10.1007/s11010-006-9249-9. [DOI] [PubMed] [Google Scholar]
- 27.Sazanov L.A., Jackson J.B. Proton-translocating transhydrogenase and NAD- and NADP-linked isocitrate dehydrogenases operate in a substrate cycle which contributes to fine regulation of the tricarboxylic acid cycle activity in mitochondria. FEBS Lett. 1994;344:109–116. doi: 10.1016/0014-5793(94)00370-x. [DOI] [PubMed] [Google Scholar]
- 28.Aon M.A., Cortassa S., O’Rourke B. Redox-optimized ROS balance: a unifying hypothesis. Biochim. Biophys. Acta. 2010;1797:865–877. doi: 10.1016/j.bbabio.2010.02.016. [DOI] [PMC free article] [PubMed] [Google Scholar]
- 29.Pieske B., Houser S.R. [Na+]i handling in the failing human heart. Cardiovasc. Res. 2003;57:874–886. doi: 10.1016/s0008-6363(02)00841-6. [DOI] [PubMed] [Google Scholar]
- 30.Kupatt C., Hinkel R., Boekstegers P. Selective retroinfusion of GSH and cariporide attenuates myocardial ischemia-reperfusion injury in a preclinical pig model. Cardiovasc. Res. 2004;61:530–537. doi: 10.1016/j.cardiores.2003.11.012. [DOI] [PubMed] [Google Scholar]
- 31.Seiler K.S., Starnes J.W. Exogenous GSH protection during hypoxia-reoxygenation of the isolated rat heart: impact of hypoxia duration. Free Radic. Res. 2000;32:41–55. doi: 10.1080/10715760000300051. [DOI] [PubMed] [Google Scholar]
- 32.Joubert F., Fales H.M., Balaban R.S. NADH enzyme-dependent fluorescence recovery after photobleaching (ED-FRAP): applications to enzyme and mitochondrial reaction kinetics, in vitro. Biophys. J. 2004;86:629–645. doi: 10.1016/S0006-3495(04)74141-7. [DOI] [PMC free article] [PubMed] [Google Scholar]
- 33.Livingston B.E., Altschuld R.A., Hohl C.M. Metabolic compartmentalization in neonatal swine myocytes. Pediatr. Res. 1996;40:59–65. doi: 10.1203/00006450-199607000-00011. [DOI] [PubMed] [Google Scholar]
- 34.Gilbert H.F. Molecular and cellular aspects of thiol-disulfide exchange. Adv. Enzymol. Relat. Areas Mol. Biol. 1990;63:69–172. doi: 10.1002/9780470123096.ch2. [DOI] [PubMed] [Google Scholar]
- 35.Dooley C.T., Dore T.M., Tsien R.Y. Imaging dynamic redox changes in mammalian cells with green fluorescent protein indicators. J. Biol. Chem. 2004;279:22284–22293. doi: 10.1074/jbc.M312847200. [DOI] [PubMed] [Google Scholar]
- 36.Hanson G.T., Aggeler R., Remington S.J. Investigating mitochondrial redox potential with redox-sensitive green fluorescent protein indicators. J. Biol. Chem. 2004;279:13044–13053. doi: 10.1074/jbc.M312846200. [DOI] [PubMed] [Google Scholar]
- 37.Aon M.A., Cortassa S., O’Rourke B. Sequential opening of mitochondrial ion channels as a function of glutathione redox thiol status. J. Biol. Chem. 2007;282:21889–21900. doi: 10.1074/jbc.M702841200. [DOI] [PMC free article] [PubMed] [Google Scholar]
- 38.Stanley B.A., Sivakumaran V., Paolocci N. Thioredoxin reductase-2 is essential for keeping low levels of H(2)O(2) emission from isolated heart mitochondria. J. Biol. Chem. 2011;286:33669–33677. doi: 10.1074/jbc.M111.284612. [DOI] [PMC free article] [PubMed] [Google Scholar]
- 39.Dröse S., Brandt U. The mechanism of mitochondrial superoxide production by the cytochrome bc1 complex. J. Biol. Chem. 2008;283:21649–21654. doi: 10.1074/jbc.M803236200. [DOI] [PubMed] [Google Scholar]
- 40.Borek A., Sarewicz M., Osyczka A. Movement of the iron-sulfur head domain of cytochrome bc(1) transiently opens the catalytic Q(o) site for reaction with oxygen. Biochemistry. 2008;47:12365–12370. doi: 10.1021/bi801207f. [DOI] [PubMed] [Google Scholar]
- 41.Magnus G., Keizer J. Minimal model of beta-cell mitochondrial Ca2+ handling. Am. J. Physiol. 1997;273:C717–C733. doi: 10.1152/ajpcell.1997.273.2.C717. [DOI] [PubMed] [Google Scholar]
- 42.Wei A.-C., Aon M.A., Cortassa S. Mitochondrial energetics, pH regulation, and ion dynamics: a computational-experimental approach. Biophys. J. 2011;100:2894–2903. doi: 10.1016/j.bpj.2011.05.027. [DOI] [PMC free article] [PubMed] [Google Scholar]
- 43.Randle, P., and P. Tubbs. 1979. Carbohydrate and fatty acid metabolism. In Handbook of Physiology: The Cardiovascular System. Vol. 1. R. M. Berne, N. Sperelakis, and R. Geiger, editors. Am. Physiol. Soc., Bethesda, MD.805–844.
- 44.Adimora N.J., Jones D.P., Kemp M.L. A model of redox kinetics implicates the thiol proteome in cellular hydrogen peroxide responses. Antioxid. Redox Signal. 2010;13:731–743. doi: 10.1089/ars.2009.2968. [DOI] [PMC free article] [PubMed] [Google Scholar]
- 45.Antunes F., Cadenas E. Estimation of H2O2 gradients across biomembranes. FEBS Lett. 2000;475:121–126. doi: 10.1016/s0014-5793(00)01638-0. [DOI] [PubMed] [Google Scholar]
- 46.Joubert F., Mateo P., Hoerter J.A. CK flux or direct ATP transfer: versatility of energy transfer pathways evidenced by NMR in the perfused heart. Mol. Cell. Biochem. 2004;256–257:43–58. doi: 10.1023/b:mcbi.0000009858.41434.fc. [DOI] [PubMed] [Google Scholar]
- 47.Kaasik A., Veksler V., Ventura-Clapier R. Energetic crosstalk between organelles: architectural integration of energy production and utilization. Circ. Res. 2001;89:153–159. doi: 10.1161/hh1401.093440. [DOI] [PubMed] [Google Scholar]
- 48.Ramzan R., Staniek K., Vogt S. Mitochondrial respiration and membrane potential are regulated by the allosteric ATP-inhibition of cytochrome c oxidase. Biochim. Biophys. Acta. 2010;1797:1672–1680. doi: 10.1016/j.bbabio.2010.06.005. [DOI] [PubMed] [Google Scholar]
- 49.Kadenbach B., Ramzan R., Vogt S. The role of mitochondrial membrane potential in ischemic heart failure. Mitochondrion. 2011;11:700–706. doi: 10.1016/j.mito.2011.06.001. [DOI] [PubMed] [Google Scholar]
- 50.De Rasmo D., Gattoni G., Signorile A. The β-adrenoceptor agonist isoproterenol promotes the activity of respiratory chain complex I and lowers cellular reactive oxygen species in fibroblasts and heart myoblasts. Eur. J. Pharmacol. 2011;652:15–22. doi: 10.1016/j.ejphar.2010.11.016. [DOI] [PubMed] [Google Scholar]
- 51.O’Rourke B., Van Eyk J.E., Foster D.B. Mitochondrial protein phosphorylation as a regulatory modality: implications for mitochondrial dysfunction in heart failure. Congest. Heart Fail. 2011;17:269–282. doi: 10.1111/j.1751-7133.2011.00266.x. [DOI] [PMC free article] [PubMed] [Google Scholar]
- 52.Carlucci A., Lignitto L., Feliciello A. Control of mitochondria dynamics and oxidative metabolism by cAMP, AKAPs and the proteasome. Trends Cell Biol. 2008;18:604–613. doi: 10.1016/j.tcb.2008.09.006. [DOI] [PubMed] [Google Scholar]
- 53.Suzuki K., Kostin S., Schaper J. Time course of the apoptotic cascade and effects of caspase inhibitors in adult rat ventricular cardiomyocytes. J. Mol. Cell. Cardiol. 2001;33:983–994. doi: 10.1006/jmcc.2001.1364. [DOI] [PubMed] [Google Scholar]
- 54.Technikova-Dobrova Z., Sardanelli A.M., Papa S. Cyclic adenosine monophosphate-dependent phosphorylation of mammalian mitochondrial proteins: enzyme and substrate characterization and functional role. Biochemistry. 2001;40:13941–13947. doi: 10.1021/bi011066p. [DOI] [PubMed] [Google Scholar]
- 55.Bender E., Kadenbach B. The allosteric ATP-inhibition of cytochrome c oxidase activity is reversibly switched on by cAMP-dependent phosphorylation. FEBS Lett. 2000;466:130–134. doi: 10.1016/s0014-5793(99)01773-1. [DOI] [PubMed] [Google Scholar]
- 56.Horbinski C., Chu C.T. Kinase signaling cascades in the mitochondrion: a matter of life or death. Free Radic. Biol. Med. 2005;38:2–11. doi: 10.1016/j.freeradbiomed.2004.09.030. [DOI] [PubMed] [Google Scholar]
- 57.Hobai I.A., O’Rourke B. Decreased sarcoplasmic reticulum calcium content is responsible for defective excitation-contraction coupling in canine heart failure. Circulation. 2001;103:1577–1584. doi: 10.1161/01.cir.103.11.1577. [DOI] [PubMed] [Google Scholar]
- 58.Davies C.H., Davia K., Harding S.E. Reduced contraction and altered frequency response of isolated ventricular myocytes from patients with heart failure. Circulation. 1995;92:2540–2549. doi: 10.1161/01.cir.92.9.2540. [DOI] [PubMed] [Google Scholar]
- 59.Coreassa S., Aon M.A., O’Rourke B. A mitochondrial oscillator dependent on reactive oxygen species. Biophys. J. 2004;87:2060–2073. doi: 10.1529/biophysj.104.041749. [DOI] [PMC free article] [PubMed] [Google Scholar]
- 60.Fernandes A.P., Holmgren A. Glutaredoxins: glutathione-dependent redox enzymes with functions far beyond a simple thioredoxin backup system. Antioxid. Redox Signal. 2004;9:63–74. doi: 10.1089/152308604771978354. [DOI] [PubMed] [Google Scholar]
- 61.Holmgren A. Thioredoxin and glutaredoxin systems. J. Biol. Chem. 1989;264:13963–13966. [PubMed] [Google Scholar]
- 62.Cox A.G., Winterbourn C.C., Hampton M.B. Mitochondrial peroxiredoxin involvement in antioxidant defence and redox signalling. Biochem. J. 2010;425:313–325. doi: 10.1042/BJ20091541. [DOI] [PubMed] [Google Scholar]
- 63.Sztajer H., Gamain B., Flohe L. The putative glutathione peroxidase gene of Plasmodium falciparum codes for a thioredoxin peroxidase. J. Biol. Chem. 2001;276:7397–7403. doi: 10.1074/jbc.M008631200. [DOI] [PubMed] [Google Scholar]
- 64.Pillay C.S., Hofmeyr J.H., Rohwer J.M. Enzymes or redox couples? The kinetics of thioredoxin and glutaredoxin reactions in a systems biology context. Biochem. J. 2009;417:269–275. doi: 10.1042/BJ20080690. [DOI] [PubMed] [Google Scholar]
- 65.Eckenroth B., Harris K., Hondal R.J. Semisynthesis and characterization of mammalian thioredoxin reductase. Biochemistry. 2006;45:5158–5170. doi: 10.1021/bi0517887. [DOI] [PMC free article] [PubMed] [Google Scholar]
- 66.Carlberg I., Mannervik B. Glutathione reductase. Methods Enzymol. 1984;113:484–490. doi: 10.1016/s0076-6879(85)13062-4. [DOI] [PubMed] [Google Scholar]
- 67.Zhou L., Cortassa S., O’Rourke B. Modeling cardiac action potential shortening driven by oxidative stress-induced mitochondrial oscillations in guinea pig cardiomyocytes. Biophys. J. 2009;97:1843–1852. doi: 10.1016/j.bpj.2009.07.029. [DOI] [PMC free article] [PubMed] [Google Scholar]
Associated Data
This section collects any data citations, data availability statements, or supplementary materials included in this article.