

Abstract
While the potential benefits of smart home technology are widely recognized, a lightweight design is needed for the benefits to be realized at a large scale. We introduce the CASAS “smart home in a box”, a lightweight smart home design that is easy to install and provides smart home capabilities out of the box with no customization or training. We discuss types of data analysis that have been performed by the CASAS group and can be pursued in the future by using this approach to designing and implementing smart home technologies.
Keywords: machine learning, pervasive computing, activity recognition, activity discovery, smart home
1. Introduction
Since the miniaturization of microprocessors, computing power has been embedded in familiar objects such as home appliances and mobile devices; it is gradually pervading almost every level of society. In the last decade, machine learning and pervasive computing technologies have matured to the point where this power is not only integrated with our lives but it can provide context-aware, automated support in our everyday environments. One physical embodiment of such a system is a smart home. In the home environment, computer software that plays the role of an intelligent agent perceives the state of the physical environment and residents using sensors, reasons about this state using artificial intelligence techniques, and then takes actions to achieve specified goals.
During perception, sensors embedded in the home generate readings while residents perform their daily routines. The sensor readings are collected by a computer network and stored in a database that an intelligent agent uses to generate useful knowledge such as patterns, predictions, and trends. On the basis of this information, a smart home can select and automate actions that meet the goals of the smart home application.
The potential uses of smart home technology for applications such as health monitoring and energy-efficient automation are viewed by many as “extraordinary” [1]. However, most implementations of this technology to date are somewhat narrow and are performed in controlled laboratory settings. These limitations are due in large part to the difficulty of creating a fully functional smart home infrastructure. In fact, while realistic smart home prototypes have been designed [2,3], implementing these smart homes is so cumbersome that meetings have been organized to discuss ways to scale such pervasive computing systems [4] and to share valuable data that has been successfully captured in such settings.
The goal of the CASAS project at Washington State University is to design a “smart home in a box”. This smart home kit is designed to be small in form, lightweight in infrastructure, extendable with minimal effort, and ready to perform key capabilities out of the box. In this paper we describe our CASAS smart home design strategy, demonstrate its ease of use through a usability study, and highlight the capabilities that are possible using this strategy for smart home design and implementation.
2. CASAS Architecture
The CASAS “smart home in a box” software architecture components are shown in Figure 1. During perception, control flows up from the physical components through the middleware to the software applications. When taking an action, control moves down from the application layer to the physical components that automate the action. Our goal is that each of the layers is lightweight, extensible and ready to use as is, without additional customization or training.
Figure 1.

CASAS smart home components.
The CASAS physical layer contains hardware components including sensors and actuators. The architecture utilizes a Zigbee wireless mesh which communicates directly with the hardware components. The middleware layer is governed by a publish/subscribe manager. The manager provides named broadcast channels that allow component bridges to publish and receive messages. In addition, the middleware provides valuable services including adding time stamps to events, assigning UUIDs, and maintaining site-wide sensor state. Every component of the CASAS architecture communicates via a customized XMPP bridge to this manager. Examples of such bridges are the Zigbee bridge, the Scribe bridge which archives messages in permanent storage, and bridges for each of the software components in the application layer.
The CASAS architecture is easily maintained, easily extended, and easily scaled. The architecture is easily maintained because the communication bridges use lightweight APIs that support a wide variety of messages in a free-form manner. As a result, the middleware is compact and stable – it has had only one update in five years. CASAS is extendable because new bridges can be configured and integrated without changing or even restarting the middleware. We have designed bridges that link multiple smart homes together, which allows CASAS to scale to communities of smart homes.
All of the CASAS components fit within a single small box, as is shown in Figure 2. The current box contains physical components in the form of sensors that are pre-labeled with the intended location. Additional sensors and controllers can be included when needed. The middleware, database, and application components reside on a small, low-power computer with an ITX form factor server. While this layout is designed to allow each smart home to run independently and locally, smart homes can also securely upload events to be stored in a relational database or in the cloud. Table 1 summarizes the prototype costs of the components that comprise our smart home in a box design, listed in US dollars.
Figure 2.

CASAS “smart home in a box” kit (left) and smart home installation site (right).
Table 1.
Summary of costs for CASAS “smart home in a box” components.
| Component | Compute server |
Infrared motion/light sensor |
Door sensor |
Relay | Temperature sensor |
Total cost |
|---|---|---|---|---|---|---|
| Unit price | $350 | $85 | $75 | $75 | $75 | |
|
|
||||||
| Quantity | 1 | 24 | 1 | 2 | 2 | |
|
|
||||||
| Total price | $350 | $2,040 | $75 | $150 | $150 | $2,765 |
3. CASAS Usability
The simplicity of the CASAS “smart home in a box” design has made it possible for our research group to install a large number of smart home testbeds. To date we have installed 32 smart home testbeds and many of the corresponding datasets are available on the project web page at ailab.wsu.edu/casas. A total of 19 datasets represent single-resident sites, 4 represent sites with two residents, and the rest house larger families or residents with pets. With the CASAS streamlined design our team can install a new smart home in approximately two hours and can remove the equipment in thirty minutes, with no changes or damage to the home. The design of the CASAS smart home also keeps installation costs down. Once the home is installed, the resident must considered maintenance of the equipment. The CASAS SHiB includes a software agent that alerts residents if sensor battery levels are getting low or if a sensor suddenly stops reporting events. In practice this does not happen often, as the batteries typically last over a year.
To test the usability of the CASAS “smart home in a box” kit, we conducted a study in an on-campus three-bedroom apartment. We recruited participants to visit the apartment, one at a time, and install a CASAS smart home. The study included 20 participants aged 21 to 62 years (mean 33 years), 8 males and 12 females, with a variety of background and technological familiarity.
Each of the participants was given a written document explaining the smart home parts and installation process, and each was given a CASAS smart home kit as shown in Figure 2 (left). All of the participants were able to complete the installation without difficulties. The average installation time was just over one hour. On a scale of 1 (simple) to 10 (impossible), participants rated the difficulty of installation for them as 2.53 (σ=1.07). The most difficult issue they faced was trying to determine the optimal placement of sensors.
4. CASAS Capabilities
In order to design a smart home in a box, we affirm that the smart home needs to provide capabilities that work out of the box, with no customization or training. Here we summarize two core software components and two applications that have been designed to meet this goal.
Activity recognition
Intelligent systems that focus on the needs of a human require information about the activities being performed by the human. At the core of these systems, then, is activity recognition, which is a challenging and well researched problem [5,6]. Sensors in a smart home generate events that consist of a date, a time, a sensor identifier, and a sensor message. The goal of activity recognition is to map a sequence of sensor data to a corresponding activity label. The CASAS activity recognition software, called AR, provides real-time activity labeling as sensor events arrive in a stream. To do this, we formulate the learning problem as that of mapping the sequence of the k most recent sensor events to a label that indicates the activity corresponding to the last (most recent) event in the sequence. The sensor events preceding the last event define the context for this last event. For example, the sequence of sensor events consisting of:
| 2011-06-15 | 03:38:23.271939 | BedMotionSensor | ON |
| 2011-06-15 | 03:38:28.212060 | BedMotionSensor | ON |
| 2011-06-15 | 03:38:29.213955 | BedMotionSensor | ON |
could be mapped to a Sleep activity label.
We designed a support vector machine (SVM) method for real-time activity recognition. We have tested other machine learning models as well, including naïve Bayes classifiers, hidden Markov models, and conditional random fields. We found that SVMs achieve consistently stronger performance than other approaches. In addition, the model quantifies the degree of fit between the data and an activity label which facilitates additional capabilities such as anomaly detection.
To provide input to the classifiers, we define features that describe a data point i that corresponds to a sequence of sensor events. This fixed dimensional feature vector xi includes the time of day for the first and last sensor events (discretized into four equal-length bins), the time span of the k-event sensor window and a count of events for each sensor within the window. Each vector xi is tagged with the label yi of the last sensor event in the window. The label yi corresponds to the activity label associated with the last sensor event in the window. Although a fixed window size k could be identified that works well for a given data set, this approach requires additional customization from the user. To increase the generalizability of the approach the window size k is dynamically adjusted by the activity recognition software based on the most likely activities that are being observed and the activity duration that is typical for those activities.
To evaluate the ability of the models to recognize activities out of the box, we collected sensor data in 18 separate smart apartments, each housing one resident and each utilizing the CASAS smart home in a box kit. One month of data was annotated manually to provide ground truth activity labels. We evaluate performance as the percentage of sensor events that were correctly labeled across all of the apartments using 5-fold cross validation, with no additional customized training for each apartment. Table 2 shows the confusion matrix that was generated from this experiment.
Table 2.
Activity recognition confusion matrix. The diagonal entries indicate the activities that were correctly categorized. The accuracy for each individual activities is shown in the last column.
| Automatically-generated activity label | ||||||||||||
|---|---|---|---|---|---|---|---|---|---|---|---|---|
| Bed- toilet transiti on |
Cook | Eat | Enter home |
Leave home |
Personal hygiene |
Phone | Relax | Sleep | Work | Accuracy | ||
| Ground truth activity label | Bed- toilet transition |
18288 | 143 | 261 | 0 | 0 | 22233 | 0 | 3 | 5866 | 38 | 0.39 |
| Cook | 3 | 370300 | 1616 | 11 | 11 | 172 | 4 | 140 | 28 | 1917 | 0.99 | |
| Eat | 53 | 20528 | 9871 | 4 | 0 | 41 | 1 | 979 | 118 | 27052 | 0.17 | |
| Enter home |
0 | 195 | 0 | 1606 | 107 | 3 | 0 | 4 | 57 | 126 | 0.77 | |
| Leave home |
0 | 5 | 0 | 59 | 316 | 3 | 0 | 0 | 1 | 4 | 0.81 | |
| Personal hygiene |
15769 | 928 | 81 | 3 | 3 | 295616 | 0 | 77 | 1216 | 921 | 0.94 | |
| Phone | 0 | 21 | 2 | 0 | 0 | 4 | 8 | 34 | 73 | 1072 | 0.01 | |
| Relax | 6 | 1282 | 322 | 13 | 0 | 178 | 8 | 2030 | 1459 | 2735 | 0.25 | |
| Sleep | 33900 | 66 | 33 | 1 | 0 | 279 | 0 | 60 | 65189 | 306 | 0.65 | |
| Work | 37 | 2875 | 10544 | 66 | 17 | 489 | 20 | 497 | 237 | 71684 | 0.83 | |
As the matrix indicates, some activities are easier to recognize than others. This is because some activities, such as cooking, have a fairly unique spatial-temporal signature. Other activities are more challenging because they overlap with other activity classes or not enough training data is available to learn the model. The weighted average accuracy is 84%, which indicates that the models are fairly robust even when they are used out of the box in new, distinct home settings.
Activity discovery
Recognizing activities from streaming data introduces new challenges because data must be processed that does not belong to any of the targeted activity classes. One way to handle unlabeled data is to design an unsupervised learning algorithm to discover activities from unlabeled sensor data. Segmenting unlabeled data into smaller classes improves activity recognition performance because the “Other” class is no longer dominant in terms of size, as frequently happens in activity recognition datasets. Another important reason to discover activity patterns from unlabeled data is to characterize and analyze as much behavioral data as possible, not just predefined activity classes. Such unlabeled data needs to be examined and modeled in order to get a complete view of everyday life [7].
Like earlier approaches to sequence mining, our AD activity discovery algorithm searches the space of candidate sensor event sequences ordered by increasing sequence length. Because the space of candidate patterns is exponential in the size of the input data, we employ a greedy search to find the sequence pattern that best compresses the input dataset. During discovery, the entire dataset is scanned to create initial patterns of length one. After this initial pass, AD extends the patterns discovered in the previous iteration by considering events occurring before and after instances of the previous pattern. The patterns are stored in a beam-limited open list and are ordered based on their value. Once the search terminates and AD reports the best pattern that was found, the sensor event data can be compressed using the best pattern. The compression procedure replaces all instances of the pattern by single event descriptors which represent the pattern definition. AD can then be invoked again on the compressed data to find additional activity patterns.
We evaluate candidate patterns based on their ability to minize the size of the original dataset when it is compressed using the pattern definition. Because each occurrence of a pattern is replaced by a single event labeled with a pattern identifier, the description length of a pattern P given input data D is calculated as DL(P) + DL(D|P), where DL(P) is the description length of the pattern definition and DL(D|P) is the description length of the dataset compressed using the pattern definition. Because human behavior patterns contain a great deal of variation, we employ an edit distance measure to determine if a sensor sequence is sufficiently similar to a pattern to be considered an instance of the pattern. This measure counts the minimum number of add, delete, or tranpose operations that are needed to transform a sensor sequence to one that is equivalent to the pattern definition.
Figure 3 provides a visualization of the three top activity patterns that are discovered when AD is applied to our combined dataset. The pattern in the upper left contains a sequence consisting of motion in the bedroom followed by the living room and back to the bedroom, around 10:20 in the evening. Many of these events occur prior to sleeping and may represent getting ready for bed. The pattern in the upper right consists of a front door closing followed by a series of kitchen events and then a living room event, usually in the late morning or mid afternoon. This could represent a number of different activities that occur after returning home, such as putting away groceries or getting a drink. The pattern in the lower left consists of a sequence of events alternating between the bedroom, a work area, and the living room, after waking up in the morning. This pattern might represent a resident gathering items needed for their daily routine. Other patterns represent transitions between activities or activities that are recognizable but do not appear on the list of predefined activities, such as spending extended time in a secondary bedroom that is used for guests or crafts. When we apply AD to discover patterns in unlabeled data that would otherwise be labeled as “Other”, the recognition of AR increases by an average of 10% for our smart home datasets [8].
Figure 3.
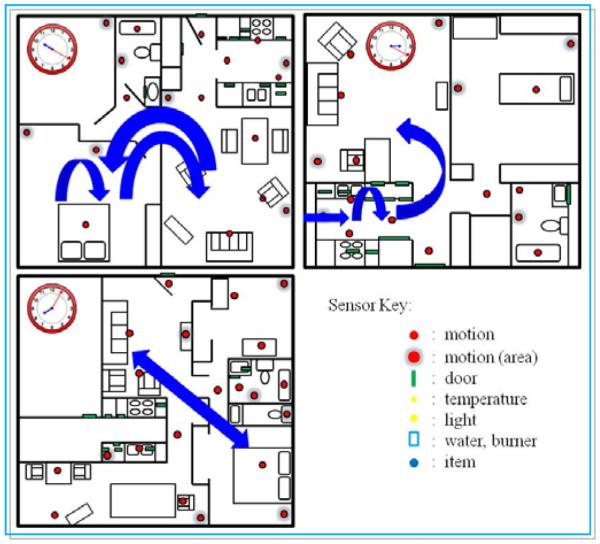
Visualization of discovered patterns: P1 (top left), P2 (top right), and P3 (bottom left).
Activity-aware applications
Two applications that have been a focus of the CASAS research group are health assistance and energy efficiency. The world’s population is aging, with the estimated number of individuals over the age of 85 expected to triple by 2050 [9]. Instead of deploying health care reactively, it is becoming increasingly urgent to develop innovative and preventive health care methods that can be automated and deployed within an individual’s own home.
We installed 20 smart homes at an assisted care facility where the average age of the residents is 85. Because the CASAS smart home in a box is simple to install and maintain, we are able to collect data over multiple years that allows us to monitor changes in behavior that indicate a chance in cognitive or physical health. Parameters are monitored which include overall activity level, sleep quality, and times spent on individual activities of interest. A visualization of these parameters for one resident is shown in Figure 4.
Figure 4.

Activity trends for a smart home resident.
In addition, we can provide activity-aware health assistance in the form of prompting individuals to initiate important daily activities such as taking medicine, exercising, or calling their children. While reminder systems have been widely explored, few take into account an individual’s behavioral patterns to provide context-aware prompts, despite the fact that studies indicate activity-aware prompts offer significant advantages over traditional time-based prompts [10]. In the CASAS software, a machine learning algorithm is trained to identify when an individual performs an activity as a function of wall-clock time (e.g., pick up grandchildren at 2pm) and as a function of other activity occurrences (e.g., take medicine with breakfast).
A second application of interest is supporting energy-efficient behavior in the home. Over the last 40 years energy consumption has increased at a higher rate than population growth, and buildings are responsible for 40% of total energy usage [11]. By identifying activities that occur in the home and concurrently monitoring whole-home energy usage, we can predict energy that will be consumed for a particular activity. In addition to providing this information to a resident (see Figure 5), the smart home can promote energy-efficient behavior [12] and automate control of selected devices to support activities in a more energy-efficient manner.
Figure 5.

Snapshot of CASAS activity visualizer. The visualizer renders sensor events on a computer or mobile device while plotting usage of resources such as electricity.
5. CASAS Population-Wide Findings
One type of analysis that is not found in the literature is a population-wide analysis of resident behavior using smart home data. While analyzing behavioral features across a larger demographic would be beneficial for many researchers in psychology, sociology, and technology, gathering data at a significant scale has not yet been a practical goal. Using the “smart home in a box” design we are able to start investigating questions that apply to demographic groups, families, and communities.
As a first step, we consider behavioral properties for the CASAS datasets we have collected. In particular, we want to identify how activity levels vary throughout the day for an entire cohort. We also want to determine how individuals spend their home time in terms of individual activities. We also want to determine how consistent the functions are across the group.
Figure 6 shows the results of these two analyses for the 18 smart apartments mentioned earlier in the paper. As the plots indicate, there is a clear pattern for the entire group in which activity levels are low in the early hours of the day but then increase, peaking at mid morning, mid afternoon, and early evening. The exact activity levels vary quite a bit across the population, which may be due to mobility differences and due to sensor granularity within the home. In contrast, the variance across the population for time devoted to various activities is quite a bit smaller. As the graph shows, the most time is dedicated to sleep while other activities receive less time such as taking medicine (which is typically quick) and cleaning the home (which may not happen as often as other activities). Larger variances exist for the enter activity (which takes into account time spent outside the home) and for bed toilet transitions, which do vary dramatically by age, health, and sleep quality. Being able to run such large-scale analyses will provide a valuable tool for understanding behavior that is central to many research fields including sociology and psychology as well as technology development.
Figure 6.
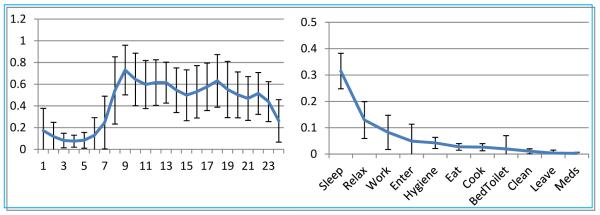
Plot of relative activity level as a function of the hour of the day (left) and relative activity duration as a function of the activity class (right).
6. Conclusions and Future Work
In this paper we highlight the capabilities of a smart home system that can be deployed, evaluated, and scaled when the smart home architecture is made simple and lightweight. As a next step we would like to evaluate the ease with which additional sensor modalities (e.g., RFID, smart phones) can be incorporated into the architecture and will design applications that more extensively utilize device controllers. We would also like to expand the scope of the data collection to include a greater diversity of resident demographics and to perform longitudinal studies. Finally, we would like to design home automation strategies that provide safe and energy-efficient support of resident daily activities.
Acknowledgements
The author would like to thank Jim Kusznir, Allan Drassal, Leah Zulas, and all the members of the CASAS team for their contributions to this work. This material is based upon work supported by the National Science Foundation under Grant Number 0852172, by the Life Sciences Discovery Fund, and by NIBIB Grant Number R01EB009675.
Author Biographies
Dr. Diane J. Cook is a Huie-Rogers Chair Professor in the School of Electrical Engineering and Computer Science at Washington State University. Dr. Cook received a B.S. degree from Wheaton College and both M.S. and Ph.D. degrees from the University of Illinois. Her research interests include artificial intelligence, machine learning, graph-based relational data mining, smart environments, and robotics. Dr. Cook is an IEEE Fellow.
Aaron S. Crandall, is an Assistant Research Professor at Washington State University. He has a PhD from Washington State University, a Master’s from Oregon Health and Science University, and a Bachelor’s from the University of Portland. His research centers around application of artificial intelligence, human factors, and engineering principles to building better smart home systems. He is a member of the ACM and IEEE.
Brian Thomas is a PhD student and IGERT Fellow at Washington State University after having received a BS from Washington State University. His research interests include artificial intelligence, home automation, and computer security.
Narayanan C Krishnan completed his PhD from Arizona State University. He is currently working as Assistant Research Professor at Washington State University. Narayanan received a Bachelors and Masters in Science and a Masters in Technology from Sri Sathya Sai Institute of Higher Learning. His research interests are in the area of activity recognition, pervasive computing, pattern recognition and machine learning for pervasive computing applications.
References
- [1].Department of Health Speech by the Rt Hon Patricia Hewitt MP, Secretary of State for Health. Proceedings of the Long-term Conditions Alliance Annual Conference.2007. [Google Scholar]
- [2].Helal A, Mann W, Elzabadani H, King J, Kaddourah Y, Jansen E. Gator Tech Smart House: A programmable pervasive space. IEEE Computer. 2005:64–74. [Google Scholar]
- [3].Logan B, Healey J, Philipose M, Munguia Tapia E, Intille S. A long-term evaluation of sensing modalities for activity recognition. Proceedings of the International Conference on Ubiquitous Computing.2007. pp. 483–500. [Google Scholar]
- [4].NSF Workshop on Pervasive Computing at Scale (PeCS) [accessed June, 2012]; http://sensorlab.cs.dartmouth.edu/NSFPervasiveComputingAtScale/
- [5].Hu D, Zheng V, Yang Q. Cross-domain activity recognition via transfer learning. Pervasive and Mobile Computing. 2011;7(3):344–358. [Google Scholar]
- [6].van Kasteren T, Englebienne G, Kröse B. Hierarchical activity recognition using automatically clustered actions. Proceedings of the International Conference on Ambient Intelligence.2011. pp. 82–91. [Google Scholar]
- [7].Gu T, Chen S, Tao S, Lu J. An unsupervised approach to activity recognition and segmentation based on object-use fingerprinters. Data and Knowledge Engineering. 2010;69(6):533–544. [Google Scholar]
- [8].Cook D, Krishnan N, Rashidi P. Activity discovery and activity recognition: A new partnership. IEEE Transactions on Systems, Man, and Cybernetics, Part B. doi: 10.1109/TSMCB.2012.2216873. to appear. [DOI] [PMC free article] [PubMed] [Google Scholar]
- [9].Vincent G, Velkoff V. The next four decades – the older population in the United States: 2010 to 2050. US Census Bureau; 2010. [Google Scholar]
- [10].Kaushik P, Intille S, Larson K. User-adaptive reminders for home-based medical tasks. A case study. Methods of Information in Medicine. 2008;47:203–207. [PubMed] [Google Scholar]
- [11].Perez-Lombard L, Ortiz J, Pout C. A review on buildings energy consumption information. Energy and Buildings. 2008;40:394–398. [Google Scholar]
- [12].Faruqui A, Sergici S, Sharif A. The impact of informational feedback on energy consumption – A survey of the experimental evidence. Energy. 2010;35:1598–1608. [Google Scholar]