

Abstract
Branched-chain keto acids (BCKAs) are associated with increased susceptibility to several degenerative diseases. However, BCKA concentrations in tissues or the amounts of tissue available are frequently at the limit of detection for standard plasma methods. To accurately and quickly determine tissue BCKAs, we have developed a sensitive ultra fast liquid chromatography–mass spectrometry (UFLC–MS) method. BCKAs from deproteinized tissue extractions were o-phenylenediamine (OPD) derivatized, ethyl acetate extracted, lyophilized in a vacuum centrifuge, and reconstituted in 200 mM ammonium acetate. Samples were injected onto a Shimadzu UFLC system coupled to an AB-Sciex 5600 Triple TOF mass spectrometer instrument that detected masses of the OPD BCKA products using a multiple reaction monitoring method. An OPD-derivatized 13C-labeled keto acid was used as an internal standard. Application of the method for C57BL/6J (wild-type) and PP2Cm knockout mouse tissues, including kidney, adipose tissue, liver, gastrocnemius, and hypothalamus, is shown. The lowest tissue concentration measured by this method was 20 nM, with the standard curve covering a wide range (7.8–32,000 nM). Liquid chromatography–mass spectrometry run times for this assay were less than 5 min, facilitating high throughput, and the OPD derivatives were found to be stable over several days.
Keywords: Branched-chain α-keto acid, Ultra fast liquid chromatography–mass spectrometry, Maple syrup urine disease, 2-Keto-3-methylvalerate, 2-Ketoisocaproate, 2-Ketoisovalerate
Branched-chain keto acids (BCKAs)1 are derived from the first step in the metabolism of branched-chain amino acids (BCAAs: leucine, isoleucine, and valine), a reversible transamination catalyzed by mitochondrial (BCAT2 or BCATm) and cytosolic (BCAT1 or BCATc) forms of branched-chain amino acid transaminase. BCAAs are essential amino acids needed to survive, but they also act as nutrient signals that regulate a number of processes either directly or during the process of metabolism. These actions include, but are not limited to, direct effects on glucose transport, insulin secretion in islet beta cells, satiety, and regulation of hepatic glucose output in the hypothalamus along with effects mediated by the mammalian target of rapamycin (mTOR) signaling pathway found in all mammalian tissues [1-9]. BCAAs and their keto acids are elevated in patients with insulin resistance, catabolic diseases, and obesity [10-12] as well as maple syrup urine disease (MSUD), an inborn error of metabolism. In MSUD, the branched-chain keto acid dehydrogenase (BCKDH) complex responsible for BCKA oxidation is mutated and defective [13,14].
Accumulation of BCKAs in MSUD has been linked to apoptosis and neuronal dysfunction [15,16]. Islet beta cells share many similarities with hypothalamic neurons. It is noteworthy, therefore, that recent studies suggest that plasma BCAA elevations in obesity may prognosticate the conversion to diabetes [17,18], which is associated with apoptosis of islet beta cells. The BCKDH phosphatase (PPm1K, PP2Cm), which elevates BCKAs when mutated [19,20], is a primary candidate gene for type II diabetes in human islets [21]. Furthermore, the E1-α subunit of BCKDH (BCKDHA) that PP2Cm dephosphorylates is a primary candidate gene for both obesity and diabetes [22]. Normal catabolism of the BCKAs also appears to be important for maintaining normal cardiac function and has been linked to cardiovascular disease [23-25]. Clearly, understanding the tissue-specific basis for the relationship of BCKAs with disease is important. Because BCKAs are formed from reversible intracellular transamination, it has been argued that BCKA concentrations provide a better reflection of the intracellular BCAA pools [26]. Changes in BCKA concentrations in tissues may also suggest altered oxidative capacity. Thus, given the emerging importance of tissue-specific BCKA metabolism in health and disease, it is important to have assays that can robustly measure their concentrations in tissues.
Previous methods have been developed to measure BCKAs in biological fluids, including reversed-phase high-performance liquid chromatography (HPLC) with fluorescence detection [27-33], gas chromatography–mass spectrometry [34], and gas–liquid chromatography [35,36]. These methods either are time-consuming or lack sensitivity for tissue as opposed to plasma BCKA concentrations. In addition, prior studies have not explored how to measure BCKAs from small tissue sizes, as would be available from mice or needle biopsies. For example, a previous HPLC method [35] modified by Hutson and Harper [37] was unable to detect certain BCKAs in some tissues/nutritional states due to low abundance [37].
Here we describe a rapid and sensitive assay for measuring BCKAs in tissue. It relies on the familiar derivatization of keto acids with o-phenylenediamine (OPD), resulting in stable cyclical 3-alkyl-2-quinoxalinol products with unique masses that could be detected by ultra fast liquid chromatography–mass spectrometry (UFLC–MS). It is quite sensitive, specifically measuring picomole quantities of BCKA per gram tissue, and has an instrument run time of less than 5 min—up to 8 times faster than the traditional HPLC method. We also show that it is widely linear, with reproducibility over a broad range of concentrations. We used this method to measure BCKAs in five tissues from C57BL/6J wild-type (WT) mice and PP2Cm knockout (KO) mice; these mice lack the BCKDH phosphatase and are a model of mild/intermittent MSUD [19]. Finally, we examined the long-term stability of the OPD adducts, which has previously been unclear. Stabilities ranging from hours [38] to weeks [39] have been reported. This new method should be quite useful for determining the tissue-specific role of BCKAs in health and disease.
Materials and methods
Mice
All procedures were conducted after review and approval by the Penn State Hershey institutional animal care and use committee. The Animal Resource Program, operated by the Department of Comparative Medicine, is accredited by Association for Assessment and Accreditation of Laboratory Animal Care (AAALAC) International.
All animal living conditions are consistent with standards laid forth in the Guide for the Care and Use of Laboratory Animals, 8th edition, published by the National Research Council. C57BL/6J mice were obtained from Jackson Laboratories (http://www.jaxmice.jax.org). The metabolic phenotype and genotyping strategy of the second mouse strain used, PP2Cm KO (a generous gift from Yibin Wang, University of California, Los Angeles), was described previously [19].
Mice were maintained in open-top, solid-bottom polycarbonate cages with wire bar lids and bedding formed from pieces of dried corncob. Lighting was controlled with a 12:12-h light/dark cycle with lights on at 0700 h and lights off at 1900 h. Water and food (Teklad 2018 Global 18% Protein Rodent Diet, Harlan, Frederick, MD, USA) were available ad libitum. Freely fed mice were anesthetized with isoflurane and euthanized via cervical dislocation in order to obtain tissues for the BCKA assay. To compare this method with previous plasma determination methods, blood was obtained from the cheek vein of WT C57BL/6J mice using Medipoint mouse lancets and pediatric green top (hematocrit) BD Microtainer blood collection tubes. Plasma was prepared according to the manufacturer’s directions.
Reagents
The BCKA standards, sodium α-keto isovalerate (KIV, CAS no. 3715-29-5), sodium α-keto isocaproate (KIC, CAS no. 4502-00-5), and sodium α-keto ß-methylvalerate (KMV, CAS no. 3715-31-9, a.k.a. (±)-3-methyl-2-oxovaleric acid sodium salt) were purchased from Santa Cruz Biotechnology (Santa Cruz, CA, USA). [U-13C]KIV uniformly labeled with the stable isotope of carbon, 13C, at all five carbons was purchased from Cambridge Isotope Laboratories (Andover, MA, USA). Ethyl acetate was purchased from VWR (Radnor, PA, USA). OPD was purchased from Sigma (St. Louis, MO, USA). The Waters Acquity UPLC BEH C18 column (2.1 × 50 mm) was purchased from Waters (Milford, MA, USA). Na2SO4 and 70% (11.6 M) perchloric acid solution were purchased from Fisher Scientific (Pittsburgh, PA, USA).
Solutions for standard curve
The underivatized BCKA standard stock solutions (KIV, KIC, and KMV) were prepared at a stock concentration of 2 mM in water. To a fresh tube, 16 μl of each keto acid stock was added. Water was then added to that tube in order to obtain a final concentration of 32 μM (32,000 nM) in a 1-ml final volume. The diluted keto acid stock solution was then diluted in a series of 1:1 dilutions in separate tubes in order to achieve a set of standards with concentrations ranging from 7.8 to 32,000 nM. The [13C]KIV internal standard (IS) was dissolved at 10 mg/ml (69.9 mM) in water and then diluted in a series of 1:10 dilutions to achieve 1 μg/ml (6.99 μM). A 2.5-μl aliquot of this IS was added to each sample and standard, giving a final amount of 2.5 ng/tube (87 nM). All keto acid stock solutions were aliquoted and stored at −80 °C until they were used once and not refrozen.
Procedure for processing tissues
Adipose tissue, gastrocnemius, liver, kidney, and hypothalamus tissues were harvested from each euthanized animal, freeze-clamped at the temperature of liquid nitrogen, wrapped in aluminum foil, and stored at −80 °C until used. The tissues were retrieved from −80 °C, maintained in liquid nitrogen on the bench, and then crushed one at a time using a metal mortar and pestle (cooled to the temperature of liquid nitrogen). The resulting powdered tissue was transferred to a tared microfuge tube (precooled in liquid nitrogen). The weight of the powdered tissue was recorded and was extracted with 3 M perchloric acid using the ratio of 300 μl of perchloric acid per 100 mg of tissue. The amount of tissue ranged from 70 to 400 mg. The tissue and acid mixture was sonicated twice for 10 s, cooled on ice, and then centrifuged at 25,000g for 15 min at 4 °C. After centrifugation, the supernatant was removed, aliquoted, and stored as tissue extractions at −80 °C until assay.
As part of a test of method accuracy, we analyzed some mouse plasma samples in order to compare our results with previous historic values obtained for human plasma [32] and rat plasma [37]. For this assay, 10 μl of plasma was precipitated with perchloric acid and centrifuged. Next, 25 μl of that supernatant was added to a new tube with 0.5 ml of 12.5 mM OPD. The following steps matched those for the tissue samples above.
BCKA derivatization and extraction
The above tissue extractions were thawed, and 50 μl of each was added to an Eppendorf tube with 2.5 ng of IS ([13C]KIV–2.5 μl of 1000 ng/ml). A serial dilution of the unlabeled BCKAs that spanned from 7.8 nM to 32 μM generated the standard curve. Each standard had 2.5 ng of IS added. To each tube containing standard or sample, 0.5 ml of 12.5 mM OPD (in 2 M HCl) was added, followed by brief vortexing. The tubes were incubated at 80 °C for 20 min, cooled on ice for 10 min, centrifuged briefly to collect all fluid at the bottom of the tube, and transferred to glass tubes containing approximately 0.08 g of Na2SO4. Next, 0.5 ml of ethyl acetate was added to each tube, followed by vortexing. The tubes were centrifuged at 500g for 15 min at room temperature (RT). The upper phase was removed using a glass Pasteur pipette and transferred into a fresh glass tube with approximately 0.08 g of Na2SO4. The original glass tubes were extracted a second time with ethyl acetate, as above, and the upper phase was transferred into the second glass tube. The second set of glass tubes were vortexed and centrifuged at 500g for 15 min at RT. The upper phase was transferred with a glass Pasteur pipette into fresh glass tubes and dried using an unheated vacuum centrifuge (drying time ~ 45 min). Following drying, the sample was reconstituted by adding 200 μl of 200 mM ammonium acetate and vortexing. After brief centrifugation to consolidate all of the fluid droplets in the tube, the 200 μl was transferred into amber HPLC sample vials for liquid chromatography–mass spectrometry (LC–MS) analysis.
LC–MS instrumentation and conditions
LC–MS analysis was performed on a Shimadzu UFLC 20ADXR LC system in-line with an AB-Sciex 5600 Triple TOF mass spectrometer. The autosampler temperature was set at 4 °C, and the injection volume was set between 0.25 and 5 μl. LC was performed at 40 °C using an Acquity UPLC BEH C18 column (1.7 μm, 2.1 × 50 mm, Waters) and a gradient system with the mobile phase consisting of solvent A (5 mM ammonium acetate) and solvent B (methanol) at a flow rate of 400 μl/min. The following gradient program was used: 55% B for 2 min, linear gradient to 95% B in 0.5 min, 95% B for 0.7 min, return to initial conditions, and equilibrate for 1 min before the next sample injection. MS experiments were performed using an AB-Sciex 5600 Triple TOF mass spectrometer with a multiple reaction monitoring (MRM) condition. The mass spectrometer was operated in positive product ion mode with a source temperature of 450 °C. The mass and transitions monitored are described in Results. For our instrument, the declustering potential was set to 90 and the collision energy was set to 30.
Quantification
The standard curve range for KIV, KIC, and KMV was 7.8 to 32,000 nM (32 μM). The calibration curves were constructed using a weighted (1/x) linear regression of peak area ratios of analytes over IS versus the concentration of the analytes. Tissues have different water contents. Therefore, to convert nM values obtained in the assay to nmol/g tissue. we took into consideration the water content of the various tissues according to Reinoso and co-workers [40].
Results
There are essentially four parts to this method: standard and tissue preparation, derivatization, extraction, and UFLC–MS analysis. The mouse tissues (adipose, gastrocnemius, liver, kidney, and hypothalamus) and plasma (for method accuracy assessment) used in this study were obtained from C57BL/6J WT mice or PP2Cm KO mice on the C57BL/6J genetic background. We decided to use an OPD derivatization and ethyl acetate extraction reported previously [26,28]; however, we modified this method to include a second ethyl acetate extraction, which led to improved recoveries (data not shown). In addition, we dissolved OPD in 2 M HCl rather than 3 M HCl, and scaled down the amount of OPD and ethyl acetate volumes and amount of Na2SO4 used, because we were using one-fifth of the sample amount that was described previously [28]. Finally, the upper (organic) phase obtained from the extraction was lyophilized in a vacuum centrifuge instead of a stream of nitrogen, and the dried sample was reconstituted in 200 μl of 200 mM ammonium acetate (pH 6.8).
Quantification of the keto acids in the mouse tissues required the preparation of standard curves (Fig. 1). Standard curves were constructed using a weighted linear regression of peak area ratios of analytes over that for the IS versus the concentration of the analytes. The concentration of standards ranged from 7.8 to 32,000 nM, as mentioned earlier. The standard curves were linear with r2 values of 0.999, 0.999, and 0.999 for KIC, KMV, and KIV, respectively. Fig. 1 is shown as a log–log transformation of the data in order to allow visualization over a broader range of concentrations. The r2 values were similar with or without log–log transformation (not shown).
Fig.1.
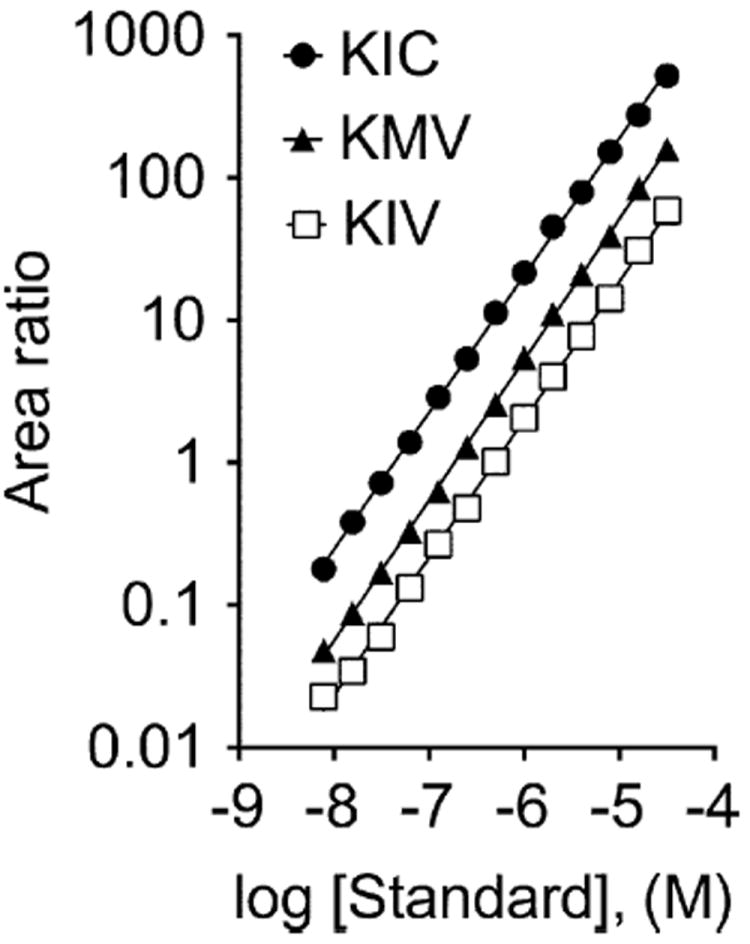
BCKA standard curves. The standard curve ranges for KIV, KIC, and KMV were 7.8 to 32,000 nM (32 μM). The calibration curves were constructed using a weighted (1/x) linear regression of peak area ratios of analytes over IS versus the concentration of analytes.
The limit of detection (LOD) for our method was determined to be 5 nM (0.02 nmol/g), and the limit of quantification (LOQ) was 15 nM (0.06 nmol/g). These were established using signal-to-noise ratios of 3 for LOD and 10 for LOQ.
Representative extracted ion chromatograms (XICs) of the standards show that the UFLC method nicely resolved the derivatized forms of KIV, KIC, and KMV (Fig. 2A). KIC had a retention time of 2.01 min and was quantified by an m/z ratio of 203.1 → 161.075. KMV had a retention time of 2.71 min and was quantified by an m/z ratio of 203.1 → 174.08. The unlabeled KIV had a retention time of 2.01 min and was quantified by an m/z transition of 189.1 → 174.08. The retention times were similar in the tissue samples (liver example: Fig. 2B; other tissues: data not shown). The [13C]KIV (IS) was quantified by an m/z ratio of 194.1 → 178.08. Both the [13C]KIV IS and the unlabeled form of KIV had identical retention times for the standard or tissue samples (cf. Fig. 2A and B).
Fig.2.
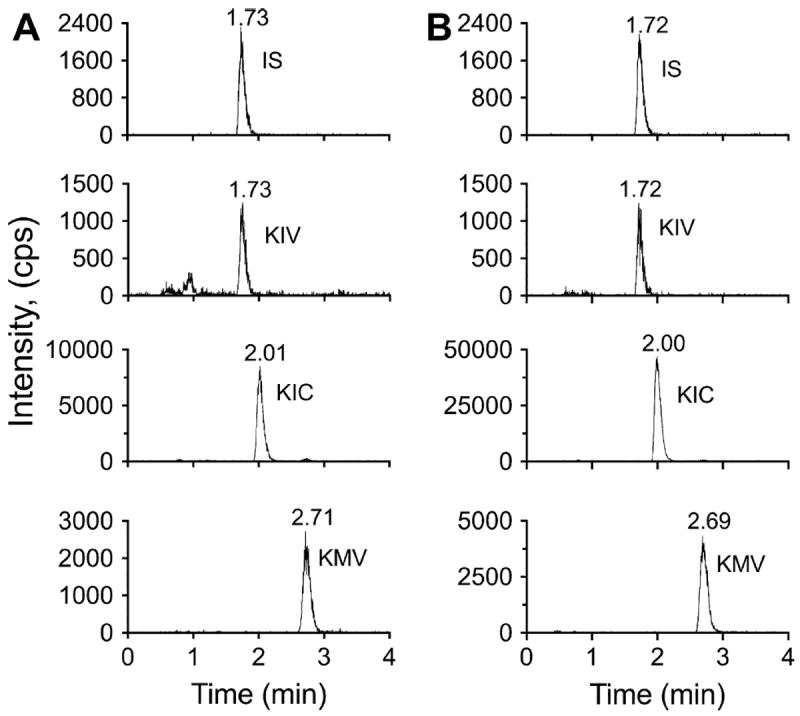
Representative chromatograms of BCKA standards and liver samples. (A) Representative XICs for the IS and BCKAs are shown. KIV had a retention time of 1.73 min and an m/z ratio of 189.1 → 174.0788. The IS had a retention time of 1.73 min and an m/z ratio of 194.1 → 178.0916. KIC had a retention time of 2.01 min and an m/z ratio of 203.1 → 161.0708. KMV had a retention time of 2.71 min and an m/z ratio of 203.1 → 174.0788. (B) Representative XICs of the IS and BCKAs are shown for a mouse liver sample. The IS and KIV had a retention time of 1.72 min, KIC had a retention time of 2.00 min, and KMV had a retention time of 2.69 min.
We assessed how the sample preparation affected keto acid recovery from biological samples by spiking WT mouse hypothalamus tissue with KIV, KIC, and KMV. Hypothalamus was chosen due to its intrinsically low average concentration of BCKAs, making it an ideal tissue to assess recovery, especially for the low spike. Representative LC–MS chromatograms for each BCKA at the no-spike (endogenous) and low-spike (15.625 nM) concentrations in hypothalamus tissue samples are shown in Fig. 3. The BCKA concentrations in this tissue are above both the LOD and LOQ. The calculation recoveries for KIV spiking at different concentrations into WT hypothalamus tissue extractions are summarized in Table 1. Only KIV recovery was calculated. Because the IS used in this recovery analysis is an isotope-labeled form of KIV, its recovery assessment should be very accurate. We found that most of the KIV recoveries were above 90% and not statistically different (one-way analysis of variance) between the different spiking amounts tested.
Fig.3.
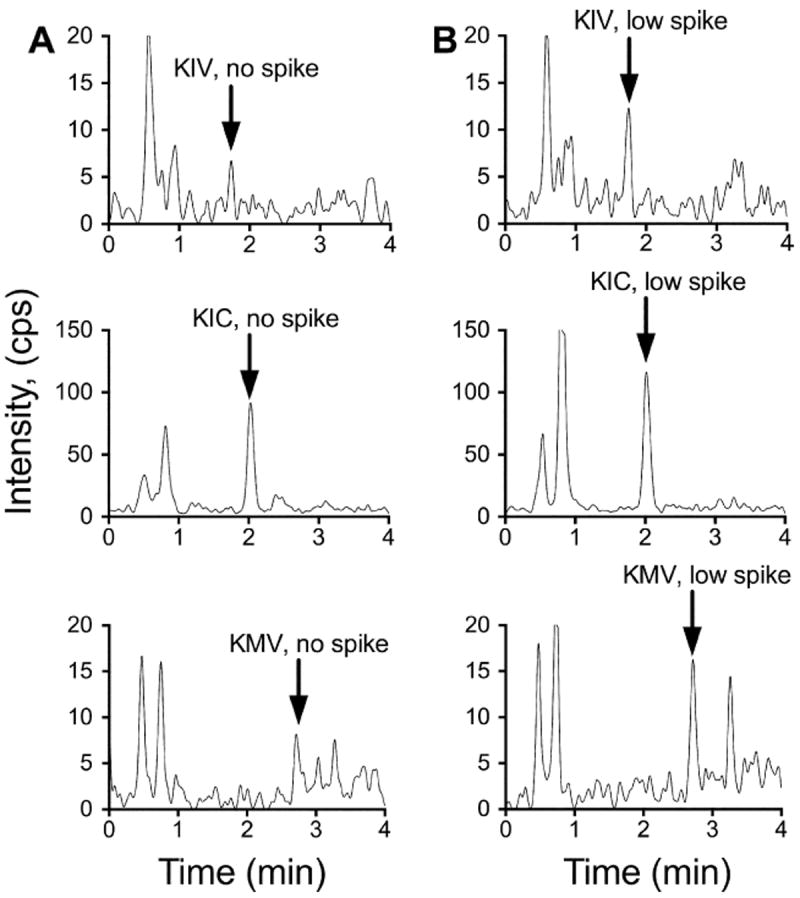
Representative chromatograms of BCKAs in no-spike and low-spike hypothalamus samples. (A) Representative XICs are shown for KIV, KIC, and KMV in a hypothalamus sample that was not spiked (i.e., endogenous signal for each BCKA). (B) Representative XICs are shown for KIV, KIC, and KMV in a hypothalamus sample spiked with 15.6 nM of each BCKA.
Table 1.
Recoveries of KIV added to hypothalamus tissue based on [13C]KIV IS.
| Recovery (%)
|
|||||
|---|---|---|---|---|---|
| 15.625 nM added | 31.25 nM added | 125 nM added | 1000 nM added | 8000 nM added | |
| KIV | 95 ± 16 | 76 ± 8 | 96.0 ± 12 | 93 ± 2.9 | 94 ± 3.9 |
Note: Data are means ± standard errors (n = 3).
Table 2 shows the BCKA concentrations in different tissues studied; both the biological (n = 3) and technical (n = 3) replicates are shown. These values were generated by three independent experiments per animal per tissue and were normalized according to the tissue wet weight (g) and percentage of water within each tissue type. As expected, the BCKA concentrations were generally much lower in tissues from WT mice versus KO mice. The three lowest average BCKA values detected were 0.074 and 0.075 nmol/g (74 or 75 pmol/g) in WT livers (KIV) and 0.078 nmol/g (78 pmol/g) in one WT hypothalamus (KIC). These values were within the standard curve range and above the LOD (0.02 nmol/g) and LOQ (0.06 nmol/g). The three highest average BCKA values detected were 36.1 nmol/g in KO liver (KMV) and 36.9 nmol/g (KIV) and 49.9 nmol/g (KMV) in KO gastrocnemius, a tissue that expresses BCATm but where BCKDH is mostly in the inactive form in healthy animals. As shown in Table 2, the interassay coefficient of variability (CV; labeled as technical percentage error) is generally higher among samples from the WT mice versus KO mice. This is attributed to the lower values found in the WT mice. The average overall CVs for KIV, KIC, and KMV were 4.6%, 5.7%, and 8.9%, respectively, in tissues from KO mice.
Table 2.
Technical and biological replicates of mouse tissue BCKA concentrations.
| KIV (nmol/g) | KIC (nmol/g) | KMV (nmol/g) | |
|---|---|---|---|
| Kidney | |||
| WT1 | 0.88 ± 0.05 | 1.90 ± 0.17 | 0.74 ± 0.09 |
| WT2 | 0.63 ± 0.06 | 0.97 ± 0.12 | 0.48 ± 0.11 |
| WT3 | 0.60 ± 0.03 | 1.10 ± 0.07 | 0.51 ± 0.10 |
| Technical % error | 6.72% | 9.04% | 17.90% |
| Biological mean ± SE | 0.70 ± 0.09 | 1.32 ± 0.293 | 0.57 ± 0.08 |
| KO1 | 2.13 ± 0.11 | 6.529 ± 0.22 | 4.10 ± 0.36 |
| KO2 | 1.62 ± 0.07 | 3.81 ± 0.30 | 2.60 ± 0.47 |
| KO3 | 2.35 ± 0.21 | 7.41 ± 0.35 | 4.70 ± 0.44 |
| Technical % error | 6.35% | 4.88% | 11.10% |
| Biological mean ± SE | 2.03 ± 0.22 | 5.91 ± 1.10 | 3.79 ± 0.62 |
| Adipose tissue | |||
| WT1 | 0.63 ± 0.03 | 0.31 ± 0.08 | 0.18 ± 0.05 |
| WT2 | 0.58 ± 0.02 | 0.41 ± 0.02 | 0.15 ± 0.01 |
| WT3 | 1.01 ± 0.12 | 1.07 ± 0.19 | 0.53 ± 0.02 |
| Technical % error | 7.40% | 16.40% | 9.44% |
| Biological mean ± SE | 0.74 ± 0.14 | 0.59 ± 0.24 | 0.29 ± 0.12 |
| KO1 | 2.02 ± 0.13 | 2.35 ± 0.37 | 1.02 ± 0.19 |
| KO2 | 15.10 ± 0.35 | 8.76 ± 0.35 | 10.30 ± 0.48 |
| KO3 | 3.48 ± 0.14 | 5.42 ± 0.73 | 3.17 ± 0.70 |
| Technical % error | 3.01% | 8.77% | 9.48% |
| Biological mean ± SE | 6.87 ± 4.15 | 5.51 ± 1.85 | 4.82 ± 2.80 |
| Gastrocnemius | |||
| WT1 | 4.54 ± 0.10 | 5.21 ± 0.78 | 3.15 ± 0.72 |
| WT2 | 2.93 ± 0.07 | 3.05 ± 0.12 | 1.23 ± 0.08 |
| WT3 | 4.23 ± 0.14 | 6.30 ± 0.65 | 3.23 ± 0.68 |
| Technical % error | 2.64% | 10.60% | 19.50% |
| Biological mean ± SE | 3.90 ± 0.49 | 4.85 ± 0.96 | 2.53 ± 0.66 |
| KO1 | 8.68 ± 1.20 | 16.90 ± 1.80 | 8.27 ± 0.86 |
| KO2 | 36.90 ± 1.50 | 26.40 ± 0.50 | 49.90 ± 1.70 |
| KO3 | 13.50 ± 1.20 | 24.50 ± 1.50 | 13.20 ± 0.94 |
| Technical % error | 6.74% | 5.61% | 4.83% |
| Biological mean ± SE | 19.70 ± 8.70 | 22.60 ± 2.90 | 23.80 ± 13.00 |
| Liver | |||
| WT1 | 0.074 ± 0.01 | 0.369 ± 0.03 | 0.171 ± 0.02 |
| WT2 | 0.214 ± 0.022 | 1.364 ± 0.102 | 0.219 ± 0.03 |
| WT3 | 0.075 ± 0.02 | 0.809 ± 0.08 | 0.189 ± 0.02 |
| Technical % error | 12.10% | 8.34% | 12.10% |
| Biological mean ± SE | 0.121 ± 0.05 | 0.847 ± 0.29 | 0.193 ± 0.01 |
| KO1 | 0.73 ± 0.12 | 5.27 ± 0.81 | 2.22 ± 0.42 |
| KO2 | 17.60 ± 0.45 | 29.70 ± 0.84 | 36.10 ± 1.60 |
| KO3 | 8.33 ± 0.43 | 22.10 ± 1.62 | 11.80 ± 1.10 |
| Technical % error | 3.75% | 5.73% | 6.27% |
| Biological mean ± SE | 8.90 ± 4.90 | 19.00 ± 7.20 | 16.70 ± 10.00 |
| Hypothalamus | |||
| WT1 | 0.32 ± 0.05 | 0.15 ± 0.003 | 0.14 ± 0.004 |
| WT2 | 0.25 ± 0.008 | 0.095 ± 0.004 | 0.114 ± 0.006 |
| WT3 | 0.176 ± 0.011 | 0.078 ± 0.009 | 0.092 ± 0.009 |
| Technical % error | 9.19% | 4.88% | 5.57% |
| Biological mean ± SE | 0.25 ± 0.04 | 0.11 ± 0.02 | 0.11 ± 0.01 |
| KO1 | 0.66 ± 0.041 | 0.60 ± 0.011 | 0.48 ± 0.01 |
| KO2 | 1.07 ± 0.01 | 1.14 ± 0.06 | 1.31 ± 0.06 |
| KO3 | 0.27 ± 0.01 | 0.17 ± 0.01 | 0.17 ± 0.01 |
| Technical % error | 3.20% | 3.53% | 4.18% |
| Biological mean ± SE | 0.67 ± 0.231 | 0.73 ± 0.364 | 0.65 ± 0.341 |
Note: SE, standard error. Technical replicates were determined in triplicate from each sample; means ± standard deviations are shown. Biological means ± standard errors were calculated from three replicates of each animal tissue (n = 3 animals). BCKAs are expressed as nmol/g wet tissue weight and are adjusted according to each tissue’s water content as reported previously [38]. Technical percent errors were calculated from triplicate assays of each biological sample by dividing the standard deviation by the mean and multiplying by 100. The KO mice tended to be more variable.
There are conflicting reports of the stability of the OPD–BCKA adducts; therefore, we assayed whether the samples, reconstituted in a pH 6.8 buffer, were stable during long-term storage in the dark within a refrigerator. OPD–BCKA adducts were prepared from kidney samples and analyzed before and after dark storage at 4 °C for 9 days (Table 3). Despite individual variability, when examined as a group, there is no statistical difference in the values before and after storage (difference was −0.08 ± 1.9%, n = 18). However, after 1 month, a significant 11 ± 0.2% decrease was observed in the calculated BCKA concentrations of refrigerated adducts using fresh calibration standards in the second assay (data not shown). Notably, the new calibration standards gave similar peak heights as the earlier ones (data not shown). Our recommendation, therefore, would be to not store the derivatized standards unfrozen at 4 °C for more than 9 days. This stability is consistent with the findings of Kieber and Mopper [39].
Table 3.
Long-term 4 °C stability of derivatized BCKAs at pH 6.8.
| % Change | Time elapsed (days) | |||
|---|---|---|---|---|
|
| ||||
| KIV | KIC | KMV | ||
| WT1 | −0.21 | 4.05 | −2.78 | 9 |
| WT2 | −4.06 | 10.4 | 17.6 | 9 |
| WT3 | 2.25 | 11.3 | 0.85 | 9 |
| KO1 | −12.2 | −5.24 | −14.1 | 9 |
| KO2 | −7.38 | 3.25 | −5.97 | 9 |
| KO3 | −0.22 | 7.04 | −6.09 | 9 |
Note: Values are expressed as percentage change, where a minus sign (−) denotes a decrease from day 1 values. The tissue samples analyzed were kidney. The samples were assayed on day 1 and then stored at 4 °C in 200 mM ammonium acetate (pH 6.8) in the dark. After 9 days of storage, they were subjected to UFLC–MS again. Each value represents the percentage change in a single sample. The mean of these values is not significantly different from zero (P < 0.05).
Although a major goal of this study was to develop a sensitive method that could detect the low concentrations of BCKAs found in tissue, we also wanted to ensure that our method was accurate and consistent with previous methods. Therefore, we compared our findings with a previous study by Hutson and Harper [37] in which tissues were studied from rats fed a stock diet. Their gastrocnemius BCKA concentrations were approximately 6 nmol/g for KIV, 6 nmol/g for KIC, and 3 nmol/g for KMV. These are comparable to our WT mouse gastrocnemius (fed animals) values of approximately 4, 5, and 3 nmol/g for KIV, KIC, and KMV, respectively. Hutson and Harper also measured BCKAs in rodent heart and liver but detected only KIC in these two tissues. In contrast, the method described in the current study detected all BCKAs (KIV, KIC, and KMV) in all of the tissues we tested; this includes studies in which BCKAs were determined for a collaborator in mouse hearts (data not shown). To further address method accuracy in comparison with historic values, we also measured BCKAs in mouse plasma from WT mice and found concentrations of 13 μM for KIV, 15 μM for KIC, and 17 μM for KMV. These values were similar to those for human plasma, as compiled by Pailla and co-workers [32] and a rat study in which the animals were also fed a standard chow diet [37].
Discussion
We have described a new UFLC–MS method for quantification of the pmol/g concentrations of BCKA tissue samples. The tissue requirements of the assay are small enough to facilitate analysis of mouse samples. With a run time of less than 5 min, it is possible to perform up to 12 analyses per hour, saving shared instrument time costs over other methods. This is advantageous, therefore, when multiple tissues from large cohorts need to be analyzed. Furthermore, the derivatized products appear to be sufficiently stable that they can be prepared several days prior to analysis by UFLC–MS without the sample integrity being compromised. We found that the LOD and LOQ were 0.02 and 0.06 nmol/g, respectively, allowing detection and quantification of 0.074 nmol/g (74 pmol/g) in this study. The wide range of linearity of the assay allows the method to be suitable for comparing BCKAs in WT mice from mouse models of MSUD or other pathologies of BCAA metabolism.
The PP2Cm KO mouse model has a defect in BCKD activity and, therefore, had the expected elevations in tissue BCKA concentrations based on previous plasma measurements [19]; this makes it ideal as a positive control. For example, the average KIV, KIC, and KMV values were 73-, 22-, and 86-fold higher, respectively, in livers from PP2Cm KO mice versus WT mice. In addition, we did not come across a situation where a BCKA was not detected in a tissue; therefore, the likelihood of a false negative is low.
Many techniques have successfully measured BCKAs in biological fluids such as plasma and urine [27-36]. In addition, Hutson and Harper measured BCKAs in rat tissues using a gas chromatography (GC) method, and this is the only publication we found that describes measurement of BCKAs in tissue [37]. Pailla and co-workers summarized eight previous publications that used the techniques of HPLC with fluorescence detection, ultraviolet (UV), and chemiluminescence as methods to measure BCKAs in plasma. They reported average concentrations of BCKAs for plasma samples; the lowest concentration reported was 12 μM [32].
Our goal was to devise a method to measure BCKAs in tissues where concentrations are lower than those in plasma. The values we obtained with this method were comparable to detectable values in tissues from rats on normal chow reported by Hutson and Harper [37]. However, because such comparative data are relatively limited, we also used the method to compare BCKA concentrations in plasma with literature values. Assay of BCKAs was achieved using just 10 μl of mouse plasma, and the determined values were comparable to previously reported concentrations in human and rat plasma.
The analysis of tissue BCKAs can provide important information on the metabolic and nutritional state of an animal. However, a challenge has been that their concentrations are much lower in tissues than in plasma and that many studies are currently performed on mice [19,41] that have limited amounts of tissues compared with other animal models. Human tissue biopsies are also normally limited. Therefore, it is advantageous to have minimal tissue requirements for metabolite assays. The smallest tissue size used in this study was 70 mg. Because we eventually used only 25% of final diluted tissue extraction, it should be possible to use even smaller amounts of frozen tissue for BCKA analysis. A caveat is that frozen powders of pathological samples may be heterogeneous mixtures of fibrous material, tissue, and tissue ice. Therefore, larger samples under these circumstances may improve accuracy or values can be ratioed to an unaffected metabolite such as phenylalanine.
In the five tissues we examined, the concentrations of BCKAs in the WT animals were highest in muscle with an order that was gastrocnemius > kidney > adipose > liver > hypothalamus. These differences are likely related to the varying transamination capacities, BCKDH total specific activities, and BCKDH activity states of these tissues.
In conclusion, we have presented a fast UFLC–MS method with a straightforward derivatization and extraction procedure for detecting BCKAs in mouse tissues. This method should be useful for studying BCAA/BCKA metabolism in normal tissues and in pathological situations including mouse models of MSUD.
Acknowledgments
This work was supported by National Institutes of Health grants DK091784 and DK062880. We thank Heather Zimmerman for harvesting the tissues used in this manuscript. UFLC–MS was performed in the Penn State College of Medicine Mass Spectrometry/Proteomics Core Facility.
Footnotes
Abbreviations used: BCKA, branched-chain keto acid; BCAA, branched-chain amino acid; MSUD, maple syrup urine disease; BCKDH, branched-chain keto acid dehydrogenase; HPLC, high-performance liquid chromatography; OPD, o-phenylenediamine; UFLC–MS, ultra fast liquid chromatography–mass spectrometry; WT, wild-type; KO, knockout; KIV, sodium α-keto isovalerate; KIC, sodium α-keto isocaproate; KMV, sodium α-keto β-methylvalerate; IS, internal standard; RT, room temperature; LC–MS, liquid chromatography–mass spectrometry; LOD, limit of detection; LOQ, limit of quantification; XIC, extracted ion chromatogram.
References
- 1.Su Y, Lam TK, He W, Pocai A, Bryan J, Aguilar-Bryan L, Gutierrez-Juarez R. Hypothalamic leucine metabolism regulates liver glucose production. Diabetes. 2012;61:85–93. doi: 10.2337/db11-0857. [DOI] [PMC free article] [PubMed] [Google Scholar]
- 2.Lynch CJ, Gern B, Lloyd C, Hutson SM, Eicher R, Vary TC. Leucine in food mediates some of the postprandial rise in plasma leptin concentrations. Am J Physiol Endocrinol Metab. 2006;291:E621–E630. doi: 10.1152/ajpendo.00462.2005. [DOI] [PubMed] [Google Scholar]
- 3.Cota D, Proulx K, Smith KA, Kozma SC, Thomas G, Woods SC, Seeley RJ. Hypothalamic mTOR signaling regulates food intake. Science. 2006;312:927–930. doi: 10.1126/science.1124147. [DOI] [PubMed] [Google Scholar]
- 4.van Loon LJ. Leucine as a pharmaconutrient in health and disease. Curr Opin Clin Nutr Metab Care. 2012;15:71–77. doi: 10.1097/MCO.0b013e32834d617a. [DOI] [PubMed] [Google Scholar]
- 5.Adams SH. Emerging perspectives on essential amino acid metabolism in obesity and the insulin-resistant state. Adv Nutr. 2011;2:445–456. doi: 10.3945/an.111.000737. [DOI] [PMC free article] [PubMed] [Google Scholar]
- 6.MacDonald MJ. Elusive proximal signals of beta-cells for insulin secretion. Diabetes. 1990;39:1461–1466. doi: 10.2337/diab.39.12.1461. [DOI] [PubMed] [Google Scholar]
- 7.Nishitani S, Matsumura T, Fujitani S, Sonaka I, Miura Y, Yagasaki K. Leucine promotes glucose uptake in skeletal muscles of rats. Biochem Biophys Res Commun. 2002;299:693–696. doi: 10.1016/s0006-291x(02)02717-1. [DOI] [PubMed] [Google Scholar]
- 8.Um SH, D’Alessio D, Thomas G. Nutrient overload, insulin resistance, and ribosomal protein S6 kinase 1, S6K1. Cell Metab. 2006;3:393–402. doi: 10.1016/j.cmet.2006.05.003. [DOI] [PubMed] [Google Scholar]
- 9.Dennis PB, Jaeschke A, Saitoh M, Fowler B, Kozma SC, Thomas G. Mammalian TOR: a homeostatic ATP sensor. Science. 2001;294:1102–1105. doi: 10.1126/science.1063518. [DOI] [PubMed] [Google Scholar]
- 10.She P, Van Horn C, Reid T, Hutson SM, Cooney RN, Lynch CJ. Obesity-related elevations in plasma leucine are associated with alterations in enzymes involved in branched-chain amino acid metabolism. Am J Physiol Endocrinol Metab. 2007;293:E1552–E1563. doi: 10.1152/ajpendo.00134.2007. [DOI] [PMC free article] [PubMed] [Google Scholar]
- 11.Newgard CB, An J, Bain JR, Muehlbauer MJ, Stevens RD, Lien LF, Haqq AM, Shah SH, Arlotto M, Slentz CA, Rochon J, Gallup D, Ilkayeva O, Wenner BR, Yancy WS, Jr, Eisenson H, Musante G, Surwit RS, Millington DS, Butler MD, Svetkey LP. A branched-chain amino acid-related metabolic signature that differentiates obese and lean humans and contributes to insulin resistance. Cell Metab. 2009;9:311–326. doi: 10.1016/j.cmet.2009.02.002. [DOI] [PMC free article] [PubMed] [Google Scholar]
- 12.Felig P, Marliss E, Cahill GF., Jr Plasma amino acid levels and insulin secretion in obesity. N Engl J Med. 1969;281:811–816. doi: 10.1056/NEJM196910092811503. [DOI] [PubMed] [Google Scholar]
- 13.Mitsubuchi H, Owada M, Endo F. Markers associated with inborn errors of metabolism of branched-chain amino acids and their relevance to upper levels of intake in healthy people: an implication from clinical and molecular investigations on maple syrup urine disease. J Nutr. 2005;135:1565S–1570S. doi: 10.1093/jn/135.6.1565S. [DOI] [PubMed] [Google Scholar]
- 14.Chuang DT, Chuang JL, Wynn RM. Lessons from genetic disorders of branched-chain amino acid metabolism. J Nutr. 2006;136:243S–249S. doi: 10.1093/jn/136.1.243S. [DOI] [PubMed] [Google Scholar]
- 15.Jouvet P, Rustin P, Taylor DL, Pocock JM, Felderhoff-Mueser U, Mazarakis ND, Sarraf C, Joashi U, Kozma M, Greenwood K, Edwards AD, Mehmet H. Branched chain amino acids induce apoptosis in neural cells without mitochondrial membrane depolarization or cytochrome c release: implications for neurological impairment associated with maple syrup urine disease. Mol Biol Cell. 2000;11:1919–1932. doi: 10.1091/mbc.11.5.1919. [DOI] [PMC free article] [PubMed] [Google Scholar]
- 16.Funchal C, Gottfried C, De Almeida LM, Wajner M, Pessoa-Pureur R. Evidence that the branched-chain α-keto acids accumulating in maple syrup urine disease induce morphological alterations and death in cultured astrocytes from rat cerebral cortex. Glia. 2004;48:230–240. doi: 10.1002/glia.20072. [DOI] [PubMed] [Google Scholar]
- 17.Cheng S, Rhee EP, Larson MG, Lewis GD, McCabe EL, Shen D, Palma MJ, Roberts LD, Dejam A, Souza AL, Deik AA, Magnusson M, Fox CS, O’Donnell CJ, Vasan RS, Melander O, Clish CB, Gerszten RE, Wang TJ. Metabolite profiling identifies pathways associated with metabolic risk in humans. Circulation. 2012;125:2222–2231. doi: 10.1161/CIRCULATIONAHA.111.067827. [DOI] [PMC free article] [PubMed] [Google Scholar]
- 18.Wang TJ, Larson MG, Vasan RS, Cheng S, Rhee EP, McCabe E, Lewis GD, Fox CS, Jacques PF, Fernandez C, O’Donnell CJ, Carr SA, Mootha VK, Florez JC, Souza A, Melander O, Clish CB, Gerszten RE. Metabolite profiles and the risk of developing diabetes. Nat Med. 2011;17:448–453. doi: 10.1038/nm.2307. [DOI] [PMC free article] [PubMed] [Google Scholar]
- 19.Lu G, Sun H, She P, Youn JY, Warburton S, Ping P, Vondriska TM, Cai H, Lynch CJ, Wang Y. Protein phosphatase 2Cm is a critical regulator of branched-chain amino acid catabolism in mice and cultured cells. J Clin Invest. 2009;119:1678–1687. doi: 10.1172/JCI38151. [DOI] [PMC free article] [PubMed] [Google Scholar]
- 20.Oyarzabal A, Martinez-Pardo M, Merinero B, Navarrete R, Desviat LR, Ugarte M, Rodriguez-Pombo P. A novel regulatory defect in the branched-chain α-ketoacid dehydrogenase complex due to a mutation in the PPM1K gene causes a mild variant phenotype of maple syrup urine disease. Hum Mutat. 2013;34:355–362. doi: 10.1002/humu.22242. [DOI] [PubMed] [Google Scholar]
- 21.Taneera J, Lang S, Sharma A, Fadista J, Zhou Y, Ahlqvist E, Jonsson A, Lyssenko V, Vikman P, Hansson O, Parikh H, Korsgren O, Soni A, Krus U, Zhang E, Jing XJ, Esguerra JL, Wollheim CB, Salehi A, Rosengren A, Renstrom E, Groop L. A systems genetics approach identifies genes and pathways for type 2 diabetes in human islets. Cell Metab. 2012;16:122–134. doi: 10.1016/j.cmet.2012.06.006. [DOI] [PubMed] [Google Scholar]
- 22.Tiffin N, Adie E, Turner F, Brunner HG, van Driel MA, Oti M, Lopez-Bigas N, Ouzounis C, Perez-Iratxeta C, Andrade-Navarro MA, Adeyemo A, Patti ME, Semple CA, Hide W. Computational disease gene identification: a concert of methods prioritizes type 2 diabetes and obesity candidate genes. Nucleic Acids Res. 2006;34:3067–3081. doi: 10.1093/nar/gkl381. [DOI] [PMC free article] [PubMed] [Google Scholar]
- 23.Sun H, Lu G, Ren S, Chen J, Wang Y. Catabolism of branched-chain amino acids in heart failure: insights from genetic models. Pediatr Cardiol. 2011;32:305–310. doi: 10.1007/s00246-010-9856-9. [DOI] [PMC free article] [PubMed] [Google Scholar]
- 24.Funchal C, Gottfried C, de Almeida LM, dos Santos AQ, Wajner M, Pessoa-Pureur R. Morphological alterations and cell death provoked by the branched-chain α-amino acids accumulating in maple syrup urine disease in astrocytes from rat cerebral cortex. Cell Mol Neurobiol. 2005;25:851–867. doi: 10.1007/s10571-005-4938-6. [DOI] [PMC free article] [PubMed] [Google Scholar]
- 25.Huang Y, Zhou M, Sun H, Wang Y. Branched-chain amino acid metabolism in heart disease: an epiphenomenon or a real culprit? Cardiovasc Res. 2011;90:220–223. doi: 10.1093/cvr/cvr070. [DOI] [PMC free article] [PubMed] [Google Scholar]
- 26.Wolfe RR, Chinkes DL. Isotope Tracers in Metabolic Research. John Wiley; Hoboken, NJ: 2005. Whole body protein synthesis and breakdown; pp. 299–323. [Google Scholar]
- 27.Anumula KR. Rapid quantitative determination of sialic acids in glycoproteins by high-performance liquid chromatography with a sensitive fluorescence detection. Anal Biochem. 1995;230:24–30. doi: 10.1006/abio.1995.1432. [DOI] [PubMed] [Google Scholar]
- 28.Hayashi T, Tsuchiya H, Todoriki H, Naruse H. High-performance liquid chromatographic determination of α-keto acids in human urine and plasma. Anal Biochem. 1982;122:173–179. doi: 10.1016/0003-2697(82)90267-6. [DOI] [PubMed] [Google Scholar]
- 29.Hayashi T, Tsuchiya H, Naruse H. High-performance liquid chromatographic determination of α-keto acids in plasma with fluorometric detection. J Chromatogr. 1983;273:245–252. doi: 10.1016/s0378-4347(00)80946-9. [DOI] [PubMed] [Google Scholar]
- 30.Koike K, Koike M. Fluorescent analysis of α-keto acids in serum and urine by high-performance liquid chromatography. Anal Biochem. 1984;141:481–487. doi: 10.1016/0003-2697(84)90074-5. [DOI] [PubMed] [Google Scholar]
- 31.Hara S, Takemori Y, Yamaguchi M, Nakamura M, Ohkura Y. Determination of α-keto acids in serum and urine by high-performance liquid chromatography with fluorescence detection. J Chromatogr. 1985;344:33–39. doi: 10.1016/s0378-4347(00)82004-6. [DOI] [PubMed] [Google Scholar]
- 32.Pailla K, Blonde-Cynober F, Aussel C, De Bandt JP, Cynober L. Branched-chain keto-acids and pyruvate in blood: measurement by HPLC with fluorimetric detection and changes in older subjects. Clin Chem. 2000;46:848–853. [PubMed] [Google Scholar]
- 33.Kand’ar R, Zakova P, Jirosova J, Sladka M. Determination of branched chain amino acids, methionine, phenylalanine, tyrosine, and α-keto acids in plasma and dried blood samples using HPLC with fluorescence detection. Clin Chem Lab Med. 2009;47:565–572. doi: 10.1515/CCLM.2009.123. [DOI] [PubMed] [Google Scholar]
- 34.Fernandes AA, Kalhan SC, Njoroge FG, Matousek GS. Quantitation of branched-chain α-keto acids as their N-methylquinoxalone derivatives: comparison of O- and N-alkylation versus – silylation. Biomed Environ Mass Spectrom. 1986;13:569–581. doi: 10.1002/bms.1200131009. [DOI] [PubMed] [Google Scholar]
- 35.Cree TC, Hutson SM, Harper AE. Gas–liquid chromatography of α-keto acids: quantification of the branched-chain α-keto acids from physiological sources. Anal Biochem. 1979;92:159–163. doi: 10.1016/0003-2697(79)90638-9. [DOI] [PubMed] [Google Scholar]
- 36.Crowell PL, Miller RH, Harper AE. Measurement of plasma and tissue levels of branched-chain α-keto acids by gas–liquid chromatography. Methods Enzymol. 1988;166:39–46. doi: 10.1016/s0076-6879(88)66009-5. [DOI] [PubMed] [Google Scholar]
- 37.Hutson SM, Harper AE. Blood and tissue branched-chain amino and α-keto acid concentrations: effect of diet, starvation, and disease. Am J Clin Nutr. 1981;34:173–183. doi: 10.1093/ajcn/34.2.173. [DOI] [PubMed] [Google Scholar]
- 38.Walser M, Swain LM, Alexander V. Measurement of branched-chain ketoacids in plasma by high-performance liquid chromatography. Anal Biochem. 1987;164:287–291. doi: 10.1016/0003-2697(87)90494-5. [DOI] [PubMed] [Google Scholar]
- 39.Kieber DJ, Mopper K. Reversed-phasehigh-performance liquid chromatographic analysis of α-keto acid quinoxalinol derivatives: optimization of technique and application to natural samples. J Chromatogr A. 1983;281:135–149. [Google Scholar]
- 40.Reinoso RF, Telfer BA, Rowland M. Tissue water content in rats measured by desiccation. J Pharmacol Toxicol Methods. 1997;38:87–92. doi: 10.1016/s1056-8719(97)00053-1. [DOI] [PubMed] [Google Scholar]
- 41.Homanics GE, Skvorak K, Ferguson C, Watkins S, Paul HS. Production and characterization of murine models of classic and intermediate maple syrup urine disease. BMC Med Genet. 2006;7:33. doi: 10.1186/1471-2350-7-33. [DOI] [PMC free article] [PubMed] [Google Scholar]