

Abstract
Repeated Δ9-tetrahydrocannabinol (THC) administration produces desensitization and downregulation of cannabinoid type 1 receptors (CB1Rs) in the brain, but the magnitude of these adaptations varies among regions. CB1Rs in the striatum and its output regions exhibit the least magnitude and slowest development of desensitization and downregulation. The molecular mechanisms that confer these region-dependent differences are not known. The stable transcription factor, ΔFosB, is induced in the striatum following repeated THC administration and could regulate CB1Rs. To directly compare the regional profile of ΔFosB induction and CB1R desensitization and downregulation, mice were treated with THC (10 mg/kg) or vehicle for 13.5 days. CP55,940-stimulated [35S]GTPγS autoradiography and immunohistochemistry were performed to measure CB1R desensitization and downregulation, respectively, and ΔFosB expression was measured by immunoblot. Significant CB1R desensitization and downregulation occurred in the prefrontal cortex, lateral amygdala and hippocampus; desensitization was found in the basomedial amygdala and no changes were seen in remaining regions. ΔFosB was induced in the prefrontal cortex, caudate-putamen, nucleus accumbens and lateral amygdala. An inverse regional relationship between ΔFosB expression and CB1R desensitization was found, such that regions with the greatest ΔFosB induction did not exhibit CB1R desensitization and areas without ΔFosB induction had the greatest desensitization, with remaining regions exhibiting intermediate levels of both. Dual immunohistochemistry in the striatum showed both CB1R co-localization with ΔFosB in cells and CB1R puncta surrounding ΔFosB-positive cells. THC-induced expression of ΔFosB was absent in the striatum of CB1R knockout mice. These data suggest that transcriptional targets of ΔFosB might inhibit CB1R desensitization and/or that ΔFosB induction could be limited by CB1R desensitization.
Keywords: G-protein, cannabinoid, nucleus accumbens, caudate-putamen, hippocampus
1. Introduction
Marijuana is the most widely used illicit drug in the United States and its repeated use leads to the development of both tolerance and withdrawal symptoms, which are included in the DSM-IV criteria for cannabis use disorder (American Psychiatric Association, 2000; SAMHSA, 2010). Δ9-Tetrahydrocannabinol (THC) is the main psychoactive constituent of marijuana and produces its behavioral effects via cannabinoid type 1 receptors (CB1Rs), which are G-protein-coupled receptors that are widely distributed in the brain (Howlett et al., 2002). Cannabinoid-mediated effects in rodents include antinociception, hypothermia, catalepsy, hypolocomotion and memory impairment (Howlett et al., 2002; Varvel and Lichtman, 2002). Repeated THC administration produces tolerance to these effects and withdrawal occurs upon cessation of treatment or antagonist administration (Lichtman and Martin, 2005). Studies have revealed alterations in CB1R signaling following repeated cannabinoid treatment, but the relationship between these molecular adaptations and tolerance and dependence are not well understood. Repeated THC administration decreases both CB1R levels (downregulation) and CB1R-mediated G-protein and effector activity (desensitization) in rodent brain (Sim-Selley, 2003). Several studies have demonstrated that there are differences among brain regions in the magnitude and temporal properties of CB1R desensitization and downregulation. Specifically, CB1R desensitization and downregulation occur at lower agonist doses and develop more rapidly in the hippocampus than in the striatum (caudate-putamen and nucleus accumbens) (Breivogel et al., 1999; McKinney et al., 2008). These findings appear to translate to human cannabis users. CB1R levels were lower in the brains of marijuana users compared to non-users, and the magnitude of apparent downregulation exhibited a similar regional pattern as seen in rodents (Villares, 2007). Region-specific reductions in CB1R binding have also been reported using in vivo imaging in subjects that were marijuana users (Hirvonen et al., 2012). The recovery of CB1R levels and activity after cessation of cannabinoid treatment was slower in the hippocampus than striatum in rodents (Sim-Selley et al., 2006). Similarly, reduced CB1R binding in human brain persisted in the hippocampus after ~4 weeks of abstinence from marijuana, whereas binding in other regions appeared similar to pre-drug levels at this time point (Hirvonen et al., 2012). These observations are important because the hippocampus is associated with cognitive and memory impairing effects of cannabinoids, whereas the striatum mediates motivational and motor effects of these drugs (Breivogel and Sim-Selley, 2009). In fact, studies in human marijuana users suggest that greater tolerance develops to memory impairment compared to motor or subjective measures such as “high” (D’Souza et al., 2008; Haney et al., 2004; Ramaekers et al., 2009).
The mechanisms underlying regional differences in CB1R adaptations are not known, but differences in the expression of signaling and regulatory proteins among brain regions, and changes in their expression following repeated THC administration, could contribute to these findings. ΔFosB, a truncated splice variant of the transcription factor FosB, is modestly induced following a single drug injection, but accumulates upon repeated drug administration and is stable for weeks after cessation of treatment (Chen et al., 1997). Treatment with several drugs of abuse, including opiates and cocaine, induces ΔFosB in the striatum (Nestler et al., 2001). We showed that THC significantly increased the number of FosB/ΔFosB-immunoreactive (-ir) cells in the nucleus accumbens core (Perrotti et al., 2008). Semi-quantitative analysis also showed that THC-induced FosB/ΔFosB-ir cells in other forebrain regions, but protein levels could not be quantified with this technique.
Bitransgenic mice that overexpress ΔFosB in dopamine D1 receptor/dynorphin containing striatal medium spiny neurons exhibit increased rewarding effects of several drugs of abuse and natural rewards (Nestler, 2008). These same mice also had increased G-protein signaling and adenylyl cyclase inhibition for mu- and kappa-opioid receptors, respectively, in the nucleus accumbens, suggesting that ΔFosB modulates signaling at the receptor/effector level (Sim-Selley et al., 2011). The striatum and its projection regions appear resistant to CB1R desensitization and downregulation (Sim-Selley, 2003) and the striatum is involved in the rewarding effects of drugs of abuse (Koob, 1999; Koob and Volkow, 2010). Taken together, these findings suggest that ΔFosB might modulate CB1Rs after repeated drug administration, but the regional expression pattern of ΔFosB and CB1R desensitization and downregulation has not been directly compared in brains from animals that received the same THC administration paradigm. Therefore, this study investigated the brain regional relationship between ΔFosB induction and CB1R desensitization and downregulation after repeated THC treatment. Studies were also conducted to determine the neuroanatomical relationship between CB1Rs and ΔFosB positive cells in the striatum. Finally, the role of CB1Rs in THC-mediated ΔFosB induction was assessed in CB1R knockout mice. Results showed an inverse regional relationship between CB1R desensitization and ΔFosB induction and neuroanatomical results support the possibility of both cell-autonomous and trans-synaptic interactions.
2. Materials and Methods
2.1. Materials
THC and [(−)-cis-3-[2-hydroxy-4-(1,1-dimethylheptyl)phenyl]-trans-4-(3-hydroxypropyl)cyclohexanol] (CP55,940) were provided by the Drug Supply Program of the National Institute on Drug Abuse (Rockville, MD). [35S]GTPγS (1250 Ci/mmol) was purchased from PerkinElmer Life Sciences (Boston, MA). Bovine serum albumin (BSA) and guanosine diphosphate (GDP) were purchased from Sigma-Aldrich (St. Louis, MO). Goat anti-rabbit anti-FosB antibodies (sc-7203 and sc-48) were purchased from Santa Cruz Biotechnology (Santa Cruz, CA). Goat anti-CB1R and guinea-pig anti-CB1R antibodies (against residues 401–473 of the CB1R) (Pickel et al., 2006) were generously provided by Dr. Ken Mackie (Indiana University, Bloomington, IN). Secondary antibodies were purchased from either LI-COR (Lincoln, NE) or Invitrogen (Grand Island, NY). ProLong® Gold anti-fade reagent with 4′,6-diamidino-2-phenylindole (DAPI) was purchased from Invitrogen. All other reagent grade chemicals were obtained from Sigma Chemical Co. or Fisher Scientific.
2.2. Subjects
Male ICR mice (Harlan Laboratories, Indianapolis, IN) weighing 25–30 grams (n=8 per group) were used to assess CB1R adaptations and ΔFosB induction. THC (10 mg/kg) was dissolved in a 1:1:18 solution of ethanol, emulphor and saline (vehicle). Mice were injected subcutaneously with either vehicle or THC at 07:00 and 16:00 h for 13 days. On day 14, mice received a morning injection only, and 24 hours later mice were sacrificed by decapitation and brains were extracted. Brains were then hemisected, with one half dissected for immunoblot analysis and the other half frozen in isopentane at −30°C for autoradiography and immunohistochemistry to measure [35S]GTPγS binding and CB1R levels, respectively. Based on initial results, a second group of ICR mice was treated as described above, and the lateral and basomedial nuclei of the amygdala were dissected to determine ΔFosB expression.
For immunohistochemical studies to determine whether CB1Rs and ΔFosB are co-localized in striatal neurons, male ICR mice (n=4) were treated with vehicle or a ramping dose of THC (10–20–30 mg/kg) twice daily for 6.5 days. We have previously determined that this treatment paradigm induces a high level of ΔFosB in the striatum (unpublished data). Brains were collected 24 hours after final drug administration to maximize the detection of ΔFosB, which is more stable than FosB.
The role of CB1Rs in ΔFosB induction was determined using CB1R knockout mice on a C57Bl/6J background and littermate controls (Zimmer et al., 1999) (n = 7–8 per group). CB1R knockout and wild type (WT) mice were treated with THC (10mg/kg) or vehicle for 13.5 days as described above, and the caudate-putamen and nucleus accumbens were dissected 24 hours after final treatment. A separate group of C57Bl/6J mice (Jackson Laboratories, Bar Harbor, Maine) were treated with increasing doses of THC to determine whether results in CB1R knockout mice were due to an inability of this dose of THC (10 mg/kg) to further induce ΔFosB above levels in vehicle-treated mice. Mice received vehicle, 10 mg/kg THC or 30 mg/kg THC for 13.5 days as described above and the caudate-putamen was dissected 24 hours after the final injection.
Mice were housed four to six per cage and maintained on a 12-hr light/dark cycle in a temperature controlled environment (20–22°C) with food and water available ad libitum. All experiments were performed with the approval of the Institutional Animal Care and Use Committee at Virginia Commonwealth University in accordance with the National Institutes of Health guide for the care and use of Laboratory animals 7th edition.
2.3. Dissections
Brain regions of interest were dissected from hemisected or whole fresh brains. The prefrontal cortex was dissected by making a cut at the posterior extent of the anterior olfactory nucleus after which the olfactory nuclei were removed. This sample included frontal association, primary and secondary motor, anterior cingulate, prelimbic and orbital frontal cortices. The next cut was made anterior to the optic chiasm to produce a thick coronal section. The nucleus accumbens was dissected by removing the cortex ventrally and the septum and nucleus of the horizontal limb of the diagonal band medially and then collecting the tissue surrounding the anterior commissure. The caudate-putamen was dissected by removing the cortex and then collecting the caudate-putamen that remained after removal of the nucleus accumbens. The hippocampus was exposed by removing the cortex from the remaining brain, then dissecting the whole hippocampus from the surface of the brain. In a separate experiment, the lateral amygdala (including the ventrolateral, dorsolateral, and anterior and posterior basolateral nuclei) and basomedial amygdala were dissected. These dissections were made by first cutting caudal to the optic chiasm, and then making a second cut directly caudal to the median eminence. The basomedial amygdala was isolated by removing the surrounding ventral amygdaloid regions and separating dorsally at the ventral extent of the bifurcated corpus callosum. The lateral amygdala was isolated by removing the tissue found within the bifurcated corpus callosum.
2.4. Agonist stimulated [35S]GTPγS autoradiography
Assays were conducted as previously published from our laboratory (Nguyen et al., 2012; Sim et al., 1995). Briefly, coronal sections (20 μm) were cut on a cryostat maintained at −20°C, thaw-mounted onto gelatin-coated slides and stored desiccated at 4°C overnight. Sections were collected at 3 levels to include 1) prefrontal cortex, 2) nucleus accumbens and caudate-putamen, and 3) hippocampus, lateral amygdala and basomedial amygdala. Slides were stored desiccated at −80°C until use. For assays, slides were brought to room temperature, and then rinsed in 50 mM Tris-HCl buffer (pH 7.4) with 3 mM MgCl2, 0.2 mM ethylene glycol tetraacetic acid (EGTA) and 100 mM NaCl (Assay Buffer) for 10 min at 25°C. Next, slides were transferred to Assay Buffer + 0.5% BSA, with 2 mM GDP and 10 mU/ml adenosine deaminase for 15 min at 25°C. Slides were then incubated in Assay Buffer + 0.5% BSA containing 0.04 nM [35S]GTPγS with 3 μM CP55,940 or vehicle (basal) for 2 hours at 25°C. CP55,940 was used because we have previously shown that it does not stimulate [35S]GTPγS binding in autoradiography of CB1R knockout mouse brains (Nguyen et al., 2011). The maximally effective concentration of CP55,940 was previously determined in cerebellar sections and homogenates (Nguyen et al., 2011). After final incubation, slides were rinsed twice in 50 mM Tris buffer (pH 7.4) at 4°C, and then in deionized water. Slides were then dried and exposed to Kodak Biomax MR film with [14C] microscales for 18 hrs. Films were digitized at 8-bits per pixel with a Sony XC-77 video camera. Brain regions of interest (ROIs) were determined using The Mouse Brain Atlas (Franklin and Paxinos, 2008). Images were analyzed using NIH Image J software as described previously and resulting values are expressed as nanocuries of [35S] per gram of tissue (nCi/g). Net agonist-stimulated [35S]GTPγS binding was calculated by subtracting basal (without agonist) binding from agonist-stimulated binding. Values were obtained in quadruplicate sections collected from eight hemisected brains per group and averaged for statistical analysis.
2.5. Immunohistochemistry
CB1R immunofluorescence was used to assess receptor levels in hemisected brains. Slide-mounted sections were washed in 0.1 M phosphate buffer (pH 7.4) with 0.9% NaCl (PBS) for 5 minutes and fixed with 4% paraformaldehyde dissolved in 0.05 M phosphate buffer (pH 7.4), 0.9% NaCl, 1% Triton-X100 (PBST) for 30 minutes. Slides were rinsed 3 × 5 minutes in 0.1 M Tris buffer (pH 7.4), with 0.9% NaCl and 0.1% Triton-X100 (TBST), and then blocked in TBST containing 5% normal donkey serum. Slides were incubated overnight at 4°C in TBST containing 2.5% normal donkey serum and goat-anti CB1R (1:2000). Slides were then washed 3 × 10 minutes in TBS containing 0.05% Tween-20 and incubated in Alexa 800 donkey anti-goat IgG (1:5000) for 2 hours. After incubation, slides were washed 2 × 10 minutes in TBS containing 0.05% Tween-20 and 1 × 5 minutes in TBS. Fluorescent immunoreactivity was detected with the LI-COR Odyssey scanner (42 μm resolution, 1 mm offset with highest quality, channel sensitivity set at 4.0) and LI-COR software v 2.1 was used to measure the average intensity of ROIs (Franklin and Paxinos, 2008) with the free form shape tool. Average intensity values were used to account for differences in the size of ROIs between slices because this is not corrected using integrated intensity.
CB1R and ΔFosB/FosB dual staining was assessed in coronal sections of the striatum to determine the anatomical relationship between these two proteins. Slide-mounted sections (20 μm) were washed in 0.1 M phosphate buffer (pH 7.4) with 0.9% NaCl (PBS) for 5 minutes and fixed with 4% paraformaldehyde (30 minutes) dissolved in 0.05 M PBS. Slides were washed 3 × 5 minutes in PBS and incubated in PBS containing 1% Triton-X100 for 15 minutes. Slides were then washed 3 × 5 minutes in PBS and incubated in PBS containing 5% normal goat serum for 1 hour. Slides were incubated overnight at 4°C in PBS containing 2.5% normal donkey serum and antibodies against CB1R (1:1000; guinea-pig) and FosB (1:500; sc-48/rabbit). Slides were then washed 3 × 5 minutes in PBS containing Alexa Fluor® 488 goat anti-guinea pig IgG (1:500) and Alexa Fluor® 594 goat anti-rabbit IgG for 2 hours. After incubation, slides were washed 3 × 10 minutes in PBS and once for 5 minutes in double-distilled water. Slides were coverslipped using ProLong® Gold anti-fade reagent with DAPI. Images were captured on a Zeiss 700 laser scanning confocal microscope utilizing the ZEN 2011 software. Pinhole diameter was set to 1 Airy unit for the 488 wavelength, to which the optical slice thicknesses were matched for the 405 and 594 detectors. Scan resolution was optimized to meet Nyquist sampling criteria in the X and Y dimensions. Signal crosstalk was eliminated by separating each wavelength into individual tracks and scanning sequentially. Scanning line-by-line, averaging four passes in a single direction, then yielded an image at a 16 bit depth. All images were taken under a Zeiss Plan-Apochromat 40x/1.3 Oil objective.
2.6. Immunoblots
Immunoblotting was performed as previously described (Sim-Selley et al., 2006; Zachariou et al., 2003). Tissue was homogenized in 20 mM HEPES buffer (pH 7.8) with 0.4 M NaCl, 20.0% glycerol, 5.0 mM MgCl2, 0.5 mM ethylenediaminetetraacetic acid, 0.1 mM EGTA and 1% NP-40 (EMSA buffer) containing 0.5 mM phenylmethanesulfonylfluoride, 10 μg/ml leupepsin, 100 μg/ml benazamide, 2 μg/ml aprotinin, 500 μM dithiothreitol and Halt™ protease inhibitor cocktail. Samples (50 μg protein) were loaded in 10% Tris-HCl gels and separated by electrophoresis. Gels were transferred onto nitrocellulose paper, blocked in 0.1 M TBS with 5% Carnation™ instant nonfat dry milk for 1 hour, incubated in antibodies against α-tubulin (1:1000) and FosB (1:500) in 0.1 M TBS containing 0.1% Tween-20 (TBST) with 5% nonfat dry milk. Blots were washed 3 × 10 minutes in TBST and incubated with Alexa 680 goat anti-rabbit IgG (1:12000) and Alexa 800 goat anti-mouse IgG (1:12000) in TBST for 45 minutes. Fluorescent intensity was visualized using the Odyssey LI-COR infrared scanner. LI-COR software v 2.1 was used to measure integrated intensity between treatments for the band of interest, with subtraction of the background (average of intensities 3 border widths above and below the band). In order to verify that bands for the α-tubulin loading control were not saturated and ensure the accuracy of results, an experiment was conducted in which varying concentrations of protein (25–100 μg) were loaded onto the gel and intensity was measured using the LI-COR system. Linear regression analysis showed that these data fitted at r2 = 0.9978, thereby confirming that the signal was not saturated at 50 μg, the amount of protein used in these studies.
2.7. Data Analysis
For all experiments, data were analyzed with Prism® version X (GraphPad Software, San Diego, CA). For desensitization and downregulation studies and immunoblots comparing only vehicle and 10 mg/kg THC, student t-tests were used to compare means of repeated THC and vehicle groups based on planned comparisons by region. For studies in CB1R knockout and wild type mice, data were analyzed by two-way ANOVA and Bonferroni post-hoc tests and one-way ANOVA with Dunnett’s post-hoc tests in instances where an interaction was found. For all other studies, one-way ANOVAs were performed with Bonferroni post-hoc tests. To determine whether ΔFosB induction correlated with CB1R desensitization, linear regression analysis was performed and the significance of correlations was determined with F-tests to determine whether the slope of the line was significantly non-zero. Significance was determined with p < 0.05.
3. Results
3.1. Repeated THC administration reduces CP55,940-stimulated [35S]GTPγS binding in a region-specific manner
CP55,940-stimulated [35S]GTPγS binding was conducted to determine whether 13.5 day treatment with 10 mg/kg THC (b.i.d.) produced CB1R desensitization in the forebrain. No differences in basal [35S]GTPγS binding were found between THC- and vehicle-treated mice in any region examined (Supplemental Table 1). Densitometric analysis revealed a region-dependent reduction in CP55,940-stimulated [35S]GTPγS binding in brains from THC- compared to vehicle-treated mice. THC treatment produced a significant reduction in CP55,940-stimulated [35S]GTPγS binding in the prefrontal cortex (29% decrease, df=14, p < 0.05) and hippocampus (50% decrease, df=14, p < 0.01) compared to vehicle-treated mice (Figure 1, Table 1). THC treatment significantly reduced CP55,940-stimulated [35S]GTPγS binding by 27% (df=14, p < 0.05) in both the lateral amygdala (including the lateral and basolateral nuclei) and basomedial amygdala of THC-compared to vehicle-treated mice. In contrast, there was no significant difference in CP55,940-stimulated [35S]GTPγS binding in the caudate-putamen or nucleus accumbens of THC- versus vehicle-treated mice (Figure 1, Table 1). Therefore, the regional profile of relative CB1R desensitization was hippocampus ≫ prefrontal cortex ≥ basomedial amygdala = lateral amygdala ≫ caudate-putamen = nucleus accumbens.
Figure 1.

(A) Representative autoradiograms showing CP55,940-stimulated [35S]GTPγS binding in brains from vehicle and THC-treated mice. Prefrontal cortex is shown in row 1, nucleus accumbens and caudate-putamen in row 2 and hippocampus, lateral amygdala and basomedial amygdala in row 3. (B) Graph representing differences in net-stimulated [35S]GTPγS binding expressed as a percent of net-stimulated binding in vehicle-treated mice. Data are means ± SEM with * p < 0.05 and ** p < 0.01 versus vehicle controls, un-paired, two-tailed Student t-test, n = 8 mice per group.
TABLE 1.
Net CP55,940-stimulated [35S]GTPγS binding and CB1R-ir measured in brain sections from vehicle- and THC- treated mice
| Region | Net [35S]GTPγS binding | CB1R-ir Average intensity | ||
|---|---|---|---|---|
| VEHICLE | THC | VEHICLE | THC | |
| Prefrontal cortex | 541 ± 35 | 388 ± 42* | 1173 ± 66 | 946 ± 20* |
| Nucleus accumbens | 286 ± 25 | 290 ± 32 | 432 ± 12 | 417 ± 16 |
| Caudate-putamen | 319 ± 14 | 316 ± 29 | 1160 ± 34 | 1134 ± 33 |
| Lateral amygdala | 397 ± 21 | 290 ± 36* | 461 ± 18 | 393 ± 2* |
| Basomedial amygdala | 349 ± 35 | 253 ± 16* | 351 ± 33 | 365 ± 14 |
| Hippocampus | 380 ± 25 | 188 ± 32** | 498 ± 7 | 392 ± 12** |
Brain sections were incubated in 0.04 nM [35S]GTPγS, 3 μM CP55,940 and 2 mM GDP for autoradiography and results are expressed as net CP55,940-stimulated [35S]GTPγS binding (nCi/g) ± SEM. Near-adjacent sections were processed with an antibody to CB1R for immunohistochemistry and results are expressed as CB1R-ir average intensity in units of counts/pixels ± SEM.
p < 0.05
p < 0.01 different from vehicle by Student’s t-test, n=8 mice per group.
3.2. CB1R immunoreactivity is reduced by repeated THC treatment in a subset of brain regions
CB1R immunoreactivity (-ir) was measured using immunohistochemistry in brain sections that were near-adjacent to those used for [35S]GTPγS autoradiography. CB1R-ir in brain sections was analyzed using the Odyssey LI-COR system, which can scan images with a resolution up to 24 μm, allowing accurate measurements of differences in fluorescent intensity (Brunet et al., 2009; Kearn, 2004). CB1R antibody specificity was confirmed for analysis using the LI-COR system prior to experiments (Supplemental Data). CB1R-ir was measured in the same regions as described above for agonist-stimulated [35S]GTPγS binding. Decreased CB1R-ir, indicative of downregulation, was found in many of the same regions as CB1R desensitization, although the magnitude of the decrease was generally greater for desensitization. CB1R-ir was significantly reduced in the prefrontal cortex (19% decrease, df=14, p < 0.01), lateral amygdala (15% decrease, p < 0.05) and hippocampus (22% decrease, df=14, p < 0.05) of THC- compared to vehicle-treated mice (Figure 2, Table 1). CB1R-ir did not significantly differ between THC- and vehicle-treated mice in the nucleus accumbens, caudate-putamen or basomedial amygdala. These results demonstrate a similar regional pattern for CB1R desensitization and downregulation.
Figure 2.
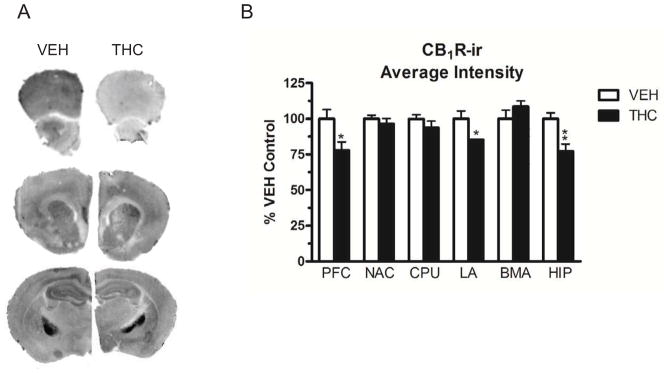
(A) Representative images of LI-COR scans for CB1R-ir. Prefrontal cortex is shown in row 1, nucleus accumbens and caudate-putamen in row 2, and hippocampus, lateral amygdala and basomedial amygdala in row 3. (B) Graph showing differences in average intensity for CB1R-ir as a percent of vehicle. Data are means ± SEM with * p < 0.05 versus vehicle controls, un-paired, two-tailed Student t-test, n = 8 mice per group.
3.3. ΔFosB is induced by THC treatment in specific forebrain regions
Immunblots were performed to determine the relative expression levels of ΔFosB between vehicle- and THC-treated mice. Immunoblot results showed region-specific induction of ΔFosB expression by THC. Repeated THC treatment produced significant increases in ΔFosB-ir in the prefrontal cortex (43% increase, df=14, p < 0.05), caudate-putamen (62% increase, df=14, p < 0.001), nucleus accumbens (87% increase, df=14, p < 0.001) and lateral amygdala (38% increase, df=14, p < 0.05) of THC- compared to vehicle-treated mice (Figure 3, Table 2). In contrast, ΔFosB-ir in the basomedial amygdala and hippocampus did not significantly differ between treatment groups. Therefore, the regional profile of THC-mediated ΔFosB induction was nucleus accumbens > caudate-putamen > prefrontal cortex > lateral amygdala ≫ basomedial amygdala = hippocampus.
Figure 3.
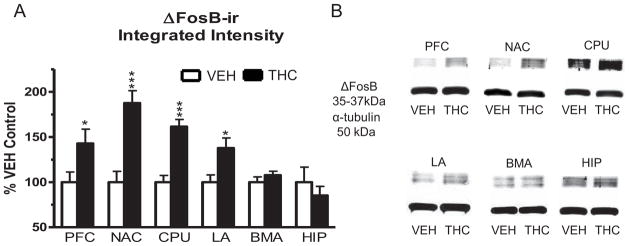
Immunoblot results for ΔFosB expression in the prefrontal cortex, nucleus accumbens, caudate-putamen, lateral amygdala, basomedial amygdala and hippocampus of mice that received repeated vehicle or THC administration. Blots were probed with antibodies directed against ΔFosB and α-tubulin (loading control). (A) Graph showing densitometric analysis of brain regions from vehicle- and THC-treated mice expressed as percent vehicle control. Data are means ± SEM with * p < 0.05 and *** p < 0.001 versus vehicle controls, un-paired, two-tailed student t-test, n = 8 per group. (B) Representative blots showing ΔFosB-ir and α-tubulin-ir in vehicle- and THC-treated brains for each region examined.
TABLE 2.
Δ FosB expression measured by immunoblot in brains from vehicle- and THC-treated mice
| Region | Δ FosB-ir Integrated intensity | |
|---|---|---|
| VEHICLE | THC | |
| Prefrontal cortex | 2.94 ± 0.33 | 4.20 ± 0.47* |
| Nucleus accumbens | 1.81 ± 0.22 | 3.39 ± 0.25*** |
| Caudate-putamen | 1.56 ± 0.11 | 2.52 ± 0.12*** |
| Lateral amygdala | 2.94 ± 0.11 | 4.05 ± 0.08* |
| Basomedial amygdala | 1.98 ± 0.11 | 2.13 ± 0.08 |
| Hippocampus | 1.40 ± 0.23 | 1.20 ± 0.14 |
ΔFosB-ir was measured in homogenates prepared from brain regions of interest using an antibody against FosB that recognizes all FosB isoforms, as described in Methods. The 35–37 kDa band, defined as ΔFosB, was measured for analysis. Results are expressed as integrated intensity in units of counts-mm2 ± SEM.
p < 0.05
p < 0.001 different from vehicle by Student’s t-test, n=8 mice per group.
3.4. CB1R desensitization and ΔFosB expression are inversely correlated
Reductions in CB1R-ir and CB1R-mediated G-protein activity exhibited a similar regional pattern, whereas THC-mediated ΔFosB induction was most robust in regions with less CB1R desensitization. In order to determine whether these observations represented significant correlations, the mean percent changes in [35S]GTPγS binding, CB1R-ir and ΔFosB-ir of vehicle- versus THC-treated mice were plotted for each region. Desensitization ([35S]GTPγS autoradiography, y-axis) and downregulation (CB1R-ir, y-axis) were each compared to ΔFosB expression (immunoblots, x-axis). For the comparison between ΔFosB-ir and downregulation, the slope of the linear regression line was not determined to be significantly non-zero r (4) = 0.20, p = 0.67. For the comparison between ΔFosB-ir and desensitization, the slope of the linear regression line was determined to be significantly non-zero r (4) = 0.94, (p < 0.01) (Figure 4). These analyses confirmed initial observations and showed a significant inverse regional correlation between CB1R desensitization and ΔFosB expression.
Figure 4.
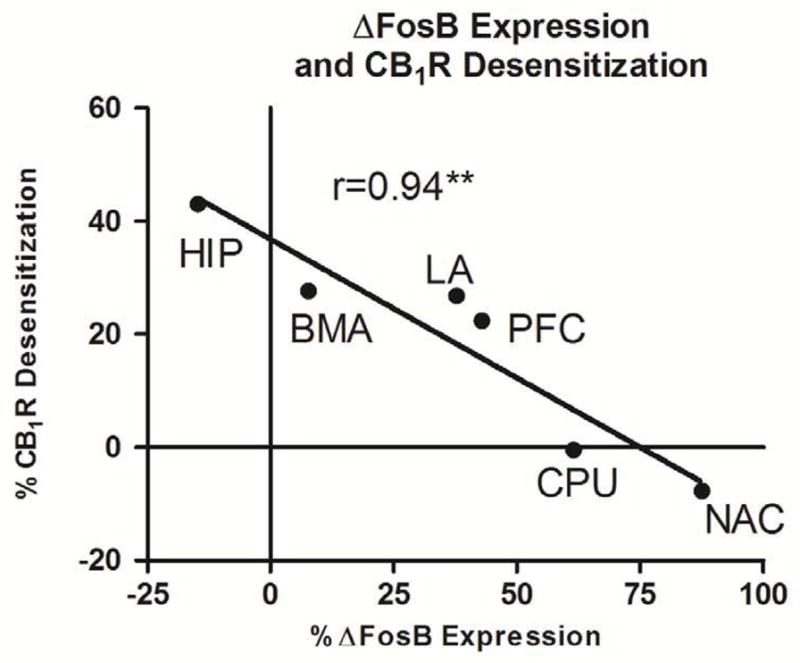
Correlation of percent change in measured parameters for THC-compared to vehicle-treated mice for the brain regions examined between desensitization (y-axis) and ΔFosB expression (x-axis). Correlation is presented as percent change from vehicle with corresponding r-squared values. Data are means ± SEM with ** p < 0.01, F-test, n=8 per group.
3.5 CB1Rs co-localize with and contact ΔFos/FosB-ir neurons
Immunohistochemistry was performed in order to determine whether the interaction between CB1Rs and ΔFosB occurs within the same cell or is a trans-synaptic effect. Mice were treated with a ramping dose of THC (10–20–30mg/kg) that strongly induces ΔFosB expression in the striatum. The antibody used to assess ΔFosB recognizes FosB/ΔFosB, but the 24-hour post-treatment survival time used in this experiment favors detection of ΔFosB (Perrotti et al., 2004). CB1R-ir was visualized in green and FosB/ΔFosB-ir was visualized in red (Figure 5). DAPI (blue) was used to identify cell nuclei. The distribution of CB1R-ir in the caudate-putamen and nucleus accumbens of both vehicle- and THC-treated mice was similar to that previously described by Tsou et al., 1998 (Figure 5A, D). CB1R-ir in both the caudate-putamen and nucleus accumbens appeared as bright puncta that were distributed in the neuropil and surrounding cell bodies, as indicated by nuclear markers (Figure 5C, F, G–I). More diffuse staining was also observed in the caudate-putamen that appeared to represent fiber bundles. Although most of the CB1R-ir appeared to be on fibers, green fluorescent CB1R-ir cell bodies were also observed (Figure 5A, C, G and H). FosB/ΔFosB-ir nuclei were seen in the caudate-putamen and nucleus accumbens of both vehicle- and THC-treated mice (Figure 5B, E), but fewer FosB/ΔFosB-ir nuclei were observed in brain sections from vehicle- compared to THC-treated mice (not shown). Dual staining for DAPI showed that FosB/ΔFosB-ir was localized in cell nuclei (Figure 5C, F, G–I), as previously reported (Perrotti et al., 2008). DAPI stained nuclei that were immunonegative for FosB/ΔFosB were also observed in brains from both groups of mice (Figure 5C, F, G–I). Examination of dual staining in brains from THC-treated mice revealed that in many cases CB1R-ir puncta appeared to be surrounding cells that contained FosB/ΔFosB-ir nuclei (Figure 5G–I). Cells were also observed in the caudate-putamen with green fluorescence that surrounded DAPI/ΔFosB positive nuclei (Figure 5G and H). There were no instances where CB1R-ir and FosB/ΔFosB-ir were dual stained in the nucleus (Figure 5C, F, G–I). Therefore, it appeared that CB1R-ir was both co-localized with FosB/ΔFosB-ir in cells and also in puncta that contacted cells with FosB/ΔFosB-ir nuclei.
Figure 5.

Representative images showing CB1R-ir (green), FosB/ΔFosB-ir (red) and DAPI (blue) in the caudate-putamen and nucleus accumbens of mice that received repeated THC treatment. CB1R-ir fibers and puncta were seen in the caudate-putamen (A) and nucleus accumbens (B) and CB1R-ir cells were occasionally found in the caudate-putamen (A). FosB/ΔFosB-ir was localized to nuclei of cells in the caudate-putamen (B, C) and nucleus accumbens (E, F). FosB/ΔFosB-ir and DAPI were seen in a subset of cell nuclei that were surrounded by CB1R-ir puncta in the caudate-putamen (C, G, H) and nucleus accumbens (F, I). CB1R-ir was also seen in cells that contained FosB/ΔFosB-ir nuclei in the caudate-putamen (indicated by arrows in G, H). AC: anterior commissure
3.6. THC-mediated ΔFosB induction is abolished in CB1R knockout mice
The role of CB1Rs in THC-mediated ΔFosB induction was determined in the nucleus accumbens and caudate-putamen, regions that showed the highest magnitude of ΔFosB induction. CB1R knockout and littermate wild type mice were treated with 10 mg/kg THC or vehicle for 13.5 days (b.i.d.) as described above. ΔFosB expression was significantly increased in THC- versus vehicle-treated wild-type mice in both the caudate-putamen (39% increase, F1,25, p < 0.05) and nucleus accumbens (45% increase, F1,25, p < 0.05) (Figure 6). There was no significant difference in ΔFosB-ir between vehicle- and THC-treated CB1R knockout mice in either the caudate-putamen or nucleus accumbens. In the caudate-putamen, two-way ANOVA determined a significant interaction between the factors of genotype × treatment F1, 25 = 4.86, p< 0.05. One-way ANOVA, followed by Dunnett’s post-hoc test, determined that both vehicle- and THC-treated CB1R-knockout mice exhibited significantly greater ΔFosB expression (F3,25, p < 0.01) compared to wild type vehicle-treated mice (Figure 6). Because ΔFosB-ir was elevated in the caudate-putamen of vehicle-treated CB1R knockout compared to wild type mice, it is possible that further increases in ΔFosB-ir might not be detected in this region after this THC treatment paradigm, essentially producing a ceiling effect. Therefore, C57Bl/6J mice were repeatedly administered vehicle, 10 mg/kg and a higher dose (30 mg/kg) of THC twice daily for 13.5 days. Results showed that this 30 mg/kg THC administration paradigm produced a significantly greater increase in Delta;FosB-ir than the 10 mg/kg THC administration paradigm (F2,21, p < 0.05, Supplemental Figure 3), indicating that the 10 mg/kg paradigm did not induce maximal ΔFosB expression in this brain region. This result shows that THC-mediated ΔFosB induction is dose-dependent and that ΔFosB induction does not occur in CB1R knockout mice.
Figure 6.

Immunoblot results for ΔFosB expression in the caudate-putamen and nucleus accumbens following repeated vehicle or THC administration in wild type and CB1R knockout mice. Blots were probed with antibodies directed against ΔFosB and α-tubulin (loading control). (A and B) Graphs showing densitometric analysis of brain regions from vehicle- and THC-treated mice expressed as percent vehicle control. For CPU, data are means ± SEM with ^ p < 0.05 and ^^ p < 0.01 versus wild type vehicle controls, Dunnett’s post-hoc test following a one-way ANOVA, n = 7–8 mice per group. For NAC, data are means ± SEM with * p < 0.05 versus wild type vehicle controls, Bonferroni post-hoc test following a two-way ANOVA, n = 7–8 mice per group. (C and D) Representative blots showing ΔFosB-ir and α-tubulin-ir in vehicle- and THC-treated brains of wild type and CB1R knockout mice for each region examined.
3.5. Discussion
This study demonstrated an inverse regional correlation between THC-mediated induction of ΔFosB and CB1R desensitization in the forebrain. Repeated THC treatment induced ΔFosB in the caudate-putamen and nucleus accumbens, regions that did not exhibit THC-induced CB1R desensitization and downregulation. In contrast, THC treatment did not induce ΔFosB in the hippocampus, which exhibited the highest magnitude of CB1R desensitization and downregulation. Areas with intermediate levels of CB1R desensitization and downregulation, such as prefrontal cortex, lateral amygdala and basomedial amygdala, demonstrated either no change or an intermediate level of ΔFosB induction. Immunohistochemical results showed that CB1R-ir puncta surrounded cells with FosB/ΔFosB-ir nuclei and also that CB1R and FosB/ΔFosB were co-localized in some cells. Previous studies have shown that CB1R are expressed primarily in GABAergic medium spiny neurons of the striatum (Hohmann and Herkenham, 2000). Thus, these results support the idea that ΔFosB could regulate CB1Rs and/or that CB1R signaling could modulate ΔFosB expression via both direct and trans-synaptic mechanisms. The role of CB1Rs in THC-mediated ΔFosB induction has not previously been assessed. Studies in CB1R knockout and wild type mice revealed that ΔFosB induction was CB1R-dependent in the caudate-putamen and nucleus accumbens, showing that CB1Rs are required for THC-mediated ΔFosB induction.
Studies in rodents have established that there are brain region-dependent differences in the magnitude, rate of development and rate of recovery of CB1R desensitization and downregulation (McKinney et al., 2008; Sim-Selley, 2003; Sim-Selley et al., 2006). Similar regional relationships have been found in brains from human marijuana users, where greater apparent downregulation and slower recovery of ligand binding were found in the hippocampus compared to other brain regions (Hirvonen et al., 2012; Villares, 2007). The similar regional relationship in CB1R adaptations between rodents and humans suggests that this is a fundamental property of adaptation of brain CB1Rs to repeated THC exposure. The present study has extended our previous findings by showing that brain regional specificity also exists for induction of the stable transcription factor ΔFosB in rodents.
We have previously assessed THC-mediated desensitization and downregulation and induction of ΔFosB in separate studies using a 15-day ramping-dose THC paradigm (Perrotti et al., 2008; Sim-Selley and Martin, 2002). This treatment paradigm produced significant CB1R desensitization and downregulation in almost all regions examined, but the relative magnitude varied across regions. The hippocampus exhibited a higher magnitude of desensitization and the caudate-putamen and its projection regions of substantia nigra and globus pallidus exhibited a lower magnitude of desensitization (Sim-Selley and Martin, 2002). FosB/ΔFosB induction was examined in a separate study by treating mice with this THC ramping dose paradigm and counting the number of FosB/ΔFosB-ir cells (Perrotti et al., 2008). Results showed significant THC-induced increases in FosB/ΔFosB-ir cells in the nucleus accumbens core, with trends toward increases in the nucleus accumbens shell and caudate-putamen. Semi-quantitative analysis showed greater numbers of FosB/ΔFosB-ir neurons throughout the forebrains of THC- compared to vehicle-treated mice (Perrotti et al., 2008). The current study extends those findings by using immunoblot analysis, which provides a quantitative measure that distinguishes between ΔFosB and full length FosB and measures total protein expression. Results showed significant THC-mediated ΔFosB induction in the nucleus accumbens, as well as prefrontal cortex, caudate-putamen and lateral amygdala. The finding that THC-mediated ΔFosB induction occurs in these forebrain regions could have important implications for understanding the mechanisms that contribute to the motivational effects of THC. The distribution of THC-induced ΔFosB expression in the prefrontal cortex, caudate-putamen, nucleus accumbens and lateral amygdala corresponds to previous findings reported after treatment with other drugs of abuse or exposure to chronic stress (Perrotti et al., 2004; Perrotti et al., 2008). Neuroplasticity of these brain regions is critical in the transition from acute to compulsive drug use and has been suggested to be a neural substrate of addiction (Koob and Volkow, 2010). ΔFosB-mediated regulation of target genes in these regions could therefore affect behaviors that contribute to the motivational effects of THC as well as other drugs of abuse. In fact, overexpression of ΔFosB in D1/dynorphin-containing striatal medium spiny neurons enhanced the rewarding effects of morphine and cocaine (Colby et al., 2003; Zachariou et al., 2006). Moreover, if ΔFosB or its target genes regulate CB1R desensitization and/or downregulation in these regions, these molecular changes could also modulate the motivational effects of THC. For example, if ΔFosB or its targets could inhibit CB1R desensitization, then less tolerance might develop to behaviors mediated by the striatum versus hippocampus, in which ΔFosB is not induced by THC. In fact, studies in humans suggest that tolerance develops to the memory-impairing effects of THC, whereas subjective criterion, such as THC-induced “high”, are less susceptible to development of tolerance (D’Souza et al., 2008; Haney et al., 1997; Haney et al., 2004).
A significant inverse correlation was found between desensitization and ΔFosB induction, whereas ΔFosB induction did not correlate with CB1R downregulation. One explanation for this difference is that this THC paradigm did not produce sufficient downregulation to allow a direct comparison with ΔFosB induction. It is also possible that ΔFosB might directly or indirectly regulate genes involved in CB1R desensitization, but not downregulation. For example, desensitization involves phosphorylation of G-protein coupled receptors (GPCRs) by G-protein receptor kinases (GRKs), and subsequent recruitment of β-arrestins to the receptor that can produce desensitization by interfering with receptor-G-protein coupling and initiating endocytosis (Claing et al., 2002; Jin et al., 1999). β-arrestin-mediated GPCR endocytosis promotes trafficking to endosomes, which leads to either recycling of the receptor to the plasma membrane (resensitization) or degradation (downregulation). Trafficking of CB1Rs to lysosomes for degradation is regulated by G protein-coupled receptor associated sorting protein 1 (GASP1) (Martini et al., 2007). Thus, a number of regulatory proteins could contribute to the molecular changes shown in the present study. ΔFosB has not yet been linked to pathways involved in GPCR trafficking, but this possibility has not been addressed directly.
The gene targets of ΔFosB that could regulate desensitization are not fully known, but previous studies have identified candidate proteins that regulate CB1R adaptions. Our laboratory showed that genetic deletion of β-arrestin-2 in mice attenuated CB1R desensitization in the periaqueductal gray, cerebellum and spinal cord, and enhanced desensitization in the projection areas of the caudate-putamen (substantia nigra and globus pallidus) following repeated THC administration (Nguyen et al., 2012). Inhibition of the extracellular signal-regulated kinase (ERK) pathway has also been shown to modulate CB1R receptor desensitization and downregulation, suggesting that inhibition of proteins in this pathway could reduce desensitization. Alternative interpretations are also suggested by the current findings. It is possible that CB1R desensitization in regions such as the hippocampus inhibits induction of ΔFosB, thus regions in which CB1R desensitization occurs would show less ΔFosB induction. This mechanism could also explain the inverse regional relationship identified between CB1R desensitization and ΔFosB induction.
Although the current results support the idea that CB1R desensitization and ΔFosB induction after repeated THC exposure might be related, it also is possible that the two events could be coincident and not linked. For example, signaling pathways upstream of CB1Rs and ΔFosB might regulate both processes. Studies using rat sarcoma(Ras)-specific guanine nucleotide exchange factor 1 (GRF1) knockout mice, which blunts ERK activation through this signaling pathway, showed that the Ras/ERK pathway was necessary for CB1R desensitization and downregulation in the striatum (Rubino et al., 2005) and was also involved in cocaine-mediated ΔFosB induction in the striatal neurons (Fasano et al., 2009). These findings provide a mechanism upstream of ΔFosB induction that could also regulate CB1R desensitization. However, if ERK was solely responsible for both events, one would predict a positive correlation between desensitization and ΔFosB induction, whereas results showed a negative correlation in this study. Thus, it will be important in future studies to determine whether there is indeed a direct relationship between ΔFosB induction and CB1R desensitization and identify the signaling processes that regulate these events.
The finding that ΔFosB expression was significantly higher in the caudate-putamen of CB1R knockout compared to wild type mice suggests that CB1Rs modulate basal ΔFosB expression in this region. A recent study showed that reduction of CB1R expression in striatal cells using RNA interference-directed knockdown decreased the levels of D2R mRNA and protein, as well as D2R-stimulated G-protein activity (Blume et al., 2013). Moreover, administration of the D2R antagonist, haloperidol, is known to induce ΔFosB expression (Atkins et al., 1999). Taken together, these findings suggest that loss of striatal CB1Rs in knockout mice could reduce D2R signaling, which, like haloperidol, would enhance dopamine release. A potential interaction between CB1Rs and dopamine receptors in dopamine-mediated regulation of ΔFosB could have important implications in understanding the cellular consequences of drugs of abuse.
THC has previously been reported to induce ΔFosB, a property common to drugs of abuse (Perrotti et al., 2008), but we believe that this is the first study to directly assess the relationship between THC-mediated ΔFosB induction and THC-mediated desensitization and downregulation in CB1Rs. CB1Rs and ΔFosB were co-localized in a subset of striatal neurons, demonstrating that adaptations in these pathways following THC exposure could be cell autonomous. The anatomical proximity of CB1R-ir puncta with cells that express ΔFosB indicates that CB1Rs might also trans-synaptically regulate ΔFosB. Results suggest several possible functional interactions between CB1R signaling and ΔFosB in the striatum. The inverse regional relationship between CB1R desensitization and ΔFosB induction suggests that ΔFosB induction and subsequent changes in the expression of gene targets might inhibit CB1R desensitization. A non-mutually-exclusive possibility is that CB1R desensitization impairs a signaling pathway that normally induces ΔFosB expression, so that CB1R desensitization would attenuate ΔFosB induction. These possibilities will need to be directly assessed in future studies to determine the mechanism(s) underlying functional interactions between CB1Rs and ΔFosB and potential consequences after repeated THC administration.
Conclusions
These results suggest that THC-mediated ΔFosB induction could inhibit CB1R desensitization or modulate resensitization, and/or that CB1R desensitization could attenuate THC-mediated ΔFosB induction. Future studies will be required to distinguish among these mechanisms. The demonstration that CB1Rs are both co-localized with ΔFosB and in puncta that contact ΔFosB expressing cells indicates that both direct interactions and trans-synaptic effects could occur. These studies also demonstrate the requirement for CB1Rs in THC-mediated ΔFosB induction and that induction of ΔFosB is THC dose-dependent. The finding that THC treatment induces ΔFosB in several regions important for functions related to reward highlights the role this transcription factor might play in human marijuana use.
Supplementary Material
Supplemental Figure 1. Antibody specificity controls for CB1R immunohistochemistry. (A) Representative scan comparing immunofluorescence between wild type and CB1R knockout mice. Prefrontal cortex is shown in row 1, nucleus accumbens and caudate-putamen in row 2, hippocampus in row 3 and cerebellum in row 4. Representative scan of cerebellum incubated with (B) antibody + blocking peptide and (C) secondary antibody only.
Supplemental Figure 2. Immunoblots showing ΔFosB-ir in bitransgenic mice that overexpress ΔFosB. (A) Representative blot in the caudate-putamen of mice overexpressing ΔFosB versus control mice and (B) graph representing percent ΔFosB expression compared to control mice. Data are means ± SEM with * p < 0.05 versus vehicle controls, un-paired, two-tailed Student t-test, n = 2 per group for overexpressing and control mice.
Supplemental Figure 3. Immunoblots showing ΔFosB-ir in the caudate-putamen of mice that received vehicle, 10 mg/kg THC or 30 mg/kg THC administration twice daily for 13.5 days. ΔFosB expression was significantly increased by THC treatment (F2,21 =17.78, p < 0.0001). ΔFosB levels were 50% ± 11% (p < 0.05) and 104% ± 17% (p < 0.001) above levels in vehicle control mice following 10 mg/kg and 30 mg/kg THC administration, respectively. ΔFosB-ir was also significantly greater in mice that received 30 mg/kg THC administration compared to mice treated with 10 mg/kg THC (p < 0.05). Results are presented as % vehicle control ± SEM with significance determined following one-way ANOVA with Bonferroni post-hoc tests, n = 8 mice per group.
Highlights.
CB1R desensitization and ΔFosB induction exhibit an inverse regional correlation
THC-mediated ΔFosB induction is abolished by CB1R deletion
Results suggest that ΔFosB induction and CB1R desensitization are mechanistically related
Acknowledgments
This study was supported by U.S. Public Health Service Grants DA014277 (LJS), DA025321 (DES) and F31-DA030227 (MFL) and by an A.D. Williams Award from Virginia Commonwealth University (LJS). The authors thank Dr. Ken Mackie for providing CB1R antibodies (support: DA011322 and DA021696), Dr. Eric Nestler for providing bitransgenic ΔFosB mice (supported by NIDA) and Aaron Tomarchio for assistance with confocal microscopy. Microscopy was performed at the VCU Department of Anatomy and Neurobiology Microscopy Facility, supported, in part, with funding for NIH-NINDS Center core grant (5P30NS047463).
Abbreviations
- AC
anterior commissure
- BMA
basal medial amygdala
- BSA
bovine serum albumin
- CB1R
cannabinoid type 1 receptor
- CBLM
cerebellum
- CP55,940
(−)-cis-3-[2-hydroxy-4-(1,1-dimethylheptyl)phenyl]-trans-4-(3-hydroxypropyl)cyclohexanol
- CPU
caudate-putamen
- DAPI
4′,6-diamidino-2-phenylindole
- DOX
doxycycline
- EGTA
ethylene glycol tetraacetic acid
- ERK
extracellular signal-regulated kinase
- GDP
guanosine diphosphate
- GPCR
G-protein coupled receptor
- GTP
guanosine triphosphate
- HIP
hippocampus
- LA
lateral amygdala
- NAC
nucleus accumbens
- PFC
prefrontal cortex
- RAS
rat sarcoma
- THC
Δ9-tetrahydrocannabinol
- VEH
vehicle (1:1:18; ethanol:emulphor:saline)
- WT
wild type
Footnotes
Publisher's Disclaimer: This is a PDF file of an unedited manuscript that has been accepted for publication. As a service to our customers we are providing this early version of the manuscript. The manuscript will undergo copyediting, typesetting, and review of the resulting proof before it is published in its final citable form. Please note that during the production process errors may be discovered which could affect the content, and all legal disclaimers that apply to the journal pertain.
References
- American Psychiatric Association. Diagnostic and statistical manual of mental disorders: DSM-IV-TR. Author; Washington, DC: 2000. [Google Scholar]
- Atkins JB, Chlan-Fourney J, Nye HE, Hiroi N, Carlezon WA, Jr, Nestler EJ. Region-specific induction of deltaFosB by repeated administration of typical versus atypical antipsychotic drugs. Synapse. 1999;33:118–128. doi: 10.1002/(SICI)1098-2396(199908)33:2<118::AID-SYN2>3.0.CO;2-L. [DOI] [PubMed] [Google Scholar]
- Blume LC, Bass CE, Childers SR, Dalton GD, Roberts DC, Richardson JM, Xiao R, Selley DE, Howlett AC. Striatal CB1 and D2 receptors regulate expression of each other, CRIP1A and delta opioid systems. J Neurochem. 2013;124:808–820. doi: 10.1111/jnc.12139. [DOI] [PMC free article] [PubMed] [Google Scholar]
- Breivogel CS, Childers SR, Deadwyler SA, Hampson RE, Vogt LJ, Sim-Selley LJ. Chronic delta9-tetrahydrocannabinol treatment produces a time-dependent loss of cannabinoid receptors and cannabinoid receptor-activated G proteins in rat brain. J Neurochem. 1999;73:2447–2459. doi: 10.1046/j.1471-4159.1999.0732447.x. [DOI] [PubMed] [Google Scholar]
- Breivogel CS, Sim-Selley LJ. Basic neuroanatomy and neuropharmacology of cannabinoids. Int Rev Psychiatr. 2009;21:113–121. doi: 10.1080/09540260902782760. [DOI] [PubMed] [Google Scholar]
- Brunet JF, Redmond DE, Jr, Bloch J. Primate adult brain cell autotransplantation, a pilot study in asymptomatic MPTP-treated monkeys. Cell Transplant. 2009;18:787–799. doi: 10.3727/096368909X470847. [DOI] [PubMed] [Google Scholar]
- Chen J, Kelz MB, Hope BT, Nakabeppu Y, Nestler EJ. Chronic Fos-related antigens: stable variants of deltaFosB induced in brain by chronic treatments. J Neurosci. 1997;17:4933–4941. doi: 10.1523/JNEUROSCI.17-13-04933.1997. [DOI] [PMC free article] [PubMed] [Google Scholar]
- Chen J, Kelz MB, Zeng G, Sakai N, Steffen C, Shockett PE, Picciotto MR, Duman RS, Nestler EJ. Transgenic animals with inducible, targeted gene expression in brain. Mol Pharmacol. 1998;54:495–503. doi: 10.1124/mol.54.3.495. [DOI] [PubMed] [Google Scholar]
- Claing A, Laporte SA, Caron MG, Lefkowitz RJ. Endocytosis of G protein-coupled receptors: roles of G protein-coupled receptor kinases and beta-arrestin proteins. Prog Neurobiol. 2002;66:61–79. doi: 10.1016/s0301-0082(01)00023-5. [DOI] [PubMed] [Google Scholar]
- Colby CR, Whisler K, Steffen C, Nestler EJ, Self DW. Striatal cell type-specific overexpression of DeltaFosB enhances incentive for cocaine. J Neurosci. 2003;23:2488–2493. doi: 10.1523/JNEUROSCI.23-06-02488.2003. [DOI] [PMC free article] [PubMed] [Google Scholar]
- D’Souza DC, Ranganathan M, Braley G, Gueorguieva R, Zimolo Z, Cooper T, Perry E, Krystal J. Blunted psychotomimetic and amnestic effects of delta-9-tetrahydrocannabinol in frequent users of cannabis. Neuropsychopharmacology. 2008;33:2505–2516. doi: 10.1038/sj.npp.1301643. [DOI] [PMC free article] [PubMed] [Google Scholar]
- Fasano S, D’Antoni A, Orban PC, Valjent E, Putignano E, Vara H, Pizzorusso T, Giustetto M, Yoon B, Soloway P, Maldonado R, Caboche J, Brambilla R. Ras-guanine nucleotide-releasing factor 1 (Ras-GRF1) controls activation of extracellular signal-regulated kinase (ERK) signaling in the striatum and long-term behavioral responses to cocaine. Biol Psychiatry. 2009;66:758–768. doi: 10.1016/j.biopsych.2009.03.014. [DOI] [PMC free article] [PubMed] [Google Scholar]
- Franklin K, Paxinos G. The Mouse Brain in Stereotaxic Coordinates. Elsevier; New York, NY: 2008. [Google Scholar]
- Haney M, Comer SD, Ward AS, Foltin RW, Fischman MW. Factors influencing marijuana self-administration by humans. Behav Pharmacol. 1997;8:101–112. [PubMed] [Google Scholar]
- Haney M, Hart CL, Vosburg SK, Nasser J, Bennett A, Zubaran C, Foltin RW. Marijuana withdrawal in humans: effects of oral THC or divalproex. Neuropsychopharmacology. 2004;29:158–170. doi: 10.1038/sj.npp.1300310. [DOI] [PubMed] [Google Scholar]
- Hirvonen J, Goodwin RS, Li CT, Terry GE, Zoghbi SS, Morse C, Pike VW, Volkow ND, Huestis MA, Innis RB. Reversible and regionally selective downregulation of brain cannabinoid CB(1) receptors in chronic daily cannabis smokers. Mol Psychiatry. 2012;17:642–649. doi: 10.1038/mp.2011.82. [DOI] [PMC free article] [PubMed] [Google Scholar]
- Hohmann AG, Herkenham M. Localization of cannabinoid CB(1) receptor mRNA in neuronal subpopulations of rat striatum: a double-label in situ hybridization study. Synapse. 2000;37:71–80. doi: 10.1002/(SICI)1098-2396(200007)37:1<71::AID-SYN8>3.0.CO;2-K. [DOI] [PubMed] [Google Scholar]
- Howlett AC, Barth F, Bonner TI, Cabral G, Casellas P, Devane WA, Felder CC, Herkenham M, Mackie K, Martin BR, Mechoulam R, Pertwee RG. International Union of Pharmacology. XXVII. Classification of cannabinoid receptors. Pharmacol Rev. 2002;54:161–202. doi: 10.1124/pr.54.2.161. [DOI] [PubMed] [Google Scholar]
- Jin W, Brown S, Roche JP, Hsieh C, Celver JP, Kovoor A, Chavkin C, Mackie K. Distinct domains of the CB1 cannabinoid receptor mediate desensitization and internalization. J Neurosci. 1999;19:3773–3780. doi: 10.1523/JNEUROSCI.19-10-03773.1999. [DOI] [PMC free article] [PubMed] [Google Scholar]
- Kearn CS. Immunofluorescent Mapping of Cannibinoid CB1 and Dopamine D2 Receptors in the Mouse Brain. LI-COR Biosciences. 2004:1–5. [Google Scholar]
- Koob GF. The role of the striatopallidal and extended amygdala systems in drug addiction. Ann N Y Acad Sci. 1999;877:445–460. doi: 10.1111/j.1749-6632.1999.tb09282.x. [DOI] [PubMed] [Google Scholar]
- Koob GF, Volkow ND. Neurocircuitry of addiction. Neuropsychopharmacology. 2010;35:217–238. doi: 10.1038/npp.2009.110. [DOI] [PMC free article] [PubMed] [Google Scholar]
- Lichtman AH, Martin BR. Cannabinoid tolerance and dependence. Handb Exp Pharmacol. 2005:691–717. doi: 10.1007/3-540-26573-2_24. [DOI] [PubMed] [Google Scholar]
- Martini L, Waldhoer M, Pusch M, Kharazia V, Fong J, Lee JH, Freissmuth C, Whistler JL. Ligand-induced down-regulation of the cannabinoid 1 receptor is mediated by the G-protein-coupled receptor-associated sorting protein GASP1. FASEB J. 2007;21:802–811. doi: 10.1096/fj.06-7132com. [DOI] [PubMed] [Google Scholar]
- McKinney DL, Cassidy MP, Collier LM, Martin BR, Wiley JL, Selley DE, Sim-Selley LJ. Dose-related differences in the regional pattern of cannabinoid receptor adaptation and in vivo tolerance development to delta9-tetrahydrocannabinol. J Pharmacol Exp Ther. 2008;324:664–673. doi: 10.1124/jpet.107.130328. [DOI] [PMC free article] [PubMed] [Google Scholar]
- Nestler EJ. Review. Transcriptional mechanisms of addiction: role of DeltaFosB. Philos Trans R Soc Lond B Biol Sci. 2008;363:3245–3255. doi: 10.1098/rstb.2008.0067. [DOI] [PMC free article] [PubMed] [Google Scholar]
- Nestler EJ, Barrot M, Self DW. DeltaFosB: a sustained molecular switch for addiction. Proc Nat Acad Sci USA. 2001;98:11042–11046. doi: 10.1073/pnas.191352698. [DOI] [PMC free article] [PubMed] [Google Scholar]
- Nguyen PT, Schmid CL, Raehal KM, Selley DE, Bohn LM, Sim-Selley LJ. Beta-Arrestin2 Regulates Cannabinoid CB(1) Receptor Signaling and Adaptation in a Central Nervous System Region-Dependent Manner. Biol Psychiatry. 2012;71:714–724. doi: 10.1016/j.biopsych.2011.11.027. [DOI] [PMC free article] [PubMed] [Google Scholar]
- Nguyen PT, Selley DE, Sim-Selley LJ. Statistical Parametric Mapping reveals ligand and region-specific activation of G-proteins by CB1 receptors and non-CB1 sites in the 3D reconstructed mouse brain. Neuroimage. 2011;52:1243–1251. doi: 10.1016/j.neuroimage.2010.04.259. [DOI] [PMC free article] [PubMed] [Google Scholar]
- Perrotti LI, Hadeishi Y, Ulery PG, Barrot M, Monteggia L, Duman RS, Nestler EJ. Induction of deltaFosB in reward-related brain structures after chronic stress. J Neurosci. 2004;24:10594–10602. doi: 10.1523/JNEUROSCI.2542-04.2004. [DOI] [PMC free article] [PubMed] [Google Scholar]
- Perrotti LI, Weaver RR, Robison B, Renthal W, Maze I, Yazdani S, Elmore RG, Knapp DJ, Selley DE, Martin BR, Sim-Selley L, Bachtell RK, Self DW, Nestler EJ. Distinct patterns of DeltaFosB induction in brain by drugs of abuse. Synapse. 2008;62:358–369. doi: 10.1002/syn.20500. [DOI] [PMC free article] [PubMed] [Google Scholar]
- Pickel VM, Chan J, Kearn CS, Mackie K. Targeting dopamine D2 and cannabinoid-1 (CB1) receptors in rat nucleus accumbens. J Comp Neurol. 2006;495:299–313. doi: 10.1002/cne.20881. [DOI] [PMC free article] [PubMed] [Google Scholar]
- Ramaekers JG, Kauert G, Theunissen EL, Toennes SW, Moeller MR. Neurocognitive performance during acute THC intoxication in heavy and occasional cannabis users. J Psychopharmacol (Oxf) 2009;23:266–277. doi: 10.1177/0269881108092393. [DOI] [PubMed] [Google Scholar]
- Rubino T, Forlani G, Vigano D, Zippel R, Parolaro D. Ras/ERK signalling in cannabinoid tolerance: from behaviour to cellular aspects. J Neurochem. 2005;93:984–991. doi: 10.1111/j.1471-4159.2005.03101.x. [DOI] [PubMed] [Google Scholar]
- SAMHSA; Administration, S. A. a. M. H. S, editor. Results from the 2009 National Survey on Drug Use and Health: Volume I. Summary of National Findings. Rockville, MD: 2010. [Google Scholar]
- Sim-Selley LJ. Regulation of cannabinoid CB1 receptors in the central nervous system by chronic cannabinoids. Crit Rev Neurobiol. 2003;15:91–119. doi: 10.1615/critrevneurobiol.v15.i2.10. [DOI] [PubMed] [Google Scholar]
- Sim-Selley LJ, Cassidy MP, Sparta A, Zachariou V, Nestler EJ, Selley DE. Effect of DeltaFosB overexpression on opioid and cannabinoid receptor-mediated signaling in the nucleus accumbens. Neuropharmacology. 2011;61:1470–1476. doi: 10.1016/j.neuropharm.2011.08.046. [DOI] [PMC free article] [PubMed] [Google Scholar]
- Sim-Selley LJ, Martin BR. Effect of chronic administration of R-(+)-[2,3-Dihydro-5-methyl-3-[(morpholinyl)methyl]pyrrolo[1,2,3-de]-1,4-b enzoxazinyl]-(1-naphthalenyl)methanone mesylate (WIN55,212-2) or delta(9)-tetrahydrocannabinol on cannabinoid receptor adaptation in mice. J Pharmacol Exp Ther. 2002;303:36–44. doi: 10.1124/jpet.102.035618. [DOI] [PubMed] [Google Scholar]
- Sim-Selley LJ, Schechter NS, Rorrer WK, Dalton GD, Hernandez J, Martin BR, Selley DE. Prolonged recovery rate of CB1 receptor adaptation after cessation of long-term cannabinoid administration. Mol Pharmacol. 2006;70:986–996. doi: 10.1124/mol.105.019612. [DOI] [PubMed] [Google Scholar]
- Sim LJ, Selley DE, Childers SR. In vitro autoradiography of receptor-activated G proteins in rat brain by agonist-stimulated guanylyl 5′-[gamma-[35S]thio]-triphosphate binding. Proc Nat Acad Sci USA. 1995;92:7242–7246. doi: 10.1073/pnas.92.16.7242. [DOI] [PMC free article] [PubMed] [Google Scholar]
- Tsou K, Brown S, Sanudo-Pena MC, Mackie K, Walker JM. Immunohistochemical distribution of cannabinoid CB1 receptors in the rat central nervous system. Neuroscience. 1998;83:393–411. doi: 10.1016/s0306-4522(97)00436-3. [DOI] [PubMed] [Google Scholar]
- Varvel SA, Lichtman AH. Evaluation of CB1 receptor knockout mice in the Morris water maze. J Pharmacol Exp Ther. 2002;301:915–924. doi: 10.1124/jpet.301.3.915. [DOI] [PubMed] [Google Scholar]
- Villares J. Chronic use of marijuana decreases cannabinoid receptor binding and mRNA expression in the human brain. Neuroscience. 2007;145:323–334. doi: 10.1016/j.neuroscience.2006.11.012. [DOI] [PubMed] [Google Scholar]
- Zachariou V, Bolanos CA, Selley DE, Theobald D, Cassidy MP, Kelz MB, Shaw-Lutchman T, Berton O, Sim-Selley LJ, Dileone RJ, Kumar A, Nestler EJ. An essential role for DeltaFosB in the nucleus accumbens in morphine action. Nat Neurosci. 2006;9:205–211. doi: 10.1038/nn1636. [DOI] [PubMed] [Google Scholar]
- Zachariou V, Georgescu D, Sanchez N, Rahman Z, DiLeone R, Berton O, Neve RL, Sim-Selley LJ, Selley DE, Gold SJ, Nestler EJ. Essential role for RGS9 in opiate action. Proc Nat Acad Sci USA. 2003;100:13656–13661. doi: 10.1073/pnas.2232594100. [DOI] [PMC free article] [PubMed] [Google Scholar]
- Zimmer A, Zimmer AM, Hohmann AG, Herkenham M, Bonner TI. Increased mortality, hypoactivity, and hypoalgesia in cannabinoid CB1 receptor knockout mice. Proc Natl Acad Sci USA. 1999;96:5780–5785. doi: 10.1073/pnas.96.10.5780. [DOI] [PMC free article] [PubMed] [Google Scholar]
Associated Data
This section collects any data citations, data availability statements, or supplementary materials included in this article.
Supplementary Materials
Supplemental Figure 1. Antibody specificity controls for CB1R immunohistochemistry. (A) Representative scan comparing immunofluorescence between wild type and CB1R knockout mice. Prefrontal cortex is shown in row 1, nucleus accumbens and caudate-putamen in row 2, hippocampus in row 3 and cerebellum in row 4. Representative scan of cerebellum incubated with (B) antibody + blocking peptide and (C) secondary antibody only.
Supplemental Figure 2. Immunoblots showing ΔFosB-ir in bitransgenic mice that overexpress ΔFosB. (A) Representative blot in the caudate-putamen of mice overexpressing ΔFosB versus control mice and (B) graph representing percent ΔFosB expression compared to control mice. Data are means ± SEM with * p < 0.05 versus vehicle controls, un-paired, two-tailed Student t-test, n = 2 per group for overexpressing and control mice.
Supplemental Figure 3. Immunoblots showing ΔFosB-ir in the caudate-putamen of mice that received vehicle, 10 mg/kg THC or 30 mg/kg THC administration twice daily for 13.5 days. ΔFosB expression was significantly increased by THC treatment (F2,21 =17.78, p < 0.0001). ΔFosB levels were 50% ± 11% (p < 0.05) and 104% ± 17% (p < 0.001) above levels in vehicle control mice following 10 mg/kg and 30 mg/kg THC administration, respectively. ΔFosB-ir was also significantly greater in mice that received 30 mg/kg THC administration compared to mice treated with 10 mg/kg THC (p < 0.05). Results are presented as % vehicle control ± SEM with significance determined following one-way ANOVA with Bonferroni post-hoc tests, n = 8 mice per group.