

Abstract
The worldwide burden of tuberculosis (TB) remains an enormous problem, and is particularly severe in the admixed South African Coloured (SAC) population residing in the Western Cape. Despite evidence from twin studies suggesting a strong genetic component to TB resistance, only a few loci have been identified to date. In this work, we conduct a genome-wide association study (GWAS), meta-analysis and trans-ethnic fine mapping to attempt the replication of previously identified TB susceptibility loci. Our GWAS results confirm the WT1 chr11 susceptibility locus (rs2057178: odds ratio = 0.62, P = 2.71e−06) previously identified by Thye et al., but fail to replicate previously identified polymorphisms in the TLR8 gene and locus 18q11.2. Our study demonstrates that the genetic contribution to TB risk varies between continental populations, and illustrates the value of including admixed populations in studies of TB risk and other complex phenotypes. Our evaluation of local ancestry based on the real and simulated data demonstrates that case-only admixture mapping is currently impractical in multi-way admixed populations, such as the SAC, due to spurious deviations in average local ancestry generated by current local ancestry inference methods. This study provides insights into identifying disease genes and ancestry-specific disease risk in multi-way admixed populations.
INTRODUCTION
Tuberculosis (TB) is a significant source of morbidity and mortality worldwide, particularly in developing countries. It is a leading cause of human immunodeficiency virus (HIV)-related deaths, as almost one in four deaths among people with HIV infection is due to TB (1,2). In 2010, there were 8.8 million new cases of TB, of which 1.1 million were among people living with HIV (3,4). TB susceptibility is known to be a complex trait influenced by both genetic and environmental factors (5). The environmental factors that influence TB susceptibility include socio-economic conditions, smoking and acute infection. One-third of the world's individuals are infected with TB, but only 10% go on to develop active TB during their lifetime (6,7). In addition, twin studies in humans and animal models also demonstrate a strong genetic influence on TB susceptibility (5,8,9). The rate of concordance of TB among monozygotic twins (18 of 55, 32.7%) was more than twice (odds ratio of concordance: 2.4; 95% CI: 1.4–4.0) that observed among dizygotic twins (21 of 150, 14.0%) (8,9). These estimates suggest that genetic factors play an important role in TB susceptibility in both understanding the host response and determining the outcome of infection (2,8).
GWAS identification of genetic associations of host susceptibility to infectious disease, such as TB, has been slow and limited by small sample sizes (10,11). Few GWAS papers that identify the signal of association with pulmonary TB were published until recently. Davila et al. identified four polymorphisms in the TLR8 gene on chromosome X, in an Indonesian population and replicated the result in a Russian cohort (12). Thye et al. conducted a combined GWAS in African populations in Ghana and Gambia to investigate the host susceptibility to TB, and identified the 18q11.2 locus (13). Recently, Thye et al. reported a new TB susceptibility locus on chromosome 11p13 in a Ghanaian population near the WT1 gene. This finding was replicated in samples from Gambia, Indonesia and Russia (14). A case–control study in a Chinese population failed to replicate the 18q11.2 locus (15). However, it was replicated in a separate Han Chinese TB cohort (16).
These studies and work showing that rates of TB vary considerably between populations and regions suggest that association effects may vary across ethnic groups (4,17). Analysis of the correlation between genetic ancestry and phenotype in recently admixed populations can improve disease prediction and provide crucial insights into medical genetics (18). For example, Kumar et al. showed that genetic ancestry exerts a major influence on improving lung-function estimates and categorizing asthma severity in an African American population (18).
The second highest incidence of TB in the world is in the Western Cape in South Africa, particularly in the admixed South African Coloured (SAC) population (3,19). Investigations based on candidate gene studies and genome-wide linkage scans on the SAC population were previously conducted (3,10,11,19,20). Many of the candidate gene studies failed to observe statistical associations with the markers that were examined and were often inconclusive (11,20). Although a few genetic association studies have identified candidate genes for TB susceptibility using data from the SAC population (11,20), neither ancestry-specific TB risk nor GWAS for TB has been considered in this population. In addition, no study on other African ethnic groups has been attempted to replicate the susceptibility loci on chromosomes 18q11.2 and 11p13, reported in Thye et al. (13,14), respectively. It is not known whether the predisposition due to these SNPs applies to other African populations.
Here, we conducted a GWAS with correction for genome-wide ancestry, computed the power to replicate each published odds ratio and specified whether the published odds ratio lies within the 95% confidence interval (CI) estimated in the SAC dataset. Our study replicated the polymorphisms in WT1 gene previously identified in Thye et al. (14). Both imputation-based meta-analysis and trans-ethnic fine mapping of our study with recent African TB studies confirm that genetic variants in the WT1 gene confer risk of TB. However, our study did not validate previously identified polymorphisms in the TLR8 gene on chromosome X (12) or the 18q11.2 locus (13).
The SAC have a mixed ancestry traced back over 350 years from various populations including European Caucasoid, South and East Asians, and SAN and Bantu Africans (21–24). Our results show that ancestry-specific TB risk is not due to confounding by socio-economic status (SES) as is the case for type-2 diabetes in Latino populations from Mexico and Colombia (25). Furthermore, our findings indicated that the SAN ancestral component confers risk while non-African ancestral components confer protection against TB in the SAC.
RESULTS
GWAS with correction for genome-wide ancestry
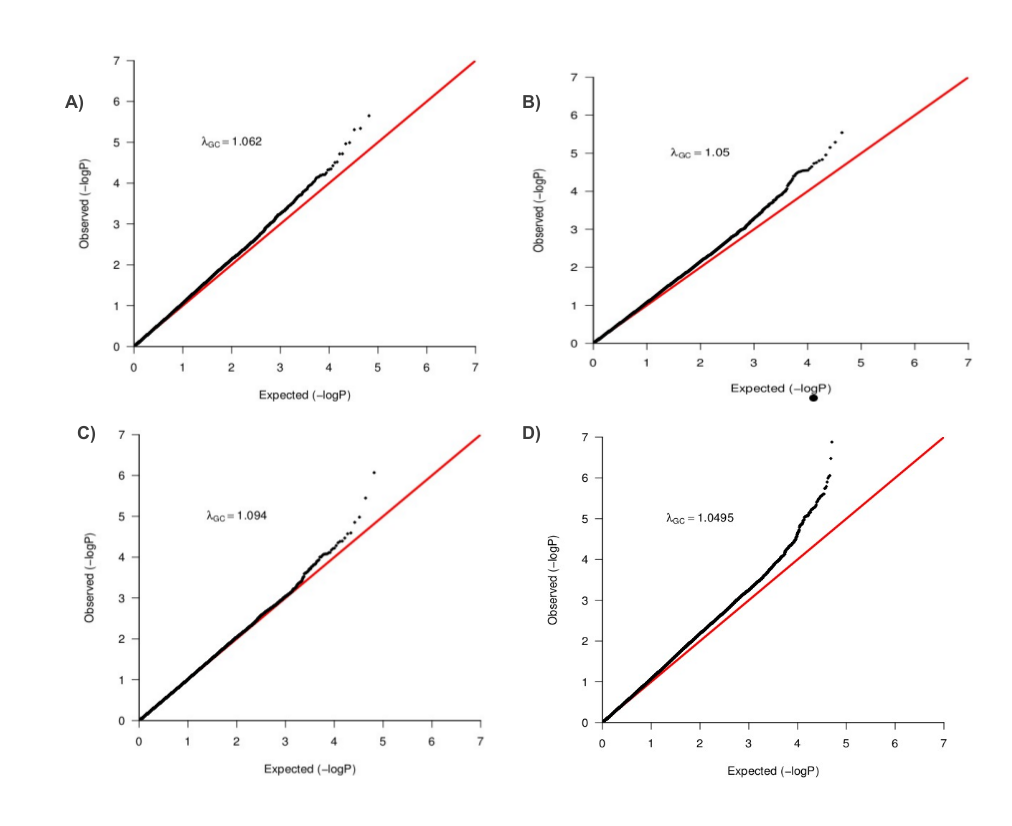
We analyzed data from 642 TB cases and 91 controls (after QC) genotyped on the Affymetrix 500 K chip (see Materials and Methods). Using impute2 (26), we imputed the untyped genotypes using HapMap3 release 2 (27) and 1000 Genome project populations (28). There were 1 453 294 and 4 467 279 genetic variants retained from each imputation panel respectively. As expected, we observed substantial population substructure in the SAC (see Materials and Methods). To account for both population stratification and hidden relatedness, we applied the mixed model approach EMMAX (29) on these datasets; the Q–Q plots of genomic control factors effects are shown in Figure 1. The genomic control lambda (30) was λGC = 1.05 for the typed dataset, λGC = 1.05 for the HapMap3 imputed dataset, λGC = 1.09 for the 1000G imputed dataset and λGC = 1.08 for the combined (typed, HapMap3 imputed and 1000G imputed) dataset. These genomic control lambdas are acceptable, and suggest little departure from the null expectation, except at the right end tail of the distribution. To control for cryptic relatedness, we used EMMAX (29), a variance component-based statistical test shown to control for both structure and relatedness.
Figure 1.

Q–Q Plot of population stratification effects to compare the distribution of observed P-values with the expected distribution: The λGC values indicate the residual population stratification effects (after correction) which are minimal. Plots A–D are from typed genotype, imputed genotype from both HapMap3 and the 1000 Genomes project and combined datasets, respectively.
As shown in Figure 2, a SNP on chromosome 14 q24.2, rs17175227 (P = 8.99e−09 and OR = 0.141) appears to be a genome-wide significant association signal. The SNP rs17175227 has a low minor allele frequency of 0.01642. We performed a well-calibrated test for rare SNPs, Fisher's exact test, to see whether the specific SNP would still be genome-wide significant. The result suggested that rs17175227 was not genome-wide significant (P = 2.77e−06, OR = 0.141) (Supplementary Material, Fig. S1). This highlights an important challenge in association analysis of low-frequency (1–5%) variants, which may often attain genome-wide significance in standard tests such as mixed model association or logistic regression due to the imperfect asymptotic distribution of those tests in the case of low-frequency variants (Materials and Methods).
Figure 2.

Manhattan plot of genome-wide association analyses of TB in the SAC (A) from typed dataset only, and (B and C) both imputed datasets based on HapMap3 and 1000 Genomes reference populations, and (D) the combined dataset.
The HapMap3 imputed SNP rs12294076 (P = 9.56e−08) on chromosome 11q21–q22.1 narrowly misses the threshold of genome-wide significance, which we define as P = 6.4e−08, 1.7e−08 and 5.5e−09 based on 390 887; 1 453 294 and 4 467 279 SNPs tested (Fig. 2) from typed genotype data and imputed data using HapMap3 and 1000 Genomes data, respectively (see Materials and Methods). The genetic variant rs12294076 has a minor allele frequency of 0.16 in the SAC, 0.22 in Yoruba and 0.00 in other HapMap populations, and is likely to be an African-specific SNP. The closest gene to this SNP is DYNC2H1. This gene encodes a large cytoplasmic dynein protein known to be involved in retrograde transport in the cilium with a major role in intraflagellar transport (31). Mutations in DYNC2H1 cause a heterogeneous spectrum of conditions related to altered primary cilium function. The sub-cellular distribution of dynein shows specific association with elements of the late endocytic pathway (31). Additional 36 typed and 62 imputed genetic markers with suggestive P-values (10−05–10−06) that did not pass our genome-wide significance thresholds are listed in Supplementary Material, Tables S1 and S2, respectively.
Replication of SNPs reported in previous studies
We attempted to replicate the chr11, chr18 and chrX associations with TB previously reported by Thye et al. (13, 14) and Davila et al. (12), respectively. In each case, we computed our power to detect an association at the previously reported odds ratio, and evaluated whether the previously reported odds ratio was within our 95% CI (see Materials and Methods). We found that the associated SNP, rs2057178 (P = 2.63e−09, OR = 0.77 and MAF = 0.33) on 11p13 reported by Thye et al. (14), is close to genome-wide significance (P = 2.71e−06, OR = 0.62 and MAF = 0.08) in the SAC-TB imputation GWAS (Table 1). A second reported significant SNP in the Ghanaian study group rs11031728 (P = 5.25e−09, MAF = 0.32 and OR = 0.77) was also associated in our imputation GWAS study (P = 2.86e−06, MAF = 0.08 and OR = 0.61). The third most significant SNP in their study, rs11031731 (P = 7.01e−09, MAF = 0.31 and OR = 0.78), was not accurately imputed in our study (CALL ≈ 0.8), and could therefore not be examined with confidence (Supplementary Material, Table S3). The rs2057178, rs11031728 and rs11031731 1000G imputed SNPs in the SAC are not genotyped in GIH and SAN data. Nevertheless, we computed the r2 LD between these three SNPs and other SNPs in the WT1 locus using the SAC data and the Yoruba in Ibadan (YRI), CEU, Japanese in Toyko (JPT) + CHB data from the 1000 Genomes project. Previous results reported that the rs2057178, rs11031728 and rs11031731 SNPs are in strong LD in the Ghanaian population (14). We obtained r2(rs2057178, rs11031728) = 0.90, 0.90, 1.00 and 0.8; r2(rs2057178, rs11031731) = 0.70, 0.90, 1 and 1 and r2(rs11031728, rs11031731) = 0.70, 1.00, 1.00 and 0.90 in SAC, CEU, YRI and JPT + CHB, respectively. These three variants are also found to be in LD in the SAC data. Additional loci in LD with the WT1 locus are provided in Supplementary Material, Table S3. The rs2057178, rs11031728 and rs11031731 SNPs and others listed in Supplementary Material, Table S3 are associated with WT1.
Table 1.
Replication of SNPs reported in previous studies
| SAC TB Study |
Thye et al. (14) | ||||||||||||
|---|---|---|---|---|---|---|---|---|---|---|---|---|---|
| SNP | CHR | POS | A1/A2 | Call | INFO | MAF | P | OR(95%CI) | Power | SNP type | MAF | P | OR(95%CI) |
| rs2057178 | 11 | 32364187 | G/A | 0.84 | 0.8 | 0.08 | 2.71e−06 | 0.62(0.50–0.75) | 0.1564 | 1000G Imputed | 0.33 | 2.63e−09 | 0.77 (0.71–0.84) |
| rs11031728 | 11 | 32363616 | C/G | 0.84 | 0.80 | 0.08 | 2.86e−06 | 0.61(0.50–0.75) | 0.1454 | 1000G Imputed | 0.32 | 7.01e−09 | 0.78 (0.71–0.8) |
| Thye et al. 2010 (13) | |||||||||||||
| rs4331426 | 18 | 19676176 | G/A | 0.99 | 0.9 | 0.19 | 0.83 | 1.00(0.95–1.04) | 0.1185 | HapMap3 Imputed | 0.48 | 6.8e−09 | 1.19 [1.1–1.3] |
| Davila et al. 2008 (12) | |||||||||||||
| rs3788935 | X | 12922659 | A/C | 1 | 1 | 0.386 | 0.1465 | 1.30(0.91–1.85) | 0.5532 | 1000G Imputed | – | 0.014 | 1.4 (1.07–1.8) |
| rs3761624 | X | 12923681 | A/C | 1 | 1 | 0.382 | 0.1844 | 1.27(0.89–1.81) | 0.5521 | 1000G Imputed | – | 0.016 | 1.4 (1.06–1.8) |
| rs3764879 | X | 12924697 | A/C | 1 | 1 | 0.386 | 0.2854 | 1.23(0.87–1.80) | 0.5532 | 1000G Imputed | – | 0.01 | 1.4 (1.06–1.8) |
Looking at Table 1 and Supplementary Material, Table S3, the effect of the susceptibility loci at WT1 in the SAC is in the same direction as those published in Thye et al. (14), suggesting resistance to TB. However, the published odds ratio in Thye et al. 2012 (14) does not lie within the 95% CI estimated in the SAC dataset (Table 1). This may be due to different LD patterns between the SAC and WTCCC-TB data, since the SAC is admixed. SNPs can be associated with the same phenotype in different ethnicity groups, but the effect sizes may differ substantially, because the tag SNP may tag different sets of causal variants.
WT1 is a suppressor gene located on chromosome 11p13 and provides instructions for making a protein that is involved in the development of the kidneys and gonads (ovaries in females and testes in males) before birth (32). Furthermore, it is also known as a transcription factor since it regulates the activity of other genes by binding to specific regions of DNA. Querying a comprehensive human Protein–Protein Interaction network (http://cbg.garvan.unsw.edu.au/pina/), WT1 has known direct interactions (32) with UBE2I, AREG, WTAP, AREGB, U2AF2, TP73, SDGF, PRKACA and the P53 gene. In particular, this gene is unusually expressed in lung and certain types of prostate cancer, and has been seen in some cancers of blood-forming cells (leukemias), such as acute lymphoblastic leukemia, chronic myeloid leukemia and childhood acute myeloid leukemia (32).
The identified susceptibility locus rs4331426 on chromosome 18q11.2 in Thye et al. 2010 (MAF = 0.48, Gambia: P = 0.003 and OR = 1.18, Ghana: P = 0.004 and OR = 1.19 and Combined data: P = 6.8e−09 and OR = 1.19), for TB in the study of combined Gambia and Ghanaian populations (13), did not yield an association with TB in our study (Table 1). We obtained P = 0.83, MAF = 0.19 and OR = 1.00, and no suggestive signals in the SAC data located near the variant at SNP rs4331426 (Supplementary Material, Table S4). As above, we computed r2 in the region of 18q11.2 in the data of the SAC, CEU, YRI, JPT + CHB, GIH and SAN. Four SNPs rs4264496, rs4331426, rs4239431 and rs4239432 in the entire region of 18q11.2 have r2> = 0.5, but all have weak P-values from the association study with TB (Supplementary Material, Table S4) in the SAC data. In addition, the rs4331426 SNP is not in LD with any SNPs in WT1 locus in the data of the SAC, CEU, YRI and JPT + CHB. One possible explanation for our failure to replicate this locus could be our low power to detect the reported odds ratio (power = 0.12). However, the published odds ratio of rs4331426 is not included in the 95% CI (CI) estimated in the SAC dataset (Table 1), suggesting that our non-replication was not due solely to low power. Different LD patterns between the SAC and Gambia/Ghana/Malawi populations provide an alternative explanation.
To compare our study with previous findings of association with TB susceptibility at four polymorphisms in the TLR8 gene on the X chromosome from Davila et al. 2008 (12), we conducted an additional imputation GWAS on the non-pseudoautosomal region (nonPAR) and two pseudoautosomal regions (PAR1 and PAR2) of the X chromosome in the SAC. The results displayed in Table 1 compare our results with those from Davila et al. (12). Our imputation GWAS suggests a non-significant trend towards association of these four polymorphisms in the TLR8 gene on the X chromosome, including rs3764880, rs3764879, rs3761624 and rs3788935 (Table 1 and Supplementary Material, Fig. S2). These four SNPs are in LD with one another (r2> = 0.5) in the data of the SAC, additional SNPs in LD with rs3788935 (the reported TB associated SNPs in Davila et al. 2008 (12)) in the SAC, CEU, YRI, JPT + CHB, GIH and SAN data and their related P-values from the SAC association study are provided in Supplementary Material, Table S5. Because we had incomplete power to replicate the published odds ratio (power = 0.55), and the published odds ratio in Davila et al. (12) lies within the 95% CI estimated in the SAC dataset (Table 1), the lack of a statistically significant association in our data may be due to incomplete power.
Meta-analysis
Identifying common variants of modest effect is a challenge, and large sample size is a way to increase power. The sample sizes of TB cases and controls in this study do not provide sufficient power to obtain associations at a stringent level of statistical significance. To increase the power to detect common variants, we combined the current dataset with existing data in order to fine-map existing signals by performing imputation on the WTCCC-TB (Gambia/Ghana/Malawi) data and including the imputed SNPs in fine-mapping analyses. Merging the two genome-wide imputation GWAS datasets (SAC-TB and WTCCC-TB), a total of 1 009 364 autosomal SNPs were meta-analyzed across the two studies (SAC-TB and WTCCC-TB). Since admixture LD in the SAC and possible different LD patterns between the SAC and Gambia/Ghana/Malawi samples can cause heterogeneity, we assessed the degree of heterogeneity in the combined studies in order to choose an appropriated meta-analysis method (fixed or random effect). We obtained 84.80% of variability due to heterogeneity between studies (SAC-WTCCC) rather than sampling error and a total amount of heterogeneity (Tau-square heterogeneity estimator of DerSimonian–Laird) was 0.0288 (SE = 0.0226), indicating a high level of heterogeneity in our combined studies.
To account for the between-study heterogeneity, we applied both random and binary-effects methods implemented in the MetaSoft program (33) (see Materials and Methods). We report results of random and binary-effect meta-analyses (Table 2). We also obtained reasonable inflation rates from the random-effect (λGC = 1.062), binary-effect (λGC = 1.05) and from each individual study, SAC-TB (λGC = 1.094) and WTCCC-TB (λGC = 1.0495), respectively (Supplementary Material, Fig. S3). In addition to standard P-values, we also examined the posterior probability (m-value) that the effect exists in each study (33). Using a threshold m > 0.7, we observed two genetic variants, rs2057178 and rs11031728 (Fig. 3 and Table 2) with similar P-values to those from the standard GWAS (Table 1), that resulted in a significant risk of TB and had effects in our study and the Thye et al. study (14). These SNPs are both on chromosome region 11p13 and replicate the recent findings of Thye et al. (14) in our imputation GWAS.
Table 2.
Imputation genome-wide meta-analysis of two TB case–control studies, SAC-TB and WTCCC-TB
| SAC TB |
|||||||
|---|---|---|---|---|---|---|---|
| SNP | CHR | P_RAN | P_BE | ST1 | ST2 | P-value | M-value |
| rs2057178 | 11 | 3.26e−3 | 9.83e−13 | 53.05 | 2.91 | 2.75e−06 | 1.0 |
| rs11031728 | 11 | 4.73e−07 | 4.08e−10 | 41.19 | 0.0 | 2.98e−06 | 0.988 |
| SAC TB | |||||||
| rs4331426 | 18 | 0.282554 | 1.8950e−08 | 1.15 | 32.6 | 0.002 | 0.0 |
P_RAN is the P-value of random effect, P_BE is the P-value of binary effect, ST1 and ST2 are the statistic mean effect and heterogeneity, respectively. M-value is the posterior probability that the effect exists in each study. The P-value of rs4331426 differs from that in Table 1 due to Metasoft fitting it together with the Thye et al. studies.
Figure 3.

Forest plot of combined TB studies, including our TB study, Thye et al. (13,14).
We evaluated whether trans-ethnic meta-analysis can refine or confirm the replicated association signals by narrowing the genomic regions at locus WT1 where functional variants might be expected to reside. To address this, we re-imputed SNPs at chromosome region 11p13 (32409321–32457176 bp) from both WTCCC-TB and SAC-TB. Supplementary Material, Table S3 displays GWAS results, the patterns of linkage disequilibrium in region in both ethnic groups (WTCCC-TB and SAC-TB). Although the imputations were moderately accurate (CALL ∼0.8, Supplementary Material, Table S3), all the imputed variants at locus WT1 were in LD with the lead SNP rs2057178 in the SAC.
Our trans-ethnic fine mapping (Supplementary Material, Table S6) based on the imputation meta-analysis at chromosome region 11p13 confirmed the association signals at locus WT1 and facilitated the localization of neighbouring variants in LD that may influence trait variability at loci of WT1. The between-study heterogeneity due to different patterns of LD and imputation accuracy are major limitations for fine mapping of GWAS signals (26,34), nevertheless this current result (Supplementary Material, Tables S3 and S6) demonstrated that fine mapping is a powerful approach to better characterize TB susceptible loci risk in diverse populations.
Additional meta-analysis of our TB study and four polymorphisms in the TLR8 gene on chromosome X previously identified in Davila et al. (12) are found in Supplementary Material, Figure S2. Although Metasoft provides a slightly different P-value (Table 2) for SNP rs4331426 than the one from the standard GWAS (Table 1), which may be due to high heterogeneity (ST2 = 32.6, see Table 2), this susceptibility locus reported in Thye et al. 2010 (13) does not survive genome-wide significance in the TB meta-analysis of the SAC and Thye et al. 2010 (13). Moreover, the combined SAC TB study and TB susceptibility at four polymorphisms in the TLR8 gene on X chromosome in the Indonesian population reported in Davila et al. 2008 by meta-analysis do not yield any convincing association evidence. The failure may be mainly due to low power (56.2 and 12.3%) to detect the four polymorphisms in the TLR8 gene on chrX and locus at 18q11.2 associations using the meta-analysis sample size, respectively. In addition, variability of patterns of LD across distinct ethnic groups (SAC, Gambia/Ghana/Malawi and Indonesian) might explain our replication failure.
Relationship between TB risk and genetic ancestry
We estimated the proportion of genome-wide ancestry in 733 unrelated SAC individuals (642 cases and 91 controls) from these five proxy ancestral populations (Supplementary Material, Table S7), including European (CEU), Bantu Africans (YRI), SAN Africans, Gujarati Indian (GIH) and Chinese/Japanese (CHB + JPT). Our choice of the proxy ancestral populations of the SAC is based on previous findings (21–23) (Materials and Methods). In particular, Patterson et al. (22) demonstrated that the admixed SAC population includes an east Asian related component. They inferred European, south Asian and Indonesian components of non-African ancestry. It is appropriate to model the Indonesian component using an east Asian population, because Patterson et al. (22) reported an FST value of 0.02 between Indonesians and east Asians, which is much lower than the FST value of 0.07 between Indonesians and south Asians or the FST value of 0.10 between Indonesians and Europeans. Similarly, Patterson et al. (22) and De Wit et al. (21) demonstrated that the SAC population includes both SAN African and Bantu African components.
To examine the relationship between genetic ancestry and TB status in this SAC dataset, we regressed case–control status against the estimated fraction of YRI, SAN, GIH, CHB + JPT and CEU ancestry, respectively, in 733 unrelated SAC individuals (Table 3). We observed a statistically significant positive correlation (r 95%CI = 0.16 [0.09, 0.23], P = 1.58e−05) between SAN ancestry and TB status. The CEU (r 95% = −0.12 [−0.19, −0.05], P = 0.0007), CHB + JPT (r 95%CI = −0.13 [−0.20, −0.06], P = 0.0005) and GIH (r 95% = −0.11 [−0.18, −0.04], P = 0.002) ancestry in the SAC were negatively correlated with TB status. YRI ancestry proportion was not significantly correlated (r 95%CI = 0.06 [−0.01, 0.13], P = 0.109) with TB. Furthermore, we observed a statistically significant correlation of age (P = 1.01e−05, mean age 37 in cases and 31 in controls) with risk of TB, but no evidence of correlation between sex and TB (P = 0.597).
Table 3.
Association of genetic ancestry with TB in the SAC, with nominal P-values before correcting for hypotheses tested
| Association of genetic ancestry with TB |
Genome-wide ancestry | |||
|---|---|---|---|---|
| POP | Correlation 95% CI, P-value (TB-ancestry) | Cases | Controls | All samples |
| SAN | 0.16 [0.09,0.23],1.58e − 05 | 0.342 ± 0.135 | 0.279 ± 0.114 | 0.334 ± 0.134 |
| YRI | 0.06 [−0.01, 0.13], 0.109 | 0.279 ± 0.163 | 0.250 ± 0.143 | 0.275 ± 0.161 |
| CEU | −0.12 [−0.19, −0.05], 0.0007 | 0.184 ± 0.116 | 0.228 ± 0.124 | 0.190 ± 0.118 |
| GIH | −0.11 [−0.18, −0.04], 0.002 | 0.127 ± 0.086 | 0.156 ± 0.079 | 0.130 ± 0.086 |
| CHB + JPT | −0.13 [−0.20, −0.06], 0.0005 | 0.069 ± 0.047 | 0.087 ± 0.054 | 0.071 ± 0.048 |
Mean and standard error of ancestry proportion from each of five populations contributing to the admixture in the SAC (from cases, controls and all samples of the SAC.).
We observed a correlation between ancestry proportions of the ancestral populations (Supplementary Material, Table S8). We checked to see if the tests above could be confounded by this correlation by performing conditional risk tests between pairs of the ancestral populations (see Materials and Methods). Our results demonstrate that African ancestry (SAN, YRI) TB risk in the SAC is not significant conditioned on non-African ancestry (CEU and JPT–CHB) risk. With the exception of Indian (GIH) ancestry, non-African ancestry (CEU and JPT–CHB) risk is significant conditioned on African ancestry risk. This shows that YRI and SAN are differently correlated with risk than CEU, JPT–CHB and GIH (Supplementary Material, Table S7). JPT–CHB, GIH and CEU are not significantly conditioned on each other and all are correlated with TB risk (Supplementary Material, Table S8). We see that SAN confers risk, CEU, JPT–CHB and GIH confer protection, and YRI shows no evidence of correlation (Supplementary Material, Table S8).
Another potential concern was that the observed relationship between genetic ancestry and TB status could be a consequence of confounding due to SES, as described in a recent study of type 2 diabetes in Latinos (25). We investigated this possibility by studying two SES variables (see Materials and Method), household and individual incomes (Supplementary Material, Table S8). Although these variables were available in only a subset of 82 SAC cases, it was possible to draw a conclusion about whether or not there exists both a hypothetical difference in SES in cases versus controls (which we cannot quantify) and a correlation between ancestry and SES (which we can quantify), as both effects would need to be present in order for the ancestry analysis to be confounded by SES. When testing for correlations between each of the two SES variables and each of the five ancestries, none of the results were statistically significant after correcting for 10 hypotheses tested (Supplementary Material, Table S8). In particular, SAN ancestry had a non-significant trend towards positive correlation (r = 0.05, 95% CI = [−0.17, 0.27], P = 0.65) and (r = 0.09, 95% CI = [−0.13, 0.31], P = 0.45) with SES self and household incomes, respectively. Although TB status is known to be associated with low SES (35–38), even considering the low end of the 95% CI of −0.17 (for SES self income) and −0.13 (for SES household income) this still could not explain the correlation (r = 0.16, 95% CI = [0.09, 0.23], P = 1.58e−05) between SAN ancestry and TB status unless there is a virtually perfect negative correlation between SES and TB status, which is highly unlikely. Thus, the observed association between SAN ancestry and TB status (Table 3) is not entirely a consequence of SES.
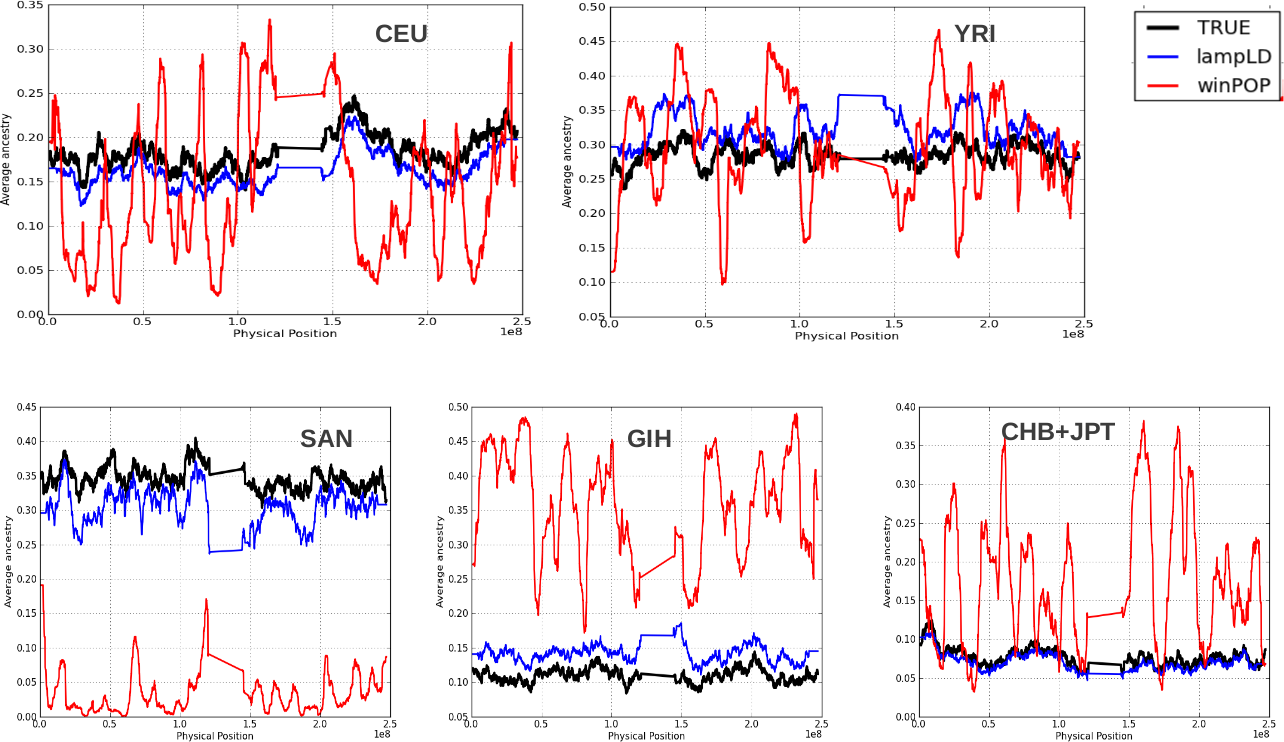
Accuracy of multi-way local ancestry inference in the SAC
Recently introduced locus-specific ancestry methods for multi-way admixed populations, including ALLOY (39), PCAdmix (40), MULTIMIX (41) and ChromoPainter (42) achieved equivalent accuracy to WinPOP (43) or Lamp-LD (44). Therefore, we assessed the accuracy of two methods for inferring local ancestry in multi-way admixed populations, Lamp-LD (44) and WinPOP. We simulated 750 individuals of mixed European (CEU), Chinese and Japanese (CHB + JPT), Bantu (YRI) and SAN ancestry on chromosome 1 (Supplementary Methods Text 1). We assessed the accuracy from the inferred local ancestry from both Lamp-LD and WinPOP by comparing an estimate of correlation between the inferred local ancestry from Lamp-LD (CEU: 86%, YRI: 78%, GIH: 84%, CHB + JPT: 90% and SAN: 80%) and WinPOP (CEU: 58%, YRI: 69%, GIH: 51%, CHB + JPT: 48% and SAN: 47%) and the true ancestry information by computing the accuracy (Supplementary Methods Text 1). The results suggest that Lamp-LD provides greater accuracy than WinPOP (Supplementary Material, Figs S4 and S5). Given this, we then assessed the ability of Lamp-LD to correctly infer the local ancestry in a multi-way admixed population by computing the rate of calling true ancestral and the error of calling other ancestral populations instead of the true ones (Supplementary Methods Text 1). Supplementary Material, Table S9 demonstrates that even Lamp-LD does not correctly estimate the true local ancestry in a multi-way admixed population. Supplementary Material, Table S9 shows that the true CEU ancestry in the admixed population (simulation data) is miscalled as GIH ancestry (17%) more often than true GIH ancestry is miscalled as CEU ancestry (9.4%). The true SAN ancestry in the admixed population (simulation data) is miscalled as YRI ancestry (15.8%) slightly more often than true YRI ancestry is miscalled as SAN ancestry (14.2%). Due to the limitation in accuracy of these methods in inferring local ancestry in multi-way admixed populations, we conclude that case-only admixture mapping is impractical in the multi-way admixed populations such the SAC.
Deviation in local ancestry in the SAC
A major limitation of admixture mapping and admixture association is that the inference of locus-specific ancestry in complex multi-way admixed populations such as the SAC may suffer from spurious deviations in average local ancestry at particular chromosomal regions from cases and controls, resulting in spurious case-only admixture associations (45,46). Simulation may not measure systematic inaccuracies arising from the violations of model assumptions such as random mating, number of generations since admixture, and recombination rate (45,46) in estimating local ancestry. Here, we conducted a real data-based evaluation of local ancestry using the SAC population. We evaluated the deviations in local ancestry inferred from Lamp-LD (Materials and Methods Text 2). Several SNPs in a total of 69 chromosomal regions (Supplementary Material, Table S10) showed strong deviation in local ancestry (4 standard deviations above or below the genome-wide average) in the SAC. These inferred local ancestries regions with large deviation are consistent between cases and controls (Fig. 4), indicating that the deviations in cases are not true disease associations and could lead to spurious admixture associations if case-only admixture mapping is employed (45,46). We conclude that case-only admixture mapping is currently impractical in multi-way admixed populations such the SAC.
Figure 4.
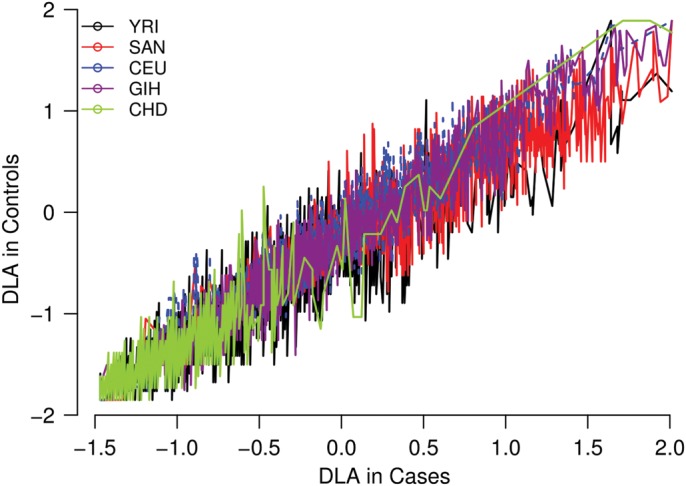
Deviations in the average local ancestry (DLA) in the admixed South African Coloured population (4 standard deviations above or below the genome-wide average). We plot regions of strong deviation in average local ancestry in case (x-axis) versus control (y-axis) samples of the SAC. The plot shows spurious deviations in average local ancestry (e.g. regions in which the modelled ancestral population is unusually different from the true ancestral population due to the historical action of natural selection).
DISCUSSION
We conducted a genome-wide association analysis of TB case–controls from the admixed SAC population, resulting in the identification of a low-frequency variant at the rs17175227 SNP. After imputation we also identified a rare variant at rs12294076 SNP at the borderline of genome-wide significance and we moderately replicated a recently reported susceptibility locus, rs2057178. Similar results were obtained when including age and gender as covariates in the analysis (Supplementary Material, Table S1). Power to detect association is a function of allele frequency and rare variants are underpowered when sample sizes are limited. Because of the imperfect asymptotic distribution of mixed model association or logistic regression in the specific case of low-frequency variants, which may often reach genome-wide significance; we computed Fisher's exact test values for variants that achieved the most significant mixed model association P-values. This resulted in rs17175227 not reaching the genome-wide cut-off. Importantly, Fisher's exact test allowed us to demonstrate that a rare variant is not genome-wide significant although it achieved significant mixed model association P-values. In general, the analysis of rare or low-frequency variants poses challenges at any dataset of smaller to larger sample size. Fisher's exact test, as its name implies, may be a well-calibrated test for rare SNPs and works fine with small sample sizes. However, Fisher's exact test lacks flexibility to handle multiple predictors, does not account for the contribution of the sample structure to the phenotype and may inflated. Our study addressed these issues. Until such time as GWAS is able to account for rare variants, our current recommendation is to apply Fisher's exact test to the few low-frequency variants that are shown to be significant from the mixed model in GWAS. For combined typed and imputation GWAS, Table 4 displays the top 24 genetic markers with suggestive P-values (< or equal to 10−06) obtained from the association analysis with the TB phenotype in the SAC, including some previously reported TB SNPs that we discuss in the next section. An additional 36 typed and 62 imputed SNPs attained suggestive levels of significance (10−05–10−06), and can be found in Supplementary Material, Tables S1 and S2, respectively.
Table 4.
Top 24 genetic markers obtained from the association analysis with the TB phenotype (typed and imputed datasets)
| SNP | CHR | POS | A1/A2 | Call | INFO | MAF | P | OR | Closest Gene | Type |
|---|---|---|---|---|---|---|---|---|---|---|
| rs10916338 | 1 | 228715923 | A/G | 1 | 1 | 0.14 | 4.74e−06 | 0.40 | RNF187 | Typed |
| rs1925714 | 1 | 226769912 | A/G | 0.99 | 0.97 | 0.14 | 1.80e−07 | 0.35 | RNF187 | Imputed |
| rs6676375 | 1 | 240941508 | C/T | 0.96 | 0.87 | 0.13 | 7.58e−07 | 0.33 | PLD5 | Imputed |
| rs1075309 | 2 | 5253598 | C/T | 1 | 1 | 0.09 | 7.07e−07 | 0.35 | SOX11 | Typed |
| rs2202157 | 3 | 26518424 | C/T | 0.88 | 0.65 | 0.16 | 7.80e−07 | 0.25 | Unknown | Imputed |
| rs958617 | 4 | 78824393 | A/G | 0.74 | 0.50 | 0.30 | 2.90e−07 | 0.15 | CNOT6L | Imputed |
| rs2505675 | 6 | 2300674 | C/T | 0.87 | 0.61 | 0.15 | 3.87e−06 | 0.22 | LOC100508120 | Imputed |
| rs17217757 | 8 | 106613321 | C/G | 1 | 1 | 0.18 | 3.09e−06 | 0.43 | ZFPM2 | Typed |
| rs1934954 | 10 | 96792202 | C/T | 1 | 1 | 0.02 | 2.81e−06 | 0.14 | CYP2C8 | Typed |
| rs12283022 | 11 | 102485804 | A/G | 0.76 | 0.48 | 0.24 | 1.88e−06 | 0.14 | DYNC2H1 | Imputed |
| rs12294076 | 11 | 102632275 | C/T | 0.85 | 0.60 | 0.17 | 9.57e−08 | 0.16 | DYNC2H1 | Imputed |
| rs2057178 | 11 | 32364187 | G/A | 0.84 | 0.80 | 0.08 | 2.71e−06 | 0.62 | WT1 | Imputed |
| rs11031728 | 11 | 32363616 | C/G | 0.843 | 0.80 | 0.08 | 2.86e−06 | 0.61 | WT1 | Imputed |
| rs7105967 | 11 | 102434653 | C/T | 0.75 | 0.45 | 0.25 | 3.51e−06 | 0.15 | DCUN1D5 | Imputed |
| rs7947821 | 11 | 102452675 | C/T | 0.75 | 0.47 | 0.25 | 1.95e−06 | 0.14 | DCUN1D5 | Imputed |
| rs6538140 | 12 | 76262136 | A/G | 0.81 | 0.63 | 0.26 | 4.46e−06 | 0.23 | E2F7 | Imputed |
| rs1900442 | 13 | 41403674 | C/T | 0.97 | 0.91 | 0.15 | 4.72e−06 | 0.37 | VWA8 | Imputed |
| rs17175227 | 14 | 70502050 | A/G | 1 | 1 | 0.02 | 8.99e−09 | 0.14 | SMOC1 | Typed |
| rs40363 | 16 | 3449057 | A/G | 0.75 | 0.51 | 0.28 | 3.13e−06 | 0.09 | NAA60 | Imputed |
| rs2837857 | 21 | 41138825 | C/T | 0.80 | 0.65 | 0.30 | 2.40e−06 | 0.30 | DSCAM | Imputed |
| rs451390 | 21 | 42216579 | C/G | 0.88 | 0.66 | 0.15 | 1.58e−07 | 0.22 | C2CD2 | Imputed |
| rs3218255 | 22 | 35874432 | A/G | 0.80 | 0.66 | 0.31 | 2.32e−07 | 0.25 | IL2RB | Imputed |
| rs5928363 | X | 33784063 | A/C | 1 | 1 | 0.02 | 3.72e−06 | 0.12 | Unknown | Imputed |
| rs142513793 | X | 47906480 | A/C | 1 | 1 | 0.03 | 1.84e−07 | 0.20 | Unknown | Imputed |
A1/A2 are reference/derived alleles.
Imputation-based meta-analysis, combining data from the GWAS conducted at different locations, was successful in a recent study of severe malaria in three African populations (47). To achieve sufficient power and identify shared risk loci with a previously reported African TB case–control studies (13,14), a GWAS meta-analysis was performed under random-effect and binary-effecs models. In combining GWAS data across these studies, two loci (rs2057178 and rs11031728) had an association result with genome-wide significance, and showed strong effects in both our study and the previous African TB case–control study (14).
We used a combination of two complementary methods to examine whether the genetic ancestry contribution can increase TB risk, and evaluated the contribution of SES to the ancestry-TB relationship in the SAC. Our results demonstrated significant evidence of an association between SAN ancestry and TB status that is not confounded by SES. This is an important epidemiological result and illustrates the value of the inclusion of admixture association methods in the set of methods used to conduct TB association studies in this population. When the extremely high incidence of TB in the SAC population is considered, together with our finding that a significant percentage of their ancestry is derived from the SAN and other African populations, it appears possible that there is an element of population level genetic susceptibility to this disease. Although, our study had only 82 cases with SES information, it was possible to draw a conclusion about the extent to which both a hypothetical difference in SES in cases versus controls (which we could not quantify) and a correlation between ancestry and SES (which we quantified) could lead to the ancestry analysis being confounded by SES. Specifically, if ancestry and SES were correlated, this correlation would exist irrespective of TB status and would exist in both cases and controls, regardless of whether or not there is a mean SES difference between cases and controls. We justified our conclusion by the results we presented in Florez et al. (25), in which they observed a similar correlation between ancestry and SES in both cases and controls.
Our study is the first ancestry-specific GWAS of TB risk in the complex admixed SAC population. Our subsequent imputation-based meta-analysis and trans-ethnic fine mapping including other GWAS on African populations confirmed loci identified previously. The results (Table 2 and Supplementary Material, Tables S3 and S6) demonstrated that trans-ethnic fine mapping is a powerful approach to better characterize TB susceptible loci in diverse populations.
Overall, some limitations should be noted in our current study. First, the present study is underpowered to detect risk variants of small effect size, because of our modest sample size. However, we addressed these issues by computing the power to replicate TB published odds ratio and for each published association we specified whether or not the published odds ratio lies within the 95% CI estimated in our current dataset. This allows us to interpret the failure to replicate previous TB findings in our study. We detected an association at the previously identified WT1 locus that is almost genome-wide significant in our data despite the limited sample size. Second, imputing missing genotype data of a complex admixed population is an important challenge with several issues related to the choice and size of existing reference panels. In particular, the imputation of missing genotype data of the admixed SAC population was suboptimal. Nonetheless, the increased number of SNPs generated by imputation analyses was useful in this study, yielding the replication of TB susceptibility loci (14). Third, despite applying Fisher's exact test to address the case of rare variants, the implementation of newer sequencing technologies is still required to search for rare risk variants. This may potentially provide crucial insights in identifying TB susceptibility genes and, therefore, inform the development of novel interventions. Fourth, the between-study heterogeneity due to divergent evolutionary and migratory histories, variability of patterns of linkage disequilibrium across distinct ethnic groups, and the differing imputation accuracy are major limitations for fine mapping of GWAS signals in multi-way admixed populations such as the SAC. Lastly, a major limitation of admixture mapping and case-only admixture association analysis is currently due to errors in inference of local ancestry in complex multi-way admixed populations such as the SAC. Our simulation result demonstrated that existing methods may attain high accuracy on average but may suffer from spurious deviations in average local ancestry at particular regions. These deviations would be present in both cases and controls, and would lead to spurious case-only admixture associations.
Overall, our GWAS provides promising results and suggests that more power can be obtained by designing an extension-association model that can combine both SNP case–control and admixture in the SAC. Priorities for future work will be to examine an accurate, unbiased estimation of the ancestry at every SNP in this multi-way admixed population to potentially provide crucial insights into identifying disease genes. This will provide a method to account for a combined genome-wide SNP case–control and admixture analysis in a multi-way admixed population such as the SAC.
MATERIALS AND METHODS
Samples and genotype quality control
The SAC population under study is located in the metropolitan area of Cape Town in the Western Cape Province in South Africa (12). Since the ethnicity, SES and HIV infection may be confounders in TB association studies (2–4), this area was selected due to the high incidence of TB as well as the uniform ethnicity, SES and low prevalence of HIV (1). This is due to the following reasons:
Uniform ethnicity and SES status are important in disease association studies, as it removes some of the confounding variables.
Low prevalence of HIV is important because in the presence of HIV infection, an individual has a greatly increased chance of progressing to TB disease once infected, simply because of their impaired immune system, and not necessarily because of their genetic susceptibility.
The definition for TB diagnosis and recruitment of appropriate controls for infectious diseases such as TB has been shown to be important in the interpretation of GWAS results (48). Therefore, the TB patients in this study were identified through bacteriological confirmation (smear positive and/or culture positive). Controls were selected from the same community living under the same conditions including SES status and availability of health facilities. These healthy individuals had no previous history of TB disease or treatment. Approval from the Ethics Committee of the Faculty of Health Sciences, Stellenbosch University (project number 95/072) was obtained before blood samples were collected with informed consent, and known HIV-positive individuals were excluded from the study.
The study samples were genotyped on the Affymetrix 500 K chip and SNP calling was done as described by De Wit et al. (21). Quality-control filters were applied to 797 cases and 91 controls. A total of 6450 SNPs failed the minor allele frequency (MAF < 1%) and missingness test (GENO > 0.05), as well as the HWE test in controls (alpha level 0.0001). We retained 390 887 SNPs for 888 individuals (381 558 autosomal SNPs; 797 cases and 91controls; 489 males of which 444 are cases and 45 controls). Further relatedness analysis using PLINK (49) was conducted and resulted in the removal of 155 related individuals, producing a dataset suitable for methods that assume independent samples. It has 390 887 SNPs for 733 individuals (381 558 autosomal SNPs, 642 cases and 91 controls; 406 males of which 361 are cases and 45 controls). The resulting cases and controls can provide the same amount of power in detecting the association signal as 159 cases and 159 controls. To further check the homogeneity of the samples, we additionally performed the identity-by-state (IBS) permutation test, where case–control labels were permuted, and then recalculated between group metrics based on the average IBS (fixed 10 000 permutations).
Imputation of missing genotypes
To account for the population structure in the admixed SAC in imputing the untyped genotypes, we considered the imputation model based on population genetic parameters in the coalescent framework implemented in IMPUTE2 (26). Exploring the advantage of the model in IMPUTE2, we combined all available reference-phased haplotype data from both release 2 of the HapMap 3 dataset (NCBI Build 36) (includes Utah residents (CEPH) with Northern and Western European ancestry (CEU), Japanese in Toyko (JPT), Chinese in Denver, Maasai in Kinyawa, Toscani in Italia (TSI), GIH, African Ancestry in Southwest (ASW), Luhya in Webuye (LWK), Mexican Ancestry in Los Angeles (MEX), Han Chinese in Beijing (CHB) and Yoruba in Ibadan (YRI); and 1000 Genomes Project (28) includes CEU, YRI, British from England and Scotland (GBR), Finnish from Finland (FIN), Han Chinese South (CHS), Puerto Rican (PUR), Chinese in Denver (CHB), JPT, LWK, MXL, ASW, TSI, Colombian in Medellin (CLM) and Iberian populations in Spain (IBS). We decided to impute SNPs by splitting each chromosome into 5 Mb regions for analysis by IMPUTE2. On both resulting imputed datasets, post-imputation quality controls were similarly conducted in order to account for imputation uncertainty.
Admixture estimation and principal component analysis
For admixture analysis in the SAC, we included a total of 25 unrelated SAN (5 samples of Ju|'hoan from HGDP) and 20 Ju|'hoan samples obtained from Schlebusch et al. (50), and genome-wide SNP data of four populations from the International HapMap 3 project (27), including European (CEU), Yoruba (YRI), Gujarati Indians (GIH) and Chinese and Japanese (CHB + JPT) (Supplementary Material, Table S7). We performed the quality-control filters on each population separately. After the quality-control filter checks, the resulting merged dataset of the SAC within its five putative ancestral populations had 272 798 autosomal SNPs. We additionally removed 37 556 A/T and C/G and 6176 sex SNPs from the merged dataset that contained 272 798 autosomal SNPs, resulting in a dataset of 229 076 SNPs. We additionally remove each SNP that has an LD r2 value of >0.1 with any other SNP within a 50-SNP sliding window (advanced by 10 SNPs at a time). We finally obtained the subset of unlinked SNPs (n = 49930). We then applied the algorithm implemented in ADMIXTURE (51) to determine the individual admixture proportion in the SAC data and in both case–control only data of the SAC. Supplementary Material, Figure S6 (A and B) and Table S3 show that genome-wide ancestry varies widely across SAC individuals, SAN (33 ± 1%), YRI (28 ± 2%), CEU (19 ± 1%), GIH (13 ± 0.9%) and CHB + JPT (7 ± 0.5%). To evaluate the extent of substructure in the SAC (separating cases and controls as distinct groups) and examine whether stratification can be accounted for in the GWAS, the smartpca programme in the EIGENSOFT package (52,53) was applied to the merged data of the 888 SAC samples (also case-only and control-only) and its five ancestral populations (Supplementary Material, Fig. S6C) on autosomal SNPs and SNPs on the X chromosome (Supplementary Material, Fig. S6D). We additionally regressed case–control status from autosomal SNPs against the two first principal components in order to quantify the difference in genetic ancestry between the SAC's case–control individuals. We obtained significant P-values = 3.7e−06 and 0.002 respectively. Insignificant P-values of 0.332 and 0.317 were obtained from the same analysis applied to the X chromosome. The greatest genetic differentiation between the five proxy ancestral groups and the SAC is in the convex hull of the three non-African populations (GIH, CEU and JPT–CHB) and the two African populations (SAN, YRI). The pair-wise genetic distance between the SAC and each of its reference ancestral populations is also provided in Supplementary Material, Table S7. Of note, the first principal component differentiates the SAC cases and controls. Most of the TB cases are pooled towards African ancestry and controls towards non-African ancestry. This provides evidence of significant differences in genetic ancestry between cases and controls in the SAC data consistent with the result in Table 3. In addition, Supplementary Material, Figure S6D (on X chromosome) shows a strong genetic differentiation between SAN and other ancestral components in the SAC, including non-Africans and African Bantu. This indicates a high genetic contribution from SAN-related ancestral populations on the X chromosome.
Association test and meta-analyses
The association testing was performed on the full dataset of 888 individuals, which contained related individuals. To account for both population stratification and hidden relatedness that can result from the genealogy, we applied EMMAX (29), which corrects for these relationships during the association mapping. We first applied EMMAX-kin to compute a pair-wise relatedness matrix from our dataset, which represents the structure of our samples. EMMAX estimated the contribution of the sample structure to the TB phenotype using a variance component model, resulting in an estimated covariance matrix of phenotype that models the effect of genetic relatedness on the TB phenotype. We ran EMMAX on TB phenotype data using the estimated covariance matrix to detect possible association. To account for rare variants that EMMAX could not address adequately, we separately performed Fisher's exact test, which is known to be appropriate for rare SNPs. To cautiously account the lack of flexibility to handle multiple predictors, the contribution of the sample structure to the phenotype and possible inflation in using Fisher's exact test, we only apply this test to few low-frequency variants that show to be significant from the mixed models in GWAS, as this will aid in identifying artefactual associations. This is due to the imperfect asymptotic distribution of those mixed models in the case of low-frequency variants. Given m SNPs (from typed or imputed datasets) for association with TB, we expected around m × 0.05 to have P-value <0.05 in each dataset, respectively. We therefore used a genome-wide significance level of α = 0.05/2 × m.
To identify associations with small effect sizes, which the standard single GWAS could not identify, we combined two African TB genome-wide association studies (GWASs) including our GWAS, and the recently combined TB study of Ghanaian, Gambian and Malawian populations in a single GWAS analysis. A fixed-effects model (33) based on the inverse-variance-weighted effect size was used to combine the results (log-odds ratio and standard error) from typed GWAS and two imputation GWASs (imputation based on both the data from HapMap 3 and the 1000 Genomes Project, including the non-pseudoautosomal region (nonPAR) and two pseudoautosomal regions (PAR1 and PAR2) of X chromosome) from the SAC and WTCCC-TB results (SAC-TB and Davila et al. are found in Supplementary Methods). We additionally applied random- and binary-effects models described in the MetaSoft program (33), and we used the study P-values, the M-values (the posterior probability that the effect exists in the study), the mean effect and heterogeneity statistics to interpret the association results showing high heterogeneity (33).
Power to replicate previous findings
We calculated the power to replicate each published TB SNP in the current case–control study based on the published odds ratios and study minor allele frequencies. The power calculation was carried out using the model implemented in Purcell et al. (54). For each published association, we specified whether or not the published odds ratio lies within the 95% CI estimated in the current SAC dataset. Power analysis was conducted on the basis of a disease prevalence of 0.01%, the published effect size of each SNP, the minor allelic frequency (MAF) of each SNP observed in the SAC dataset, and the sample size in the SAC dataset. Under a one-sided test, we assumed a significance level of 0.05. We set error rates at 5% for cases, based on general evidence that misdiagnosis rates are often over 5%. To detect flip-flop associations due to different LD patterns and explain the failure of replicate previous TB studies in the current SAC dataset, we specified whether or not the published odds ratio lies within the 95% CI estimated in the current SAC dataset.
Genetic ancestry and TB risk
Socio-economic questionnaires were available for 82 cases and included information on two categories of income, per week self and per week household. These incomes were estimated based on the South African Rand (R) currency. These incomes were coded as follows: 0 = <R50, 1 = R50 to R150, 2 = R150 to R300, 3 = R300 to R500, 4 = R500–1000, 5 ≥ R1000 and 9 = missing. We first computed the fraction of ancestry for each individual from five putative ancestral populations using the program ADMIXTURE (51). To have the correlation and linear regression the same, we normalized all variables to have mean 0 and variance 1, since there exists a relationship between correlation and linear regression. To address this, we subtracted each variable by mean and divided by standard deviation. We separately regressed TB status against genetic ancestry proportion from each ancestral population. We evaluate the correlation between pairs of ancestral populations. To control the correlation between genetic ancestry in the SAC which can be potentially confounded, we test for the difference in TB risk (conditional risk) between pairs of ancestral populations.
Suppose βk and ɛk are the effect size and standard error from the regression model of the fraction of ancestry k in the admixed population against TB binary trait, respectively. To test for the difference in TB risk between a pair of ancestral populations k and l, we had to adapt the normal test statistic under the null hypothesis of no difference in risk between the two ancestral populations. Thus, we computed the Z-score of difference in risk, Zkl = (βk−βl)/sqrt(+), (k≠l) which has a standard normal distribution Zkl ∼ N(0,1). We computed the probability, (two-sided P = 2*(1 − P(<|Zkl|)) that the value may be less than the Z-score. To account for the correlation among ancestry proportions in the admixed population, we first conducted a permutation test, whereby the above distribution of the test statistic under the null hypothesis is re-sampled 10 000 times under rearrangements of the case–control status. In addition, we adjusted for the covariance by computing covkl = ρkl.ɛk .ɛl where ρkl is the correlation of the fraction of ancestry from ancestral population k and l. We derived the corrected test statistic by subtracting out 2*covkl. Thus, the above test is applied between pairs (and triplets) of ancestral populations, each African/non-African ancestral groups conditional on non-African/African ancestral groups.
We additionally computed the correlation between TB-ancestry and ancestry-SES, and because we have socio-economic data only for TB cases, we regressed SES against genetic ancestry. Naturally this sample size may not provide sufficient power to identify correlations. Fortunately, because of the uniform ethnicity, SES status where the SAC's case/control sampling were conducted (Materials and Methods), we derived the relationship between TB status and SES based on the correlations (a 95% CI on the correlation of ancestry and SES) obtained from TB-ancestry and ancestry-SES models.
Assessing locus-specific ancestry in multi-way admixed population
GWAS of admixed populations, including admixture mapping was recently proposed to be informative for diseases for which the risk differs depending on the ancestry (1,3). These recent methods involve joint modeling of the admixture (accounting for locus-specific ancestry) and SNP association signals. From the simulation framework described in Supplementary Methods, we first used the simulated five-way admixed population data to assess the accuracy of the local ancestry algorithms WinPOP and Lamp-LD. We computed the correlation between inferred local ancestry Y and the true ancestry Z. To estimate this correlation, we computed an estimate of the expected squared correlation between Y and Z as in (55). Given an ancestral population k, the expected squared correlation between Y and Z is a ratio of the expected covariance of Y and Z and the product of the expected variance of both Y and Z taken over loci and individuals:
 |
In addition, based on the true Z and inferred Y local ancestry, we compute the rate of calling true ancestry among different populations. Given a true ancestral segment of length  (
( is the total number of true ancestral alleles) derived from population
  along the simulated genome of the admixed population, we computed the distribution of the rate of calling true ancestry
  and the error rate of calling
  ancestral population instead of k as
 |
where  is the number of inferred ancestral alleles from ancestral population
 . We obtain the rate of calling true ancestry by summing over all loci and averaging over all individuals.
Mendelian inconsistencies in local ancestry vary substantially across the genome and are mostly consistent with genomic regions with large deviations in local ancestry (45,46). Such genomic regions may lead to false-positive associations in scans of local ancestry across the genome (e.g. case-only admixture mapping). Assessing local ancestry using simulation may not measure systematic inaccuracies arising from the violations of model assumptions such as modelling of random mating, number of generations since admixed occurred and recombination rate (45,46). We conducted a real data-based evaluation of local ancestry using the SAC population. We evaluated the extent of spurious deviations in average local ancestry from case and control samples of the SAC. To address this, we subtracted the inferred average locus-specific ancestry by the corresponding genome-wide average ancestry; this later is approximated as a normal distribution under neutral drift with mean 0 and empirical variance. We fitted a chi-square on the obtained normal distribution (Supplementary Methods Text 2) to test for spurious deviations in average local ancestry. We compare these deviations in case and control samples of the SAC.
SUPPLEMENTARY MATERIAL
FUNDING
This project was supported by a Carnegie Corporation Grant, by the Department of Clinical Laboratory Sciences, University of Cape Town and by NIH grant R01 HG006399 (N.Z. and A.L.P.).
Supplementary Material
ACKNOWLEDGEMENTS
We are grateful to all the participants in the study. We thank C. Seioghe, N. Patterson and B. Pasaniuc for helpful discussions.
Conflict of Interest statement. The authors declare no conflict of interest.
REFERENCES
- 1.World Health Organization. http://www.who.int/gtb/publications/globrep00/PDF/GTBR2000annex4.pdf .
- 2.Kaufmann S., McMichael A. Annulling a dangerous liaison: vaccination strategies against AIDS and tuberculosis. Nat. Med. 2005;11:33–44. doi: 10.1038/nm1221. [DOI] [PMC free article] [PubMed] [Google Scholar]
- 3.Dye C., Garnett G.P., Sleeman K., Williams B.G. Prospects for worldwide tuberculosis control under the WHO DOTS strategy. Directly observed short-course therapy. Lancet. 1998;352:1886–1891. doi: 10.1016/s0140-6736(98)03199-7. [DOI] [PubMed] [Google Scholar]
- 4.Dye C., Scheele S., Dolin P., Pathania V., Raviglione M.C. Global burden of tuberculosis. Estimated incidence, prevalence, and mortality by country. JAMA. 1999;282:677–686. doi: 10.1001/jama.282.7.677. [DOI] [PubMed] [Google Scholar]
- 5.Comstock G.W. Tuberculosis in twins, a re-analysis of the Prophit survey. Am. Rev. Respir. Dis. 1978;117:621–624. doi: 10.1164/arrd.1978.117.4.621. [DOI] [PubMed] [Google Scholar]
- 6.Ducati R.G., Ruffino-Netto A., Basso L.A., Santos D.S. The resumption of consumption a review on tuberculosis. Mem. Inst. 2006;101:697–714. doi: 10.1590/s0074-02762006000700001. [DOI] [PubMed] [Google Scholar]
- 7.Daniel T.M. Captain of death, the story of tuberculosis. Rochester, NY: University of Rochester Press; 1997. [Google Scholar]
- 8.Sorensen T.I., Nielsen G.G., Andersen P.K., Teasdale T.W. Genetic and environmental influences on premature death in adult adoptees. New Engl. J. Med. 1988;318:727–732. doi: 10.1056/NEJM198803243181202. [DOI] [PubMed] [Google Scholar]
- 9.Flynn J. Lessons from experimental Mycobacterium tuberculosis infections. Microbes Infect. 2006;8:1179–1188. doi: 10.1016/j.micinf.2005.10.033. [DOI] [PubMed] [Google Scholar]
- 10.Moller M., Nebel A., Valentonyte R., van Helden P.D., Schreiber S., Hoal E.G. Investigation of chromosome 17 candidate genes in susceptibility to TB in a South African population. Tuberculosis. 2009;89:189–194. doi: 10.1016/j.tube.2008.10.001. [DOI] [PubMed] [Google Scholar]
- 11.Moller M., Hoal E.G. Current findings, challenges and novel approaches in human genetic susceptibility to tuberculosis. Tuberculosis. 2010a;90:71–83. doi: 10.1016/j.tube.2010.02.002. [DOI] [PubMed] [Google Scholar]
- 12.Davila S., Hibberd M.L., Hari Dass R., Wong H.E.E., Sahiratmadja E., Bonnard C., Alisjahbana B., Szeszko J.S., Balabanova Y., Drobniewski F., van Crevel R., van de Vosse E., Nejentsev S., Ottenhoff T.H.M., Seielstad M. Genetic association and expression studies indicate a role of Toll-like receptor 8 in pulmonary tuberculosis. PLoS Genet. 2008;4:e1000218. doi: 10.1371/journal.pgen.1000218. [DOI] [PMC free article] [PubMed] [Google Scholar]
- 13.Thye T., Vannberg F.O., Wong S.H., Owusu-Dabo E., Osei I., Gyapong J., Sirugo G., SisayJoof F., Enimil A., Chinbuah M.A., Floyd S., Warndorff D.K., Sichali L., Malema S., Crampin A.C., Ngwira B., Teo Y.Y., Small K., Rockett K., Kwiatkowski D., Fine P.E., Hill P.C., Newport M., Lienhardt C., Adegbola R.A., Corrah T., Ziegler A., Morris A.P., Meyer C.G., Horstmann R.D., Hill A.V.S. African TB Genetics Consortium, The Wellcome Trust Case Control Consortium. Genome-wide association analyses identifies a susceptibility locus for tuberculosis on chromosome 18q11.2. Nat. Genet. 2010;42:9. doi: 10.1038/ng.639. [DOI] [PMC free article] [PubMed] [Google Scholar]
- 14.Thye T., Owusu-Dabo E., Vannberg F.O., Crevel R.V., Curtis J., Sahiratmadja E., Balabanova Y., Ehmen C., Muntau B., Ruge G., Sievertsen J., Gyapong J., Nikolayevskyy V., Hill P.C., Sirugo G., Drobniewsk F., de Vosse E.V., Newport M., Alisjahbana B., Nejentsev S., Ottenhoff T.H.M., Hill A.V.S., Horstmann R.D., Meyer C.G. Common variants at 11p13 are associated with susceptibility to tuberculosis. Nat. Genet. 2012;44:3. doi: 10.1038/ng.1080. [DOI] [PMC free article] [PubMed] [Google Scholar]
- 15.Dai Y., Zhang X., Pan H., Tang S., Shen H., Wang J. Fine mapping of genetic polymorphisms of pulmonary tuberculosis within chromosome 18q11.2 in the Chinese population: a case–control study. BMC Infect. Dis. 2011;11:282. doi: 10.1186/1471-2334-11-282. [DOI] [PMC free article] [PubMed] [Google Scholar]
- 16.Wang X., Leung-Sang N.T., Chiu C.L., Kam K.M., Yew W.W., Ming C.T., Chan C.Y. Association of polymorphisms in the Chr18q11.2 locus with tuberculosis in Chinese population. Hum. Genet. 2013;132:691–695. doi: 10.1007/s00439-013-1282-7. [DOI] [PubMed] [Google Scholar]
- 17.Small P.M. Tuberculosis research. Balancing the portfolio. JAMA. 1996;276:1512–1513. [PubMed] [Google Scholar]
- 18.Kumar R., Seibold M.A., Aldrich M.C., Keoki Williams L., Reiner A.P., Colangelo L., Galanter J., Gignoux C., Hu D., Sen S., Choudhry S., Peterson E.L., Rodriguez-Santana J., Rodriguez-Cintron W., Nalls M.A., Leak T.S., O'Meara E., Meibohm B., Kritchevsky S.B., Li R., Harris T.B., Nickerson D.A., Fornage M., Enright P., Ziv E., Smith L.J., Liu K., Burchard E.G. Genetic ancestry in lung-function predictions. N Engl. J. Med. 2010;363:321–330. doi: 10.1056/NEJMoa0907897. [DOI] [PMC free article] [PubMed] [Google Scholar]
- 19.Hoal E.G., Lewis L.A., Jamieson S.E., Tanzer F., Rossouw M., et al. SLC11A1 (NRAMP1) but not SLC11A2 (NRAMP2) polymorphisms are associated with susceptibility to tuberculosis in a high-incidence community in South Africa. Int. J. Tuberc. Lung Dis. 2004;8:1464–1471. [PubMed] [Google Scholar]
- 20.Moller M., de Wit E., Hoal E.G. Past, present and future directions in human genetic susceptibility to tuberculosis. FEMS Immunol. Med. Microbiol. 2010b;58:3–26. doi: 10.1111/j.1574-695X.2009.00600.x. [DOI] [PubMed] [Google Scholar]
- 21.de Wit E., Delport W., Chimusa R.E., Meintjes A., Moller M., et al. Genome-wide analysis of the structure of the South African Coloured population in the Western Cape. Hum. Genet. 2010a;128:145–153. doi: 10.1007/s00439-010-0836-1. [DOI] [PubMed] [Google Scholar]
- 22.Quintana-Murci L., Harmant C., Quach H., Balanovsky O., Zaporozhchenko V., et al. Strong maternal Khoisan contribution to the South African Coloured population: a case of gender-biased admixture. Am. J. Hum. Genet. 2010;86:611–620. doi: 10.1016/j.ajhg.2010.02.014. [DOI] [PMC free article] [PubMed] [Google Scholar]
- 23.Patterson N., Desiree Petersen C., Richard van der Ross E., Sudoyo H., Glashoff R.H., Marzuki S., Reich D., Hayes V.M. Genetic structure of a unique admixed population: implications for medical research. Hum. Mol. Genet. 2009. doi:10.1093/hmg/ddp505. [DOI] [PubMed] [Google Scholar]
- 24.Tishkoff S.A., Reed F.A., Friedlaender F.R., Ehret C., Ranciaro A., et al. The Genetic Structure and History of Africans and African Americans. Science. 2009;324:1035–1044. doi: 10.1126/science.1172257. [DOI] [PMC free article] [PubMed] [Google Scholar]
- 25.Florez J.C., Price A., Campbell D., Riba L., Parra M.V., Yu F., Duque C., Saxena R., Gallego N., Tello-Ruiz M., Franco L., Rodríguez-Torres M., illegas V.A., Bedoya G., Aguilar-Salinas C.A., Tusié-Luna M.T., Ruiz-Linares A., Reich D. Strong association of socioeconomic status with genetic ancestry in Latinos: implications for admixture studies of type 2 diabetes. Diabetologia. 2009;52:1528–1536. doi: 10.1007/s00125-009-1412-x. [DOI] [PMC free article] [PubMed] [Google Scholar]
- 26.Marchini J., Howie B. Comparing algorithms for genotype imputation. Am. J. Hum. Genet. 2008;83:535–540. doi: 10.1016/j.ajhg.2008.09.007. [DOI] [PMC free article] [PubMed] [Google Scholar]
- 27.The International HapMap 3 Consortium. Integrating common and rare genetic variation in diverse human populations. Nature. 2010;467:52–58. doi: 10.1038/nature09298. [DOI] [PMC free article] [PubMed] [Google Scholar]
- 28.McVean G.A., Altshuler D.M., Durbin R.M., Abecasis G.A., Bentley D.R., Chakravarti A., Clark A.G., Donnelly P., et al. An integrated map of genetic variation from 1092 human genomes. Nature. 2012;491:56–65. doi: 10.1038/nature11632. [DOI] [PMC free article] [PubMed] [Google Scholar]
- 29.Kang H.M., Sul J.H., Service S.K., Zaitlen N.A., Kong S.-y., Freimer N.B., Sabatti C., Eskin E. Variance component model to account for sample structure in genome-wide association studies. Nat. Genet. 2010;42:348–354. doi: 10.1038/ng.548. [DOI] [PMC free article] [PubMed] [Google Scholar]
- 30.Devlin B., Roeder K. Genomic Control for Association Studies. Biometrics. 1999;55:997–1004. doi: 10.1111/j.0006-341x.1999.00997.x. [DOI] [PubMed] [Google Scholar]
- 31.Hokayem J.E., Huber C., Couvé A., Aziza J., Baujat G., Bouvier R., Cavalcanti D.P., Collins F.A., Cordier M.P., Delezoide A.L., Gonzales M., Johnson D., Le Merrer M., Levy-Mozziconacci A., Loget P., Martin-Coignard D., Martinovic J., Mortier G.R., Marie-José P., Roume J., Scarano G., Munnich A., Cormier-Daire V. NEK1 and DYNC2H1 are both involved in short rib polydactyly Majewski type but not in Beemer Langer cases. J. Med. Genet. 2012;49:227–233. doi: 10.1136/jmedgenet-2011-100717. [DOI] [PubMed] [Google Scholar]
- 32.Rauscher F.J. The WT1 Wilms tumor gene product: a developmentally regulated transcription factor in the kidney that functions as a tumor suppressor. FASEB J. 1993;7:896–903. [PubMed] [Google Scholar]
- 33.Buhm H., Eskin E. Random-effects model aimed at discovering associations in meta-analysis of genome-wide Association Studies. Am. J. Hum. Genet. 2011;88:586–598. doi: 10.1016/j.ajhg.2011.04.014. [DOI] [PMC free article] [PubMed] [Google Scholar]
- 34.Wu Y., Waite L.L., Jackson A.U., Sheu W.H.-H., Buyske S., et al. Trans-ethnic fine-mapping of lipid loci identifies population-specific signals and allelic heterogeneity that increases the trait variance explained. PLoS Genet. 2013;9:e1003379. doi: 10.1371/journal.pgen.1003379. [DOI] [PMC free article] [PubMed] [Google Scholar]
- 35.Jimenez-Corona ME., Garcia-Garcia L., Deriemer K., Ferreyra-Reyes L., Bobadilla-del-Valle M., Cano-Arellano B., Canizales-Quintero S., Martinez-Gamboa A., Small PM., Sifuentes-Osornio J., Ponce-de-Leon A. Gender differentials of pulmonary tuberculosis transmission and reactivation in an endemic area. Thorax. 2006;61:348–353. doi: 10.1136/thx.2005.049452. [DOI] [PMC free article] [PubMed] [Google Scholar]
- 36.Reaching the poor: challenges for tuberculosis programmes in the Western Pacific Region. WHO Regional Office for the Western Pacific; 2004. 2004. [Google Scholar]
- 37.2005. 30 Gender-based analysis of tuberculosis-related data and other information Office of the WHO Representative in Vietnam.
- 38.de Wit E., van der Merwe L., van Helden P.D., Hoal E.G. Gene-gene interaction between tuberculosis candidate genes in a South African population. Springer Science, Business Media; 2010b. LLC 2010, DOI 10.1007/s00335-010-9280-8. [DOI] [PubMed] [Google Scholar]
- 39.Rodriguez J., Bercovici S., Elmore M., Batzoglou S. Ancestry inference in complex admixtures via variable-length Markov chain linkage models. J. Comput. Biol. 2012;20:199–211. doi: 10.1089/cmb.2012.0088. [DOI] [PMC free article] [PubMed] [Google Scholar]
- 40.Brisbin A. Linkage Analysis for Categorical Traits and Ancestry Assignment in Admixed Individuals. Ithaca, New York: Doctoral Dissertation, Cornell University; 2010. [Google Scholar]
- 41.Churchhouse C., Marchini J. Multiway admixture deconvolution using phased or unphased ancestral panels. Genet. Epidemiol. 2012;37:1–12. doi: 10.1002/gepi.21692. [DOI] [PubMed] [Google Scholar]
- 42.Lawson D., Hellenthal G., Myers S., Falush D. Inference of population structure using dense haplotype data. PLoS Genet. 2010;8:e1002453. doi: 10.1371/journal.pgen.1002453. [DOI] [PMC free article] [PubMed] [Google Scholar]
- 43.Pasaniuc B., Sankararaman S., Kimmel G., Halperin E. Inference of locus-specific ancestry in closely related population. Bioinformatics. 2009;25:213–221. doi: 10.1093/bioinformatics/btp197. [DOI] [PMC free article] [PubMed] [Google Scholar]
- 44.Baran Y., Pasaniuc B., Sankararaman S., Dara G., Gignoux C., Celeste C., Torgerson W., Chapela R., JeanFord G., Pedro Avila C., Rodriguez-Santana J., Gonzalez Burchard E., Eran E. Fast and accurate inference of local ancestry in Latino populations. Bioinformatics. 2012;28:1359–1367. doi: 10.1093/bioinformatics/bts144. [DOI] [PMC free article] [PubMed] [Google Scholar]
- 45.Pasaniuc B., Sankararaman S., Torgerson D.G., Gignoux C., Zaitlen N., Eng C., Rodriguez-Cintron W., Chapela R., Ford J.G., Avila P.C., Rodriguez-Santana J., Chen G.K., Le Larchand L., Henderson B., Reich D., Haiman C.A., Burchard E.G., Halperin E. Analysis of Latino populations from GALA and MEC studies reveals genomic loci with biased local ancestry estimation. Bioinformatics. 2013;29:1407–1415. doi: 10.1093/bioinformatics/btt166. [DOI] [PMC free article] [PubMed] [Google Scholar]
- 46.Seldin M.F., Pasaniuc B., Price A. New approaches to disease mapping in admixed populations. Nat. Rev. Genet. 2011;36:21–27. doi: 10.1038/nrg3002. [DOI] [PMC free article] [PubMed] [Google Scholar]
- 47.Band G., Le Q.S., Jostins L., Pirinen M., Kivinen K., Jallow M., Sisay-Joof F., Bojang K., Pinder M., Sirugo G., Conway D.J., Nyirongo V., Kachala D., Molyneux M., Taylor T., Ndila C., Peshu N., Marsh K., Williams T.N., Alcock D., Andrews R., Edkins S., Gray E., Hubbart C., Jeffreys A., Rowlands K., Schuldt K., Clark T.G., Small K.S., Teo Y.Y., Kwiatkowski D.P., Rockett K.A., Barrett J.C., Spencer C.C. Imputation-based meta-analysis of severe malaria in three African populations. Plos Genet. 2013;9:e1003509. doi: 10.1371/journal.pgen.1003509. [DOI] [PMC free article] [PubMed] [Google Scholar]
- 48.Stein C.M. Genetic epidemiology of tuberculosis susceptibility: impact of study design. PLoS Pathog. 2011;7:e1001189. doi: 10.1371/journal.ppat.1001189. [DOI] [PMC free article] [PubMed] [Google Scholar]
- 49.Purcell S., Neale B., Todd-Brown K., Thomas L., Ferreira M.A., Bender D., Maller J., Sklar P., de Bakker P.I., Daly M.J., Sham P.C. PLINK: a tool set for whole-genome association and population-based linkage analyses. Am. J. Hum. Genet. 2007;81:559–575. doi: 10.1086/519795. [DOI] [PMC free article] [PubMed] [Google Scholar]
- 50.Schlebusch C., Skoglund P., Sjodin P., Gattepaille L., Hernandez D., et al. Genomic variation in seven Khoe-San groups reveals adaptation and complex African history. Science. 2012;338:374–379. doi: 10.1126/science.1227721. [DOI] [PMC free article] [PubMed] [Google Scholar]
- 51.Alexander D.H., Novembre J., Lange K. Fast model-based estimation of ancestry in unrelated individuals. Genome Res. 2009;19:1655–1664. doi: 10.1101/gr.094052.109. [DOI] [PMC free article] [PubMed] [Google Scholar]
- 52.Price A., Patterson N.J., Plenge R.M., Weinblatt M.E., Shadick N.A., Reich D. Principal components analysis corrects for stratification in genome-wide association studies. Nat. Genet. 2006;38:904–909. doi: 10.1038/ng1847. [DOI] [PubMed] [Google Scholar]
- 53.Patterson N., Price A.L., Reich D. Population structure and eigen analysis. PLoS Genet. 2006;2:e190. doi: 10.1371/journal.pgen.0020190. [DOI] [PMC free article] [PubMed] [Google Scholar]
- 54.Purcell S., Cherny S.S., Sham P.C. Genetic power calculator: design of linkage and association genetic mapping studies of complex traits. Bioinformatics. 2003;19:149–150. doi: 10.1093/bioinformatics/19.1.149. [DOI] [PubMed] [Google Scholar]
- 55.Price A., Tandon A., Patterson N., Barnes K., Rafaels N., et al. Sensitive detection of chromosomal segments of distinct ancestry in admixed populations. PLos Genet. 2009:e1000519. doi: 10.1371/journal.pgen.1000519. [DOI] [PMC free article] [PubMed] [Google Scholar]
Associated Data
This section collects any data citations, data availability statements, or supplementary materials included in this article.