

Abstract
Modulations of occipito-parietal α-band (8–14 Hz) power that are opposite in direction (α-enhancement vs. α-suppression) and origin of generation (ipsilateral vs. contralateral to the locus of attention) are a robust correlate of anticipatory visuospatial attention. Yet, the neural generators of these α-band modulations, their interdependence across homotopic areas, and their respective contribution to subsequent perception remain unclear. To shed light on these questions, we employed magnetoencephalography, while human volunteers performed a spatially cued detection task. Replicating previous findings, we found α-power enhancement ipsilateral to the attended hemifield and contralateral α-suppression over occipito-parietal sensors. Source localization (beamforming) analysis showed that α-enhancement and suppression were generated in 2 distinct brain regions, located in the dorsal and ventral visual streams, respectively. Moreover, α-enhancement and suppression showed different dynamics and contribution to perception. In contrast to the initial and transient dorsal α-enhancement, α-suppression in ventro-lateral occipital cortex was sustained and influenced subsequent target detection. This anticipatory biasing of ventro-lateral extrastriate α-activity probably reflects increased receptivity in the brain region specialized in processing upcoming target features. Our results add to current models on the role of α-oscillations in attention orienting by showing that α-enhancement and suppression can be dissociated in time, space, and perceptual relevance.
Keywords: alpha, beamforming, brain oscillations, magnetoencephalography, spatial orienting
Introduction
A modulation of α-band (8–14 Hz) amplitude over occipito-parietal sites is a robust oscillatory correlate of anticipatory visuospatial attention (Foxe and Snyder 2011). This modulation consists of the lateralization of α-power in accordance with the locus of attention, that is, of either α-suppression in the hemisphere contralateral to the attended visual field (Sauseng et al. 2005; Thut et al. 2006; Kelly et al. 2009; Gould et al. 2011), ipsilateral α-increase (Worden et al. 2000; Kelly et al. 2006; Rihs et al. 2007), or both (Yamagishi et al. 2003; Siegel et al. 2008; Rihs et al. 2009; Handel et al. 2011). In addition to being modulated by attention, α-activity causally shapes upcoming perception as indicated by parietal α-entrainment through α-transcranial magnetic stimulation (Romei et al. 2010; Thut, Schyns, et al. 2011; Thut, Veniero, et al. 2011), extending previous findings of an inverse relationship between occipito-parietal α-power and target perception (Ergenoglu et al. 2004; Hanslmayr et al. 2007; van Dijk et al. 2008; Yamagishi et al. 2008; Kelly et al. 2009) and in line with the view that α-power indexes cortical excitability (Pfurtscheller 2001; Ploner et al. 2006; Romei, Rihs, et al. 2008; Romei, Brodbeck, et al. 2008). These and related findings led to the current models of α-oscillations (Klimesch et al. 2007; Jensen and Mazaheri 2010; Foxe and Snyder 2011), which tend to emphasize its inhibitory role, for example, α-power enhancement serving the active inhibition of task-irrelevant information, but which also imply that α-suppression can serve facilitation by a release from inhibition.
While α-power changes by visuospatial attention are a robust finding, several important questions remain. First, because previous studies have often been restricted to the sensor level, the exact generators of attention-related α-modulations are unknown. This activity may originate from attention areas of the dorsal stream, from more ventral occipital regions specialized in processing visual target (or distracter) features, or both (Yamagishi et al. 2003; Siegel et al. 2008; Snyder and Foxe 2010). In other sensory modalities, recent magnetoencephalography (MEG) studies have indeed shown that α-band modulations induced by anticipatory spatial attention are generated by cortical regions specialized in processing target stimuli, either auditory (Muller and Weisz 2012) or somatosensory (Haegens et al. 2011). Secondly, the interplay between contralateral α-suppression and ipsilateral α-increase is unclear. On the one hand, these antipodal changes may reflect concomitant, homotopic facilitatory versus inhibitory processes in attention (Thut et al. 2006; Romei et al. 2010) akin to previously reported interhemispheric parietal push–pull mechanisms (e.g., Hilgetag et al. 2001). On the other hand, there is evidence that facilitatory and inhibitory processes in attention may be independent, because they are differentially affected by aging and experimental manipulation (Gazzaley et al. 2005; Rissman et al. 2009). Thirdly, it is unclear to what extent the respective posterior α-generators contribute to perceptual performance. With a push–pull mechanism, a lateralization index calculated across homotopic areas should best predict perception, whereas lower-level areas closer to input may be better predictors with independent mechanisms.
Here, we addressed these 3 questions by employing source-level analysis based on MEG and a probabilistic spatial cueing paradigm (Posner 1980). Our results provide novel insights into the existing literature by showing that 1) ipsilateral α-enhancement and contralateral α-suppression induced by anticipatory visuospatial attention are generated by 2 dissociated brain regions, along the dorsal and ventral visual pathways, respectively, 2) both α-band modulations show characteristic temporal dynamics and independent contributions to perception, and 3) perceptual performance is, in general, best predicted by the prestimulus α-activity in specialized visual cortex contralateral to the target stimulus, although perception of targets at unattended locations rather seems to engage a push–pull mechanism between hemispheres.
Materials and Methods
Participants
Ten right-handed, healthy volunteers with normal or corrected-to-normal vision participated in the study (5 males; age range 26–35 years). All participants provided informed written consent and received monetary compensation for their participation. The study was approved by the local ethics committee (University of Glasgow, Faculty of Information and Mathematical Sciences) and conducted in conformity with the declaration of Helsinki.
Task and Stimuli
Participants performed a spatially cued detection task of near-threshold visual stimuli (Posner 1980; Wyart and Tallon-Baudry 2008). Each trial started with the presentation of a fixation cross. After a variable delay of 0.6–1 s, a central cue was presented, pointing to either the left or the right lower quadrant of the projection screen. Participants were instructed to covertly pay attention to the cued location while maintaining central fixation. After a random delay of 0.6–1 s, a target numeral was presented at near-threshold contrast either in the cued (valid cue; 0.7 probability) or in the un-cued location (invalid cue; 0.3 probability) for 50 ms. Sensory awareness to the target was measured following each trial. First, participants were asked to report the subjective awareness of the target (seen/not-seen). Then, participants performed an objective task consisting in a forced-choice comparison of the target with the number 5 (Del Cul et al. 2007; Fig. 1).
Figure 1.

Experimental design. Each trial started with a fixation cross displayed at the center of the screen. After a random delay, a central cue informed the subjects about the most probable location of the upcoming target stimulus (0.7–0.3 validity). Participants were instructed to covertly pay attention to the cued quadrant. After a variable delay, a digit target was presented at either above- or below- threshold contrast for 50 ms. Participants were asked to report the sensory awareness of the target (subjective task), as well as to perform a forced-choice comparison of the target with the number 5 (objective task).
Stimuli were presented through a DLP projector (PT-D7700E-K, Panasonic) placed outside the shielded room onto a screen situated 1.90 m away from the participants via an in-room mirror. All stimuli were generated off-line using Matlab 7.5 (The MathWorks) and were presented using Psychtoolbox (Brainard 1997) on a gray background. The fixation cross was presented at the center of the screen and subtended 1.5 × 1° of visual angle. Spatial cues were created by appending an arrow (0.5 × 0.3°) to either the left or the right lower corner of the fixation cross. The direction (0.5 probability for left and right), as well as the validity of the cue (0.7 probability for valid and 0.3 probability for invalid), was randomly selected in each trial. Target stimuli consisted of numerals from 1 to 9, excluding 5. Stimulus contrast was adjusted for each participant in a calibration session, as explained in more detail below. Target stimuli were presented at 2 contrast levels corresponding to the 30th and the 70th percentile of each subject's psychometric function of sensory awareness, which henceforth will be referred to as the low and high-contrast conditions, respectively. Target stimuli subtended 2 × 3.2° of visual angle and were presented at 4.5° vertical and 8.5° horizontal eccentricity from fixation corresponding to the left or the right lower quadrant of the visual field. The response displays consisted of a question and 2 response alternatives. For the evaluation of subjective sensory awareness, the question asked was “visibility?” and the response alternatives were “seen”/“not seen.” Subjects were instructed to report seen whenever they saw anything on the screen, even if they were uncertain about the identity of the target numeral. For the objective measure, the question was “lower or higher than 5?” and the corresponding alternatives were “lower”/“higher.” Participants responded using 2 nonmagnetic response pads (Lumitouch). They were instructed to press with the right or left index finger according to the location (left or right) of their selected response alternative on the screen. The position (left or right) of the response alternatives randomly varied in each trial. Participants had no time limit to provide a response, and they were advised to preferably blink during this time. After a fixed delay of 0.1 s from the response, the screen turned gray for 0.5 s before the next trial's fixation cross was presented.
The experiment started with the presentation of the instructions to each participant. Subjects were informed about the brief appearance of low-contrast numbers in any of the lower quadrants of the screen. The target numerals that would be employed were shown, and participants were asked to familiarize themselves with them. Finally, subjects were informed about the spatial cueing. They were instructed to pay covert attention to the cued quadrant and informed that cues would indicate the most probable location of the forthcoming target. Subsequently, subjects performed 30 practice trials with high-contrast stimuli.
After the practice session, participants went through a calibration session to estimate each individual's psychometric function of sensory awareness. The structure of the calibration session was identical to the actual task in terms of the sequence of events, timing, and cue validity. The difference consisted in the presentation of the target stimuli within a range of contrast values, instead of 2 selected ones. The psychometric curve was estimated using the Psi method (Kontsevich and Tyler 1999) that is implemented in the Palamedes toolbox for Matlab (Prins and Kingdom 2009; http://www.palamedestoolbox.org). This method provides an adaptive estimation of both threshold and slope parameters by selecting the stimulus contrast for each trial that minimizes the expected entropy in the posterior probability distribution after that trial. Although both valid- and invalid-cued stimuli were presented, only valid trials were employed to estimate the psychometric function. The calibration session terminated after 63 valid trials (90 trials in total), lasting approximately 8–9 min.
The task session consisted of 7–10 runs, depending on each participant's performance. Each run comprised 120 trials and lasted 9–11 min. Subjects were given unlimited time to rest between runs. On average, the total duration of the task was 1.5–2 h.
Additionally, after performing the experimental task, a subgroup of subjects (5 of 10) performed 40 extra-trials with high-contrast stimuli but, this time, we asked them to overtly move their gaze to the cued location. These additional trials were subsequently used to quantify the artifact generated by eye movements.
MEG Recording
Brain activity was recorded with a 248-magnetometer whole-head MEG system (MAGNES® 3600 WH, 4-D Neuroimaging) confined to a magnetically shielded room. The MEG signal was high-pass filtered at 0.1 Hz and digitized at 508 Hz.
Before starting the recording session, 5 coils were positioned on the participant's head. These coils, together with 3 fiducial points and the subject's headshape, were digitized using a Polhemus Fastrak system. At the beginning and end of each run, the 5 coils were activated to localize the participant's head with respect to the MEG sensor array. During the recording session, subjects were seated in a reclining chair and supported their head against the back and top of the magnetometer. Some of them opted for using an additional neck support to increase their comfort. Participants were asked to remain as still as possible during the recording session and were continuously monitored by a video camera.
MEG Analysis
The analysis of the MEG signal was performed using the FieldTrip software package (Oostenveld et al. 2011; http://www.ru.nl/fcdonders/fieldtrip/) and in-house Matlab code. As explained in more detail below, MEG analysis was performed in 3 main steps. First, “preprocessing” of the MEG signal aimed at removing artifactual activity. Secondly, “sensor-level analysis” consisting of the time-frequency decomposition of the MEG data to investigate the temporo-spectral dynamics of α-band modulations and their lateralization with respect to the attended hemifield. Thirdly, “source-level analysis” aimed at identifying the neural generators underlying these α-band modulations, their temporo-spectral evolution (TSE), and finally the relationship between pretarget α-band activity in each brain source and behavioral performance (i.e., detection rate).
Preprocessing
The preprocessing of the MEG signal was performed in the following steps. First, the signal was epoched in 3.5-s trials time-locked to the cue onset. Each trial was assigned to a different condition based on the direction of the cue (i.e., left or right cue). Secondly, linear trends in the signal were removed. Thirdly, MEG traces were visually inspected for artifacts. Six excessively noisy sensors were discarded from further analysis for all subjects. Additionally, trials contaminated with signal jumps, eye blinks, or eye movements were also discarded. Given its importance for the current study, we further checked that subjects were not moving their gaze to the expected target location in the remaining “clean” trials, by comparing these with the artifact generated by overt eye movements. After the artifact rejection step, signals recorded by the MEG reference sensors were used to reduce the noise in the signal, employing the “denoise_pca” FieldTrip function. Finally, the strongest component corresponding to the cardiac artifact was projected out of the MEG signal using independent component analysis (“runica” algorithm implemented in FieldTrip/EEGLAB, http://sccn.ucsd.edu/eeglab/).
Sensor-level Analysis
Time-frequency Analysis
Although this study was focused on the oscillatory activity in a given frequency band (i.e., α-band), we performed a wide range time-frequency decomposition to obtain the general pattern of cue-related oscillatory activity and to identify the specific frequency range showing power modulations within the α-band. Time-frequency analysis was performed on synthetic planar gradients (Bastiaansen and Knosche 2000). First, the preprocessed MEG data were converted to synthetic planar gradients considering first- and second-order neighboring sensors (maximum distance of 7.4 cm) and using the “sincos” approach implemented in FieldTrip. Secondly, we performed the time-frequency decomposition per trial for the 2 components of each sensor's gradient, ranging from 2.5 to 100 Hz in 1.25-Hz steps. We employed a (multi-)taper approach with sliding time windows (Percival and Walden 1993; Mitra and Pesaran 1999), using different window lengths and tapering for lower and higher frequency bands. For the lower frequency range (2.5–30 Hz), we applied a sliding window of 400 ms in 40 ms steps and one single taper (Hanning), providing a frequency resolution of 2.5 Hz. For higher frequencies (30–100 Hz), the time window was 200 ms long and we applied 3 tapers (Slepian sequences), leading to ±10 Hz smoothing. Subsequently, the time-frequency decompositions of both the horizontal and vertical components of each sensor's planar gradient were combined by means of Pythagoras' rule. Finally, the time-frequency maps were averaged across trials and normalized by computing the relative change with respect to baseline. Baseline activity was independently calculated for each sensor and frequency bin, by averaging the power from 400- to 200-ms precue across the left- and right-cue trials, separately. Additionally, in order to estimate the time-frequency activity contralateral and ipsilateral to the attended hemifield, we constructed a mirrored version of the sensor layout. Thus, contralateral activity was represented in the right-half sensors and was computed by averaging the activity from the original sensor array of the left-cue condition with the mirrored version of the right-cue condition; and vice versa in the case of ipsilateral activity.
Moreover, we tested whether the observed time-frequency modulation of the α-band was lateralized with respect to the attended hemifield. To this end, we identified relative spatial maxima/minima in the scalp topographies and averaged the power across the groups of 4 sensors showing the maximum/minimum values. Averaging over a group of sensors aimed to minimize the effect of the different location of the MEG sensor across subjects (yet the results of the analysis on the single sensors exhibiting maximal activity yielded highly similar results). The average power of each group of sensors was compared with the average power of its homolog in the opposite hemisphere, by means of paired-samples t-tests. These statistical analyses were independently performed for the left- and right-cue conditions to test the stability of the lateralization patterns.
Time-frequency Analysis of Cue-evoked Fields
This analysis was conducted to test whether the α-band modulations obtained from the above analysis reflected induced oscillatory activity, or alternatively evoked activity. To test this, we performed a time-frequency decomposition of the event-related field (instead of the single-trial decomposition as above). By means of paired-samples t-tests, we then tested whether the lateralized evoked power did statistically differ from baseline (400–200 ms precue) in each group of sensors exhibiting maximal power modulation.
Source-level Analysis
MEG–MRI Coregistration
T1-weighted structural magnetic resonance images (MRIs) of each participant were coregistered to the MEG coordinate system by a semiautomatic procedure that provided the best fit between the subject's scalp surface extracted from its anatomical MRI and the headshape digitized in the MEG. To obtain a first approximate alignment between MEG and MRI coordinates, we manually located the 3 digitized fiducial points (nasion, left and right preauricular points) in the individual's MRI. Subsequently, we applied an iterative fitting procedure consisting of 2 steps. First, the rotation of the headshape in all directions in increasingly smaller rotation angles (±15°, ±7.5°, ±3.75°, ±1.87°, and ±0.94°), and secondly, the automatic fitting of headshape and scalp points by applying a modified version of the Iterative Closest Point algorithm (icp2, Besl and McKay 1992; A.S.Mian©: http://www.csse.uwa.edu.au/~ajmal/code/icp2.m). In each iteration, the relative position between headshape and scalp was updated to the one providing the minimum mean distance error. By employing a large set of initial headshape positions, this iterative procedure helped the icp2 algorithm to select the global minimum.
Head and Forward Models
The brain surface was extracted from the individual subjects' MRI using the segmentation routine implemented in FieldTrip/SPM2 (http://www.fil.ion.ucl.ac.uk/spm). From this, we constructed a triangulated surface describing the inner surface of the skull. Lead fields were computed using the method described in Nolte (2003), based on this single-shell volume conduction model. Lead fields were computed for dipoles positioned on a 3-dimensional regular grid. Each subject's dipole grid was adapted from a standard grid of 6-mm resolution derived from the Montreal Neurological Institute (MNI) brain. This was achieved by normalizing the individual MRIs to the standard MNI brain through a linear affine transformation (FieldTrip/SPM2). The inverse of the resulting transformation matrix was applied to the MNI standard grid to transform it into each subject's brain space. Finally, we computed and normalized the lead fields corresponding to the 2 tangential orientations of a dipole at each grid location.
Source Localization Analysis
The localization of brain sources underlying time-frequency effects was performed by means of beamforming (van Veen et al. 1997; Gross et al. 2001). First, we band-pass filtered the MEG signal at the frequency of interest (i.e., 8–14 Hz). Then, we extracted 200-ms segments corresponding to the time window of interest (i.e., 300–500 ms postcue, the time window showing the strongest lateralized α-band activity with respect to the attended hemifield in the time-frequency analysis) for both left and right-cue conditions, as well as 200 ms from the baseline period (i.e., 400–200 ms precue). The activation and baseline segments were concatenated, and we calculated the corresponding covariance matrix, which was used to compute the spatial filter coefficients by means of the linearly constrained minimum variance (LCMV) beamformer (van Veen et al. 1997). We applied regularization by adding to the covariance matrix a unit matrix scaled to 10% of the mean across eigenvalues of the covariance matrix. Subsequently, we projected the sensor-level band-pass filtered signal of each trial into source space through the spatial filter corresponding to the optimally oriented dipole. This orientation was computed for each voxel from the first eigenvector of the covariance matrix between both tangential orientations. The amplitude envelope for each trial (i.e., the absolute value of the Hilbert transform) was averaged across trials and time for the different conditions, separately. As for the sensor-level analysis, source-level activity was normalized as relative change with respect to baseline, and we created mirrored hemi-brain volumes corresponding to the contralateral and ipsilateral cue-related activity. Finally, we averaged the brain activation volumes across subjects and identified the voxels exhibiting absolute spatial maxima/minima. The statistical significance of these peak voxels was tested by means of one-sample t-tests. The peak voxels together with their first-order neighboring voxels in the grid (i.e., 3 × 3 × 3 voxels corresponding to a total volume of 1.8 × 1.8 × 1.8 cm3) constituted the regions of interest (ROIs) that were employed in subsequent analyses. In addition, we performed Monte Carlo whole-brain statistics to test the significance of the brain regions exhibiting α-band suppression and enhancement. To control for multiple comparisons, we employed a false discovery rate (FDR) correction (Benjamini and Hochberg 1995) with 1000 permutations. Prior to statistical testing, brain activation volumes were smoothed using a Gaussian kernel (full width half maximum: 2 voxels).
TSE Analysis
As for the source localization procedure, we band-pass filtered the MEG signal from 8 to 14 Hz and projected it through the spatial filters of each of the voxels comprising a given ROI. The TSE curves were computed by means of the absolute value of the Hilbert transform of each trial and normalized with respect to baseline as explained above. Finally, the time courses for each ROI were averaged across both trials and voxels, and the resulting waveforms were in turn averaged across subjects.
Statistical Analysis of TSE Curves
To test whether the amplitude of the TSE curves significantly differed from zero, we employed a bootstrap approach. This procedure efficiently control the Type I error rate in the context of multiple comparisons (i.e., time-points in this case), without requiring any explicit assumption about the underlying distribution (Wilcox and Keselman 2003). Thus, we tested the null hypothesis that the individual TSE curves were sampled from a population with zero mean by repeating the following procedure 1000 times. First, we randomly assigned with replacement a positive/negative sign to each subject's TSE waveform. We then computed a one-sample t-test for the bootstrapped TSE curves and stored the most extreme maximum (or minimum) t-value across time in each repetition. In this way, we obtained an estimate of the null distribution of the maximum statistic, hence controlling for multiple comparisons. From the resulting distribution of bootstrapped t-values, we computed the 95th and 99th percentiles (or fifth and first percentiles) corresponding to P < 0.05 and <0.01 significance levels corrected for multiple comparisons (Nichols and Holmes 2002).
Specificity and Consistency of α-Band Brain Sources
We tested whether α-band modulations in each ROI were specific to either the contralateral or the ipsilateral hemisphere. To this end, we employed one-sample t-tests to statistically test whether the homolog region in the opposite hemisphere exhibited a similar pattern of α-activity. α-Band amplitude was computed from the mean value across the time window of maximum/minimum α-band activity obtained in the former analysis (i.e., the time window corresponding to a corrected P-value <0.01; an alternative analysis using a less restrictive corrected P-value <0.05 yielded equivalent results). In addition, and in order to test whether the pattern of α-band modulation in each ROI was consistently found for each cue condition, we performed the above statistical analyses for the left- and right-cue conditions, separately.
Relation Between Prestimulus α-Band Amplitude and Behavioral Performance
Finally, we evaluated the relationship between pretarget oscillatory α-activity in each ROI and detection rate (i.e., based on the sensory awareness reported by the participants). Given that our behavioral results indicated an interaction between target contrast and cue validity, we performed this analysis separately for the different stimulation conditions, excluding the low-contrast/invalid-cue condition due to insufficient number of detected trials. The analysis strategy was based on Linkenkaer-Hansen et al. (2004) and consisted of the following steps. First, for each subject and ROI, we computed the single-trial α-band amplitude during the 200 ms prior to target onset. The mean prestimulus amplitude across time was normalized in terms of relative change with respect to baseline (400–200 ms precue interval). Secondly, single trials were sorted according to the normalized prestimulus amplitude, and split into quartile bins. Then, we computed the change in the detection rate with respect to each subject's mean detection rate for each quartile bin. We statistically tested the relation between prestimulus α-activity and behavioral performance by means of linear regression analyses across subjects. We corrected for multiple comparisons by means of a bootstrap approach, similar to the one described above for the statistical analysis of TSE curves (Nichols and Holmes 2002). We randomly assigned a subset of trials to each quartile bin and computed its corresponding deviation with respect to each subject's mean detection rate for each condition. We performed this computation 1000 times. In each repetition, we stored the maximum R2 of inverse linear correlations. Corrected P-values were obtained from the resulting distribution of bootstrapped R2 values. Finally, to test whether the relationship between performance and prestimulus α-band magnitude might be explained by the interhemispheric comodulation of α-activity, we also computed the relationship between detection rate and the single-trial absolute difference between contralateral and ipsilateral α-magnitude.
Results
Behavioral Results
Behavioral performance was assessed in terms of detection rate, based on the subjective reports given by participants. The detection rate for high-contrast stimuli was 58.9 ± 7.0% (mean ± standard error of the mean [SEM]) and 44.8 ± 9.1% for valid- and invalid-cued trials, respectively. The detection rate for low-contrast stimuli was 11.2 ± 4.3% and 6.9 ± 1.6% for valid- and invalid-cue conditions, respectively. The detection rate for valid trials was lower than expected from the estimated psychometric curves, most probably due to fatigue throughout the main experiment. Nevertheless, the overall shift to the left in the psychometric function seemed to similarly affect both high- and low-contrast stimulation. An analysis of variance with the factors contrast, cue validity, and hemifield of presentation revealed significant main effects of contrast (F1,9= 19.6, P= 0.002) and cue validity (F1,9 = 6.8, P= 0.028), as well as a significant contrast × cue interaction (F1,9 = 7.0, P = 0.027). Follow-up analyses indicated that target stimuli were more often detected in validly than in invalidly cued trials for high-contrast stimuli (t(9) = 3.3, P = 0.009), whereas cue validity did not have a significant effect on the detection of low-contrast stimuli (t(9) = 1.2, P = 0.26). These results were not affected by the hemifield of stimulus presentation, as there was neither a main effect of hemifield nor a significant interaction of hemifield with any other factor (F1,9 < 1.6, P > 0.05). In addition, we computed the sensitivity index (d′) to ensure that behavioral performance was not contaminated by a response bias. The results of this analysis showed that d′ was significantly higher than zero (d′ = 1.63 ± 0.33, mean ± SEM; t(9) = 4.9, P < 0.001), thus suggesting that behavioral performance was not merely explained by a response bias.
Finally, to test the reliability of the subjective reports, we computed the percentage of correct trials in the objective forced-choice task when they were subjectively reported as either “seen” or “unseen.” Seen trials were correctly responded above chance level (percentage of correct responses 74.7 ± 3.4%, t(9)= 7.3, P < 0.001), whereas correct responses in unseen trials did not differ from chance level (percentage of correct responses 50.7 ± 0.5, t(9) = 1.5, P = 0.15).
Eye Movements Analysis
The artifact generated by eye movements was clearly characterized by a strong magnetic field over bilateral fronto-temporal sensors (Supplementary Fig. 1). Activity in these sensors was significantly higher in the eye movements trials compared with the clean data (t(13) > 3.29, P < 0.006). Additionally, we confirmed that the amplitude on this fronto-temporal group of sensors during the cue-target interval did not significantly differ from baseline levels in the data that were subsequently analyzed (t(9) < 1.63, P > 0.05). In sum, these results demonstrate that the analyzed data were not contaminated by eye movements to the cued location.
Time-frequency Maps and Topographies
Time-frequency analysis revealed cue-related power modulations predominantly over posterior sensors (Fig. 2A). Figure 2B shows the average time-frequency map of the difference between contralateral and ipsilateral power changes across 4 representative sensors. Cue-related oscillatory activity was mainly characterized by a transient θ-band (3–8 Hz) power increase and a sustained α-band (8–14 Hz) decrease. Since we were interested in the modulation of α-band power elicited by spatial attention, we will focus on the latter oscillatory activity. The α-modulation by attention was highest from 300 to 500 ms following cue onset but sustained until target presentation. Overall, this relative difference between contralateral and ipsilateral α-power was distributed over occipito-parietal sensors (Fig. 2B). However, this relative power change was not solely caused by a decrement of activity in the contralateral hemisphere, but rather by both a decrease of α-band power over contralateral sensors and an increase over the ipsilateral hemisphere. As shown in Figure 2C, this pattern was consistent for the left- and right-cue conditions, separately. The scalp topography of contralateral and ipsilateral α-band power modulations (Fig. 2C) reveals 3 groups of sensors exhibiting α-band power changes; one of them characterized by a power decrease over contralateral occipital sensors, and the other 2 groups exhibiting power increases in the ipsilateral hemisphere, over both parieto-occipital and central sensors. Subsequent statistical analysis revealed that only the activity in the 2 parieto-occipital groups of sensors was consistently lateralized with respect to the attended hemifield. The ipsilateral parieto-occipital group of sensors showed significantly higher α-band power than their homologs contralateral sensors in the left-cue trials (t(9) = 2.96, P = 0.016) as well as in the right-cue trials (t(9) = 3.15, P = 0.012; Fig. 2D), and this was independent of cue direction (no interaction between factors sensors (ipsi-contralateral) × cue direction (left–right): F1,9 = 0.002, P = 0.97). Similarly, the contralateral ventral occipital group of sensors exhibited a more pronounced α-band power decrease than their homologs in the ipsilateral hemisphere, which was consistently present in both left- (t(9) = 5.91, P< 0.001) and right-cue (t(9) = 2.38, P = 0.041) conditions (Fig. 2E). For this ventral occipital groups of sensors, α-band magnitude also showed a stronger lateralization for left- compared with right-cue trials, as indicated by a significant interaction between ipsi-contralateral sensors and left–right-cue directions (F1,9 = 5.75, P = 0.040). In contrast, the group of sensors located over the ipsilateral central region did not show a robust lateralization pattern, as the difference in α-band power with respect to its homolog in the contralateral hemisphere was near significance level for right-cue trials (t(9) = 2.26, P = 0.050), but nonsignificant for the left-cue condition (t(9) = 0.21, P = 0.834).
Figure 2.

Cue-related time-frequency activity. (A) General pattern of cue-related time-frequency activity. The figure shows the difference between contralateral and ipsilateral power changes across the whole sensory array. Power changes are expressed as percentage relative change with respect to baseline. The empty time-frequency plot in the upper right corner indicates the scale of the x-axis (time, in ms) and y-axis (frequency, in Hz). Time 0 indicates cue onset. (B) The left-side figure shows the average time-frequency map of the difference between contralateral and ipsilateral power changes across the 4 representative sensors indicated in A. The dashed line at 30 Hz indicates the 2 parts of the frequency spectrum that were analyzed separately (see Materials and Methods). The right-side figure shows the topography of the difference between contralateral and ipsilateral α-band activity. (C) Topography of α-band (8–14 Hz) power during the time window of maximal modulation (300–500 ms). The left-side figures show the α-band topography for left- and right-cue conditions, separately. The right-side figure shows the summary topography of contralateral and ipsilateral α-band power changes. (D) Lateralization of α-band modulation in the dorsal parieto-occipital group of sensors exhibiting increased α-activity. (E) Lateralization with respect to the attended hemifield of α-band activity in the ventral occipital sensors showing α-suppression. *P < 0.05; ***P < 0.001. LH: left hemisphere; RH: right hemisphere.
Finally, we conducted time-frequency analysis of evoked fields to rule out the possibility that the α-band modulations reflect cue-evoked activity, rather than induced power changes in oscillatory activity (i.e., may have been associated with cue processing rather than with directing attention to cued locations). The results of the time-frequency analysis of cue-evoked activity showed that most of the evoked power was concentrated at low frequencies (θ-band, ∼3–8 Hz, at ∼100–300 ms); contrasting with the single-trial time-frequency analysis showing additional α-band activity (see above and Fig. 2B). Subsequent statistical analysis confirmed that evoked θ-band power in the 100–300 ms time window was significantly higher than baseline power (t(9) = 4.37, P = 0.002). Evoked α-power from 300 to 500 ms, on the other hand, did not significantly differ from baseline in either the ventral (t(9) = −0.24, P = 0.82) or the dorsal group of sensors (t(9) = 1.36, P = 0.21). In contrast to the absence of cue-evoked activity in the α-range, the single-trial α-band power in the 300–500 ms time window (Fig. 2B) was significantly different from baseline in both the ventral and the dorsal occipital groups of sensors (t(9) = −2.98, t(9) = 2.91, P < 0.05). In sum, these results show that 1) cue-evoked activity is reflected in the early θ-band response and 2) both the dorsal and the ventral α-band modulations do not reflect cue-evoked activity, but induced changes in oscillatory activity.
Brain Sources of Oscillatory α-Band Activity
The neural sources underlying the above α-band changes in power are described in Table 1. It shows the MNI coordinates, the percent relative change, and the statistical significance of the global spatial maxima/minima of activation. The brain sources in contralateral/ipsilateral regions obtained from the combined left- and right-cue conditions are depicted in the upper part of the table. The information relative to the brain activity elicited in the left- and right-cue conditions is additionally shown, as this provides an important indicator of the stability of the results.
Table 1.
Brain sources of α-band modulation
| Hemisphere | MNI coordinates | Relative change (mean ± SEM %) | t(9) | P-value |
|---|---|---|---|---|
| Left and right cue | ||||
| Contralateral | (±44, −80, −8) | −13.6 ± 3.1 | −4.39 | 0.002 |
| Ipsilateral | (±11, −86, 36) | 12.5 ± 1.9 | 6.49 | 0.000 |
| Left cue | ||||
| Contralateral (RH) | (47, −76, −8) | −16.4 ± 3.2 | −5.18 | 0.001 |
| Ipsilateral (LH) | (−11, −86, 30) | 12.4 ± 2.8 | 4.43 | 0.002 |
| Right cue | ||||
| Contralateral (LH) | (−42, −87, −3) | −13.6 ± 3.2 | −4.23 | 0.002 |
| Ipsilateral (RH) | (18, −86, 41) | 14.7 ± 2.9 | 5.11 | 0.001 |
Note: MNI coordinates, percent relative change, and statistical significance of the brain sources exhibiting α-band modulations. The brain sources resulting from combining left- and right-cue conditions are shown in the upper part of the table. The lower part of the table describes the α-band brain generators for the left- and right-cue conditions, separately.
Figure 3A,B illustrates the underlying sources of oscillatory α-band activity corresponding to the ipsilateral α-band increase and the contralateral decrease previously observed over posterior sensors (Fig. 2C). Figure 3A shows an increase in α-band amplitude in the parieto-occipital cortex ipsilateral to the attended location. Conversely, contralateral ventro-lateral occipital cortex exhibited an α-band amplitude decrease (Fig. 3B).
Figure 3.
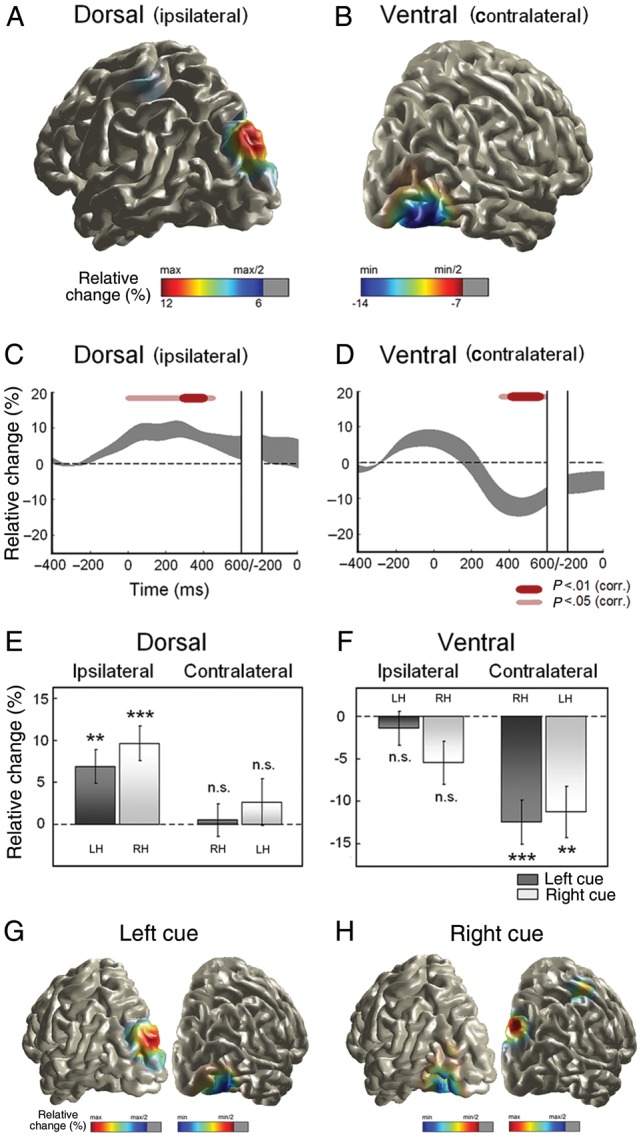
Brain sources of oscillatory α-band activity. (A) Brain source of α-increase over the dorsal parieto-occipital cortex ipsilateral to the attended hemifield. α-Band amplitude is expressed as percentage relative change with respect to baseline. (B) Brain source of α-suppression over the ventro-lateral extrastriate cortex contralateral to the attended location. (C) Time course of α-band amplitude in the ipsilateral dorsal parieto-occipital source. Time scale refers to cue onset in the first part and to target onset in its final segment. Gray thick lines indicate mean ± SEM. Red lines indicate time points that significantly differed from 0 at P < 0.05 and P < 0.01 significance levels (corrected for multiple comparisons). (D) Time course of α-band amplitude in the contralateral ventro-lateral occipital region. (E) Specificity of the α-band increase in the parieto-occipital cortex for the ipsilateral hemisphere, and consistency across the left- and righ-cue conditions. (F) Specificity of the α-band decrease in the ventro-lateral extrastriate cortex for the contralateral hemisphere, and consistency across conditions. **P < 0.01; ***P < 0.001; n.s. not significant. (G) Consistency of the brain pattern underlying α-band modulations for the left-cue condition and (H) for the right-cue condition. The local spatial maxima/minima were significant at P < 0.05 (FDR corrected). LH: left hemisphere; RH: right hemisphere.
TSE of Underlying α-Band Brain Sources
Brain sources underlying α-band amplitude modulations followed specific time courses. The ipsilateral parieto-occipital cortex showed a transient α-band increase peaking at ∼300 ms after cue onset (Fig. 3C), whereas the α-band decrease in the contralateral ventro-lateral occipital cortex was characterized by a more delayed onset (around 400 ms postcue) followed by a sustained decrease (Fig. 3D).
Specificity and Consistency of α-Band Brain Sources
Subsequent statistical analyses demonstrated that the α-band modulation patterns observed in the parieto-occipital and ventro-lateral occipital cortices were specific for the ipsilateral and contralateral hemispheres, respectively, as this pattern was not shown by their homolog regions in the opposite hemispheres. Furthermore, these patterns were consistent across the left- and right-cue conditions, separately. Figure 3E shows the α-band modulation pattern of the dorsal parieto-occipital region. The ipsilateral parieto-occipital cortex exhibited an α-band amplitude significantly higher than zero for the left- (t(9) = 3.46, P = 0.007) and right-cue conditions (t(9) = 4.68, P = 0.001), whereas its homolog region in the hemisphere contralateral to the attended location did not differ from zero in any condition (left cue: t(9) = 0.28, right cue: t(9) = 0.95, P > 0.05). Similarly, α-band amplitude in the contralateral ventral occipital region was lower than zero in both left- (t(9) = −4.78, P = 0.001) and right-cue trials (t(9) = −3.75, P = 0.005), whereas its homolog in the ipsilateral hemisphere did not significantly differ from zero in any case (left cue: t(9) = −0.71, right cue: t(9) = −2.15, P > 0.05; Fig. 3F). Unlike the sensor-level results, the α-band amplitude of the underlying brain sources did not show any difference depending on the direction of the cue, neither for the ipsilateral dorsal nor for the contralateral ventral occipital brain region (t(9) < 1.54, P > 0.05). This discrepancy is most likely due to the effects that the combination of activity from different sources and the variability in the head position relative to MEG sensors might have on sensor-level data. Figure 3G,H illustrates the consistency of the brain pattern underlying α-band modulations, that is, ipsilateral parieto-occipital α-increase and contralateral ventro-lateral occipital α-suppression for the left- (Fig. 3G) and right-cue (Fig. 3H) conditions, separately. Both ipsilateral α-band increase in the parieto-occipital cortex and contralateral α-suppression in ventro-lateral extrastriate areas were significant at P < 0.05 (FDR corrected for multiple comparisons).
Relation Between Prestimulus α-Band Amplitude and Behavioral Performance
From the different ROIs and stimulation conditions tested, only the prestimulus α-band activity generated in the ventro-lateral occipital cortex showed a relationship with the detection rate of high-contrast stimuli (Table 2). Interestingly, the hemisphere showing a correlation between α-band amplitude and detection rate was different depending on whether the target stimulus appeared at either valid- or invalid-cued locations (Fig. 4). In the case of above-threshold targets appearing at valid-cued locations, the lower the level of prestimulus α-band in the contralateral occipital cortex the higher the detection rate (Fig. 4A). This decrease in performance with increasing prestimulus α-band activity was well fitted by a linear function (R = −0.39, P = 0.013). This correlation remained significant after correcting for multiple comparisons (P = 0.048). In line with this, when targets appeared in the invalid-cued hemifield, this inverse linear relationship was not observed for prestimulus α-band activity contralateral to the cued position, that is, ipsilateral to the target (Fig. 4C), but for activity ipsilateral to the cued location, and hence contralateral to the target (Fig. 4D; R = −0.35, P = 0.026). Although this result should be cautiously taken because it did not reach significance when corrected for multiple comparisons (P = 0.093), it might be considered as a trend toward significance, given the symmetrical relationship of the ventral occipital region with performance in both valid- and invalid-cue conditions.
Table 2.
Relationship between prestimulus α-band magnitude and performance
| ROI | Hemisphere | Contrast | Cue | R | P-value |
|---|---|---|---|---|---|
| Ventral occipital | Contralateral | Low | Valid | −0.115 | 0.480 |
| High | Invalid | 0.176 | 0.277 | ||
| High | Valid | −0.388 | 0.013 | ||
| Ipsilateral | Low | Valid | −0.028 | 0.863 | |
| High | Invalid | −0.352 | 0.026 | ||
| High | Valid | −0.039 | 0.811 | ||
| Dorsal occipital | Contralateral | Low | Valid | 0.142 | 0.383 |
| High | Invalid | 0.067 | 0.681 | ||
| High | Valid | −0.257 | 0.110 | ||
| Ipsilateral | Low | Valid | −0.242 | 0.132 | |
| High | Invalid | −0.069 | 0.675 | ||
| High | Valid | −0.028 | 0.866 |
Note: Relationship between prestimulus α-band level and change in the detection rate (R and uncorrected P-value) for each of the 2 ROIs exhibiting α-band decreases and increases by attention (ventro-lateral occipital and dorsal parieto-occipital cortices, respectively), hemisphere (contralateral and ipsilateral), stimulus contrast (low and high), and cue validity conditions. The 2 linear relationships that were significant at an uncorrected P-value < 0.05 are highlighted in bold. The corresponding corrected P-values were 0.048 and 0.093 for the contralateral and ipsilateral ventro-lateral occipital regions, respectively.
Figure 4.

Relationship between prestimulus α-band amplitude in the ventro-lateral extrastriate cortex and behavioral performance. The figure illustrates the percentage change in the detection rate for the different levels of prestimulus α-band amplitude. α-Band magnitude was organized in quartile bins, from lowest (Quartile 1) to highest (Quartile 4) α-band amplitude. The different panels show the relationship between detection rate and α-magnitude in the ventro-lateral occipital cortex contralateral (A and C) and ipsilateral (B and D) to the cued position; and for targets appearing in valid (A and B) and invalid (C and D) cued locations. Only α-magnitude in the hemisphere receiving upcoming target stimuli showed an inverse linear relationship with perception (A and D). Asterisk indicates an uncorrected P-value <0.05.
Note that the above analysis was performed on the pooled source-level data (left- and right-cue trials combined) to allow for a better estimation of target detection per α-band bin (higher n). It might be argued that this is not without problems as potential α-asymmetries between left- and right-cue conditions might have confounded our results (i.e., such asymmetries might cause more left-/right-cue trials to be assigned to one extreme of the distribution such that a difference in detection performance across α-bins may reflect left- vs. right-cue differences rather than differences across an α-continuum). However, this is an unlikely scenario, as our results show that cue direction did not have an effect on source-level α-activity (nor on detection rate). Nevertheless, to explicitly rule out this potential confound, we have tested whether the number of assigned left-cue trials (or the complementary right-cue trials) may differ across quartile bins. In both valid- and invalid-cue conditions, the average percentage of left-cue trials assigned to each bin ranged between 47.9% and 54.9%. Critically, the number of left-cue trials (and hence complementary right-cue trials) did not significantly differ between any pair of quartile bins in either the high-contrast valid (t(9) < 1.58, P > 0.05, Fig. 4A,B) or invalid-cue conditions (t(9) < 1.23, P > 0.05, Fig. 4C,D).
In addition, we tested whether α-band activity also facilitated performance in the objective task (i.e., the forced-choice comparison of the target stimulus with the number 5) when stimuli were reported as seen. Unlike the inverse linear relationship with the detection rate mentioned above, the correlation between correct responses and prestimulus α-magnitude in the ventro-lateral occipital cortex was not significant in either the contralateral hemisphere in valid trials (R = −0.27, P = 0.151) or the ipsilateral hemisphere in invalid trials (R = 0.14, P = 0.468).
Finally, we tested whether the relationship between α-band level in the ventro-lateral occipital region and the detection rate might be better explained by the balance between contralateral and ipsilateral α-magnitude. Our results showed that behavioral performance was not better predicted by the contralateral–ipsilateral α-band balance for valid trials (R = −0.17, P = 0.299). However, when stimuli were invalidly cued, the balance between contra- and ipsilateral α-band magnitude did show a strong positive relationship with the detection rate (R = 0.54, P < 0.001).
Taken together, our results suggest that a lower level of prestimulus α-band activity in the ventro-lateral occipital cortex contralateral to the to-be-perceived target stimulus facilitates its subsequent detection (but not recognition). However, when the target stimulus appear in an unexpected location (i.e., in invalid trials), behavioral performance does rather depend on the interhemispheric balance between ongoing fluctuations of α-band activity in homotopic ventro-lateral extrastriate cortices. Thus, subsequent detection is improved when prestimulus α-magnitude is higher in the hemisphere attending to the invalid location (inhibited) and concurrently lower in the perceiving hemisphere (facilitated).
Discussion
In this study, we investigated the α-band (8–14 Hz) dynamics underlying anticipatory visuospatial attention and their relation to the perception of upcoming visual stimuli. To this end, we recorded MEG activity, whereas participants performed a spatially cued detection task of near-threshold stimuli. Unlike most previous studies, we made use of source localization techniques to characterize the brain generators of α-band modulations. At the behavioral level, endogenous spatial attention only improved the detection of above-threshold target stimuli. At the neural level, α-band amplitude enhancement and suppression elicited by spatial attention were generated by 2 distinct brain regions, along the dorsal and ventral visual streams, respectively (Ungerleider and Mishkin 1982). Critically, prestimulus α-band amplitude in the ventro-lateral occipital cortex, but not in the dorsal region, had an influence on subsequent perception.
General Pattern of α-Band Attentional Modulations
Here, we replicated the common finding that the locus of visuospatial attention is indexed by the lateralization of α-band activity over occipito-parietal sensors (Worden et al. 2000; Yamagishi et al. 2003, 2005; Sauseng et al. 2005; Thut et al. 2006; Rihs et al. 2007, 2009; Doesburg et al. 2008; Siegel et al. 2008; Trenner et al. 2008; van Gerven and Jensen 2009; Gould et al. 2011; Handel et al. 2011). This lateralization is reflected in an α-band decrease contralateral to the attended location (e.g., Rihs et al. 2009; Gould et al. 2011), and/or an ipsilateral increase (e.g., Worden et al. 2000; Rihs et al. 2009). Our sensor-level results revealed both a decrease and an increase in α-band power with characteristic topographies (Fig. 2). Subsequent source-level analysis identified 2 underlying neural generators along the dorsal and ventral visual pathways (Fig. 3). The anatomical segregation of these generators, together with their different dynamics and correlation with performance suggests that α-activity operates independently in the dorsal and ventral streams. As discussed in more detail below, the dorsal generator is most likely involved in the spatial component of visuospatial attention, whereas the ventral source most likely reflects feature-based processes (i.e., the expectation of a particular target stimulus). This view is supported by recent findings showing that parieto-occipital α-activity is involved in a common, supramodal control mechanism for the deployment of spatial attention, whereas later α-modulations rather reflect sensory-specific mechanisms (Banerjee et al. 2011).
The Role of Ipsilateral α-Increase in the Dorsal Stream in Orienting of Attention
The initial modulation of α-band activity was located along the dorsal stream of the visual system, which is crucial for the processing of object location and orientation in space (Ungerleider and Mishkin 1982). The location of this α-generator is compatible with area V6, situated in the anterior bank of the parieto-occipital sulcus (Zeki 1986). Area V6 is involved in controlling saccade movements oriented to locate objects in space (Nakamura et al. 1999). As the neural networks underlying covert visuospatial orienting and overt saccadic movements overlap (Nobre et al. 2000; de Haan et al. 2008), area V6 is likely to be also involved in covertly directing attention to a given spatial location. Because α-activity in this parieto-occipital region was transient and occurred earlier than the ventro-lateral α-suppression, it may reflect the source of the top-down signal rather than its consequences on visual areas (Kastner and Ungerleider 2000; Yantis and Serences 2003). α-Activity has indeed been implicated in functional coupling during top-down control (Palva and Palva 2007; Doesburg et al. 2009), although it would be unclear in our case why it was localized only ipsilateral to the attended space. Alternatively and more likely, the α-increase in parietal area V6 may reflect active inhibitory processes directed toward unattended space (in line with the current models of α-activity; Klimesch et al. 2007; Jensen and Mazaheri 2010; Foxe and Snyder 2011), which, however, may have been discontinued here given the absence of distracter information in the unattended region of space and the need to detect targets also at uncued locations (for evidence of sustained α-increases with distracter information present, see Kelly et al. 2006). Finally, given its transient nature, it might be argued that this α-band increase simply reflects cue-evoked activity, being a correlate of cue processing rather than of directing attention. However, none of the typical cue-evoked potentials (early/anterior directing attention negativity; see, e.g., Kelly et al. 2009) match in either timing or scalp distribution the α-increase found here. Moreover, a time-frequency analysis of cue-evoked fields revealed that these were reflected in the θ-band at earlier time windows. Therefore, this further underlines that the ipsilateral α-increase reflects oscillatory activity induced by attention orienting (despite its transient nature), rather than cue processing.
In conclusion, the parieto-occipital increase of α-activity likely reflects oscillatory processes associated with location-based attention, possibly initial inhibitory processes, which are, however, discontinued due to the demands of our task, and whose timing (starting at 300 ms postcue) is consistent with the time that is required to perform attentional shifts, as demonstrated by behavioral (Cheal and Lyon 1991) and electrophysiological (Muller et al. 1998) studies.
The Role of Sustained Contralateral α-Decrease in the Ventral Stream in the Modulation of Baseline Excitability Levels
The second cortical region exhibiting an α-band modulation was located in the ventro-lateral extrastriate cortex. The ventral visual system is involved in processing the different features of a visual stimulus (Ungerleider and Mishkin 1982; Grill-Spector and Malach 2004). It is well known that, in the absence of stimulation, the expectation of a particular stimulus enhances activation in the same brain regions that are involved in processing it (Chawla et al. 1999; Kastner et al. 1999; Silver et al. 2007; Esterman and Yantis 2010; Snyder and Foxe 2010). Thus, specialized brain areas can be placed in an anticipatory state that biases the competition for processing resources between upcoming sensory stimuli in favour of the expected one (Desimone and Duncan 1995; Fu et al. 2001). This anticipatory biasing, or baseline shift, would operate by means of a reduction in the threshold levels of the neural network coding the relevant target features (Birbaumer et al. 1990; Desimone and Duncan 1995).
In the present study, we found a baseline shift in the ventro-lateral extrastriate cortex. This region, most likely compatible with area V4 (Zeki et al. 1991; Wandell et al. 2007), is engaged in processing 2-dimensional forms, such as letters, symbols, and geometrical figures (Flowers et al. 2004; Pernet et al. 2005). Therefore, the specific task demands of this study (i.e., detection and recognition of digits) might have determined the location of the anticipatory baseline shift to an extrastriate visual region specialized in identifying symbols. Under different task demands, the baseline shift indexed by α-magnitude would likely occur in other brain regions. For instance, Yamagishi et al. (2005) using a simple bar orientation discrimination task found a modulation of α-band in the striate cortex. In contrast, Snyder and Foxe (2010) found more dorsal versus ventral α-modulations depending on the task-relevant visual feature (motion or color). It is important to mention that although Snyder and Foxe (2010) found a dorsal/ventral dissociation of α-band modulations, both generators were involved in the feature component of the task. Thus, in terms of their functional role, they would most likely correspond to the ventral stream generator (and not the ventral/dorsal dichotomy) found in our study.
To summarize, the decrease in α-band magnitude contralateral to the attended hemifield might indicate an anticipatory baseline shift in the ventro-lateral extrastriate region specialized in processing the upcoming visual target features. By an increase in the excitability levels, the neural network coding for the expected, relevant features might be “preactivated” facilitating their later detection and processing, as discussed in more detail below.
Relation Between Prestimulus Oscillatory α-Activity and Performance
Our results showed an inverse relationship between prestimulus α-level and behavioral performance. Overall, these results are in agreement with most previous electrophysiological studies in humans, showing an inverse linear relationship between α-activity in posterior sensors and behavioral performance (Thut et al. 2006; Hanslmayr et al. 2007; Trenner et al. 2008; van Dijk et al. 2008; Yamagishi et al. 2008; Kelly et al. 2009; Gould et al. 2011, Haegens et al. 2011), as well as with monkey findings (Bollimunta et al. 2008). Likewise, other studies have shown that low/high levels of prestimulus α-activity predict the subsequent detection/nondetection of near-threshold stimuli (Ergenoglu et al. 2004; Wyart and Tallon-Baudry 2009) or even the probability of inducing illusory visual percepts by transcranial magnetic stimulation (Romei, Rihs, et al. 2008; Romei, Brodbeck, et al. 2008). Taken together, the existing literature supports the notion that α-band activity indexes the level of baseline cortical excitability (Pfurtscheller 2001; Romei, Rihs, et al. 2008; Romei, Brodbeck, et al. 2008) and, in turn, lower baseline threshold levels favour the perception of upcoming stimuli.
Importantly, our source-level approach demonstrates for the first time that the relationship between prestimulus α-level and perceptual performance is restricted to the brain region specialized in processing upcoming target features. This finding significantly contributes to understanding the functional implication of α-suppression in perception, pointing to an anticipatory baseline shift in specialized sensory cortex. This view is further supported by the fact that α-band magnitude influenced behavioral performance only if target stimuli were above sensory threshold (Table 2). Thus, perceptual threshold would depend on the dynamic interaction between cortical excitability and stimulus intensity. In addition, detection of targets at unattended locations depends more on α-band comodulation over homotopic areas than target detection at the attended position, as if helping disengagement from incorrectly attended positions.
In conclusion, our results show 2 dissociated brain generators underlying α-band modulations by anticipatory visuospatial attention, along the dorsal and ventral visual streams of the visual system. Given their different temporal dynamics and influence on perception, we suggest that they might be involved in 2 different components of visuospatial attention. The dorsal parieto-occipital source might reflect the spatial component required to orient the focus of attention to the location of the expected target stimulus. On the other hand, the ventral extrastriate occipital cortex would rather implement the feature component involved in the expectation of a specific visual target, thus, playing a critical role in subsequent perception.
Supplementary Material
Supplementary material can be found at: http://www.cercor.oxfordjournals.org/.
Funding
This work was supported by the Wellcome Trust (084067, 091928), the UK' Economical and Social Research Council (ESRC) and Medical Research Council (MRC), and the Spanish Ministry of Science and Innovation (2008-0168 Postdoctoral Fellowship to A.C.).
Supplementary Material
Notes
Conflict of Interest: None declared.
References
- Banerjee S, Snyder AC, Molholm S, Foxe JJ. Oscillatory alpha-band mechanisms and the deployment of spatial attention to anticipated auditory and visual target locations: supramodal or sensory-specific control mechanisms? J Neurosci. 2011;31:9923–9932. doi: 10.1523/JNEUROSCI.4660-10.2011. doi:10.1016/0002-8703(84)90482-4. [DOI] [PMC free article] [PubMed] [Google Scholar]
- Bastiaansen MC, Knosche TR. Tangential derivative mapping of axial MEG applied to event-related desynchronization research. Clin Neurophysiol. 2000;111:1300–1305. doi: 10.1016/s1388-2457(00)00272-8. doi:10.1016/S0003-4975(03)01141-X. [DOI] [PubMed] [Google Scholar]
- Benjamini Y, Hochberg Y. Controlling the false discovery rate: a practical and powerful approach to multiple testing. J Roy Stat Soc Ser B (Methodological) 1995;57:289–300. doi:10.1016/j.athoracsur.2008.03.013. [Google Scholar]
- Besl P, McKay N. A method for registration of 3-D shapes. IEEE Trans Pattern Anal Machine Intell. 1992;14:239–256. [Google Scholar]
- Birbaumer N, Elbert T, Canavan AG, Rockstroh B. Slow potentials of the cerebral cortex and behavior. Physiol Rev. 1990;70:1–41. doi: 10.1152/physrev.1990.70.1.1. [DOI] [PubMed] [Google Scholar]
- Bollimunta A, Chen Y, Schroeder CE, Ding M. Neuronal mechanisms of cortical alpha oscillations in awake-behaving macaques. J Neurosci. 2008;28:9976–9988. doi: 10.1523/JNEUROSCI.2699-08.2008. [DOI] [PMC free article] [PubMed] [Google Scholar]
- Brainard DH. The psychophysics toolbox. Spat Vis. 1997;10:433–436. [PubMed] [Google Scholar]
- Chawla D, Rees G, Friston KJ. The physiological basis of attentional modulation in extrastriate visual areas. Nat Neurosci. 1999;2:671–676. doi: 10.1038/10230. [DOI] [PubMed] [Google Scholar]
- Cheal M, Lyon DR. Central and peripheral precuing of forced-choice discrimination. Q J Exp Psychol A. 1991;43:859–880. doi: 10.1080/14640749108400960. [DOI] [PubMed] [Google Scholar]
- de Haan B, Morgan PS, Rorden C. Covert orienting of attention and overt eye movements activate identical brain regions. Brain Res. 2008;1204:102–111. doi: 10.1016/j.brainres.2008.01.105. [DOI] [PMC free article] [PubMed] [Google Scholar]
- Del Cul A, Baillet S, Dehaene S. Brain dynamics underlying the nonlinear threshold for access to consciousness. PLoS Biol. 2007;5:e260. doi: 10.1371/journal.pbio.0050260. [DOI] [PMC free article] [PubMed] [Google Scholar]
- Desimone R, Duncan J. Neural mechanisms of selective visual attention. Annu Rev Neurosci. 1995;18:193–222. doi: 10.1146/annurev.ne.18.030195.001205. [DOI] [PubMed] [Google Scholar]
- Doesburg SM, Green JJ, McDonald JJ, Ward LM. From local inhibition to long-range integration: a functional dissociation of alpha-band synchronization across cortical scales in visuospatial attention. Brain Res. 2009;1303:97–110. doi: 10.1016/j.brainres.2009.09.069. [DOI] [PubMed] [Google Scholar]
- Doesburg SM, Roggeveen AB, Kitajo K, Ward LM. Large-scale gamma-band phase synchronization and selective attention. Cereb Cortex. 2008;18:386–396. doi: 10.1093/cercor/bhm073. [DOI] [PubMed] [Google Scholar]
- Ergenoglu T, Demiralp T, Bayraktaroglu Z, Ergen M, Beydagi H, Uresin Y. Alpha rhythm of the EEG modulates visual detection performance in humans. Brain Res Cogn Brain Res. 2004;20:376–383. doi: 10.1016/j.cogbrainres.2004.03.009. [DOI] [PubMed] [Google Scholar]
- Esterman M, Yantis S. Perceptual expectation evokes category-selective cortical activity. Cereb Cortex. 2010;20:1245–1253. doi: 10.1093/cercor/bhp188. [DOI] [PMC free article] [PubMed] [Google Scholar]
- Flowers DL, Jones K, Noble K, VanMeter J, Zeffiro TA, Wood FB, Eden GF. Attention to single letters activates left extrastriate cortex. Neuroimage. 2004;21:829–839. doi: 10.1016/j.neuroimage.2003.10.002. [DOI] [PubMed] [Google Scholar]
- Foxe JJ, Snyder AC. The role of alpha-band brain oscillations as a sensory suppression mechanism during selective attention. Front Psychol. 2011;2:154. doi: 10.3389/fpsyg.2011.00154. [DOI] [PMC free article] [PubMed] [Google Scholar]
- Fu KM, Foxe JJ, Murray MM, Higgins BA, Javitt DC, Schroeder CE. Attention-dependent suppression of distracter visual input can be cross-modally cued as indexed by anticipatory parieto-occipital alpha-band oscillations. Brain Res Cogn Brain Res. 2001;12:145–152. doi: 10.1016/s0926-6410(01)00034-9. [DOI] [PubMed] [Google Scholar]
- Gazzaley A, Cooney JW, Rissman J, D'Esposito M. Top-down suppression deficit underlies working memory impairment in normal aging. Nat Neurosci. 2005;8:1298–1300. doi: 10.1038/nn1543. [DOI] [PubMed] [Google Scholar]
- Gould IC, Rushworth MF, Nobre AC. Indexing the graded allocation of visuospatial attention using anticipatory alpha oscillations. J Neurophysiol. 2011;105:1318–1326. doi: 10.1152/jn.00653.2010. [DOI] [PMC free article] [PubMed] [Google Scholar]
- Grill-Spector K, Malach R. The human visual cortex. Annu Rev Neurosci. 2004;27:649–677. doi: 10.1146/annurev.neuro.27.070203.144220. [DOI] [PubMed] [Google Scholar]
- Gross J, Kujala J, Hamalainen M, Timmermann L, Schnitzler A, Salmelin R. Dynamic imaging of coherent sources: studying neural interactions in the human brain. Proc Natl Acad Sci USA. 2001;98:694–699. doi: 10.1073/pnas.98.2.694. [DOI] [PMC free article] [PubMed] [Google Scholar]
- Haegens S, Händel BF, Jensen O. Top-down controlled alpha band activity in somatosensory areas determines behavioral performance in a discrimination task. J Neurosci. 2011;31:5197–5204. doi: 10.1523/JNEUROSCI.5199-10.2011. [DOI] [PMC free article] [PubMed] [Google Scholar]
- Handel BF, Haarmeier T, Jensen O. Alpha oscillations correlate with the successful inhibition of unattended stimuli. J Cogn Neurosci. 2011;23:2494–2502. doi: 10.1162/jocn.2010.21557. [DOI] [PubMed] [Google Scholar]
- Hanslmayr S, Aslan A, Staudigl T, Klimesch W, Herrmann CS, Bauml KH. Prestimulus oscillations predict visual perception performance between and within subjects. Neuroimage. 2007;37:1465–1473. doi: 10.1016/j.neuroimage.2007.07.011. [DOI] [PubMed] [Google Scholar]
- Hilgetag CC, Theoret H, Pascual-Leone A. Enhanced visual spatial attention ipsilateral to rTMS-induced ‘virtual lesions’ of human parietal cortex. Nat Neurosci. 2001;4:953–957. doi: 10.1038/nn0901-953. [DOI] [PubMed] [Google Scholar]
- Jensen O, Mazaheri A. Shaping functional architecture by oscillatory alpha activity: gating by inhibition. Front Hum Neurosci. 2010;4:186. doi: 10.3389/fnhum.2010.00186. [DOI] [PMC free article] [PubMed] [Google Scholar]
- Kastner S, Pinsk MA, De Weerd P, Desimone R, Ungerleider LG. Increased activity in human visual cortex during directed attention in the absence of visual stimulation. Neuron. 1999;22:751–761. doi: 10.1016/s0896-6273(00)80734-5. [DOI] [PubMed] [Google Scholar]
- Kastner S, Ungerleider LG. Mechanisms of visual attention in the human cortex. Annu Rev Neurosci. 2000;23:315–341. doi: 10.1146/annurev.neuro.23.1.315. [DOI] [PubMed] [Google Scholar]
- Kelly SP, Gomez-Ramirez M, Foxe JJ. The strength of anticipatory spatial biasing predicts target discrimination at attended locations: a high-density EEG study. Eur J Neurosci. 2009;30:2224–2234. doi: 10.1111/j.1460-9568.2009.06980.x. [DOI] [PubMed] [Google Scholar]
- Kelly SP, Lalor EC, Reilly RB, Foxe JJ. Increases in alpha oscillatory power reflect an active retinotopic mechanism for distracter suppression during sustained visuospatial attention. J Neurophysiol. 2006;95:3844–3851. doi: 10.1152/jn.01234.2005. [DOI] [PubMed] [Google Scholar]
- Klimesch W, Sauseng P, Hanslmayr S. EEG alpha oscillations: the inhibition-timing hypothesis. Brain Res Rev. 2007;53:63–88. doi: 10.1016/j.brainresrev.2006.06.003. [DOI] [PubMed] [Google Scholar]
- Kontsevich LL, Tyler CW. Bayesian adaptive estimation of psychometric slope and threshold. Vision Res. 1999;39:2729–2737. doi: 10.1016/s0042-6989(98)00285-5. [DOI] [PubMed] [Google Scholar]
- Linkenkaer-Hansen K, Nikulin VV, Palva S, Ilmoniemi RJ, Palva JM. Prestimulus oscillations enhance psychophysical performance in humans. J Neurosci. 2004;24:10186–10190. doi: 10.1523/JNEUROSCI.2584-04.2004. [DOI] [PMC free article] [PubMed] [Google Scholar]
- Mitra PP, Pesaran B. Analysis of dynamic brain imaging data. Biophys J. 1999;76:691–708. doi: 10.1016/S0006-3495(99)77236-X. [DOI] [PMC free article] [PubMed] [Google Scholar]
- Muller MM, Teder-Salejarvi W, Hillyard SA. The time course of cortical facilitation during cued shifts of spatial attention. Nat Neurosci. 1998;1:631–634. doi: 10.1038/2865. [DOI] [PubMed] [Google Scholar]
- Muller N, Weisz N. Lateralized auditory cortical alpha band activity and interregional connectivity pattern reflect anticipation of target sounds. Cereb Cortex. 2012;22:1604–1613. doi: 10.1093/cercor/bhr232. [DOI] [PubMed] [Google Scholar]
- Nakamura K, Chung HH, Graziano MS, Gross CG. Dynamic representation of eye position in the parieto-occipital sulcus. J Neurophysiol. 1999;81:2374–2385. doi: 10.1152/jn.1999.81.5.2374. [DOI] [PubMed] [Google Scholar]
- Nichols TE, Holmes AP. Nonparametric permutation tests for functional neuroimaging: a primer with examples. Hum Brain Mapp. 2002;15:1–25. doi: 10.1002/hbm.1058. [DOI] [PMC free article] [PubMed] [Google Scholar]
- Nobre AC, Gitelman DR, Dias EC, Mesulam MM. Covert visual spatial orienting and saccades: overlapping neural systems. Neuroimage. 2000;11:210–216. doi: 10.1006/nimg.2000.0539. [DOI] [PubMed] [Google Scholar]
- Nolte G. The magnetic lead field theorem in the quasi-static approximation and its use for magnetoencephalography forward calculation in realistic volume conductors. Phys Med Biol. 2003;48:3637–3652. doi: 10.1088/0031-9155/48/22/002. [DOI] [PubMed] [Google Scholar]
- Oostenveld R, Fries P, Maris E, Schoffelen JM. FieldTrip: open source software for advanced analysis of MEG, EEG, and invasive electrophysiological data. Comput Intell Neurosci. 2011;2011:156869. doi: 10.1155/2011/156869. [DOI] [PMC free article] [PubMed] [Google Scholar]
- Palva S, Palva JM. New vistas for alpha-frequency band oscillations. Trends Neurosci. 2007;30:150–158. doi: 10.1016/j.tins.2007.02.001. [DOI] [PubMed] [Google Scholar]
- Percival DB, Walden AT. Spectral analysis for physical applications: multitaper and conventional univariate techniques. Cambridge, UK: Cambridge University Press; 1993. [Google Scholar]
- Pernet C, Celsis P, Demonet JF. Selective response to letter categorization within the left fusiform gyrus. Neuroimage. 2005;28:738–744. doi: 10.1016/j.neuroimage.2005.06.046. [DOI] [PubMed] [Google Scholar]
- Pfurtscheller G. Functional brain imaging based on ERD/ERS. Vision Res. 2001;41:1257–1260. doi: 10.1016/s0042-6989(00)00235-2. [DOI] [PubMed] [Google Scholar]
- Ploner M, Gross J, Timmermann L, Pollok B, Schnitzler A. Pain suppresses spontaneous brain rhythms. Cereb Cortex. 2006;16:537–540. doi: 10.1093/cercor/bhj001. [DOI] [PubMed] [Google Scholar]
- Posner MI. Orienting of attention. Q J Exp Psychol. 1980;32:3–25. doi: 10.1080/00335558008248231. [DOI] [PubMed] [Google Scholar]
- Prins N, Kingdom FAA. Palamedes: Matlab routines for analyzing psychophysical data. 2009 http://www.palamedestoolbox.org . [Google Scholar]
- Rihs TA, Michel CM, Thut G. A bias for posterior alpha-band power suppression versus enhancement during shifting versus maintenance of spatial attention. Neuroimage. 2009;44:190–199. doi: 10.1016/j.neuroimage.2008.08.022. [DOI] [PubMed] [Google Scholar]
- Rihs TA, Michel CM, Thut G. Mechanisms of selective inhibition in visual spatial attention are indexed by alpha-band EEG synchronization. Eur J Neurosci. 2007;25:603–610. doi: 10.1111/j.1460-9568.2007.05278.x. [DOI] [PubMed] [Google Scholar]
- Rissman J, Gazzaley A, D'Esposito M. The effect of non-visual working memory load on top-down modulation of visual processing. Neuropsychologia. 2009;47:1637–1646. doi: 10.1016/j.neuropsychologia.2009.01.036. [DOI] [PMC free article] [PubMed] [Google Scholar]
- Romei V, Brodbeck V, Michel C, Amedi A, Pascual-Leone A, Thut G. Spontaneous fluctuations in posterior alpha-band EEG activity reflect variability in excitability of human visual areas. Cereb Cortex. 2008;18:2010–2018. doi: 10.1093/cercor/bhm229. [DOI] [PMC free article] [PubMed] [Google Scholar]
- Romei V, Gross J, Thut G. On the role of prestimulus alpha rhythms over occipito-parietal areas in visual input regulation: correlation or causation? J Neurosci. 2010;30:8692–8697. doi: 10.1523/JNEUROSCI.0160-10.2010. [DOI] [PMC free article] [PubMed] [Google Scholar]
- Romei V, Rihs T, Brodbeck V, Thut G. Resting electroencephalogram alpha-power over posterior sites indexes baseline visual cortex excitability. Neuroreport. 2008;19:203–208. doi: 10.1097/WNR.0b013e3282f454c4. [DOI] [PubMed] [Google Scholar]
- Sauseng P, Klimesch W, Stadler W, Schabus M, Doppelmayr M, Hanslmayr S, Gruber WR, Birbaumer N. A shift of visual spatial attention is selectively associated with human EEG alpha activity. Eur J Neurosci. 2005;22:2917–2926. doi: 10.1111/j.1460-9568.2005.04482.x. [DOI] [PubMed] [Google Scholar]
- Siegel M, Donner TH, Oostenveld R, Fries P, Engel AK. Neuronal synchronization along the dorsal visual pathway reflects the focus of spatial attention. Neuron. 2008;60:709–719. doi: 10.1016/j.neuron.2008.09.010. [DOI] [PubMed] [Google Scholar]
- Silver MA, Ress D, Heeger DJ. Neural correlates of sustained spatial attention in human early visual cortex. J Neurophysiol. 2007;97:229–237. doi: 10.1152/jn.00677.2006. [DOI] [PMC free article] [PubMed] [Google Scholar]
- Snyder AC, Foxe JJ. Anticipatory attentional suppression of visual features indexed by oscillatory alpha-band power increases: a high-density electrical mapping study. J Neurosci. 2010;30:4024–4032. doi: 10.1523/JNEUROSCI.5684-09.2010. [DOI] [PMC free article] [PubMed] [Google Scholar]
- Thut G, Nietzel A, Brandt SA, Pascual-Leone A. Alpha-band electroencephalographic activity over occipital cortex indexes visuospatial attention bias and predicts visual target detection. J Neurosci. 2006;26:9494–9502. doi: 10.1523/JNEUROSCI.0875-06.2006. [DOI] [PMC free article] [PubMed] [Google Scholar]
- Thut G, Schyns P, Gross J. Entrainment of perceptually relevant brain oscillations by non-invasive rhythmic stimulation of the human brain. Front Percept Sci. 2011;2:170. doi: 10.3389/fpsyg.2011.00170. [DOI] [PMC free article] [PubMed] [Google Scholar]
- Thut G, Veniero D, Romei V, Miniussi C, Schyns P, Gross J. Rhythmic TMS causes local entrainment of natural oscillatory signatures. Curr Biol. 2011;21:1176–1185. doi: 10.1016/j.cub.2011.05.049. [DOI] [PMC free article] [PubMed] [Google Scholar]
- Trenner MU, Heekeren HR, Bauer M, Rossner K, Wenzel R, Villringer A, Fahle M. What happens in between? Human oscillatory brain activity related to crossmodal spatial cueing. PLoS One. 2008;3:e1467. doi: 10.1371/journal.pone.0001467. [DOI] [PMC free article] [PubMed] [Google Scholar]
- Ungerleider LG, Mishkin M. Two cortical visual systems. In: Ingle DJ, Goodale MA, Mansfield RJW, editors. Analysis of visual behavior. Cambridge, MA: MIT Press; 1982. pp. 549–586. [Google Scholar]
- van Dijk H, Schoffelen JM, Oostenveld R, Jensen O. Prestimulus oscillatory activity in the alpha band predicts visual discrimination ability. J Neurosci. 2008;28:1816–1823. doi: 10.1523/JNEUROSCI.1853-07.2008. [DOI] [PMC free article] [PubMed] [Google Scholar]
- van Gerven M, Jensen O. Attention modulations of posterior alpha as a control signal for two-dimensional brain-computer interfaces. J Neurosci Methods. 2009;179:78–84. doi: 10.1016/j.jneumeth.2009.01.016. [DOI] [PubMed] [Google Scholar]
- van Veen BD, van Drongelen W, Yuchtman M, Suzuki A. Localization of brain electrical activity via linearly constrained minimum variance spatial filtering. IEEE Trans Biomed Eng. 1997;44:867–880. doi: 10.1109/10.623056. [DOI] [PubMed] [Google Scholar]
- Wandell BA, Dumoulin SO, Brewer AA. Visual field maps in human cortex. Neuron. 2007;56:366–383. doi: 10.1016/j.neuron.2007.10.012. [DOI] [PubMed] [Google Scholar]
- Wilcox RR, Keselman HJ. Modern robust data analysis methods: measures of central tendency. Psychol Methods. 2003;8:254–274. doi: 10.1037/1082-989X.8.3.254. [DOI] [PubMed] [Google Scholar]
- Worden MS, Foxe JJ, Wang N, Simpson GV. Anticipatory biasing of visuospatial attention indexed by retinotopically specific alpha-band electroencephalography increases over occipital cortex. J Neurosci. 2000;20:RC63. doi: 10.1523/JNEUROSCI.20-06-j0002.2000. (1–6) [DOI] [PMC free article] [PubMed] [Google Scholar]
- Wyart V, Tallon-Baudry C. How ongoing fluctuations in human visual cortex predict perceptual awareness: baseline shift versus decision bias. J Neurosci. 2009;29:8715–8725. doi: 10.1523/JNEUROSCI.0962-09.2009. [DOI] [PMC free article] [PubMed] [Google Scholar]
- Wyart V, Tallon-Baudry C. Neural dissociation between visual awareness and spatial attention. J Neurosci. 2008;28:2667–2679. doi: 10.1523/JNEUROSCI.4748-07.2008. [DOI] [PMC free article] [PubMed] [Google Scholar]
- Yamagishi N, Callan DE, Anderson SJ, Kawato M. Attentional changes in pre-stimulus oscillatory activity within early visual cortex are predictive of human visual performance. Brain Res. 2008;1197:115–122. doi: 10.1016/j.brainres.2007.12.063. [DOI] [PubMed] [Google Scholar]
- Yamagishi N, Callan DE, Goda N, Anderson SJ, Yoshida Y, Kawato M. Attentional modulation of oscillatory activity in human visual cortex. Neuroimage. 2003;20:98–113. doi: 10.1016/s1053-8119(03)00341-0. [DOI] [PubMed] [Google Scholar]
- Yamagishi N, Goda N, Callan DE, Anderson SJ, Kawato M. Attentional shifts towards an expected visual target alter the level of alpha-band oscillatory activity in the human calcarine cortex. Brain Res Cogn Brain Res. 2005;25:799–809. doi: 10.1016/j.cogbrainres.2005.09.006. [DOI] [PubMed] [Google Scholar]
- Yantis S, Serences JT. Cortical mechanisms of space-based and object-based attentional control. Curr Opin Neurobiol. 2003;13:187–193. doi: 10.1016/s0959-4388(03)00033-3. [DOI] [PubMed] [Google Scholar]
- Zeki S. The anatomy and physiology of area V6 of macaque monkey visual cortex. J Physiol. 1986;381:P62. [Google Scholar]
- Zeki S, Watson JD, Lueck CJ, Friston KJ, Kennard C, Frackowiak RS. A direct demonstration of functional specialization in human visual cortex. J Neurosci. 1991;11:641–649. doi: 10.1523/JNEUROSCI.11-03-00641.1991. [DOI] [PMC free article] [PubMed] [Google Scholar]
Associated Data
This section collects any data citations, data availability statements, or supplementary materials included in this article.