Abstract
Echogenic liposomes (ELIP) are an excellent candidate for concurrent imaging and drug delivery applications. They combine the advantages of liposomes—biocompatibility and ability to encapsulate both hydrophobic and hydrophilic drugs—with strong reflections of ultrasound. The objective of this study is to perform a detailed in vitro acoustic characterization—including nonlinear scattering that has not been studied before—along with an investigation of the primary mechanism of echogenicity. Both components are critical for developing viable clinical applications of ELIP. Mannitol, a cryoprotectant, added during the preparation of ELIP is commonly believed to be critical in making them echogenic. Accordingly, here ELIP prepared with varying amount of mannitol concentration are investigated for their pressure dependent linear and non-linear scattered responses. The average diameter of these liposomes is measured to be 125–185 nm. But they have a broad size distribution including liposomes with diameters over a micro-meter as observed by TEM and AEM. These larger liposomes are critical for the overall echogenicity. Attenuation through liposomal solution is measured with four different transducers (central frequencies 2.25, 3.5, 5, 10 MHz). Measured attenuation increases linearly with liposome concentration indicating absence of acoustic interactions between liposomes. Due to the broad size distribution, the attenuation shows a flat response without a distinct peak in the range of frequencies (1–12 MHz) investigated. A 15–20 dB enhancement is observed both for the scattered fundamental and the second harmonic responses at 3.5 MHz excitation frequency and 50–800 kPa amplitude. It demonstrates the efficacy of ELIP for fundamental as well as harmonic ultrasound imaging. The scattered response however does not show any distinct subharmonic peak for the acoustic excitation parameters studied. Small amount of mannitol proves critical for echogenicity. However, mannitol variation above 100 mM shows no effect.
Keywords: ultrasound imaging, contrast agents, echogenic, liposomes, attenuation, nonlinear scattering
1. Introduction
Commercially available ultrasound contrast agents are micron sized gas bubbles (1–10 µm in diameter) with a stabilizing encapsulation made of molecules of protein/lipids/surfactants. These microbubble-based agents have also been investigated for drug delivery applications [1–5]. In the past few years, specialized echogenic liposomes (ELIP) have been developed for concurrent imaging and drug delivery [6–9]. However, thorough acoustic investigations to quantify their effectiveness as ultrasound contrast agents have so far been limited. Here, we report an in vitro investigation of attenuation characteristics as well as linear and nonlinear scattered responses of echogenic liposomes prepared following a previously described protocol. Note that nonlinear scattered responses of ELIP have not been studied before—they are critical for harmonic and subharmonic imaging modalities. These modalities promise better contrast-to-tissue ratios than those obtained by conventional imaging in the fundamental mode.
Liposomes are vesicles with a hydrated lipid bilayer encapsulating an aqueous phase. They are spontaneously formed when phospholipids are dispersed in water. The bilayer membrane is formed when the hydrophobic portions of the lipids interact with one another leaving the hydrophilic group directed towards the inner and the outer aqueous phases. Due to their structural similarity with biological cells liposomes have lesser toxicity, longer circulation time in the blood stream and greater uptake by target organs/tissues. These properties make liposomes an ideal candidate for use as drug delivery agents. And since their discovery by Bangham in 1965 [10], they have been extensively studied as agents for delivering drugs and genes to specific sites/organs of the human body. Due to the presence of both hydrophilic and hydrophobic ends of the lipids, liposomes can be simultaneously loaded with both water-soluble and water-insoluble drugs. The water-soluble drugs can be loaded in the inside aqueous phase and water-insoluble drugs in the lipid bilayer [11, 12] . Ultrasound mediated drug release from liposomes has also been studied recently [13–16]. Currently, about 10 liposomal drug formulations are approved by the US Food and Drug Administration for human use [13, 17]
A modified preparation protocol has been developed by Huang et al to render a liposome echogenic. It involves a number of freeze-thaw cycles in presence of a cryoprotectant, mannitol, followed by freeze-dry (lyophilization) and reconstitution [9, 18]. During the freeze-thaw cycles and lyophilization the lipid bilayer develops defects, which later during rehydration trap air [19, 20]. The presence of air inside gives rise to a mismatch in the acoustic impedance, and the air pocket can oscillate under acoustic excitation. Both effects enable these liposomes to generate an echo under acoustic excitation [19]. Therefore, mannitol is believed to play a critical role in ensuring echogenicity of these liposomes. Even though echogenicity of these liposomes is related to the existence of these trapped air pockets, their exact location is not fully ascertained. From energetic considerations, Huang et al hypothesized that these air pockets should be formed within the lipid bilayer near the hydrophobic tails of the lipid molecules [17, 18, 21]. However, they also suggested that air can also be entrapped as a lipid monolayer coated bubble encapsulated within the aqueous core of the liposomes [18]. Huang and co-workers have also measured the total amount of air entrapped in the liposomal solution; it accounts for 10–33% of the liposome volume [21, 22]. Recent TEM images of ELIP prepared by Kopechek et al using the same protocol shows existence of entrapped air pockets [20]. In fact the preparation protocol has also been utilized to encapsulate bioactive gases like nitric oxide [23] and xenon [24]. Echogenic liposomes were found to retain all the properties of normal liposomes [17]. They can be loaded with various therapeutic agents similar to conventional liposomes and used for simultaneous imaging and targeted drug delivery [25–28]. Furthermore, Hitchcock et al demonstrated that echogenic liposomes can nucleate cavitation by lowering the thresholds for both stable and inertial cavitation [29]. Cavitation has been hypothesized as a cause for ultrasound induced increased permeability of the biological membranes [30] that can enhance the drug uptake by tissues [31–33]. Therefore, it is possible to use echogenic liposomes for ultrasound mediated controlled drug and gene delivery. Effects of drug-loading on echogenicity and efficiency of drug delivery by ELIP have been extensively studied [12, 21, 28, 29, 34, 35]. Note that in order to suitably optimize echogenic liposomes based drug-delivery, one would need to carefully investigate the role of ELIP induced cavitation and destruction, as was recently done for lipid coated microbubbles [36].
There have not been many studies of the acoustic behaviors of ELIP, especially their nonlinear scattered response. During design and development of ELIP, echogenicity was tested using a 20 MHz high frequency intravascular US (IVUS) imaging catheter [9, 19, 37, 38]. The mean gray scale values for the region of interest (ROI) were obtained from the videodensitometric analysis of the images. This was used as a measure of echogenicity of the liposomes prepared. However, detailed characterization and understanding of the mechanism of echogenicity can only be achieved through controlled in vitro experiments. In vitro tests so far have been performed by Coussios et al [39] with echogenic liposomes suspended in a solution of PBS mixed with 0.5% bovine serum albumin. They measured both backscattering and attenuation coefficients using a 3.5 MHz lightly focused immersion transducer and compared them with measurements from Optison® bubbles. More recently, the same group has extended the investigation to a broadband frequency dependent attenuation study in the range 3–25 MHz. They also reported backscatter coefficient of 0.011–0.023 (cm str)−1 in the frequency range of 6–30 MHz [20]. Acoustic destruction thresholds of ELIP were also studied in vitro using LI2–5 linear array transducer [40].
Our aim here is to understand the linear and nonlinear acoustic responses from these liposomes including the effects of components in the preparation protocol that are believed to be critical for echogenicity. Towards that goal, here we report the measurement of frequency dependent attenuation coefficient and linear and nonlinear scattered responses of ELIP prepared with varying concentrations of mannitol. Note that nonlinear responses from contrast agents are utilized for harmonic [41, 42] and subharmonic imaging [43−47]. Hence, characterization of nonlinear responses can help in appraising the effectiveness of ELIP for such nonlinear imaging modalities with potentials for higher contrast-to-tissue ratio. Acoustic responses also help in determining the material properties of the encapsulating shells [48, 49], and this approach has recently been extended to ELIP [20].
2. Materials and Methods
2.1 Preparation of Echogenic Liposomes and Reconstitution Procedure
Stock solutions of lipids are prepared by dissolving the lipid powders in chloroform-methanol (9:1) mixture and stored at −20°C. The concentrations are 10 mg/ml for 1,2-dipalmitoyl-sn-glycero-3-phosphocholine (DPPC) and 1 mg/ml for l,2-dipalmitoyl-sn-glycero-3-phospho (l'-rac-glycerol) (DPPG), 1,2-dihexadecanoyl-sn-glycero-3-phosphoethanolamine (DPPE), cholesterol (CH) (Avanti Polar Lipids, Alabaster, AL, USA). The lipids in desired lipid molar ratio (DPPC: DDPG: DPPE: CH in 69:8:8:15) are taken in a 50 ml round bottom flask. The flask is gently shaken to form a uniform solution. A thin lipid film is obtained by evaporating this mixture in a rotary evaporator at 40 °C for about 5–10 minutes. The thin film is then dried in a vacuum desiccator overnight to remove all residual organic solvents. The dry lipid film is hydrated with 3 ml of 0.32 M mannitol (Alfa Aesar, MA, USA) solution. The solution is then sonicated for 10 minutes using a bath sonicator, then frozen at −70 °C for 30 minutes followed by thawing the frozen liposomes to room temperature. This freeze-thaw cycle is repeated 5 times. The frozen liposomes are subsequently lyophilized using a freeze-drying apparatus (Labconco, MO, USA) for 24 h. The lyophilized dry cake of echogenic liposomes is stored at 4 °C until use, when it is reconstituted at desired concentration before an experiment. They are reconstituted in a phosphate buffered saline (PBS) with 0.5% by weight bovine serum albumin (BSA). Appropriate amounts of powder are measured for each experiment and added to 150 ml of the PBS-BSA solution, already poured in the sample chamber to have the desired lipid concentration. Liposomes prepared using 320 mM mannitol has 1 mg of lipids in every 6 mg of lyophilized powder. The PBS-BSA solution is prepared by adding 2.5 g of BSA powder to 500 ml of PBS buffer. The mixture is then thoroughly shaken and kept refrigerated for a minimum of 48 hours before use.
2.2 Measurement of Size Distribution
Particle size distribution (PSD) of ELIP is measured using a dynamic light scattering (DLS) instrument (Malvern Zetasizer Nano-ZS90) controlled with the Zetasizer software (version 6.20). DTS 0012 polystyrene latex disposable sizing cuvettes (RI: 1.59) are used and measurements are performed at a scattering angle of 90°. The lyophilized liposome powder is reconstituted in PBS to give a final concentration of 0.1 mg/ml of liposomes. The cuvette is equilibrated for 120 seconds and 12 readings are then taken for a single measurement at a constant temperature of 25 °C. Each batch of liposome is tested for PSD and each experiment repeated three times to ensure reproducibility of the results obtained.
2.3 Transmission Electron Microscopy
The liposome samples are diluted to 1 mg/mL (total lipid) and dropped onto 300 mesh Formvar coated copper grids previously coated with 0.01% poly-L-lysine and allowed to stand for 1 min before wicking off with filter paper. After air drying for 2 minutes, the samples are stained with 1% phosphotungstic acid for 1.5 minutes and subsequently wicked off with filter paper and allowed to dry before viewing. The samples are observed using a JEOL JEM-100CX-II transmission electron microscope operating at 80 kV.
2.4 Atomic Force Microscopy
The samples are prepared by depositing 200 µL of the solution of ELIP in distilled water followed by air drying. Samples deposited on mica substrates are used for performing the AFM experiments. AFM images are obtained by using a MultiMode™ atomic force microscope equipped with a Nanoscope III a controller and a J-type piezo scanner from Veeco Metrology Group, Santa Barbara, CA. AFM images are taken in tapping mode™. Tips made from antimony(n) doped Si are used for obtaining the images under laboratory conditions.
2.5 Experimental setup to measure attenuation
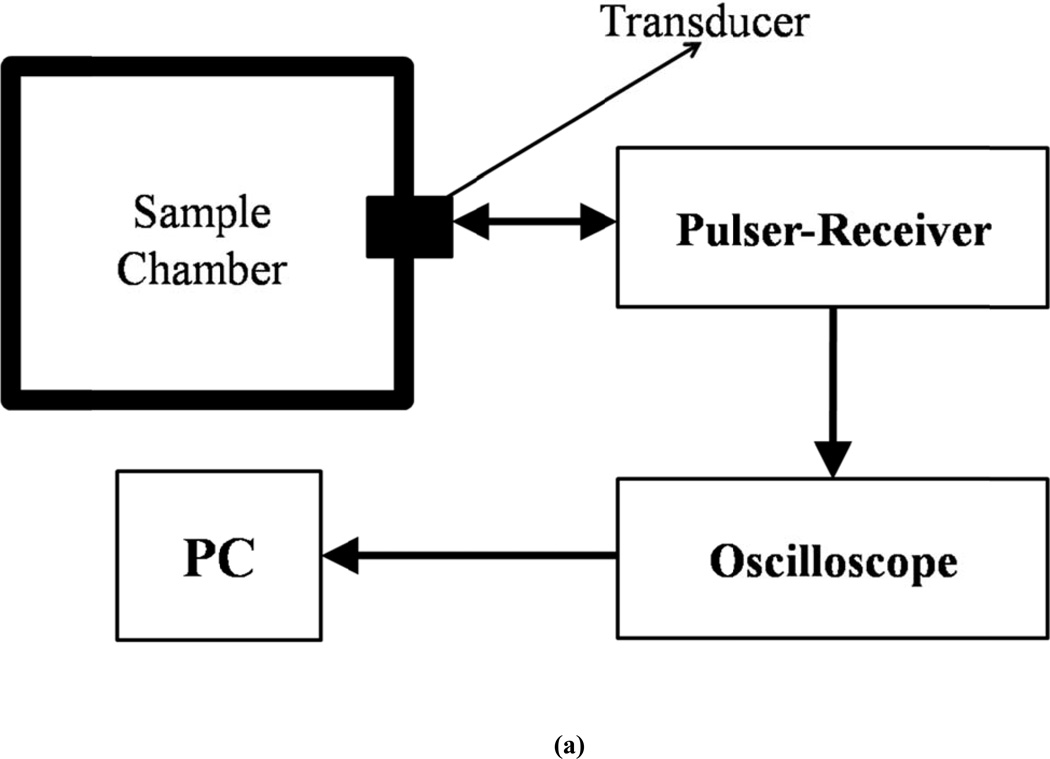
The attenuation setup employs a pulse-echo system (Fig. 1a). A pulser/receiver (Model 5800; Panametrics-NDT, Waltham, MA) is used to excite an unfocused broadband transducer at a PRF of 100 Hz and a pulse duration of 440 ns. Four different broadband transducers are used in transmit-receive mode with center frequencies of 2.25, 3.5, 5 and 10 MHz. The −6dB bandwidths for these transducers are 1.178 to 3.32 MHz, 2.5 to 4.99 MHz, 3.13 to 6.19 MHz and 6.78 to 12.4 MHz. The ultrasound pulse travels through the contrast agent suspension and is reflected back by the back-wall of the chamber. The reflected pulse is received by the same transducer. The total distance traveled by the pulse before being received by the transducer is 12 cm. The received signal is amplified by the pulser/receiver and fed into an oscilloscope (TDS2012, Tektronix, and Beaverton, OR, USA) and saved on a desktop computer using Lab View (Version 6.0.3; National Instruments, Austin, TX) via a GPIB IEEE 488 cable and a GPIB card. Matlab® (Mathworks Inc, Natick, MA, USA) is used for post-processing of the data. 20 voltage-time RF traces acquired in an averaging mode (64 sequences) are saved for the post-processing.
Figure 1.
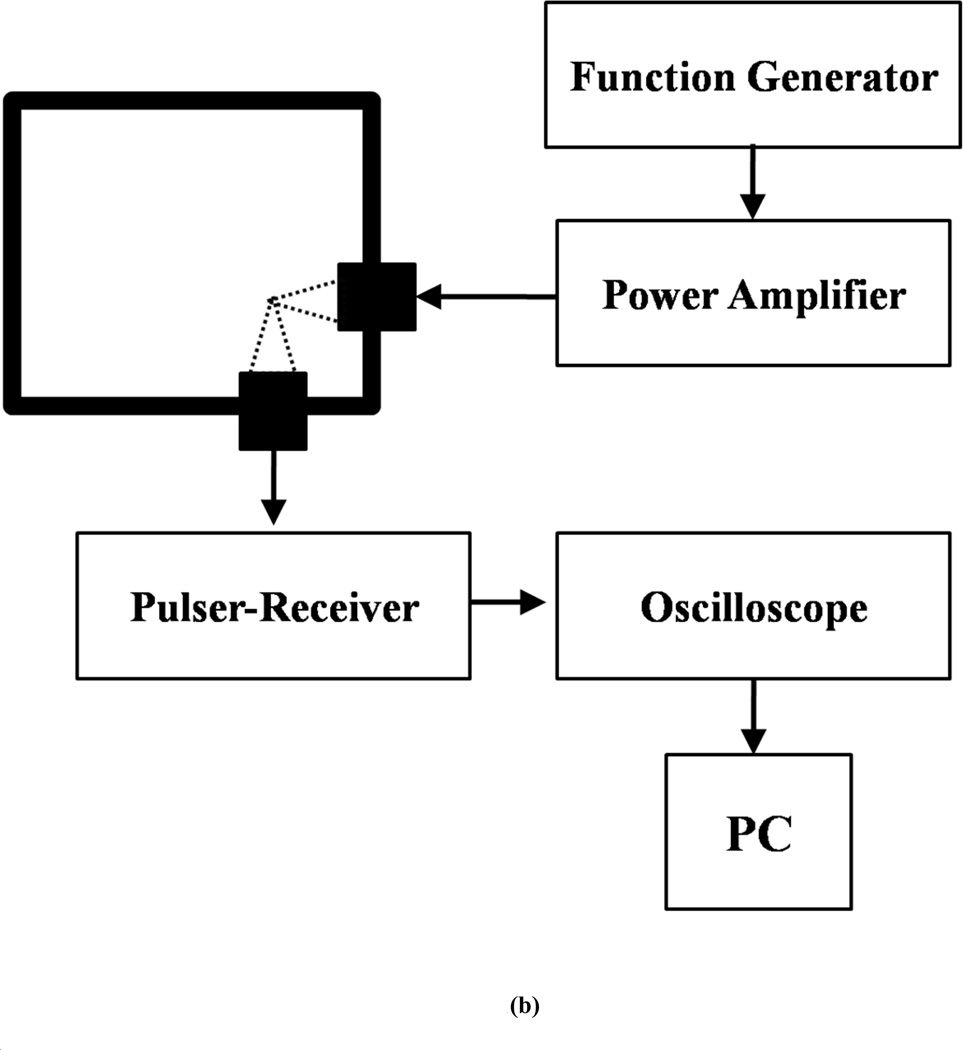
Schematic of the experimental setup for in vitro measurement of (a) attenuation (b) scattering.
2.6 Experimental setup to measure scattering
The acoustic setup used for the current investigation follows the one used previously by us and others to study non-linear scattered responses from contrast microbubbles [49, 50] for the characterization of Sonazoid bubbles (Fig. 1b). Two single element spherically focused transducers with individual diameter of 1.27 cm and focal length of 3 cm are employed. The transmitting transducer is confocally positioned at right angle to the receiving transducer. This arrangement ensures that scattered signals are very similar to backscattered echoes [50] and also gives high spatial resolution [49]. The solution is held in a rectangular chamber with drilled holes on adjacent sides where the transducers are inserted. The chamber requires 150 ml of solution for complete immersion of the transducers. 1.5 mg of lyophilized ELIP powder is weighed and added to the sample chamber containing PBS+BSA solution. The resulting concentration (1.67 µg/ml) is low enough to avoid multiple scattering effects. The transmitting transducers employed have a nominal center frequency of 3.87 MHz (Panametrics-NDT) with a −6dB bandwidth of 86.4 %. The receiving transducer (Panametrics-NDT) is reported to have a center frequency of 5.54 MHz and −6 dB bandwidth of 85 %. A programmable function generator (Model 33250A.; Agilent, Santa Clara, CA) is used to generate sinusoidal waves of varying amplitudes with 32 cycles at 3.5 MHz frequency and at a PRF of 100 Hz. The signal is then amplified by a 55dB RF power amplifier (Model A-300; ENI, Rochester, NY) before being transmitted to the transmitting receiver. The scattered ultrasound is received by the receiving transducer and sent to a pulser/receiver (Model 5800; Panametrics-NDT, Waltham, MA) in receiving mode with a 20 dB gain. Signals are then sent to a digital oscilloscope (Model TDS2012; Tektronix, Beaverton, OR) where they are observed in real time. A sample averaging mode is employed to reduce the noise in both the time and frequency domains. The oscilloscope is also connected to a computer with Lab View (Version 6.0.3; National Instruments, Austin, TX) via a GPIB IEEE 488 cable and a GPIB card. Voltage signals are acquired from the oscilloscope by Lab View and saved for post-experimental analysis using MATLAB (Math Works, Natick, MA). For analysis, fast Fourier Transforms (FFTs) of 50 oscilloscope acquisitions (Hamming-windowed) are averaged in the frequency domain.
2.7 Experimental Procedure and Data Reduction
The buffer (150 ml of PBS+BSA) is introduced into the sample chamber with care so as to avoid formation of air bubbles. The solution is left for 5–10 minutes so that air bubbles can either dissolve (small bubbles) or escape (larger bubbles) to the atmosphere. Control measurements without liposomes are then acquired. An appropriate amount of liposome powder is weighed and added to the solution directly and gently stirred so as to create a homogeneous solution. The solution is then excited with ultrasound pulses and the responses are acquired and saved in the computer.
For attenuation, 20 voltage-time acquisitions are obtained with and without liposomes. A MATLAB code is used to take FFT (Fast Fourier Transform) of each of the voltage time response acquired and then averaged for 20 acquisitions. The attenuation coefficient is then calculated using the following expression
| (1) |
where V̅ref is the averaged response in frequency domain without ELIP in the medium, V̅sig is the averaged response in the frequency domain with ELIP suspended in the medium, and d is the total path traveled by the pulse before it is being received by the transducer.
For scattering a similar technique is used to get the average response in frequency domain (50 voltage time acquisitions are used). The scattered response is converted into a dB scale by taking a unit reference. Responses at frequencies of interest are then appropriately extracted from the resultant data set to find the fundamental, second and sub-harmonic scattered responses.
3. Results and Discussion
3.1 Size Distribution
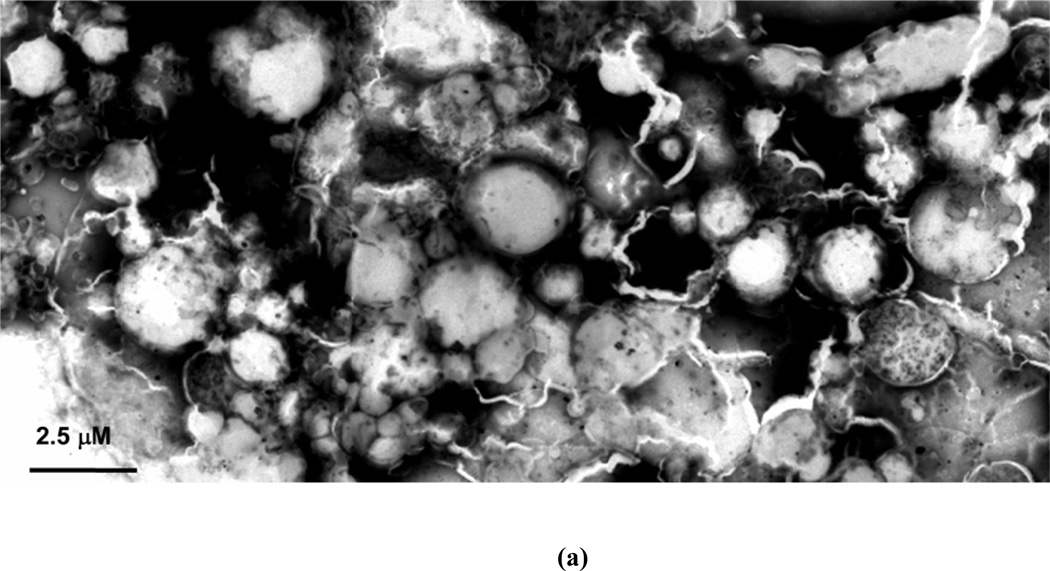
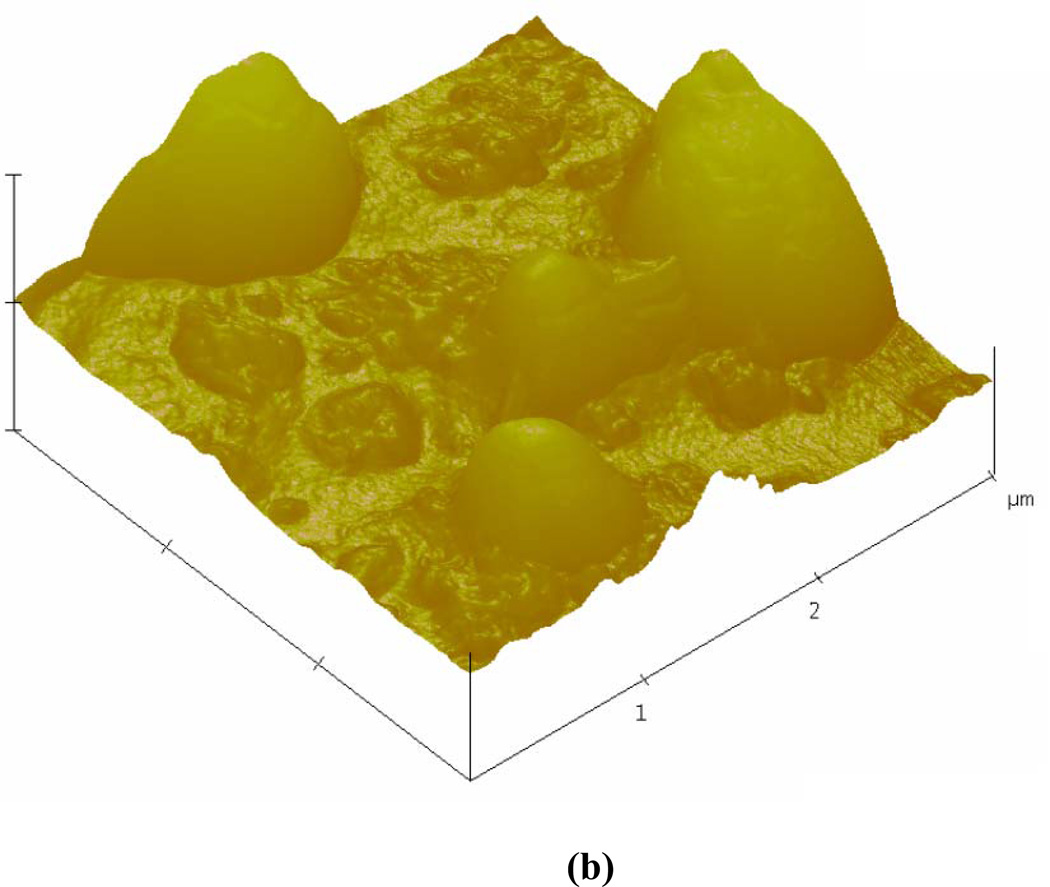
Table 1 shows the intensity averaged diameter, obtained by averaging the radius distribution weighted with the intensity of the scattered light, and the number averaged diameter for the ELIP prepared with varying amounts of mannitol (measured with DLS). The polydispersity from the DLS measurements are also reported in Table 1. The average diameter is 125–185 nm depending on the mannitol concentration. The polydispersity indices are observed to be high (0.63 – 1.0) indicating that the liposomal formulations have a large range of sizes. In order to corroborate these observations, ELIPs prepared with 320 mM mannitol are imaged employing a transmission electron microscope (TEM) and an atomic force microscope (AFM). Although some changes to the vesicular structure are expected under the sample preparation conditions [51], the TEM image (Fig. 2a, magnification: 7900) indicates considerable variations in the size of the liposomes. Similar results were also observed by the AFM imaging studies (Fig. 2b). Both show liposomes with diameters of 1 micron and above. We believe that these larger liposomes (although far less in number compared to those with diameters in the nanometer range) are crucial for the echogenicity observed below. They can contain a large enough air pocket inside the bilayer that oscillates while excited to generate the linear and nonlinear scattered responses.
Table 1.
Average diameter and the polydispersity index of ELIP (as measured by DLS) as a function of mannitol concentration.
| Mannitol Conc. (mM) |
Averaged Diameter (nm) |
Polydispersity Index | |
|---|---|---|---|
| Intensity | Number | ||
| No mannitol | 65±7 | 64±7 | 1.00±0.00 |
| 5 | 1293±474 | 125±14 | 0.63±0.03 |
| 10 | 733±400 | 134±15 | 1.00±0.00 |
| 15 | 640±466 | 122±11 | 1.00±0.00 |
| 50 | 500±65 | 173±31 | 0.72±0.07 |
| 100 | 336±7 | 171±2 | 0.63±0.04 |
| 150 | 512±87 | 185±8 | 0.73±0.09 |
| 200 | 972±129 | 180±14 | 0.86±0.01 |
| 250 | 374±18 | 170±34 | 0.63±0.01 |
| 320 | 459±35 | 152±15 | 0.83±0.07 |
| 350 | 623±12 | 181±14 | 0.85±0.02 |
Figure 2.
(a) TEM (b) AFM images of echogenic liposomes.
3.2 Attenuation
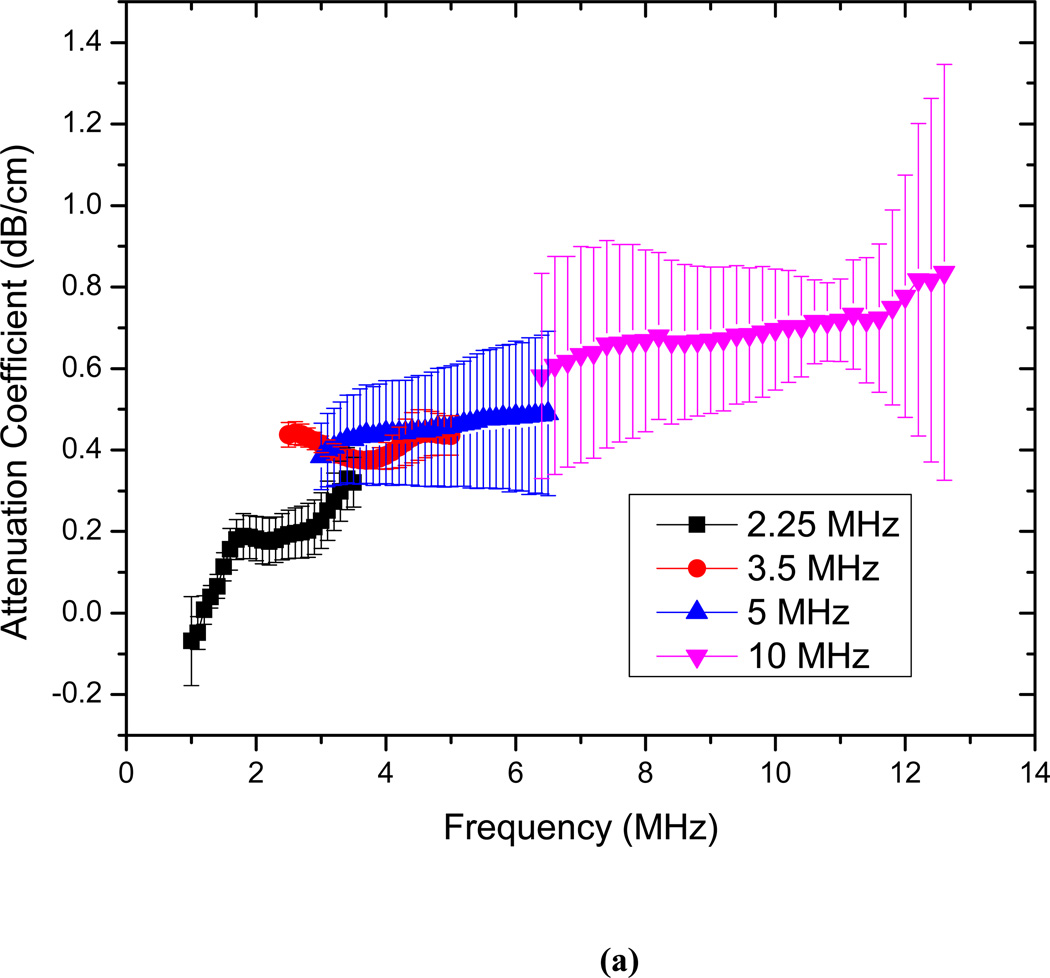
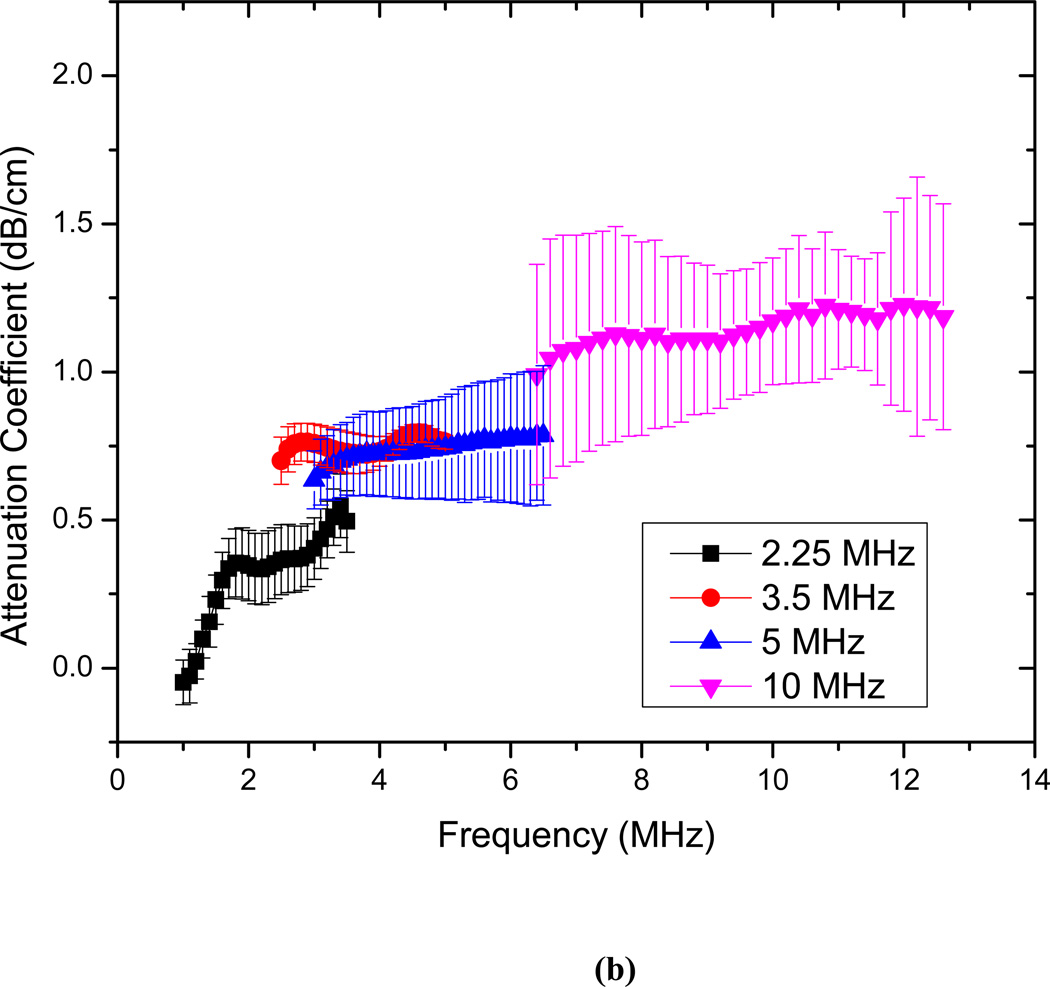
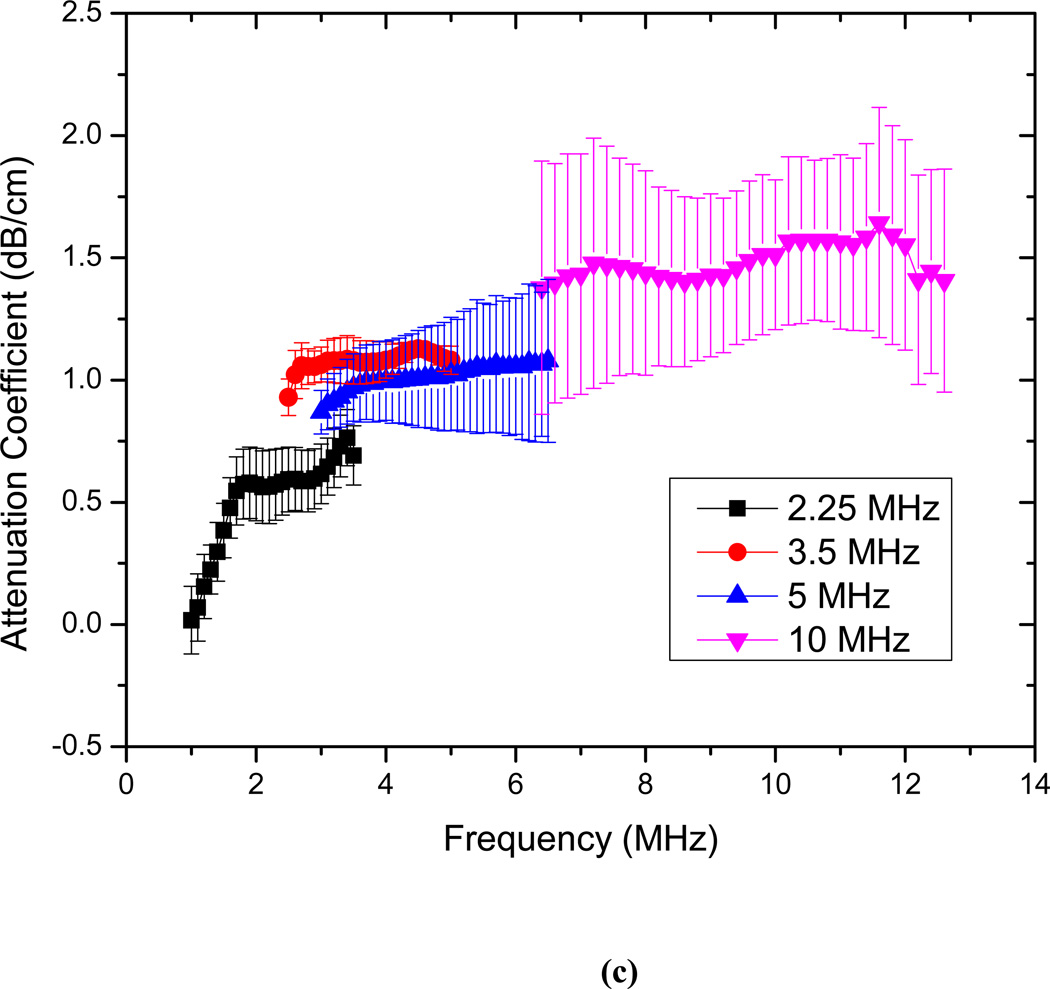
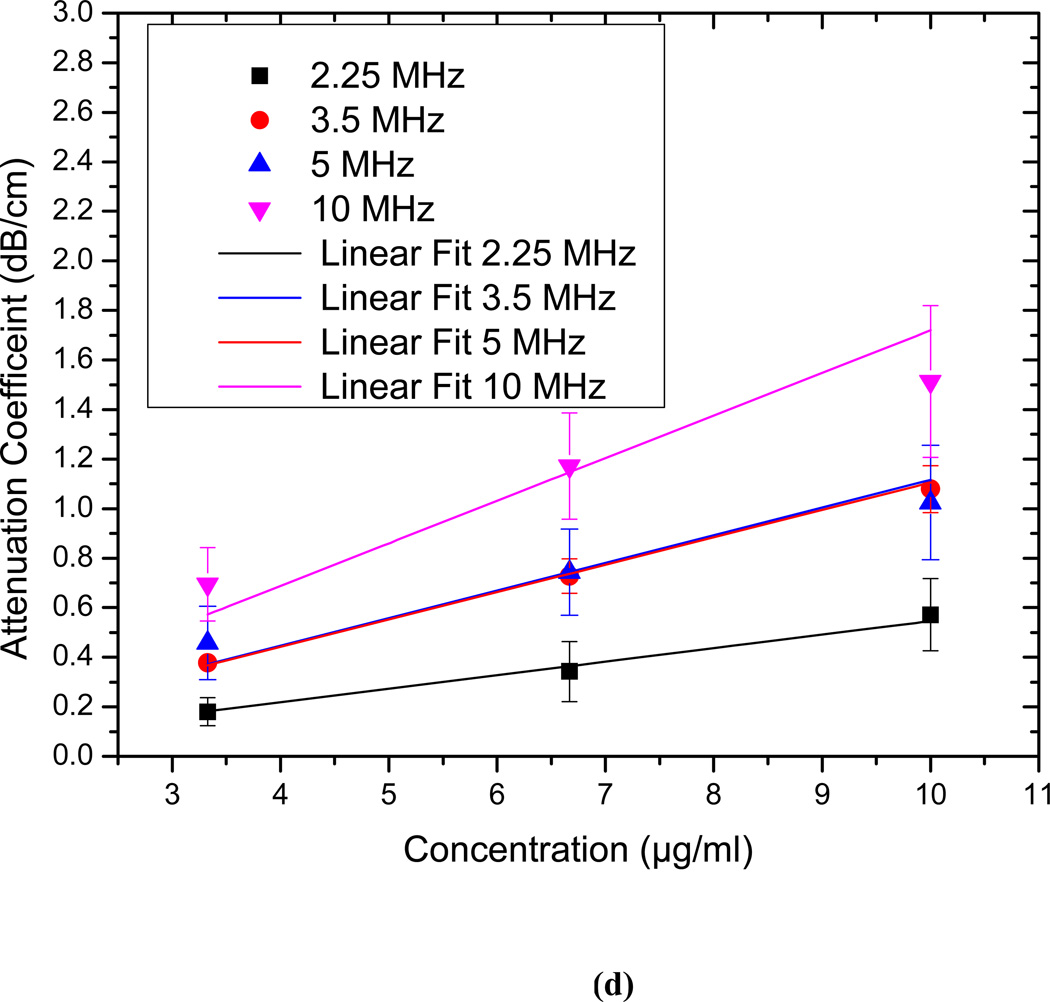
The attenuation measurements are conducted for echogenic liposomes using four different transducers (2.25, 3.5 5 and 10 MHz). The data reduction technique described above is used to generate the frequency dependent attenuation coefficient (Fig. 3). The attenuation coefficient is plotted for each transducer within its bandwidth. Attenuation coefficients are measured for three different concentrations of 3.33 µg/ml, 6.67 µg/ml and 10 µg/ml of lipids in the solution (Fig. 3a–c). The data obtained with different transducers match in the region of overlapping frequencies. The frequency dependent attenuation coefficient shows a continuous increase with increasing frequency for frequencies lower than 5MHz. Beyond 5 MHz the frequency dependent attenuation curves show a flat response. For the entire range of frequencies (1–12 MHz) the attenuation curve does not show any peak. A peak in attenuation for a suspension of conventional contrast agents indicates the resonance frequency for the encapsulated contrast microbubbles. Note that a free bubble with a diameter of 150 nm (average diameter of these liposomes) has a resonance frequency ~ 40 MHz. Typically an air pocket of this size within a liposome would have an even larger resonance frequency because of the increased elasticity of the part of the bilayer. Therefore it would lead to very little acoustic response in the range investigated here. However, note that the large polydispersity indices reported above indicate a broad size distribution including diameters over a micron (Fig. 2 clearly shows liposomes of diameter ~2µm). We believe that the attenuation and scattered responses from the liposomal solution are primarily due to the air pockets entrapped in these larger liposomes. Note also that, for a broad distribution with sizes predominantly at the sub-micron level, attenuation is expected to show increase and then gradual flattening at higher frequencies. Experimental measurements of attenuation coefficients in Definity™ by Goertz et al. [52] showed that for a broader size distribution, the attenuation curve is flatter in comparison to the response from a manipulated bubble population with a sharper cut-off in size distribution. Experimental observations by Gong et al. [53] using lipid coated microbubbles also showed that as the size distribution becomes broader, the attenuation curve tends to be wider and flatter, with a less distinct peak. Fig. 3(d) shows that the attenuation at the central frequency for each transducer increases linearly with concentration. This indicates that for the lipid concentrations used, resulting liposome concentration is dilute enough, that multiple scattering effects are negligible. Therefore, the analysis employed to obtain the attenuation data is correct. We conclude that the attenuation is primarily due to the larger liposomes, and lack of a peak in the spectra is due to the broad size distribution.
Figure 3.
Frequency dependent attenuation coefficient of echogenic liposomes measured with four different transducers (2.25, 3.5, 5, 10 MHz) and plotted within their respective −6 dB bandwidth for lipid concentrations of (a) 3.33µg/ml (b) 6.67 µg/ml and (c) 10µg/ml. Data averaged for 5 different samples, (d) Attenuation coefficient at the central frequencies of the four transducers as a function of lipid concentration.
3.3 Scattering
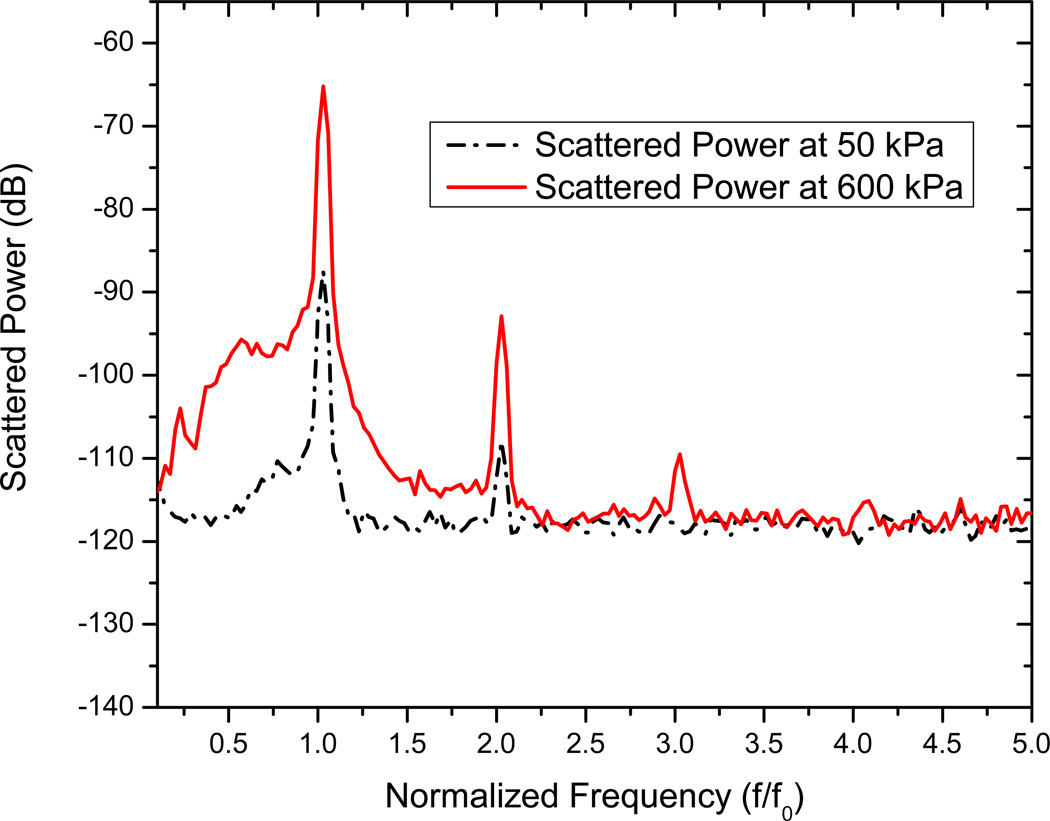
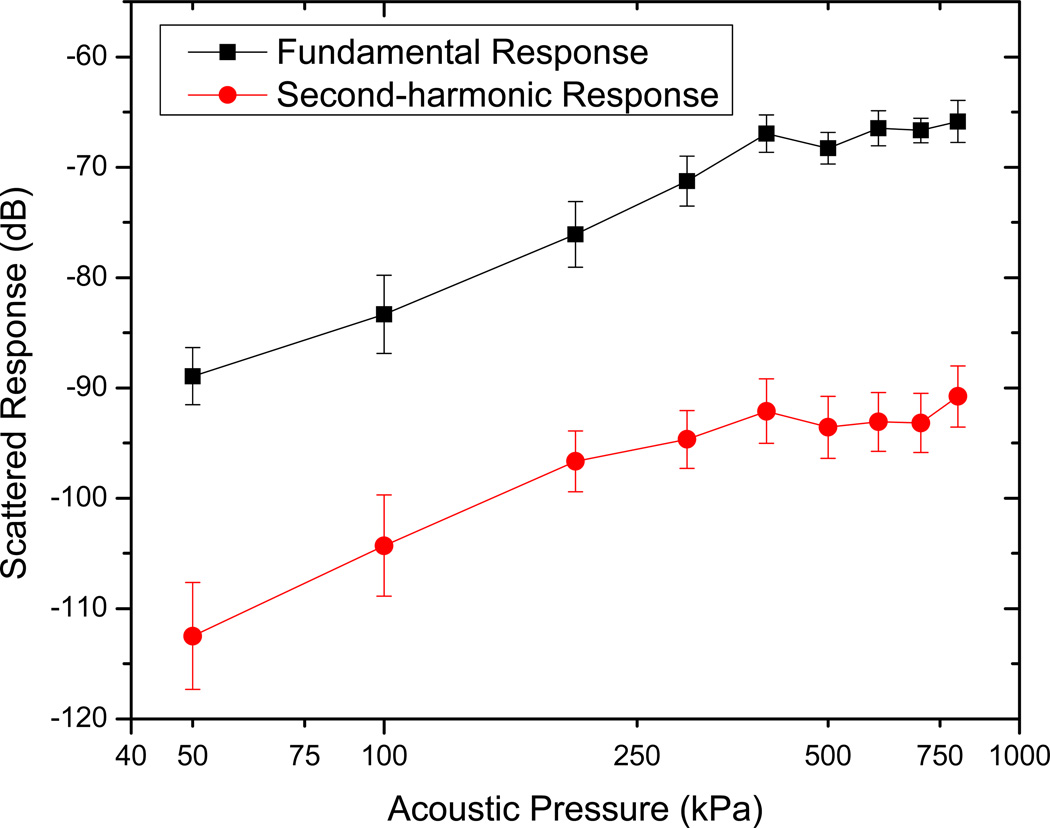
Scattering measurements are acquired for an excitation frequency of 3.5 MHz using the setup described. The scattered response from contrast microbubbles depends strongly on the acoustic pressure amplitude, indicating a non-linear response [49, 50, 54]. Five sets of measurements are acquired for each of the acoustic pressure amplitudes. In Fig. 4, we show the FFT of the scattered response from ELIP for two different acoustic excitations—50 kPa and 600 kPa. Note that only the data corresponding to the higher pressure has a distinct third harmonic contribution. However, even at the higher pressure, we do not see a distinct subharmonic peak, in contrast to what has been observed for conventional contrast agents used in sub-harmonic imaging [49, 54, 55]. The mean of five data sets and the corresponding standard deviations are then plotted in Fig. 5. The fundamental response shows around 15–20 dB enhancement over the data without liposomes. It also shows a consistent increase (linear in the log-log plot) with increasing acoustic excitation amplitude until 400kPa. Beyond this pressure, the response starts to saturate, indicating possible liposomal destruction at these higher acoustic excitations. The second harmonic response also shows similar enhancement, increasing linearly till acoustic pressure amplitude of 400 kPa, and then saturation. In view of the absence of subharmonic peak, ELIP might not be suitable for non-destructive subharmonic imaging applications. However, these liposomes are clearly echogenic with a 15–20 dB enhancement in signal over control (see also Fig. 6 below). Ordinary liposomes with an aqueous interior are not echogenic. We believe that the echogenicity of these liposomes is primarily due to the air entrapped in the bilayer of the liposomes with diameters larger than one micrometer (Fig. 2).
Figure 4.
FFT of the scattered signal from liposomes for acoustic pressure amplitudes 50 kPa and 600 kPa.
Figure 5.
Measured scattered response from echogenic liposomes at fundamental and second harmonic frequencies.
Figure 6.
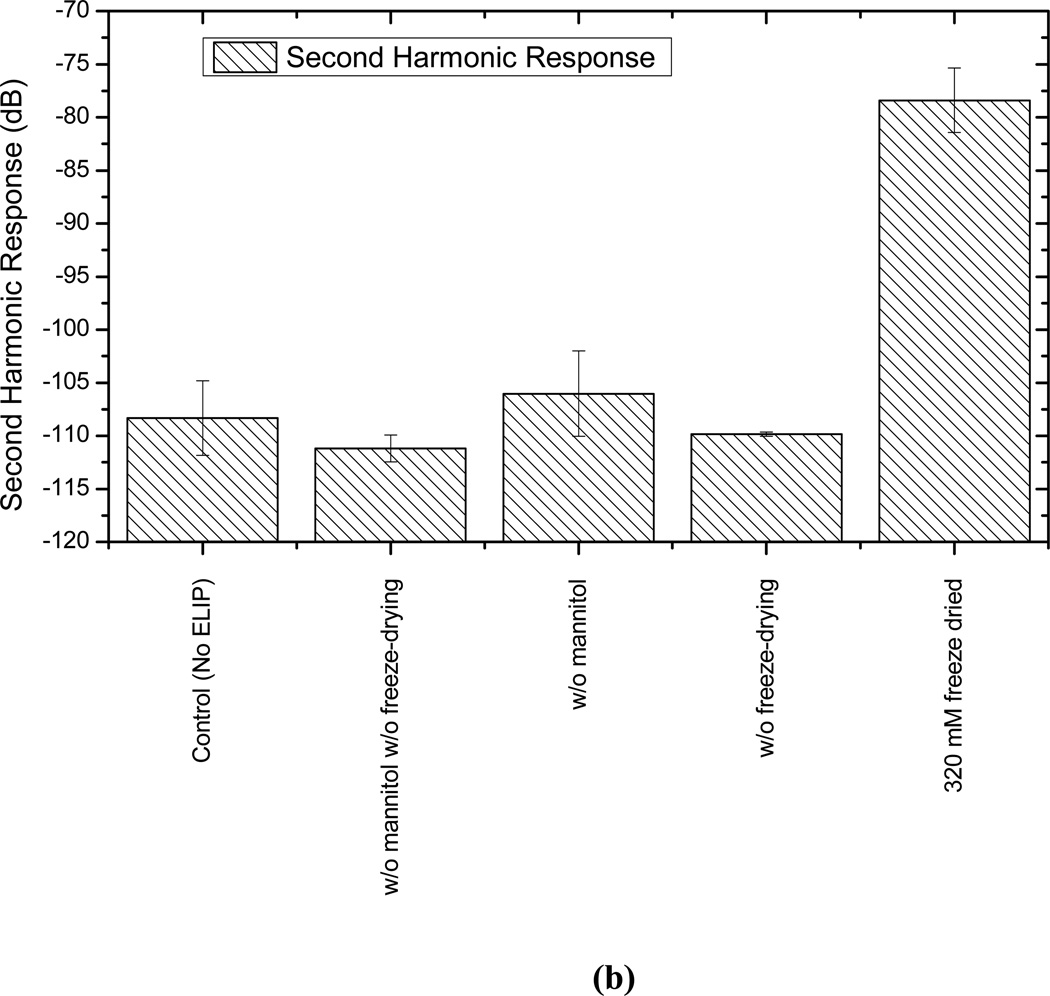
Scattered response from liposomes prepared with and without mannitol and with and without freeze-drying (lyophilization) at (a) fundamental and (b) second harmonic frequencies and at an acoustic excitation of 500 kPa and 3.5 MHz.
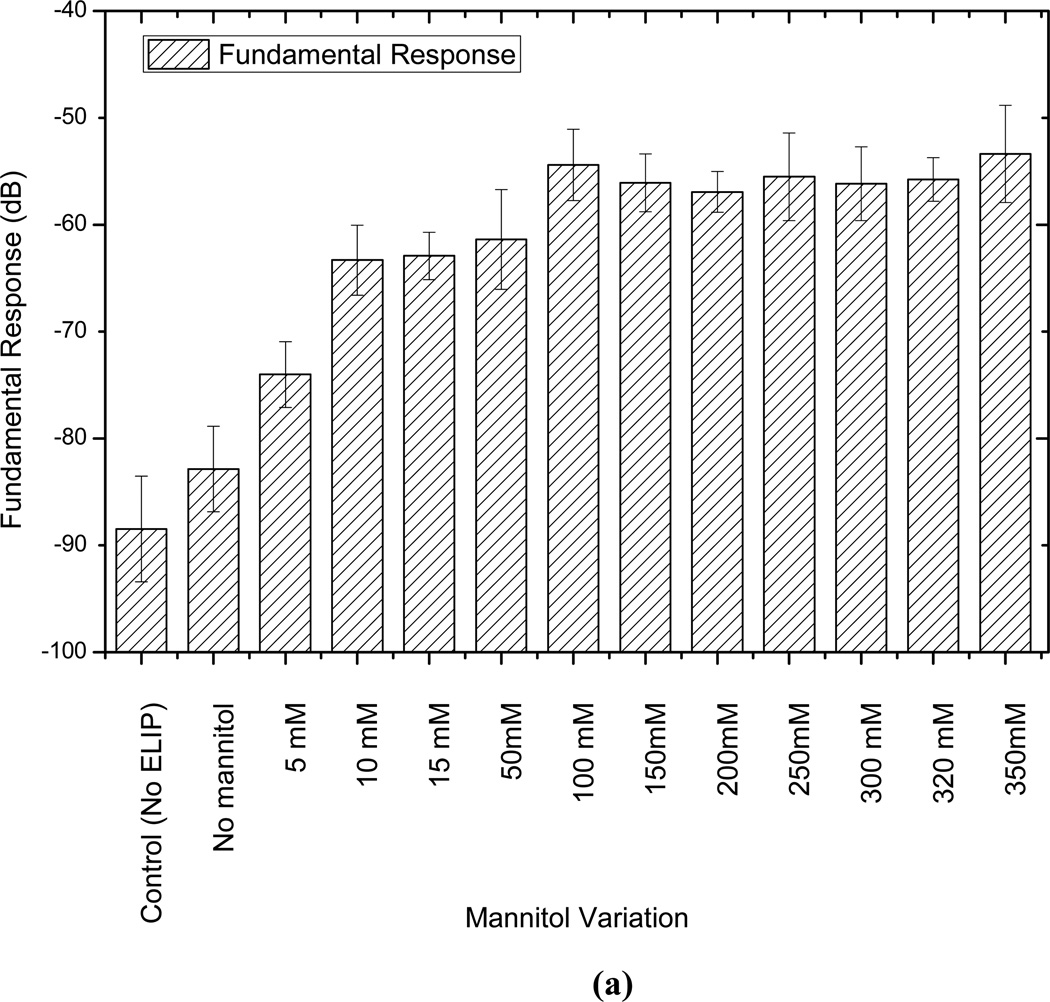
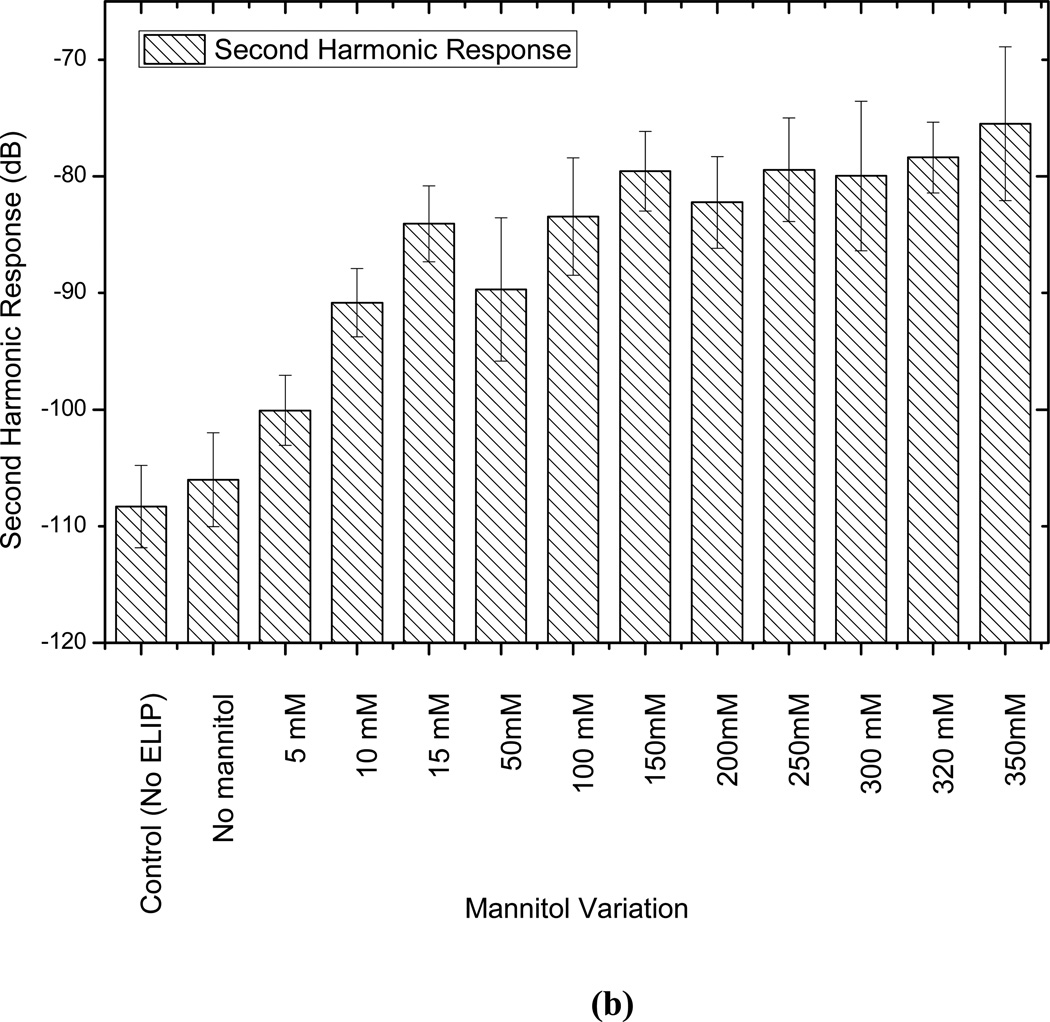
Mannitol and lyophilization are reported to play critical roles in the echogenicity of these liposomes [9, 18, 19]. In an effort to have a better understanding of their role and to determine the optimal concentration of mannitol, liposomes are prepared without lypophilization and with varying amounts of mannitol (0 mM to 350 mM), and then tested for echogenicity. Note that such studies have been performed before for echogenic liposomes, with a different chemical composition, using an IVUS catheter [7, 9, 21]. While one of the previous studies showed existence of an optimal mannitol concentration [9], another showed consistent monotonic increase of echogenicity with increasing mannitol content [21]. It has been reported that mannitol content also affects the encapsulation efficiency [21]. The adopted mannitol concentration of 320 mM for most of our studies was reported to be the optimal concentration for both echogenicity and encapsulation efficiency [18, 37]. Also note that here we investigate the effects of mannitol concentration variation on the nonlinear (second harmonic) response that has not been investigated before. Fig. 6 plots the fundamental and second harmonic responses from liposomes prepared with four different formulations: with and without freeze-drying (lyophilization), and with and without mannitol added during preparation. It shows that without freeze-drying and mannitol addition, liposomes are not echogenic. In Fig. 7, responses from liposomes prepared with different mannitol concentrations are shown. Lipid concentration used in all cases is 10 µg/ml. Both fundamental and second harmonic responses from ELIP prepared with increasing concentrations of mannitol show increasing response till 50 mM, but above 100 mM, they show very little variation. The response from liposomes prepared without mannitol is the same as the control. Therefore, we conclude that a finite nonzero amount (~100 mM) of mannitol is required for ensuring sufficient echogenicity. Note that lack of echogenicity without the lyophilization/reconstitution step in the preparation protocol has also been observed previously [19]
Figure 7.
Comparison of scattered response from echogenic liposomes prepared with different amounts of mannitol at (a) fundamental and (b) second harmonic frequencies and at an acoustic excitation of 500 kPa and 3.5 MHz.
4. Summary
Echogenic liposomes prepared using a previously published technique are experimentally examined. The average diameter of these liposomes, measured using dynamic light scattering, is found to be 125–185 nm. However, the large polydispersity also indicates a broad size distribution. More specifically, TEM and AFM studies indicate many liposomes with diameters of 1–2 µm. Both frequency dependent attenuation and excitation dependent nonlinear scattered responses are measured. Attenuation of 0.1–0.7 dB/cm is measured in a liposomal solution containing 3.33µg/mL of lipids using four transducers with central frequencies 2.25, 3.5, 5, 10 MHz. The data show an increase and later saturation with frequency but no clear peak. Such a data is consistent with the broad size distribution of these liposomes. The scattered response shows a 15–20 dB enhancement of fundamental and second harmonic responses demonstrating conclusively that the liposomes are echogenic. Therefore, they are suitable for fundamental as well as harmonic imaging applications. However, no subharmonic response is found. We believe that the attenuation and the fundamental and harmonic responses are generated by larger liposomes (diameter > 1 µm) that are shown to be present in the size distribution. They entrap air in the lipid bilayer during the specialized preparation protocol.
Mannitol is thought to be of critical importance as a weak cryoprotectant to ensure rupture in the lipid film entrapping air and thereby making liposomes echogenic [19]. Here, by measuring scattered responses from liposomes prepared with varying mannitol concentrations (0–350 mM), we demonstrate that a low but finite amount of mannitol (~100 mM) is critical for ensuring echogenicity. Lyophilization is also critical since without it liposomes are found to be nonechogenic.
Highlights.
Average liposome diameter is 125–185 nm, but includes sizes of over l µm.
No peak in attenuation over 1–12 MHz, due to a broad size distribution.
Generates 15–20 dB increase in fundamental and 2nd harmonic scattered responses.
Small amount mannitol is critical for trapping air and resulting echogenicity.
Liposomes without lyophilization/rehydration step are not echogenic.
Acknowledgements
KS and SP acknowledge helpful discussions about the preparation of echogenic liposomes with Shao-Ling Huang of University of Texas Health Center. They have also immensely benefitted by close interactions with Dr. Christy Holland and her group at University of Cincinnati, especially Jonathan Kopechek. The authors thank the comments of one of the reviewers for significantly sharpening the focus of the paper. The research was partially supported by DMR-1005283, NIH Grant No. P20RR016472 to KS and NIH grant 1R01 CA 132034 and NSF grant DMR 1005011 to SM.
Footnotes
Publisher's Disclaimer: This is a PDF file of an unedited manuscript that has been accepted for publication. As a service to our customers we are providing this early version of the manuscript. The manuscript will undergo copyediting, typesetting, and review of the resulting proof before it is published in its final citable form. Please note that during the production process errors may be discovered which could affect the content, and all legal disclaimers that apply to the journal pertain.
References
- 1.Bekeredjian R, Grayburn PA, Shohet RV. Use of ultrasound contrast agents for gene or drug delivery in cardiovascular medicine. Journal of the American College of Cardiology. 2005;45:329–335. doi: 10.1016/j.jacc.2004.08.067. [DOI] [PubMed] [Google Scholar]
- 2.Ferrara K, Pollard R, Ferrara K, Borden M. Ultrasound microbubble contrast agents: Fundamentals and application to gene and drug delivery. Annual Review of Biomedical Engineering. 2007;9:415–447. doi: 10.1146/annurev.bioeng.8.061505.095852. [DOI] [PubMed] [Google Scholar]
- 3.Lindner JR. Microbubbles in medical imaging: current applications and future directions. Nature Reviews Drug Discovery. 2004;3:527–532. doi: 10.1038/nrd1417. [DOI] [PubMed] [Google Scholar]
- 4.Bull JL. The application of microbubbles for targeted drug delivery. Expert Opinion on Drug Delivery. 2007;4:475–493. doi: 10.1517/17425247.4.5.475. [DOI] [PubMed] [Google Scholar]
- 5.Unger EC, Porter T, Culp W, Labell R, Matsunaga T, Zutshi R. Therapeutic applications of lipid-coated microbubbles. Advanced Drug Delivery Reviews. 2004;56:1291–1314. doi: 10.1016/j.addr.2003.12.006. [DOI] [PubMed] [Google Scholar]
- 6.AlkanOnyuksel H, Demos SM, Lanza GM, Vonesh MJ, Klegerman ME, Kane BJ, Kuszak J, McPherson DD. Development of inherently echogenic liposomes as an ultrasonic contrast agent. Journal of Pharmaceutical Sciences. 1996;85:486–490. doi: 10.1021/js950407f. [DOI] [PubMed] [Google Scholar]
- 7.Hamilton AJ, Huang SL, Warnick D, Rabbat M, Kane B, Nagaraj A, Klegerman M, McPherson DD. Intravascular ultrasound molecular Imaging of atheroma components in vivo. Journal of the American College of Cardiology. 2004;43:453–460. doi: 10.1016/j.jacc.2003.07.048. [DOI] [PubMed] [Google Scholar]
- 8.Unger E, Shen DK, Fritz T, Lund P, Wu GL, Kulik B, Deyoung D, Standen J, Ovitt T, Matsunaga T. Gas-Filled Liposomes as Echocardiographic Contrast Agents in Rabbits with Myocardial Infarcts. Invest Radiol. 1993;28:1155–1159. doi: 10.1097/00004424-199312000-00015. [DOI] [PubMed] [Google Scholar]
- 9.Huang SL, Hamilton AJ, Nagaraj A, Tiukinhoy SD, Klegerman ME, McPherson DD, MacDonald RC. Improving ultrasound reflectivity and stability of echogenic liposomal dispersions for use as targeted ultrasound contrast agents. Journal of Pharmaceutical Sciences. 2001;90:1917–1926. doi: 10.1002/jps.1142. [DOI] [PubMed] [Google Scholar]
- 10.Bangham AD, Standish MM, Watkins JC. Diffusion of Univalent Ions across Lamellae of Swollen Phospholipids. Journal of Molecular Biology. 1965;13 doi: 10.1016/s0022-2836(65)80093-6. 238-&. [DOI] [PubMed] [Google Scholar]
- 11.Nii T, Ishii F. Encapsulation efficiency of water-soluble and insoluble drugs in liposomes prepared by the microencapsulation vesicle method. Int J Pharm. 2005;298:198–205. doi: 10.1016/j.ijpharm.2005.04.029. [DOI] [PubMed] [Google Scholar]
- 12.Kopechek JA, Abruzzo TM, Wang B, Chrzanowski DAB, Smith SM, Kee PH, Huang S, Collier JH, McPherson DD, Holland CK. Ultrasound-Mediated Release of Hydrophilic and Lipophilic Agents From Echogenic Liposomes. Journal of Ultrasound in Medicine. 2008;27:1597–1606. doi: 10.7863/jum.2008.27.11.1597. [DOI] [PMC free article] [PubMed] [Google Scholar]
- 13.Lian T, Ho RJY. Trends and developments in liposome drug delivery systems. Journal of Pharmaceutical Sciences. 2001;90:667–680. doi: 10.1002/jps.1023. [DOI] [PubMed] [Google Scholar]
- 14.Zhang L, Gu FX, Chan JM, Wang AZ, Langer RS, Farokhzad OC. Nanoparticles in medicine: Therapeutic applications and developments. Clin Pharmacol Ther. 2008;83:761–769. doi: 10.1038/sj.clpt.6100400. [DOI] [PubMed] [Google Scholar]
- 15.Torchilin VP. Recent advances with liposomes as pharmaceutical carriers. Nat Rev Drug Discov. 2005;4:145–160. doi: 10.1038/nrd1632. [DOI] [PubMed] [Google Scholar]
- 16.Moghimi SM, Szebeni J. Stealth liposomes and long circulating nanoparticles: critical issues in pharmacokinetics, opsonization and protein-binding properties. Prog Lipid Res. 2003;42:463–478. doi: 10.1016/s0163-7827(03)00033-x. [DOI] [PubMed] [Google Scholar]
- 17.Huang SL. Liposomes in ultrasonic drug and gene delivery. Advanced Drug Delivery Reviews. 2008;60:1167–1176. doi: 10.1016/j.addr.2008.03.003. [DOI] [PubMed] [Google Scholar]
- 18.Huang SL, McPherson DB, MacDonald RC. A method to co-encapsulate gas and drugs in liposomes for ultrasound-controlled drug delivery. Ultrasound in Medicine and Biology. 2008;34:1272–1280. doi: 10.1016/j.ultrasmedbio.2008.01.005. [DOI] [PMC free article] [PubMed] [Google Scholar]
- 19.Huang SL, Hamilton AJ, Pozharski E, Nagaraj A, Klegerman ME, McPherson DD, MacDonald RC. Physical correlates of the ultrasonic reflectivity of lipid dispersions suitable as diagnostic contrast agents. Ultrasound in Medicine and Biology. 2002;28:339–348. doi: 10.1016/s0301-5629(01)00512-9. [DOI] [PubMed] [Google Scholar]
- 20.Kopechek JA, Haworth KJ, Raymond JL, Douglas Mast T, Perrin SR, Klegerman ME, Huang S, Porter TM, McPherson DD, Holland CK. Acoustic characterization of echogenic liposomes: Frequency-dependent attenuation and backscatter. J Acoust Soc Am. 2011;130:3472. doi: 10.1121/1.3626124. [DOI] [PMC free article] [PubMed] [Google Scholar]
- 21.Huang SL, MacDonald RC. Acoustically active liposomes for drug encapsulation and ultrasound-triggered release. Biochimica Et Biophysica Acta-Biomembranes. 2004;1665:134–141. doi: 10.1016/j.bbamem.2004.07.003. [DOI] [PubMed] [Google Scholar]
- 22.Huang SL, McPherson DD, Macdonald RC. A method to co-encapsulate gas and drugs in liposomes for ultrasound-controlled drug delivery. Ultrasound Med Biol. 2008;34:1272–1280. doi: 10.1016/j.ultrasmedbio.2008.01.005. [DOI] [PMC free article] [PubMed] [Google Scholar]
- 23.Huang SL, Kee PH, Kim H, Moody MR, Chrzanowski SM, Macdonald RC, McPherson DD. Nitric oxide-loaded echogenic liposomes for nitric oxide delivery and inhibition of intimal hyperplasia. Journal of the American College of Cardiology. 2009;54:652–659. doi: 10.1016/j.jacc.2009.04.039. [DOI] [PMC free article] [PubMed] [Google Scholar]
- 24.Britton GL, Kim H, Kee PH, Aronowski J, Holland CK, McPherson DD, Huang SL. In vivo therapeutic gas delivery for neuroprotection with echogenic liposomes. Circulation. 2010;122:1578–1587. doi: 10.1161/CIRCULATIONAHA.109.879338. [DOI] [PMC free article] [PubMed] [Google Scholar]
- 25.Huang SL, Hamilton AJ, Tiukinhoy SD, Nagaraj A, Kane BJ, Klegerman M, cPherson DD, MacDonald RC. Liposomes as ultrasound imaging contrast agents and as ultrasound-sensitive drug delivery agents. Cellular & Molecular Biology Letters. 2002;7:233–235. [PubMed] [Google Scholar]
- 26.Kheirolomoom A, Dayton PA, Lum AFH, Little E, Paoli EE, Zheng HR, Ferrara KW. Acoustically-active microbubbles conjugated to liposomes: Characterization of a proposed drug delivery vehicle. Journal of Controlled Release. 2007;118:275–284. doi: 10.1016/j.jconrel.2006.12.015. [DOI] [PMC free article] [PubMed] [Google Scholar]
- 27.Suzuki R, Takizawa T, Negishi Y, Hagisawa K, Tanaka K, Sawamura K, Utoguchi N, Nishioka T, Maruyama K. Gene delivery by combination of novel liposomal bubbles with perfluoropropane and ultrasound. Journal of Controlled Release. 2007;117:130–136. doi: 10.1016/j.jconrel.2006.09.008. [DOI] [PubMed] [Google Scholar]
- 28.Tiukinhoy-Laing SD, Huang SL, Klegerman M, Holland CK, McPherson DD. Ultrasound-facilitated thrombolysis using tissue-plasminogen activator-loaded echogenic liposomes. Thrombosis Research. 2007;119:777–784. doi: 10.1016/j.thromres.2006.06.009. [DOI] [PMC free article] [PubMed] [Google Scholar]
- 29.Hitchcock KE, Caudell DN, Sutton JT, Klegerman ME, Vela D, Pyne-Geithman GJ, Abruzzo T, Cyr PEP, Geng YJ, McPherson DD, Holland CK. Ultrasound-enhanced delivery of targeted echogenic liposomes in a novel ex vivo mouse aorta model. Journal of Controlled Release. 2010;144:288–295. doi: 10.1016/j.jconrel.2010.02.030. [DOI] [PMC free article] [PubMed] [Google Scholar]
- 30.Ferrara KW. Driving delivery vehicles with ultrasound. Advanced Drug Delivery Reviews. 2008;60:1097–1102. doi: 10.1016/j.addr.2008.03.002. [DOI] [PMC free article] [PubMed] [Google Scholar]
- 31.Brujan EA. The role of cavitation microjets in the therapeutic applications of ultrasound. Ultrasound in Medicine and Biology. 2004;30:381–387. doi: 10.1016/j.ultrasmedbio.2003.10.019. [DOI] [PubMed] [Google Scholar]
- 32.Kodama T, Tomita Y, Koshiyama KI, Blomley MJK. Transfection effect of microbubbles on cells in superposed ultrasound waves and behavior of cavitation bubble. Ultrasound in Medicine and Biology. 2006;32:905–914. doi: 10.1016/j.ultrasmedbio.2006.03.004. [DOI] [PubMed] [Google Scholar]
- 33.Stieger SM, Caskey CF, Adamson RH, Qin SP, Curry FRE, Wisner ER, Ferrara KW. Enhancement of vascular permeability with low-frequency contrast-enhanced ultrasound in the chorioallantoic membrane model. Radiology. 2007;243:112–121. doi: 10.1148/radiol.2431060167. [DOI] [PubMed] [Google Scholar]
- 34.Laing ST, Kim H, Kopechek JA, Parikh D, Huang SL, Klegerman ME, Holland CK, McPherson DD. Ultrasound-mediated delivery of echogenic immunoliposomes to porcine vascular smooth muscle cells in vivo. Journal of Liposome Research. 2010;20:160–167. doi: 10.3109/08982100903218918. [DOI] [PMC free article] [PubMed] [Google Scholar]
- 35.Smith DAB, Vaidya SS, Kopechek JA, Huang SL, Klegerman ME, Mcpherson DD, Holland CK. Ultrasound-Triggered Release of Recombinant Tissue-Type Plasminogen Activator from Echogenic Liposomes. Ultrasound in Medicine and Biology. 2010;36:145–157. doi: 10.1016/j.ultrasmedbio.2009.08.009. [DOI] [PMC free article] [PubMed] [Google Scholar]
- 36.Dicker S, Mleczko M, Schmitz G, Wrenn SP. Determination of microbubble cavitation threshold pressure as function of shell chemistry. Bubble Science, Engineering & Technology. 2010;2:55–64. [Google Scholar]
- 37.Huang SL, Tiukinhoy S, Wang L, MacDonald R, Nagaraj A, McPherson D. Acoustically-active liposomes of novel cationic-anionic composition in conjunction with ultrasound for gene delivery into vascular smooth muscle cells. Molecular Therapy. 2003;7:S167–S167. [Google Scholar]
- 38.Buchanan KD, Huang S, Kim H, Macdonald RC, McPherson DD. Echogenic liposome compositions for increased retention of ultrasound reflectivity at physiologic temperature. Journal of Pharmaceutical Sciences. 2008;97:2242–2249. doi: 10.1002/jps.21173. [DOI] [PMC free article] [PubMed] [Google Scholar]
- 39.Coussios CC, Holland CK, Jakubowska L, Huang SL, MacDonald RC, Nagaraj A, McPherson DD. In vitro characterization of liposomes and Optison (R) by acoustic scattering at 3.5 MHz. Ultrasound in Medicine and Biology. 2004;30:181–190. doi: 10.1016/j.ultrasmedbio.2003.10.015. [DOI] [PMC free article] [PubMed] [Google Scholar]
- 40.Smith DAB, Porter TM, Martinez J, Huang SL, MacDonald RC, McPherson DD, Holland CK. Destruction thresholds of echogenie liposomes with clinical diagnostic ultrasound. Ultrasound in Medicine and Biology. 2007;33:797–809. doi: 10.1016/j.ultrasmedbio.2006.11.017. [DOI] [PubMed] [Google Scholar]
- 41.Frinking PJA, Bouakaz A, Kirkhorn J, Ten Cate FJ, de Jong N. Ultrasound contrast imaging: Current and new potential methods. Ultrasound in Medicine and Biology. 2000;26:965–975. doi: 10.1016/s0301-5629(00)00229-5. [DOI] [PubMed] [Google Scholar]
- 42.Rafter P, Phillips P, Vannan MA. Imaging technologies and techniques. Cardiol Clin. 2004;22:181−+. doi: 10.1016/j.ccl.2004.02.002. [DOI] [PubMed] [Google Scholar]
- 43.Bhagavatheeshwaran G, Shi WT, Forsberg F, Shankar PM. Subharmonic signal generation from contrast agents in simulated neovessels. Ultrasound in Medicine and Biology. 2004;30:199–203. doi: 10.1016/j.ultrasmedbio.2003.10.016. [DOI] [PubMed] [Google Scholar]
- 44.Chomas J, Dayton P, May D, Ferrara K. Nondestructive subharmonic imaging. Ieee Transactions on Ultrasonics Ferroelectrics and Frequency Control. 2002;49:883–892. doi: 10.1109/tuffc.2002.1020158. [DOI] [PubMed] [Google Scholar]
- 45.Forsberg F, Shi WT, Goldberg BB. Subharmonic imaging of contrast agents. Ultrasonics. 2000;38:93–98. doi: 10.1016/s0041-624x(99)00148-1. [DOI] [PubMed] [Google Scholar]
- 46.Krishna PD, Shankar PM, Newhouse VL. Subharmonic generation from ultrasonic contrast agents. Physics in Medicine and Biology. 1999;44:681–694. doi: 10.1088/0031-9155/44/3/004. [DOI] [PubMed] [Google Scholar]
- 47.Shankar PM, Krishna PD, Newhouse VL. Advantages of subharmonic over second harmonic backscatter for contrast-to-tissue echo enhancement. Ultrasound in Medicine and Biology. 1998;24:395–399. doi: 10.1016/s0301-5629(97)00262-7. [DOI] [PubMed] [Google Scholar]
- 48.Paul S, Katiyar A, Sarkar K, Chatterjee D, Shi WT, Forsberg F. Material characterization of the encapsulation of an ultrasound contrast microbubble and its subharmonic response: Strain-softening interfacial elasticity model. Journal of the Acoustical Society of America. 2010;127:3846–3857. doi: 10.1121/1.3418685. [DOI] [PMC free article] [PubMed] [Google Scholar]
- 49.Sarkar K, Shi WT, Chatterjee D, Forsberg F. Characterization of ultrasound contrast microbubbles using in vitro experiments and viscous and viscoelastic interface models for encapsulation. Journal of the Acoustical Society of America. 2005;118:539–550. doi: 10.1121/1.1923367. [DOI] [PubMed] [Google Scholar]
- 50.Shi WT, Forsberg F. Ultrasonic characterization of the nonlinear properties of contrast microbubbles. Ultrasound in Medicine and Biology. 2000;26:93–104. doi: 10.1016/s0301-5629(99)00117-9. [DOI] [PubMed] [Google Scholar]
- 51.Bibi S, Kaur R, Henriksen-Lacey M, McNeil SE, Wilkhu J, Lattmann E, Christensen D, Mohammed AR, Perrie Y. Microscopy imaging of liposomes: From coverslips to environmental SEM. Int J Pharm. 2010 doi: 10.1016/j.ijpharm.2010.12.021. [DOI] [PubMed] [Google Scholar]
- 52.Goertz DE, de Jong N, van der steen AFW. Attenuation and size distribution measurements of definity (TM) and manipulated definity (TM) populations. Ultrasound in Medicine and Biology. 2007;33:1376–1388. doi: 10.1016/j.ultrasmedbio.2007.03.009. [DOI] [PubMed] [Google Scholar]
- 53.Gong Y, Cabodi M, Porter T. Relationship between size and frequency dependent attenuation of monodisperse populations of lipid coated microbubbles. Bubble Science, Engineering & Technology. 2010;2:41–47. [Google Scholar]
- 54.Shi WT, Forsberg F, Hall AL, Chia RY, Liu JB, Miller S, Thomenius KE, Wheatley MA, Goldberg BB. Subharmonic imaging with microbubble contrast agents: Initial results, Ultrasonic Imaging. 1999;21:79–94. doi: 10.1177/016173469902100201. [DOI] [PubMed] [Google Scholar]
- 55.Shankar PM, Krishna PD, Newhouse VL. Subharmonic backscattering from ultrasound contrast agents. Journal of the Acoustical Society of America. 1999;106:2104–2110. doi: 10.1121/1.428142. [DOI] [PubMed] [Google Scholar]


