

Abstract
Aims/hypothesis
Few studies have investigated the relationship between predefined dietary patterns and type 2 diabetes incidence; little is known about the generalisability of these associations. We aimed to assess the association between predefined dietary patterns and type 2 diabetes risk in European populations.
Methods
From among a case-cohort of 12,403 incident diabetes cases and 16,154 subcohort members nested within the prospective European Prospective Investigation into Cancer and Nutrition study, we used data on 9,682 cases and 12,595 subcohort participants from seven countries. Habitual dietary intake was assessed at baseline with country-specific dietary questionnaires. Two diet-quality scores (alternative Healthy Eating Index [aHEI], Dietary Approaches to Stop Hypertension [DASH] score) and three reduced rank regression (RRR)-derived dietary-pattern scores were constructed. Country-specific HRs were calculated and combined using a random-effects meta-analysis.
Results
After multivariable adjustment, including body size, the aHEI and DASH scores were not significantly associated with diabetes, although for the aHEI there was a tendency towards an inverse association in countries with higher mean age. We observed inverse associations of the three RRR-derived dietary-pattern scores with diabetes: HRs (95% CIs) for a 1-SD difference were 0.91 (0.86, 0.96), 0.92 (0.84, 1.01) and 0.87 (0.82, 0.92). Random-effects meta-analyses revealed heterogeneity between countries that was explainable by differences in the age of participants or the distribution of dietary intake.
Conclusions/interpretation
Adherence to specific RRR-derived dietary patterns, commonly characterised by high intake of fruits or vegetables and low intake of processed meat, sugar-sweetened beverages and refined grains, may lower type 2 diabetes risk.
Electronic supplementary material
The online version of this article (doi:10.1007/s00125-013-3092-9) contains peer-reviewed but unedited supplementary material, which is available to authorised users.
Keywords: Alternative Healthy Eating Index, Case-cohort, Dietary Approaches to Stop Hypertension, Dietary patterns, Reduced rank regression, Type 2 diabetes
Introduction
Dietary and lifestyle approaches have a high potential for the primary prevention of type 2 diabetes [1]. In nutritional epidemiology, dietary-pattern analysis has gained particular interest because it reflects the complexity of dietary intake. Two approaches are generally distinguished for defining dietary patterns [2]. The hypothesis-oriented approach defines diet-quality scores based on existing scientific evidence for chronic diseases. Examples include the Healthy Eating Index (HEI) [3], the Diet-Quality Index [4] and the alternative Healthy Eating Index (aHEI) [5]. In contrast, the exploratory approach uses the dietary data at hand, applying statistical methods such as factor analysis or cluster analysis to reveal major prevailing dietary patterns in a study population. Reduced rank regression (RRR) is a mixture of a hypothesis-oriented and an exploratory approach and is aimed at identifying food group combinations that explain a maximum of variation in (disease-related) response variables [6]. Therefore, in addition to the hypothesis-based definition of diet-quality scores, the RRR method may be especially useful in identifying diabetes-related dietary patterns.
One of the most extensively studied diet-quality scores is the Mediterranean dietary-pattern score. Overall, studies suggest that adherence to the Mediterranean dietary pattern is related to lower diabetes risk [7–10]. Besides the Mediterranean dietary pattern, there are a limited number of studies on individual diet-quality scores and diabetes incidence. The few available data suggest that adherence to the aHEI [11], the Dietary Approaches to Stop Hypertension (DASH) diet [12, 13], the HEI [11] and the Overall Nutritional Quality Index (ONQI) [14] may lower diabetes risk. No clear associations were observed for the Recommended Food Score [12], the Diet-Quality Index [15] and diet-quality scores, reflecting guidelines from Germany [16] and Australia [17]. Most of these studies were conducted in American populations [11–15] and it has been suggested that associations may differ between heterogeneous populations such as different ethnic groups [13, 15]. Several RRR-derived dietary patterns have been associated with diabetes risk [18–21], but it is unknown whether these dietary patterns are related to risk in different populations.
We reconstructed selected predefined diet-quality scores (aHEI and DASH), as well as RRR-derived dietary patterns that were originally derived in other populations, and evaluated their association with diabetes incidence in the multi-centre European Prospective Investigation into Cancer and Nutrition (EPIC)-InterAct study. We also assessed the degree of heterogeneity in the associations between countries involved in EPIC.
Methods
EPIC-InterAct study
The EPIC-InterAct study is a case-cohort study nested within the prospective EPIC study [22]. In brief, EPIC includes 521,448 adults aged 25–79 years who were recruited between 1991 and 2000 at 23 centres in ten European countries participating in EPIC [23–25]. In the majority of the EPIC study centres, participants were recruited from the general population, with some exceptions [24]: the French cohort was based on members of a health insurance scheme for teachers; the Italian and Spanish cohorts included blood donors; participants from Utrecht (the Netherlands) and Florence (Italy) were recruited via a breast cancer screening programme; in Oxford (UK) half of the cohort were vegans, lacto-ovo vegetarians or fish eaters, and in France, Norway, Utrecht (the Netherlands) and Naples (Italy) only women were recruited [24]. Each EPIC centre obtained individual written informed consent and local ethics approval.
Within the InterAct project, incident cases of type 2 diabetes occurring in the EPIC cohort were ascertained and verified. All EPIC countries except Norway and Greece contributed to EPIC-InterAct (n = 455,680). Individuals without stored blood (n = 109,625) or without information on reported diabetes status (n = 5,821) were excluded, leaving 340,234 participants eligible for inclusion in EPIC-InterAct (corresponding to 3.99 million person-years follow-up).
Case-cohort construction and case ascertainment
A centre-stratified, random subcohort of 16,835 individuals was selected. After exclusion of 548 individuals with prevalent diabetes and 133 with uncertain diabetes status, the subcohort included 16,154 individuals for analysis. Because of random selection, this subcohort also included a random set of 778 individuals who had developed incident type 2 diabetes during follow-up (Fig. 1).
Fig. 1.

Construction of the EPIC-InterAct case-cohort study and the study population for the present analysis. T2D, type 2 diabetes
Ascertainment of incident type 2 diabetes involved a review of the existing EPIC datasets at each centre using multiple sources of evidence including self-report, linkage to primary-care registers, secondary-care registers, medication use (drug registers), hospital admissions and mortality data. Information from any follow-up visit or external evidence with a date later than the baseline visit was used. Rather than self-report, cases in Denmark and Sweden were identified via local and national diabetes and pharmaceutical registers [26] (www.ssi.dk/Sundhedsdataogit/Registre/Diabetesregisteret.aspx, accessed 11 October 2013) and hence all ascertained cases were considered to be verified. Some cases in centres other than Denmark and Sweden were based on only one source of information. To increase the specificity of the definition for these cases, we sought further evidence including review of individual medical records in some centres. Follow-up was censored at the date of diagnosis, 31 December 2007 or the date of death, whichever occurred first. Altogether, 12,403 verified incident cases were identified [22]. As stated earlier, 778 of these 12,403 incident cases were also subcohort members, due to the random selection of the subcohort. Thus, the EPIC-InterAct study involves 27,779 participants (16,154 subcohort members; 12,403 incident cases including 778 cases within the subcohort; Fig. 1).
Study population for the present analysis
Of these 27,779 participants, we excluded those from study centres in Italy and Umeå (Sweden) (n = 5,238) because these centres did not obtain specific intake data on diet soft drinks, breakfast cereals and dressing sauces (Italy) or diet soft drinks and cabbages (Umeå), which are important dietary components of the selected dietary-pattern scores. Specifically for analyses on DASH, the UK centres were excluded due to the unavailability of intake data on vegetable oils (n = 1,857). We further excluded participants with missing data on diet or covariates (n = 925), resulting in a final study population of 21,616 (9,682 cases; 12,595 subcohort members with an overlap of 661 subcohort members who had developed incident type 2 diabetes; Fig. 1). The excluded participants were more likely to be slightly older, women, slightly less overweight, less physically active, less educated and a current or former smoker and they were less likely to have a family history of diabetes. The proportion of participants with HbA1c ≥ 6.5% (47.5 mmol/mol) was slightly higher among excluded participants.
Dietary assessment and selection of dietary-pattern scores
Usual food intake during the past 12 months was assessed at baseline with the use of quantitative or semi-quantitative dietary questionnaires, which were developed and validated locally [24, 27]. The reproducibility of these questionnaires was generally good in the EPIC centres, while the relative validity ranged from moderate to good as also observed in other validity studies conducted by independent research groups [28, 29]. Individual food items were classified into food groups based on nutrient composition. Definitions and contents of the food groups considered for the present analysis are shown in electronic supplementary material (ESM) Table 1. Intakes of specific nutrients and total energy were derived with the standardised EPIC Nutrient Database [30].
Dietary patterns considered in this study were selected from the literature. Criteria for selection were availability of the necessary intake data to construct the dietary patterns in the EPIC-InterAct study and presence of scientific evidence indicating that the dietary pattern had a potential relevance for diabetes risk. We have selected two widely used diet-quality scores, the aHEI [5] and the DASH diet [31, 32]. The relation of the Mediterranean dietary pattern to diabetes in EPIC-InterAct has been specifically addressed previously [9] and hence not investigated here. We could not evaluate the HEI and the ONQI as it was not possible to appropriately reflect these indices with the EPIC-InterAct dietary data. We selected three RRR-derived dietary patterns: RRR1 was derived in the American Nurses' Health Study (NHS) using six inflammatory markers as responses [20]; RRR2 was identified in the German EPIC-Potsdam study with HbA1c, HDL-cholesterol, C-reactive protein (CRP) and adiponectin as responses [18]; RRR3 was identified in the British Whitehall II study with the HOMA-IR index as response [19]. An RRR dietary pattern derived with BMI as response along with fasting glucose, triacylglycerols, HDL-cholesterol and hypertension [21] was not considered because we aimed to assess the association of dietary patterns with diabetes independent of body size. Tables 1 and 2 show the individual dietary components of the dietary-pattern scores used in this study and their weighting in the calculation of the scores, respectively. A detailed description of the construction of the dietary-pattern scores in EPIC-InterAct is given in ESM Methods.
Table 1.
Individual dietary components of the aHEI and the DASH dietary patterns considered in the analysis, EPIC-InterAct study
| Component of dietary pattern | Range of points | Criterion for lowest points | Criterion for highest points |
|---|---|---|---|
| AHEIa | |||
| Vegetables | 0–10 | 0 servings/dayb | ≥5 servings/dayb |
| Fruits | 0–10 | 0 servings/dayb | ≥4 servings/dayb |
| Nuts | 0–10 | 0 servings/dayb | ≥1 serving/dayb |
| Ratio of white meat to red meat | 0–10 | 0 | ≥4 |
| Cereal fibre | 0–10 | 0 g/day | ≥15 g/day |
| Ratio of PUFA to SFA | 0–10 | ≤0.1 | ≥1 |
| Alcohol | |||
| Men | 0–10 | 0 or >3.5 drinks/dayb | 1.5–2.5 drinks/dayb |
| Women | 0–10 | 0 or >2.5 drinks/dayb | 0.5–1.5 drinks/dayb |
| DASHc | |||
| Grains | |||
| Total grains | 0–5 | 0 servings/dayb | ≥6 servings/dayb |
| Fibre content of grains | 0–5 | No grain intake | Quintile 5 of subcohort distribution |
| Vegetables | 0–10 | 0 servings/dayb | ≥4 servings/dayb |
| Fruits | 0–10 | 0 servings/dayb | ≥4 servings/dayb |
| Dairy products | |||
| Total dairy products | 0–5 | 0 servings/dayb | ≥2 servings/dayb |
| Fat content of dairy products | 0–5 | No dairy intake | Quintile 1 of subcohort distribution |
| Meat, poultry, fish | 0–10 | ≥4 servings/dayb | ≤1 serving/dayb |
| Nuts, seeds, legumes | 0–10 | 0 servings/dayb | ≥4 servings/dayb |
| Fats and oils | 0–10 | ≥6 servings/dayb | ≤3 servings/dayb |
| Sweets | 0–10 | ≥10 servings/weekb | ≤5 servings/weekb |
A detailed description of the construction of the dietary-pattern scores is provided in the ESM Methods
aTo create the aHEI score, points between 0 and 10 were assigned for each component according to the participant's intake and then summed. Intermediate intakes were scored proportionately between 0 and 10
bServing sizes are defined as follows: vegetables, fruits, 125 g; nuts, seeds, 30 g; grains, 50 g; milk, yoghurt, 150 g, cheese, 45 g; meat, poultry, fish, 30 g; legumes, 100 g; fats, oils, 10 g; chocolate, 20 g; ice cream, 50 g; sugar-sweetened soft drinks, 150 g; alcoholic drink, drink containing 5 g pure ethanol
cTo create the DASH score, points between 0 and 10 were assigned for each component according to the participant's intake and then summed. Intermediate intakes were scored proportionately between 0 and 10. The grain and dairy components were separated into two items respectively, with one item scoring the absolute intake amount and the other item scoring the fibre content of the consumed grains and the fat content of the consumed dairy products
PUFA, polyunsaturated fatty acids; SFA, saturated fatty acids
Table 2.
Individual dietary components of the RRR dietary patterns considered in the analysis, EPIC-InterAct study
| RRR dietary pattern | Positive weighting | Negative weighting |
|---|---|---|
| RRR1 [20]a | Wine | Sugar-sweetened soft drinks |
| Coffee | Refined grains | |
| Cabbages | Processed meat | |
| Root vegetables | Diet soft drinks | |
| RRR2 [18]a | Fruits | Red meat |
| Beer | ||
| Poultry | ||
| Legumes | ||
| Sugar-sweetened soft drinks | ||
| Processed meat | ||
| White bread | ||
| RRR3 [19]a | Breakfast cereals | Diet soft drinks |
| Honey, jam, sugar | Sugar-sweetened soft drinks | |
| Dressing sauces | Processed meat | |
| Non-white bread | Salty biscuits and crackers | |
| White bread |
A detailed description of the construction of the dietary-pattern scores is provided in the ESM Methods
aThe RRR dietary-pattern scores were created as the sum of the standardised intakes (z scores) of the individual components listed in the table. The standardised intakes were assigned either the weight of ‘1’ (positive weighting) or ‘−1’ (negative weighting). The RRR scores were originally derived in other cohorts using the RRR method (see [18–20]). The following responses were used for derivation of the RRR dietary patterns in the original studies: 6 inflammatory markers (IL-6, CRP, soluble intracellular cell adhesion molecule 1 [sICAM-1], soluble fractions of tumour necrosis factor α receptor 2 [sTNFR2], E-selectin and soluble vascular cell adhesion molecule 1 [sVCAM-1]) for RRR1, HbA1c, HDL-cholesterol, CRP and adiponectin for RRR2 and the HOMA-IR index for RRR3
Assessment of other covariates
Standardised questionnaires were used at baseline to collect information on sociodemographic characteristics and lifestyle including age, education level, smoking status, occupational and leisure-time physical activity and history of previous illness. Height, weight and waist circumference of participants were obtained by trained staff during the baseline examination using standardised protocols [33]. However, for participants from France and some participants from Oxford (UK), self-reported anthropometric data were collected (4% of EPIC-InterAct study).
Statistical analysis
All dietary-pattern scores were transformed to z scores, based on subcohort distributions. Median dietary-pattern scores by country were computed to quantify country-specific adherence to the dietary patterns. The UK cohorts from Norfolk (population-based) and Oxford (high proportion of vegans, vegetarians and health-conscious individuals) were considered separately. We performed Cox proportional hazards analysis, weighted according to the Prentice method [34], to study the association between the dietary-pattern scores and the hazard of type 2 diabetes. Age was used as underlying time scale. Four models were applied, all stratified by study centre and integers of age (years), but with different levels of adjustment. Model 1 was adjusted for sex. Model 2 included further adjustment for physical activity (classified into ‘inactive’, ‘moderately inactive’, ‘moderately active’ and ‘active’ according to the validated Cambridge Physical Activity Index [35]), smoking status (never, former, current), educational level (none, primary, technical/professional, secondary, university) and total energy intake (continuous). We also applied additional adjustment for BMI (model 3) and BMI and waist circumference (model 4, both continuous).
Heterogeneity among countries in the association of the dietary-pattern scores with diabetes risk was studied by computing country-specific risk estimates and pooling these with random-effects meta-analyses. The two UK cohorts from Norfolk and Oxford were considered separately in the meta-analyses. As our aim was to verify associations of dietary patterns with diabetes, which should be done in independent cohorts, we did not use the Potsdam cohort in the meta-analysis for RRR2 because this pattern was derived in this cohort [18]. To explore potential sources of heterogeneity, country-specific mean age and BMI were related to the log-transformed HRs in subsequent meta-regression analyses [36].
Several sensitivity analyses were performed. To minimise reverse causality caused by a change in diet due to a prediabetic condition or chronic disease, we excluded participants with baseline HbA1c ≥ 6.5% (47.5 mmol/mol; 1.5% of the study population were missing values for HbA1c), incident cases diagnosed with diabetes within the first 2 years of follow-up and participants with baseline cardiovascular disease (myocardial infarction, stroke) or self-reported hypertension or hyperlipidaemia. To investigate potential effects of misreporting, we excluded participants in the top or bottom 1% of the energy intake/energy requirement ratio. Possible confounding by diabetes family history was addressed by further adjusting for history of diabetes in a first-degree relative (information not available in the Spanish centres, Oxford [UK] or Heidelberg [Germany]).
We investigated the importance of individual components of the dietary patterns for diabetes risk by sequentially subtracting components from the score. The change in estimate (CIE) was calculated as the difference between the HRs divided by the HR for the original score and multiplied by 100 (%).
Statistical analyses were performed with SAS (Version 9.2, Enterprise Guide 4.3; SAS Institute, Cary, NC, USA), except for meta-analyses and meta-regressions, which were conducted using Stata 12 (StataCorp, College Station, TX, USA).
Results
Median z-transformed dietary-pattern scores for each country are shown in Table 3. Table 4 shows baseline participant characteristics for the lowest and highest quintiles of the dietary-pattern scores. High scores correspond to favourable adherence. Most notably, high aHEI and DASH scores were associated with being women and never smokers, while there was no strong association with body size. High scores for all three RRRs were associated with being older and women and having a lower body size and higher educational level. Furthermore, macronutrient composition and intake of alcohol, fibre, meat, fruits/vegetables and coffee was clearly associated with the dietary-pattern scores.
Table 3.
Dietary-pattern scores by country in the subcohort of the EPIC-InterAct study
| Country | n | aHEI | DASH | RRR1 ([20]) | RRR2 ([18]) | RRR3 ([19]) |
|---|---|---|---|---|---|---|
| France | 532 | 0.20 (−0.45, 0.72) | 0.38 (−0.15, 0.97) | −0.05 (−0.49, 0.47) | 0.13 (−0.29, 0.66) | 0.51 (−0.02, 1.12) |
| Spain | 3,508 | 0.20 (−0.45, 0.98) | 0.44 (−0.02, 0.97) | −0.57 (−1.01, −0.16) | −0.28 (−1.05, 0.34) | −0.52 (−0.95, −0.14) |
| UKa | ||||||
| Norfolk | 844 | 0.07 (−0.58, 0.98) | – | 0.89 (0.32, 1.53) | 0.26 (−0.22, 0.70) | 0.19 (−0.48, 0.71) |
| Oxford | 239 | 0.98 (0.07, 1.76) | – | 0.83 (0.31, 1.39) | 0.79 (0.31, 1.22) | 0.49 (−0.15, 0.98) |
| Netherlands | 1,396 | −0.19 (−0.71, 0.33) | 0.18 (−0.61, 0.84) | 0.29 (−0.19, 0.67) | 0.51 (0.004, 0.89) | 0.14 (−0.32, 0.54) |
| Germany | 2,041 | −0.45 (−0.97, 0.07) | −0.28 (−0.87, 0.38) | 0.004 (−0.43, 0.36) | 0.41 (−0.21, 0.79) | 0.13 (−0.27, 0.55) |
| Sweden | 1,917 | −0.32 (−0.97, 0.20) | −0.55 (−1.33, 0.18) | 0.05 (−0.41, 0.52) | 0.39 (−0.12, 0.77) | 0.07 (−0.41, 0.57) |
| Denmark | 2,118 | −0.06 (−0.71, 0.59) | −0.15 (−0.87, 0.51) | 0.53 (−0.03, 1.03) | 0.05 (−0.58, 0.54) | 0.59 (0.003, 1.25) |
| Total | 12,595 | −0.06 (−0.71, 0.59) | 0.05 (−0.68, 0.70) | 0.01 (−0.56, 0.57) | 0.18 (−0.48, 0.68) | 0.01 (−0.54, 0.57) |
Data are medians (interquartile ranges)
aUK centres were split up due to differences in the recruitment scheme (high proportion of vegans, vegetarian and other health-conscious people in Oxford cohort, see Methods section for more details)
Table 4.
Baseline characteristics for extreme quintiles of the dietary-pattern scores in the subcohort of the EPIC-InterAct study (n = 12,595)
| Characteristic | Total | aHEI | DASH | RRR 1 ([20]) | RRR 2 ([18]) | RRR 3 ([19]) | |||||
|---|---|---|---|---|---|---|---|---|---|---|---|
| Q1 | Q5 | Q1 | Q5 | Q1 | Q5 | Q1 | Q5 | Q1 | Q5 | ||
| Age (years) | 53.3 | 53.6 | 52.9* | 53.5 | 53.4 | 50.0 | 55.8* | 51.5 | 54.9* | 50.6 | 55.8* |
| Men (%) | 37.8 | 45.1 | 35.5* | 59.4 | 23.3* | 47.8 | 35.7* | 72.2 | 13.4* | 52.3 | 40.7* |
| BMI (kg/m2) | 25.7 | 25.8 | 25.8 | 25.6 | 25.8* | 26.9 | 24.9* | 26.9 | 24.7* | 27.1 | 24.4* |
| WC (cm) | |||||||||||
| Men | 95.0 | 95.8 | 95.0 | 94.0 | 96.0* | 97.0 | 94.0* | 97.0 | 92.0* | 97.0 | 92.0* |
| Women | 80.0 | 80.0 | 80.0 | 78.0 | 81.0* | 84.0 | 77.3* | 83.5 | 78.0* | 83.5 | 76.0* |
| Physically active (%) | 21.1 | 17.8 | 22.7* | 23.2 | 21.6* | 18.0 | 26.5* | 23.4 | 22.9 | 19.5 | 26.0* |
| Never smoking (%) | 46.2 | 34.9 | 53.3* | 33.7 | 57.4* | 48.1 | 39.7* | 34.6 | 55.1* | 41.9 | 47.6* |
| Post-secondary education (%) | 21.7 | 20.0 | 22.5* | 22.0 | 21.5* | 13.9 | 23.7* | 16.4 | 25.7* | 15.3 | 29.9* |
| Dietary intake | |||||||||||
| Total energy (kJ/day) | 8,581 | 8,017 | 9,343* | 9,958 | 8,079* | 9,899 | 8,372* | 11,125 | 7,255* | 9,996 | 9,025* |
| Fat (% energy) | 35.1 | 35.6 | 34.0* | 37.7 | 32.3* | 36.1 | 33.2* | 35.3 | 33.3* | 35.8 | 33.5* |
| Carbohydrates (% energy) | 43.3 | 40.1 | 45.0* | 41.7 | 45.5* | 43.3 | 43.4 | 39.5 | 47.5* | 41.6 | 46.1* |
| Protein (% energy) | 17.0 | 16.2 | 17.8* | 15.3 | 17.9* | 17.9 | 17.0* | 17.9 | 16.0* | 17.7 | 16.3* |
| Alcohol (g/day) | 7.1 | 10.7 | 7.6* | 11.3 | 3.7* | 3.8 | 11.4* | 20.0 | 3.3* | 9.9 | 7.9* |
| Fibre (g/day) | 22.1 | 15.8 | 29.4* | 19.9 | 26.4* | 23.9 | 23.4* | 24.8 | 22.6* | 23.7 | 26.2* |
| Red and processed meat (g/day) | 78.9 | 88.4 | 59.7* | 108.1 | 50.8* | 100.9 | 70.4* | 131.8 | 40.7* | 104.9 | 70.6* |
| Fruits and vegetables (g/day) | 362 | 200 | 623* | 227 | 587* | 386 | 431* | 335 | 450* | 400 | 383 |
| Coffee (g/day) | 300 | 400 | 192* | 500 | 188* | 130 | 556* | 205 | 362* | 162 | 500* |
Data are medians or percentages (%)
*p < 0.05 vs the respective quintile 1 (Wilcoxon rank sum test or χ 2 test)
Q, quintile; WC, waist circumference
Table 5 shows HRs for the association of quintiles of the dietary-pattern scores with diabetes in the pooled study population. We observed linear inverse associations of the aHEI and DASH scores with diabetes after correction for age, sex, study centre, sociodemographic factors and lifestyle characteristics (model 2). However, these associations lost statistical significance after additional adjustment for BMI and waist circumference (model 4). For the three RRR scores, we observed relatively strong linear inverse associations with diabetes in our model 2. After additional adjustment for BMI and waist circumference, these linear inverse associations were modestly attenuated but remained statistically significant.
Table 5.
HRs for developing type 2 diabetes according to quintiles of the dietary-pattern scores, EPIC-InterAct study (n = 21,616)
| Dietary pattern | Quintile | p for trenda | ||||
|---|---|---|---|---|---|---|
| 1 | 2 | 3 | 4 | 5 | ||
| aHEI | ||||||
| Score | <−0.96 | −0.96 to −0.44 | −0.43 to 0.08 | 0.09 to 0.73 | >0.74 | |
| n cases | 2,088 | 1,996 | 2,015 | 1,845 | 1,738 | |
| Model 1b | 1.00 (ref) | 0.88 (0.81, 0.97) | 0.81 (0.74, 0.88) | 0.78 (0.72, 0.86) | 0.73 (0.67, 0.80) | <0.0001 |
| Model 2c | 1.00 (ref) | 0.93 (0.85, 1.02) | 0.88 (0.80, 0.96) | 0.88 (0.80, 0.96) | 0.83 (0.75, 0.92) | 0.0001 |
| Model 3d | 1.00 (ref) | 0.90 (0.82, 1.00) | 0.91 (0.83, 1.01) | 0.90 (0.81, 1.00) | 0.89 (0.80, 1.00) | 0.07 |
| Model 4e | 1.00 (ref) | 0.92 (0.82, 1.02) | 0.95 (0.86, 1.06) | 0.95 (0.85, 1.05) | 0.96 (0.86, 1.07) | 0.65 |
| DASH | ||||||
| Score | <−0.87 | −0.87 to −0.28 | −0.27 to 0.24 | 0.25 to 0.77 | >0.77 | |
| n cases | 2,165 | 1,666 | 1,772 | 1,677 | 1,603 | |
| Model 1b | 1.00 (ref) | 0.86 (0.79, 0.95) | 0.89 (0.81, 0.98) | 0.84 (0.76, 0.92) | 0.75 (0.68, 0.83) | <0.0001 |
| Model 2c | 1.00 (ref) | 0.87 (0.79, 0.95) | 0.88 (0.80, 0.97) | 0.85 (0.77, 0.94) | 0.78 (0.71, 0.87) | 0.006 |
| Model 3d | 1.00 (ref) | 0.95 (0.86, 1.06) | 0.94 (0.84, 1.04) | 0.90 (0.81, 1.01) | 0.91 (0.81, 1.02) | 0.07 |
| Model 4e | 1.00 (ref) | 0.96 (0.86, 1.07) | 0.94 (0.84, 1.05) | 0.93 (0.83, 1.04) | 0.95 (0.84, 1.07) | 0.24 |
| RRR1 ([20]) | ||||||
| Score | <−0.71 | −0.71 to −0.20 | −0.20 to 0.22 | 0.22 to 0.73 | >0.73 | |
| n cases | 2,296 | 1,999 | 1,979 | 1,739 | 1,669 | |
| Model 1b | 1.00 (ref) | 0.83 (0.76, 0.91) | 0.75 (0.69, 0.82) | 0.64 (0.59, 0.71) | 0.57 (0.52, 0.63) | <0.0001 |
| Model 2c | 1.00 (ref) | 0.84 (0.77, 0.92) | 0.77 (0.70, 0.85) | 0.66 (0.60, 0.73) | 0.58 (0.52, 0.65) | <0.0001 |
| Model 3d | 1.00 (ref) | 0.91 (0.82, 1.01) | 0.88 (0.79, 0.98) | 0.80 (0.71, 0.90) | 0.73 (0.65, 0.83) | <0.0001 |
| Model 4e | 1.00 (ref) | 0.92 (0.83, 1.02) | 0.91 (0.82, 1.02) | 0.81 (0.72, 0.91) | 0.76 (0.67, 0.86) | <0.0001 |
| RRR2 ([18]) | ||||||
| Score | <−0.68 | −0.68 to −0.06 | −0.06 to 0.39 | 0.39 to 0.78 | >0.78 | |
| n cases | 2,454 | 2,115 | 1,982 | 1,721 | 1,410 | |
| Model 1b | 1.00 (ref) | 0.87 (0.80, 0.95) | 0.84 (0.77, 0.92) | 0.74 (0.67, 0.82) | 0.61 (0.55, 0.68) | <0.0001 |
| Model 2c | 1.00 (ref) | 0.88 (0.81, 0.96) | 0.85 (0.77, 0.93) | 0.76 (0.68, 0.84) | 0.65 (0.58, 0.73) | <0.0001 |
| Model 3d | 1.00 (ref) | 0.96 (0.87, 1.07) | 0.94 (0.84, 1.05) | 0.87 (0.78, 0.98) | 0.81 (0.71, 0.91) | 0.001 |
| Model 4e | 1.00 (ref) | 0.98 (0.89, 1.09) | 0.95 (0.85, 1.06) | 0.90 (0.79, 1.01) | 0.85 (0.75, 0.97) | 0.02 |
| RRR3 ([19]) | ||||||
| Score | <−0.68 | −0.68 to −0.20 | −0.20 to 0.21 | 0.21 to 0.72 | >0.72 | |
| n cases | 2,493 | 2,009 | 1,945 | 1,814 | 1,421 | |
| Model 1b | 1.00 (ref) | 0.81 (0.74, 0.88) | 0.73 (0.66, 0.79) | 0.63 (0.58, 0.70) | 0.42 (0.38, 0.47) | <0.0001 |
| Model 2c | 1.00 (ref) | 0.80 (0.73, 0.87) | 0.72 (0.66, 0.79) | 0.65 (0.59, 0.72) | 0.46 (0.42, 0.51) | <0.0001 |
| Model 3d | 1.00 (ref) | 0.84 (0.76, 0.93) | 0.83 (0.74, 0.92) | 0.80 (0.72, 0.89) | 0.62 (0.56, 0.70) | <0.0001 |
| Model 4e | 1.00 (ref) | 0.84 (0.76, 0.93) | 0.84 (0.76, 0.94) | 0.82 (0.73, 0.91) | 0.65 (0.58, 0.73) | <0.0001 |
Data are HRs (95% CI)
aThe significance of linear trends across quintiles was tested by assigning the median value within quintiles (based on subcohort distribution) and modelling this value as a continuous variable
bModel 1 is stratified by age and study centre and adjusted for sex
cModel 2 is further adjusted for physical activity, smoking status, education and total energy intake
dModel 3 is further adjusted for BMI
eModel 4 is further adjusted for waist circumference
Ref, reference value
We used continuous variables of the dietary-pattern scores in a meta-analytical approach to investigate country heterogeneity in the association with diabetes. Figure 2 shows country-specific HRs (1-SD increment, model 4 adjustments) and combined estimates obtained from random-effects meta-analyses. The combined effect estimates did not indicate a meaningful association of aHEI and DASH with diabetes. We observed inverse associations of all three RRR scores with diabetes, although the combined HR for RRR2 did not reach statistical significance (combined HR [95% CI]: for RRR1 0.91 [0.86, 0.96]; RRR2 0.92 [0.84, 1.01]; RRR3 0.87 [0.82, 0.92]). There was moderate country heterogeneity for DASH (I 2 = 39.4%), RRR1 (I 2 = 47.8%) and RRR3 (I 2 = 52.2%), whereas higher I 2 values were observed for aHEI and RRR2 (>70%). Omitting single countries from the meta-analysis revealed that heterogeneity was mainly introduced by Spain for RRR1 (I 2 without Spain = 22.4%), by the two UK centres, Norfolk and Oxford, for RRR2 (I 2 without Norfolk and Oxford = 0%) and by Norfolk for RRR3 (I2 without Norfolk = 22.4%). For the aHEI and DASH scores, heterogeneity was not introduced by single countries.
Fig. 2.
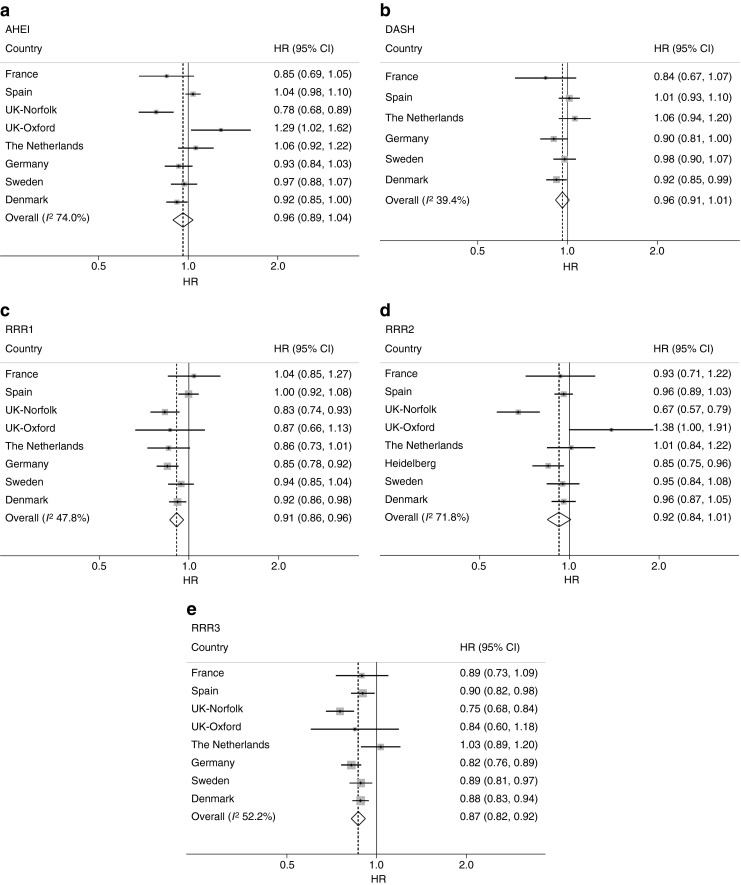
HRs (95% CIs) for developing type 2 diabetes for a 1-SD increment in the dietary-pattern scores (a, AHEI; b, DASH; c, RRR1; d, RRR2; e, RRR3) stratified by country and meta-analysed using a random-effects model, EPIC-InterAct study (n = 21,616). Note that the scale of the x-axis is non-linear. Model 4 adjustments were applied (stratified by age and study centre [applicable for country-specific analyses only] and adjusted for sex, physical activity, smoking status, education, total energy intake, BMI and waist circumference). In (d) the German study population is labelled ‘Heidelberg’ because Potsdam was excluded since it was used in the derivation of RRR2
In subsequent meta-regression analyses, we investigated whether mean age and BMI were related to the country-specific HRs. We detected a significant inverse association between mean age and the HR for the aHEI (p = 0.0004, ESM Fig. 1). There were no clear associations between mean age and country-specific HRs for the DASH and RRR scores. Similarly, there was no clear association between mean BMI and country-specific HRs for any of the five dietary patterns. For the RRR scores we observed that certain centres introduced heterogeneity in the diabetes association and so we further explored the risk contributions and intake distributions of single food components in these centres. There was a clearly higher mean intake and wider distribution of reported wine consumption in Spain (mean 136 g/day, SD 239 g/day) compared with the overall EPIC-InterAct study population (mean 82 g/day, SD 160 g/day). When subtracting wine from the RRR1 score, the HR for Spain (0.95 [95% CI 0.87, 1.05]) was more comparable with that of the other EPIC countries. For RRR2, subtracting fruits resulted in more similar HRs for the UK centres (Norfolk 0.82 [95% CI 0.70, 0.97], Oxford 1.06 [95% CI 0.74, 1.53]) compared with other countries. For RRR3, the stronger association for Norfolk than for the other centres was not explainable by any single food component.
None of the sensitivity analyses resulted in a material change of the effect estimates. Also, undertaking analyses separately for men and women did not reveal appreciable differences (results not shown).
We sequentially subtracted components from the RRR scores to analyse their importance for diabetes (Table 6). The subtraction of coffee (CIE 3.3%), and also of processed meat (CIE 2.2%) and sugar-sweetened soft drinks (CIE 1.1%), weakened the observed association for the RRR1 score. Similarly, excluding sugar-sweetened soft drinks and processed meat (CIE 3.3%, respectively), but also fruits (CIE 4.3%), red meat (CIE 2.2%), legumes (CIE 1.1%) and white bread (CIE 1.1%) from the RRR2 score resulted in attenuated HRs. For RRR3, we observed slight attenuations in the HR after excluding honey/jam/sugar, processed meat, white bread and dressing sauces (CIE 1.1–3.4%). The results were materially the same when we repeated these analyses with adjustment for the subtracted component, respectively.
Table 6.
Pooled HRs (95% CIs) for developing type 2 diabetes for a 1-SD increment in the RRR dietary-pattern scores and after alternate subtraction of each of its components; EPIC-InterAct study (n = 21,616)a
| Dietary variable | HR (95% CI) | CIE (%) |
|---|---|---|
| RRR1 ([20]) | ||
| Original RRR1 score | 0.91 (0.86, 0.96) | |
| RRR1 without sugar-sweetened soft drinks | 0.92 (0.87, 0.96) | +1.1 |
| RRR1 without refined grains | 0.91 (0.86, 0.96) | 0 |
| RRR1 without processed meat | 0.93 (0.88, 0.98) | +2.2 |
| RRR1 without diet soft drinks | 0.90 (0.85, 0.96) | −1.1 |
| RRR1 without wine | 0.91 (0.87, 0.94) | 0 |
| RRR1 without coffee | 0.94 (0.88, 0.99) | +3.3 |
| RRR1 without cabbages | 0.89 (0.84, 0.95) | −2.2 |
| RRR1 without root vegetables | 0.91 (0.86, 0.97) | 0 |
| RRR2 ([18]) | ||
| Original RRR2 score | 0.92 (0.84, 1.01) | |
| RRR2 without fruits | 0.96 (0.91, 1.00) | +4.3 |
| RRR2 without red meat | 0.94 (0.87, 1.02) | +2.2 |
| RRR2 without beer | 0.90 (0.84, 0.97) | −2.2 |
| RRR2 without poultry | 0.92 (0.84, 1.02) | 0 |
| RRR2 without legumes | 0.93 (0.86, 1.01) | +1.1 |
| RRR2 without sugar-sweetened soft drinks | 0.95 (0.85, 1.05) | +3.3 |
| RRR2 without processed meat | 0.95 (0.88, 1.03) | +3.3 |
| RRR2 without white bread | 0.93 (0.86, 1.01) | +1.1 |
| RRR3 ([19]) | ||
| Original RRR3 score | 0.87 (0.82, 0.92) | |
| RRR3 without diet soft drinks | 0.86 (0.81, 0.91) | −1.1 |
| RRR3 without sugar-sweetened soft drinks | 0.87 (0.83, 0.91) | 0 |
| RRR3 without processed meat | 0.88 (0.84, 0.93) | +1.1 |
| RRR3 without salty biscuits | 0.87 (0.82, 0.91) | 0 |
| RRR3 without white bread | 0.88 (0.84, 0.92) | +1.1 |
| RRR3 without breakfast cereals | 0.87 (0.81, 0.92) | 0 |
| RRR3 without honey/jam/sugar | 0.90 (0.84, 0.96) | +3.4 |
| RRR3 without dressing sauces | 0.88 (0.83, 0.93) | +1.1 |
| RRR3 without non-white bread | 0.87 (0.82, 0.92) | 0 |
aHRs and 95% CIs are based on random-effects meta-analyses. Model 4 adjustments were applied (stratified by age and study centre and adjusted for sex, physical activity, smoking status, education, total energy intake, BMI and waist circumference)
Discussion
In this large European case-cohort study, the adherence to several RRR-derived dietary patterns was related to a lower risk of type 2 diabetes. There was no significant association between the aHEI or DASH dietary pattern and risk, independent of body size.
Our observation of a stronger relevance of the RRR dietary patterns for diabetes compared with the diet-quality scores aHEI and DASH is probably due to the fact that the RRR patterns were specifically derived to explain variation in diabetes-relevant biomarkers. The aHEI was originally created to predict chronic disease risk with a focus on cardiovascular disease and cancer [5], whereas the DASH diet was designed to lower blood pressure [31]. Still, some previous studies detected a significant inverse relation of these diet-quality scores to diabetes risk [11–13]. It appears plausible that the RRR3 score showed the strongest risk relationship among the RRR dietary patterns because it was originally derived to explain variation in the HOMA-IR. Insulin sensitivity may be more closely linked to diabetes risk than inflammation or dyslipidaemia, which were the responses used to derive the other two RRR dietary patterns.
We observed important similarities between the three RRR dietary patterns with regard to their dietary components. Most notably, processed meat and sugar-sweetened soft drinks loaded negatively on all three patterns. In addition, excluding these components from the scores led to an attenuation of the HRs. These findings are supported by recent meta-analyses that showed that higher consumption of processed meat [37] and sugar-sweetened beverages [38] is associated with development of type 2 diabetes. Furthermore, white bread or refined grains constituted important components of all three diabetes-related dietary patterns in our study. Notably, the RRR patterns also showed differences in their composition, which resulted from the use of different responses, reflecting different pathomechanisms. Despite these differences, an association of all three RRR patterns with diabetes appears plausible given that distinct metabolic pathways are involved.
The RRR3 dietary pattern is also characterised by high intakes of dressing sauces and honey/jam/sugar, which might seem surprising. These foods may not be causally related to diabetes risk but may rather represent markers of other foods with which they are consumed [19]. McNaughton et al emphasised correlations of salad dressings with salad vegetable intake and of jam consumption with wholegrain bread in the British Whitehall II study [19]. Similarly, we observed a correlation between intake of dressings and vegetables in EPIC-InterAct (r = 0.23). The unavailability of specific intake data for wholegrain bread in the individual EPIC countries precluded us from further evaluating whether jam/honey may be a marker of this food in our study. Using non-white bread as an alternative revealed correlations in specific countries (Denmark, Netherlands, UK; r = 0.11–0.23). Furthermore, it may appear counterintuitive that legumes score negatively on the EPIC-Potsdam-derived RRR2 pattern. A possible explanation, in this German population, is that legumes were mostly consumed in the form of stew, often accompanied by processed meat [18].
Our study did not confirm earlier findings of significant inverse associations of the aHEI [11, 12, 39] and the DASH score [12, 13] with diabetes risk after adjustments including body size. Of note, these earlier studies were all performed in American settings. Liese et al observed different risk relations for the DASH score between white and black/Hispanic populations [13]. Therefore, it can be speculated that relations between certain dietary-pattern scores and diabetes risk are somewhat population-specific, possibly because of different distributions in dietary intakes. Furthermore, the scores were not created identically across the studies. Our aHEI score did not consider trans-fatty-acid intake or multivitamin supplement use. However, this should not explain our null finding because recent studies on trans-fatty-acid biomarkers do not support a direct association with diabetes risk [40–43] and including multivitamin supplement use in the aHEI did not materially change our results (data not shown). Still, our findings do not exclude the possibility that adherence to the aHEI and DASH diet lowers diabetes risk, at least in some individuals. As we had to rely on self-reported dietary intakes, measurement error may have attenuated the observed statistical associations [44]. Furthermore, a recent meta-analysis of intervention studies suggests that the DASH diet can improve insulin sensitivity independent of weight loss [45].
We detected some degree of heterogeneity between EPIC countries in the association of the dietary patterns with diabetes. Reasons for this heterogeneity may include differences in dietary assessment tools, distributions of dietary intake and confounders as well as general cohort characteristics. This may explain the somewhat divergent results for the Oxford cohort, which includes many vegans, lacto-ovo vegetarians and other health-conscious people.
We aimed to explore sources for this heterogeneity between countries. Meta-regression analyses revealed an inverse association of country-specific mean age with the country-specific HRs for the aHEI. A similar observation was also made for the Mediterranean dietary pattern in EPIC-InterAct [9].
For the three RRR dietary patterns, single centres were responsible for heterogeneity in the association with diabetes risk. Descriptive analyses revealed a clearly higher mean intake and wider distribution of reported intake of wine in Spain, which probably explained the absence of an inverse risk relation of the RRR1 dietary-pattern score for Spain. Because a lower risk for diabetes has especially been observed in the moderate range of alcohol intake [46], a high wine intake at the population level may exert a detrimental rather than a beneficial effect on risk. Indeed, when subtracting wine from the RRR1 score, the effect estimate for Spain was more comparable with the other EPIC countries. For RRR2, heterogeneity was mainly introduced by the two UK centres. When investigating single RRR2 components, we found that subtracting fruits from the RRR2 score resulted in more similar effect estimates for the UK centres compared with the other countries. This agrees with an earlier investigation of EPIC-InterAct, which reported a significant inverse association of fruits intake with diabetes only for the UK [47]. For RRR3, which was originally derived in the British Whitehall II study, we observed a clearly stronger association in the British Norfolk cohort compared with the other EPIC countries. Similarly, RRR2, which was derived in the German EPIC-Potsdam cohort, showed the strongest association in the German EPIC-Heidelberg cohort in our study. It appears plausible that associations between specific dietary patterns and disease may be better generalisable to populations with comparable dietary habits and intake distributions. Consistent with this, an investigation of the American Framingham Offspring Study on the generalisability of RRR dietary patterns associated with diabetes risk found relatively good generalisability for the American NHS-derived RRR1 dietary pattern, whereas the risk association for the European-derived RRR2 and RRR3 dietary patterns was much weaker [21]. However, such comparisons of studies are complicated by the application of different dietary questionnaires that are specific to the regional dietary habits and the use of different food groupings. In our study, we observed overall relatively good reproducibility of inverse associations between RRR-derived dietary patterns and diabetes risk, even for the American NHS-derived RRR1 dietary pattern.
Major strengths of our study include the prospective design and the large number of incident cases of type 2 diabetes. The EPIC study was designed to include countries from various areas in Europe, which enabled us to study heterogeneous populations with wide variations in dietary habits, as also reflected by the country differences in adherence to the dietary patterns. A major limitation is that dietary intake was assessed with self-reported questionnaires. Imprecision in the estimated dietary intakes may have led to an attenuation of the association between dietary patterns and diabetes [44]. Further, although our dietary questionnaires showed reasonable validity [28, 29], differential misreporting (a common problem in nutritional epidemiologic studies) may have distorted our findings. However, there was no apparent change in our results when we excluded participants in the top or bottom 1% of the energy intake/energy requirement ratio.
In conclusion, this study on the verification of relations of predefined dietary patterns to diabetes risk suggests that diet quality is of high relevance for primary prevention of type 2 diabetes. We were able to confirm findings from earlier prospective studies showing that adherence to specific RRR-derived dietary patterns, commonly characterised by high intake of fruits or vegetables and low intake of processed meat, sugar-sweetened beverages and refined grains, may lower risk of type 2 diabetes. However, our results do not support existing scientific evidence proposing protective effects of adherence to the aHEI and DASH diet on diabetes risk independent of body size.
Electronic supplementary material
Below is the link to the electronic supplementary material.
(PDF 8 kb)
(PDF 62 kb)
(PDF 20 kb)
Acknowledgements
We thank all EPIC participants and staff for their contribution to the study. We thank N. Kerrison (MRC Epidemiology Unit, Cambridge, UK) for managing the data for the InterAct project.
Funding
Funding for the InterAct project was provided by the EU FP6 programme (grant number LSHM_CT_2006_037197). In addition, InterAct investigators acknowledge funding from the following agencies: JWJB: Dutch research council (NWO-ZonMW; grant no. 40-00812-98-10040), verification of diabetes cases in EPIC-NL was additionally funded by NL Agency grant IGE05012 and an Incentive Grant from the Board of the UMC Utrecht; EA: Health Research Fund (FIS) of the Spanish Ministry of Health, Navarre Regional Government and CIBER Epidemiología y Salud Pública (CIBERESP); GB: Spanish Ministry of Health (ISCIII RETICC RD 06/0020/0091) and the Catalan Institute of Oncology (ICO-IDIBELL),Barcelona, Spain; PWF: Swedish Research Council, Novo Nordisk, Swedish Diabetes Association, Swedish Heart-Lung Foundation; RK: German Cancer Aid, German Ministry of Research (BMBF); TJK: Cancer Research UK; KTK: Medical Research Council UK, Cancer Research UK; CN: Health Research Fund (FIS) of the Spanish Ministry of Health; Murcia Regional Government (no. 6236); PMN: Swedish Research Council; KO: Danish Cancer Society; OR: The Västerboten County Council; AMWS: Dutch Ministry of Public Health, Welfare and Sports (VWS), Netherlands Cancer Registry (NKR), LK Research Funds, Dutch Prevention Funds, Dutch ZON (Zorg Onderzoek Nederland), World Cancer Research Fund (WCRF), Statistics Netherlands; AT: Danish Cancer Society; RT: AIRE-ONLUS Ragusa, AVIS-Ragusa, Sicilian Regional Government; DLvdA: Dutch Ministry of Public Health, Welfare and Sports (VWS), Netherlands Cancer Registry (NKR), LK Research Funds, Dutch Prevention Funds, Dutch ZON (Zorg Onderzoek Nederland), World Cancer Research Fund (WCRF), Statistics Netherlands; ER: Imperial College Biomedical Research Centre; CL, SJS, NGF and NJW: core MRC Unit support through programmes MC_UU_12015/1 and MC_UU_12015/5.
Duality of interest
The authors declare that there is no duality of interest associated with this manuscript.
Contribution statement
JK had access to all data for this study and takes responsibility for the manuscript contents. JK analysed the data and drafted the manuscript. All authors qualify for authorship according to Diabetologia criteria. They have all contributed to the conception and design of the study, the interpretation of the data, the critical revision of the article for important intellectual content and final approval of the version to be published.
Abbreviations
- aHEI
Alternative Healthy Eating Index
- CIE
Change in estimate
- CRP
C-reactive protein
- DASH
Dietary Approaches to Stop Hypertension
- EPIC
European Prospective Investigation into Cancer and Nutrition
- HEI
Healthy Eating Index
- NHS
Nurses' Health Study
- ONQI
Overall Nutritional Quality Index
- RRR
Reduced rank regression
Appendix
The InterAct Consortium list of authors is as follows:
Janine Kröger (Department of Molecular Epidemiology, German Institute of Human Nutrition Potsdam-Rehbruecke, Nuthetal, Germany); Matthias B. Schulze (Department of Molecular Epidemiology, German Institute of Human Nutrition Potsdam-Rehbruecke, Nuthetal, Germany); Dora Romaguera (Department of Epidemiology and Biostatistics, School of Public Health, Imperial College London, UK; CIBER Fisiopatología de la Obesidad y Nutrición [CIBEROBN], Spain, URL www.ciberobn.es); Marcela Guevara (Navarre Public Health Institute, Pamplona, Spain; CIBER Epidemiología y Salud Pública [CIBERESP], Spain, URL www.ciberesp.es); Brian Buijsse (Department of Epidemiology, German Institute of Human Nutrition Potsdam-Rehbruecke, Nuthetal, Germany); Heiner Boeing (Department of Molecular Epidemiology, German Institute of Human Nutrition Potsdam-Rehbruecke, Nuthetal, Germany); Joline W. J. Beulens (Julius Center for Health Sciences and Primary Care, University Medical Center, Utrecht, the Netherlands); Edith J. M. Feskens (Division of Human Nutrition – Section Nutrition and Epidemiology, University of Wageningen, the Netherlands); Pilar Amiano (Public Health Division of Gipuzkoa, San Sebastian, Spain; Instituto BIO-Donostia, Basque Government, San Sebastian, Spain; CIBERESP, Spain); Eva Ardanaz (Navarre Public Health Institute, Pamplona, Spain; CIBERESP, Spain); Claudia Agnoli (Fondazione IRCCS Istituto Nazionale dei Tumori, Milan, Italy); Genevieve Buckland (Unit of Nutrition, Environment and Cancer, Cancer Epidemiology Research Programme, Catalan Institute of Oncology (ICO-IDIBELL), Barcelona, Spain); Françoise Clavel-Chapelon (Inserm, Centre for Research in Epidemiology and Population Health [CESP] Villejuif, France; Université Paris-Sud, Villejuif, France); Christina C. Dahm (Section for Epidemiology, Department of Public Health, Aarhus University, Denmark); Guy Fagherazzi (Inserm, Centre for Research in Epidemiology and Population Health [CESP], Villejuif, France; Univesité Paris-Sud, Villejuif, France); Paul W. Franks (Department of Clinical Sciences, Lund University, Malmö, Sweden; Department of Public Health and Clinical Medicine, Umeå University, Sweden); Rudolf Kaaks (German Cancer Research Center [DKFZ], Heidelberg, Germany); Timothy J. Key (Cancer Epidemiology Unit, University of Oxford, Oxford, UK); Kay Tee Khaw (Department of Public Health and Primary Care, University of Cambridge, UK); Martin Lajous (Inserm, Centre for Research in Epidemiology and Population Health [CESP], Villejuif, France; Université Paris-Sud, Villejuif, France; Center for Research on Population Health, National Institute of Public Health of Mexico, Cuernavaca, Mexico); Amalia Mattiello (Dipartimento di Medicina Clinica e Chirurgia, Federico II University, Naples, Italy); Virginia Menéndez García (Public Health Directorate, Asturias, Spain); Carmen Navarro (Department of Epidemiology, Murcia Regional Health Council, Murcia, Spain; CIBERESP, Spain; Department of Health and Social Sciences, University of Murcia, Spain); Peter M. Nilsson (Department of Clinical Sciences, Lund University, Malmö, Sweden); Kim Overvad (Section for Epidemiology, Department of Public Health, Aarhus University, Denmark; Department of Cardiology, Center for Cardiovascular Research, Aalborg Hospital, Aarhus University Hospital, Aalborg, Denmark); Domenico Palli (Molecular and Nutritional Epidemiology Unit, Cancer Research and Prevention Institute [ISPO], Florence, Italy); Fulvio Ricceri (Human Genetics Foundation (HuGeF), Turin, Italy; AO Ordine Mauriziano di Torino, Turin, Italy); Olov Rolandsson (Department of Public Health and Clinical Medicine, Umeå University, Sweden); María-José Sánchez (Andalusian School of Public Health, Granada, Spain; CIBERESP, Spain); Nadia Slimani (International Agency for Research on Cancer, Lyon, France); Annemieke M. W. Spijkerman (National Institute for Public Health and the Environment [RIVM], Bilthoven, the Netherlands); Anne Tjonneland (Danish Cancer Society Research Center, Copenhagen, Denmark); Rosario Tumino (Cancer Registry and Histopathology Unit, ‘Civile – M.P. Arezzo’ Hospital, Ragusa, Italy; Associazone Iblea per la Ricerca Epidemiologica – Onlus, Ragusa, Italy); Daphne L. van der A (National Institute for Public Health and the Environment [RIVM], Bilthoven, the Netherlands); Claudia Langenberg (MRC Epidemiology Unit, Cambridge, UK); Stephen J. Sharp (MRC Epidemiology Unit, Cambridge, UK); Nita G. Forouhi (MRC Epidemiology Unit, Cambridge, UK); Elio Riboli (Department of Epidemiology and Biostatistics, School of Public Health, Imperial College London, UK); Nicholas J. Wareham (MRC Epidemiology Unit, Cambridge, UK).
Footnotes
The InterAct Consortium list of authors is shown in the Appendix.
References
- 1.Gillies CL, Abrams KR, Lambert PC, et al. Pharmacological and lifestyle interventions to prevent or delay type 2 diabetes in people with impaired glucose tolerance: systematic review and meta-analysis. BMJ. 2007;334:299. doi: 10.1136/bmj.39063.689375.55. [DOI] [PMC free article] [PubMed] [Google Scholar]
- 2.Schulze MB, Hoffmann K. Methodological approaches to study dietary patterns in relation to risk of coronary heart disease and stroke. Br J Nutr. 2006;95:860–869. doi: 10.1079/BJN20061731. [DOI] [PubMed] [Google Scholar]
- 3.Kennedy ET, Ohls J, Carlson S, Fleming K. The Healthy Eating Index: design and applications. J Am Diet Assoc. 1995;95:1103–1108. doi: 10.1016/S0002-8223(95)00300-2. [DOI] [PubMed] [Google Scholar]
- 4.Haines PS, Siega-Riz AM, Popkin BM. The Diet Quality Index revised: a measurement instrument for populations. J Am Diet Assoc. 1999;99:697–704. doi: 10.1016/S0002-8223(99)00168-6. [DOI] [PubMed] [Google Scholar]
- 5.McCullough ML, Feskanich D, Stampfer MJ, et al. Diet quality and major chronic disease risk in men and women: moving toward improved dietary guidance. Am J Clin Nutr. 2002;76:1261–1271. doi: 10.1093/ajcn/76.6.1261. [DOI] [PubMed] [Google Scholar]
- 6.Hoffmann K, Schulze MB, Schienkiewitz A, Nothlings U, Boeing H. Application of a new statistical method to derive dietary patterns in nutritional epidemiology. Am J Epidemiol. 2004;159:935–944. doi: 10.1093/aje/kwh134. [DOI] [PubMed] [Google Scholar]
- 7.Martinez-Gonzalez MA, de la Fuente-Arrillaga C, Nunez-Cordoba JM, et al. Adherence to Mediterranean diet and risk of developing diabetes: prospective cohort study. BMJ. 2008;336:1348–1351. doi: 10.1136/bmj.39561.501007.BE. [DOI] [PMC free article] [PubMed] [Google Scholar]
- 8.Salas-Salvado J, Bullo M, Babio N, et al. Reduction in the incidence of type 2 diabetes with the Mediterranean diet: results of the PREDIMED-Reus nutrition intervention randomized trial. Diabetes Care. 2011;34:14–19. doi: 10.2337/dc10-1288. [DOI] [PMC free article] [PubMed] [Google Scholar]
- 9.Romaguera D, Guevara M, Norat T, et al. Mediterranean diet and type 2 diabetes risk in the European Prospective Investigation into Cancer and Nutrition (EPIC) study: the InterAct project. Diabetes Care. 2011;34:1913–1918. doi: 10.2337/dc11-0891. [DOI] [PMC free article] [PubMed] [Google Scholar]
- 10.Abiemo EE, Alonso A, Nettleton JA, et al. Relationships of the Mediterranean dietary pattern with insulin resistance and diabetes incidence in the Multi-Ethnic Study of Atherosclerosis (MESA) Br J Nutr. 2012;109:1490–1497. doi: 10.1017/S0007114512003339. [DOI] [PMC free article] [PubMed] [Google Scholar]
- 11.Chiuve SE, Fung TT, Rimm EB, et al. Alternative dietary indices both strongly predict risk of chronic disease. J Nutr. 2012;142:1009–1018. doi: 10.3945/jn.111.157222. [DOI] [PMC free article] [PubMed] [Google Scholar]
- 12.de Koning L, Chiuve SE, Fung TT, Willett WC, Rimm EB, Hu FB. Diet-quality scores and the risk of type 2 diabetes in men. Diabetes Care. 2011;34:1150–1156. doi: 10.2337/dc10-2352. [DOI] [PMC free article] [PubMed] [Google Scholar]
- 13.Liese AD, Nichols M, Sun X, D'Agostino RB, Jr, Haffner SM. Adherence to the DASH Diet is inversely associated with incidence of type 2 diabetes: the insulin resistance atherosclerosis study. Diabetes Care. 2009;32:1434–1436. doi: 10.2337/dc09-0228. [DOI] [PMC free article] [PubMed] [Google Scholar]
- 14.Chiuve SE, Sampson L, Willett WC. The association between a nutritional quality index and risk of chronic disease. Am J Prev Med. 2011;40:505–513. doi: 10.1016/j.amepre.2010.11.022. [DOI] [PMC free article] [PubMed] [Google Scholar]
- 15.Zamora D, Gordon-Larsen P, He K, Jacobs DR, Jr, Shikany JM, Popkin BM. Are the 2005 Dietary Guidelines for Americans Associated With reduced risk of type 2 diabetes and cardiometabolic risk factors? Twenty-year findings from the CARDIA study. Diabetes Care. 2011;34:1183–1185. doi: 10.2337/dc10-2041. [DOI] [PMC free article] [PubMed] [Google Scholar]
- 16.von Ruesten A, Illner AK, Buijsse B, Heidemann C, Boeing H. Adherence to recommendations of the German food pyramid and risk of chronic diseases: results from the EPIC-Potsdam study. Eur J Clin Nutr. 2010;64:1251–1259. doi: 10.1038/ejcn.2010.151. [DOI] [PubMed] [Google Scholar]
- 17.Gopinath B, Rochtchina E, Flood VM, Mitchell P. Diet quality is prospectively associated with incident impaired fasting glucose in older adults. Diabet Med. 2013;30:557–562. doi: 10.1111/dme.12109. [DOI] [PubMed] [Google Scholar]
- 18.Heidemann C, Hoffmann K, Spranger J, et al. A dietary pattern protective against type 2 diabetes in the European Prospective Investigation into Cancer and Nutrition (EPIC)–Potsdam Study cohort. Diabetologia. 2005;48:1126–1134. doi: 10.1007/s00125-005-1743-1. [DOI] [PubMed] [Google Scholar]
- 19.McNaughton SA, Mishra GD, Brunner EJ. Dietary patterns, insulin resistance, and incidence of type 2 diabetes in the Whitehall II Study. Diabetes Care. 2008;31:1343–1348. doi: 10.2337/dc07-1946. [DOI] [PMC free article] [PubMed] [Google Scholar]
- 20.Schulze MB, Hoffmann K, Manson JE et al (2005) Dietary pattern, inflammation, and incidence of type 2 diabetes in women. Am J Clin Nutr 82:675–684 [DOI] [PMC free article] [PubMed]
- 21.Imamura F, Lichtenstein AH, Dallal GE, Meigs JB, Jacques PF. Generalizability of dietary patterns associated with incidence of type 2 diabetes mellitus. Am J Clin Nutr. 2009;90:1075–1083. doi: 10.3945/ajcn.2009.28009. [DOI] [PMC free article] [PubMed] [Google Scholar]
- 22.Langenberg C, Sharp S, Forouhi NG, et al. Design and cohort description of the InterAct Project: an examination of the interaction of genetic and lifestyle factors on the incidence of type 2 diabetes in the EPIC Study. Diabetologia. 2011;54:2272–2282. doi: 10.1007/s00125-011-2182-9. [DOI] [PMC free article] [PubMed] [Google Scholar]
- 23.Bingham S, Riboli E. Diet and cancer–the European Prospective Investigation into Cancer and Nutrition. Nat Rev Cancer. 2004;4:206–215. doi: 10.1038/nrc1298. [DOI] [PubMed] [Google Scholar]
- 24.Riboli E, Hunt KJ, Slimani N, et al. European Prospective Investigation into Cancer and Nutrition (EPIC): study populations and data collection. Public Health Nutr. 2002;5:1113–1124. doi: 10.1079/PHN2002394. [DOI] [PubMed] [Google Scholar]
- 25.Riboli E, Kaaks R. The EPIC Project: rationale and study design. European Prospective Investigation into Cancer and Nutrition. Int J Epidemiol. 1997;26(Suppl 1):S6–S14. doi: 10.1093/ije/26.suppl_1.S6. [DOI] [PubMed] [Google Scholar]
- 26.Rolandsson O, Norberg M, Nystrom L, et al. How to diagnose and classify diabetes in primary health care: lessons learned from the Diabetes Register in Northern Sweden (DiabNorth) Scand J Prim Health Care. 2012;30:81–87. doi: 10.3109/02813432.2012.675565. [DOI] [PMC free article] [PubMed] [Google Scholar]
- 27.Kaaks R, Riboli E. Validation and calibration of dietary intake measurements in the EPIC project: methodological considerations. European Prospective Investigation into Cancer and Nutrition. Int J Epidemiol. 1997;26(Suppl 1):S15–S25. doi: 10.1093/ije/26.suppl_1.S15. [DOI] [PubMed] [Google Scholar]
- 28.Kaaks R, Slimani N, Riboli E. Pilot phase studies on the accuracy of dietary intake measurements in the EPIC project: overall evaluation of results. European Prospective Investigation into Cancer and Nutrition. Int J Epidemiol. 1997;26(Suppl 1):S26–S36. doi: 10.1093/ije/26.suppl_1.S26. [DOI] [PubMed] [Google Scholar]
- 29.Margetts BM, Pietinen P. European Prospective Investigation into Cancer and Nutrition: validity studies on dietary assessment methods. Int J Epidemiol. 1997;26(Suppl 1):S1–S5. doi: 10.1093/ije/26.suppl_1.S1. [DOI] [PubMed] [Google Scholar]
- 30.Slimani N, Deharveng G, Unwin I, et al. The EPIC nutrient database project (ENDB): a first attempt to standardize nutrient databases across the 10 European countries participating in the EPIC study. Eur J Clin Nutr. 2007;61:1037–1056. doi: 10.1038/sj.ejcn.1602679. [DOI] [PubMed] [Google Scholar]
- 31.Appel LJ, Moore TJ, Obarzanek E, et al. A clinical trial of the effects of dietary patterns on blood pressure. DASH Collaborative Research Group. N Engl J Med. 1997;336:1117–1124. doi: 10.1056/NEJM199704173361601. [DOI] [PubMed] [Google Scholar]
- 32.Sacks FM, Obarzanek E, Windhauser MM, et al. Rationale and design of the Dietary Approaches to Stop Hypertension trial (DASH). A multicenter controlled-feeding study of dietary patterns to lower blood pressure. Ann Epidemiol. 1995;5:108–118. doi: 10.1016/1047-2797(94)00055-X. [DOI] [PubMed] [Google Scholar]
- 33.Haftenberger M, Schuit AJ, Tormo MJ, et al. Physical activity of subjects aged 50–64 years involved in the European Prospective Investigation into Cancer and Nutrition (EPIC) Public Health Nutr. 2002;5:1163–1176. doi: 10.1079/PHN2002397. [DOI] [PubMed] [Google Scholar]
- 34.Barlow WE, Ichikawa L, Rosner D, Izumi S. Analysis of case-cohort designs. J Clin Epidemiol. 1999;52:1165–1172. doi: 10.1016/S0895-4356(99)00102-X. [DOI] [PubMed] [Google Scholar]
- 35.Wareham NJ, Jakes RW, Rennie KL, et al. Validity and repeatability of a simple index derived from the short physical activity questionnaire used in the European Prospective Investigation into Cancer and Nutrition (EPIC) study. Public Health Nutr. 2003;6:407–413. doi: 10.1079/PHN2002439. [DOI] [PubMed] [Google Scholar]
- 36.Thompson SG, Higgins JP. How should meta-regression analyses be undertaken and interpreted? Stat Med. 2002;21:1559–1573. doi: 10.1002/sim.1187. [DOI] [PubMed] [Google Scholar]
- 37.Pan A, Sun Q, Bernstein AM, et al. Red meat consumption and risk of type 2 diabetes: 3 cohorts of US adults and an updated meta-analysis. Am J Clin Nutr. 2011;94:1088–1096. doi: 10.3945/ajcn.111.018978. [DOI] [PMC free article] [PubMed] [Google Scholar]
- 38.Malik VS, Popkin BM, Bray GA, Despres JP, Willett WC, Hu FB. Sugar-sweetened beverages and risk of metabolic syndrome and type 2 diabetes: a meta-analysis. Diabetes Care. 2010;33:2477–2483. doi: 10.2337/dc10-1079. [DOI] [PMC free article] [PubMed] [Google Scholar]
- 39.Fung TT, McCullough M, van Dam RM, Hu FB. A prospective study of overall diet quality and risk of type 2 diabetes in women. Diabetes Care. 2007;30:1753–1757. doi: 10.2337/dc06-2581. [DOI] [PubMed] [Google Scholar]
- 40.Kroger J, Zietemann V, Enzenbach C, et al. Erythrocyte membrane phospholipid fatty acids, desaturase activity, and dietary fatty acids in relation to risk of type 2 diabetes in the European Prospective Investigation into Cancer and Nutrition (EPIC)–Potsdam Study. Am J Clin Nutr. 2011;93:127–142. doi: 10.3945/ajcn.110.005447. [DOI] [PubMed] [Google Scholar]
- 41.Patel PS, Sharp SJ, Jansen E, et al. Fatty acids measured in plasma and erythrocyte-membrane phospholipids and derived by food-frequency questionnaire and the risk of new-onset type 2 diabetes: a pilot study in the European Prospective Investigation into Cancer and Nutrition (EPIC)–Norfolk cohort. Am J Clin Nutr. 2010;92:1214–1222. doi: 10.3945/ajcn.2010.29182. [DOI] [PubMed] [Google Scholar]
- 42.Hodge AM, English DR, O'Dea K, et al. Plasma phospholipid and dietary fatty acids as predictors of type 2 diabetes: interpreting the role of linoleic acid. Am J Clin Nutr. 2007;86:189–197. doi: 10.1093/ajcn/86.1.189. [DOI] [PubMed] [Google Scholar]
- 43.Mozaffarian D, Cao H, King IB, et al. Trans-palmitoleic acid, metabolic risk factors, and new-onset diabetes in U.S. adults: a cohort study. Ann Intern Med. 2010;153:790–799. doi: 10.7326/0003-4819-153-12-201012210-00005. [DOI] [PMC free article] [PubMed] [Google Scholar]
- 44.Freedman LS, Schatzkin A, Midthune D, Kipnis V. Dealing with dietary measurement error in nutritional cohort studies. J Natl Cancer Inst. 2011;103:1086–1092. doi: 10.1093/jnci/djr189. [DOI] [PMC free article] [PubMed] [Google Scholar]
- 45.Shirani F, Salehi-Abargouei A, Azadbakht L (2013) Effects of Dietary Approaches to Stop Hypertension (DASH) diet on some risk for developing type 2 diabetes: a systematic review and meta-analysis on controlled clinical trials. Nutrition 29:939–947 [DOI] [PubMed]
- 46.Beulens JW, van der Schouw YT, Bergmann MM et al (2012) Alcohol consumption and risk of type 2 diabetes in European men and women: influence of beverage type and body size. The EPIC-InterAct study. J Intern Med 272:358–370 [DOI] [PubMed]
- 47.Cooper AJ, Forouhi NG, Ye Z, et al. Fruit and vegetable intake and type 2 diabetes: EPIC-InterAct prospective study and meta-analysis. Eur J Clin Nutr. 2012;66:1082–1092. doi: 10.1038/ejcn.2012.85. [DOI] [PMC free article] [PubMed] [Google Scholar]
Associated Data
This section collects any data citations, data availability statements, or supplementary materials included in this article.
Supplementary Materials
(PDF 8 kb)
(PDF 62 kb)
(PDF 20 kb)