

Significance
Epithelia are the tissue layers that line organs throughout the body. Their complex movements and extensive reorganization have been widely studied as a model system of embryo development. Epithelial cells have been theoretically described using physical models close to those used for soap bubbles and foams. Nevertheless, although morphogenesis is intrinsically three-dimensional, previous works have mostly considered a two-dimensional planar geometry. In this paper, we provide a theoretical three-dimensional description of epithelial sheets, which describes within a single framework many developmental transitions, such as the formation of cavities or cellular tubes of a given size. We provide simple scaling laws that could be verified experimentally, for each of these transitions.
Keywords: mathematical modeling, active foams, biophysics
Abstract
Morphogenesis during embryo development requires the coordination of mechanical forces to generate the macroscopic shapes of organs. We propose a minimal theoretical model, based on cell adhesion and actomyosin contractility, which describes the various shapes of epithelial cells and the bending and buckling of epithelial sheets, as well as the relative stability of cellular tubes and spheres. We show that, to understand these processes, a full 3D description of the cells is needed, but that simple scaling laws can still be derived. The morphologies observed in vivo can be understood as stable points of mechanical equations and the transitions between them are either continuous or discontinuous. We then focus on epithelial sheet bending, a ubiquitous morphogenetic process. We calculate the curvature of an epithelium as a function of actin belt tension as well as of cell–cell and and cell–substrate tension. The model allows for a comparison of the relative stabilities of spherical or cylindrical cellular structures (acini or tubes). Finally, we propose a unique type of buckling instability of epithelia, driven by a flattening of individual cell shapes, and discuss experimental tests to verify our predictions.
Understanding the development and stability of well-defined morphologies in mature epithelial tissues is an important challenge. During embryogenesis, epithelial sheets undergo extensive and precise morphological changes, which generate the 3D structure of organs (1–3). Metaplasia, which is the conversion from one cell morphology to another one, is associated with several cancers (4). It is widely acknowledged that adhesion and cytoskeleton contractile forces, mediated by the Rho family GTPases, play an important role in the determination of cell shape (3, 5), development (2, 6), and cancer initiation (7). Although much is known about the underlying genetic regulation of these events (2, 7, 8) and although new experimental tools have allowed their quantitative measurements (9, 10), a global understanding of the physical mechanisms shaping a tissue remains elusive (3).
Theoretical efforts on epithelial morphology have largely focused on 2D models of the top (apical) surface of cell sheets [with some exceptions considering 2D models of cell heights with tensile forces (11, 12)]. They have been used, for instance, to deduce the geometric arrangement of cell–cell apical junctions (5, 13–15) or the out-of-plane buckling of apical surfaces (16). Nevertheless, morphogenesis and cellular shape changes are intrinsically 3D processes, for which both lateral and basal tensions also play a role (2, 17, 18), so 2D approaches cannot tackle many important morphogenetic events.
In this article, we present a minimal model that can explain, with few and measurable parameters associated with adhesion and contractile forces (Fig. 1), several aspects of epithelial cell shape and tissue morphology. We first discuss epithelial cell aspect ratio in three dimensions on a flat substrate, considering three types of cells: tall and thin, (columnar), flat and spread out (squamous), or an intermediate cuboidal shape (2). We then calculate the spontaneous curvature adopted by a cell sheet as a function of cell–substrate and cell–cell tensions and contractile forces from the apical actin belt. This sheds light on the stability of cellular structures, such as spheres or tubes, and on the epithelial sheet bending involved in a wide variety of developmental processes (3, 9, 10), including gastrulation and neural tube, ventral furrow, and lens placode formation. Finally, we show how varying cell adhesion or actomyosin constriction above a certain threshold in a confined environment can cause an epithelial sheet to buckle, as observed during the development of the Drosophila wing disk (19). For each of these phenomena, we give scaling laws that could serve as simple guides for future experiments.
Fig. 1.

Sketch of our theoretical model.
Morphologies of Planar Epithelial Cells
We model epithelial cells as hexagonal prisms of base length r and height h. We consider only cohesive sheets and, at first, we do not implement any constraint on the total area of the sheet. Considering all cells as identical, we write the force balance equation on a single cell, which we consider planar in this section. We deliberately forget about the detailed topography of the cell–cell junctions, which was described in two dimensions in ref. 14 to focus on generic scaling arguments. Although the tissue is an out-of-equilibrium system, it is convenient to write the mechanical equilibrium at steady state as the minimization of a work function, or effective energy  , where the nonequilibrium aspect is hidden in the tensions (Fig. S1). We define a cell as columnar when
  , cuboidal when
  and squamous when
  .
.
Epithelial cells display an apico-basal polarity (1): The adhesion with the substrate defines the basal surface, whereas a contractile actomyosin belt often forms on the upper, apical surface. We thus consider the following contributions to the effective energy: a cell–substrate energy, proportional to the basal area,  ; a cell–cell lateral energy, proportional to the lateral area,
  ; and an energy associated to the tension of the apical actomyosin belt
  , proportional to the apical perimeter,
  .
.
The lateral tension  is the sum of several contributions of opposite signs (20): a positive contribution from contractile forces of the actomyosin lateral cortex, which tends to minimize the lateral surface, and a negative contribution from the adhesion with the neighboring cells, which tends to maximize the lateral surface. The tensions could also have contributions from external stresses. Thus, the tensions
  and
and  are either positive or negative.
For practical reasons, we define and use  , the effective lateral adhesion, in the rest of the article. Moreover, although tension often dominates in the actin cable (3), we study the case of either positive or negative
  for completeness. We assume that the cells have a preferred volume
  and we expand the effective energy around
  . The first contribution is
  , where V is the cell volume and B a compression modulus. Therefore, our effective energy reads
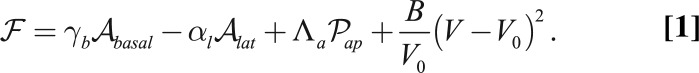 |
If the compression modulus is large  , V is constant and equal to
  , as observed during several morphological changes (8, 10) (the case of finite B is treated in SI Text and does not change qualitatively the results). This yields a geometrical relationship between r and h:
  .
.
In the case  ,
,  , the two configurations that minimize the effective energy from Eq. 1 are then either infinitely thin and spread cells
  or infinitely tall cells
  . Therefore, an additional stabilizing term is necessary, as observed in ref. 20. Because it has been shown that the cytoskeleton is an important determinant of cell shape (21), we stress that a cell is a dense solution of cytoplasmic components, which cannot be indefinitely squeezed (20). Notably, intermediate filaments are known to function as a stress-bearing structure (22). We show in the next section through simple orders of magnitude that it could be a sufficient stabilizing mechanism. Moreover, the cell nucleus is a rigid object and is deformed when cells are confined (23). The confinement of a solution of nonadsorbing Gaussian polymers to a thickness h requires an energy
  (24), where A is a coefficient dependent on the properties of the polymer. When cells become very tall
  , the same confinement energy should be included:
  . We discuss other hypotheses in the next section and in SI Text.
To eliminate the prefactors coming from the hexagonal geometry, we choose  as the unit length and
  as the unit energy (details in SI Text). We obtain a simple equation, with only three rescaled parameters, which we rename
  ,
,  , and
, and  :
:
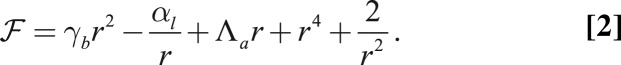 |
The minimum of this energy function  defines the cell base length at mechanical equilibrium.
Assumption of the Model.
Our main assumption is the form of the confinement energy of the cytoplasmic components written as  , which is the confinement energy of Gaussian polymers. Other assumptions on the nature of the cytoplasmic components, or on a precise rheology of the nucleus, would yield different power laws of the form
  . For instance, it has been argued that semiflexible polymers correspond, in the high-confinement limit, to
  (25). Nevertheless, it should be noted that several scaling laws we derive (Eqs. 5 and 6), as well as the main features of the phase diagrams, are model independent and hold for any value of the exponent n. On the other hand, some scaling laws are model dependent. We derive them for any n and draw the phase diagrams for various values of n in SI Text and Fig. S2. An alternative stabilizing mechanism could be an active regulation of the tensions to achieve some target basal and lateral areas
  and
and  . Then, expanding the tensions around these target areas to first order
  and
and  yields the same stabilizing terms as our model, as long as the coefficients
  are positive. In SI Text and Fig. S3, we show that the results of the main text are not qualitatively modified by assuming an active regulation of the tensions.
Stable Epithelial Cell Aspect Ratios.
In our model, cell–cell lateral adhesion  and apical belt tension favor tall columnar cells, whereas cell–cell contractile forces
  and cell–substrate adhesion
  favor squamous cells, in agreement with the experimental observations that squamous cells down-regulate E-cadherin and Fas2/3 (cell–cell adhesion) (17, 18), whereas columnar cells up-regulate E-cadherin expression and down-regulate cell–matrix adhesion (2, 18).
More precisely, from Eq. 2, we give analytical limits for cell aspect ratios. If cell–substrate adhesion is dominant ( and
and  ), cells are squamous and spread to a base length
  . If cell–cell adhesion is dominant (
 and
and  ), cells are columnar and the stable base length is
  . If cell–cell contractile forces are dominant (
 and
and  ), cells are squamous and the stable base length is
  . Finally, if apical contractile forces are dominant
  , cells are columnar and the stable base length is
  .
.
We now estimate the parameters of the model. The main unknown is the confinement energy of the cytoplasmic components A. In vitro experiments on the confinement of actin chains (25), as well as rheological measurements on Xenopus egg cytoplasmic extracts (26), suggest an order of magnitude of  (SI Text). Although the complete cytoskeleton in a living cell is much more complex and can partially reorganize when the cell morphology changes, using a lower bound value, with typical values of the cell surface energies
  and
and  of
of  (27) would predict a base length of squamous cells
  of order
  , with a cellular height
  . These estimates are close to the observed values for a cell of volume
  (28) and suggest that this confinement contribution could be large enough to stabilize cell spreading to a realistic height. Moreover, for an apical belt of transverse radius
  , the typical line tension is
  , where Π is the characteristic contractile stress of actomyosin cables that can be estimated from laser-cutting experiments (29). Reported values are
  and
and  , so
, so  (30). Then, in our renormalized units, we deduce
  ,
,  , and
, and  and calculate the following phase diagrams using parameters within this regime.
Shape Transitions in Epithelia.
When the parameters are varied continuously, the transition from columnar to squamous cells can be either smooth or discontinuous, typical of a bistable system. Fig. 2 A and B shows the two possible profiles of the effective energy  , for increasing
  : either one minimum r, continuously decreasing with increasing
  , or two distinct minima corresponding to squamous and columnar morphologies.
Fig. 2.

Epithelial cell aspect ratio as a bistable phenomenon. (A) Plots of the effective energy of a cell as a function of the cell base length r, when apical belt tension  is increased (Left to Right). If contractile forces dominate
  , only one minimum of the energy, cells go continuously from squamous to cuboidal to columnar aspect ratios. If lateral adhesion is large enough (
 negative), two minima, cells “jump” from squamous to columnar aspect ratios. (B) Phase diagram as a function of
  and
and  for
for  , showing regions of continuous and discontinuous transitions.
The observed morphologies of epithelial cells are therefore found as the stable points of a force balance equation and there are nontrivial transitions between aspect ratios. The appearance of a new stable point occurs if  , a condition that defines the so-called spinodal lines, separating regions with one stable aspect ratio from regions with two stable aspect ratios. We perform a numerical integration of these equations to obtain the phase diagram of epithelial aspect ratio, plotted in a plane (
 −
− ) for
) for  (Fig. 2B), and derive scaling laws for various values of
  near the critical point (Fig. S4).
This model agrees qualitatively with a wide range of experimental data. Notably, many epithelial shape changes feature an apical constriction, regulated by RhoA (9). We predict that the tension in the apical belt  , as well as the cell–cell lateral adhesion, is a crucial parameter to establish a mature columnar epithelium. Indeed, either down-regulating the apical myosin IIb through blebbistatin (31) or lowering the lateral cell–cell interaction through Tmod3 (8) decreases cell height by about
  .
.
We also predict that, depending on the parameters, one should observe either a progressive cuboidal to columnar transition, as in Drosophila wing morphogenesis (19) (mediated by the Dpp-Rho1-myosin IIb pathway, which again up-regulates the apical tension), or a sharp squamous to columnar transition, as in Barrett’s metaplasia before stomach cancer (4). A stronger, quantitative test would be to quantify the aspect ratio of epithelial cells while varying smoothly myosin activity, for instance using a control parameter that could be blebbistatin concentration.
Finally, rewriting the effective energy from Eq. 2 as a function of cellular perimeter  and apical surface
  , we can compare our 3D effective energy to previous 2D theories
 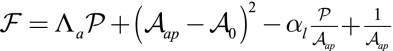 . The first two terms are the same as in ref. 14, where
  . In the limit of low lateral adhesion
  , the following two terms are negligible and considering only the 2D apical surface is a valid approximation. Nevertheless, lateral adhesion must always be taken into account for very columnar and thin cells
  .
.
Epithelial Sheet Bending
We now examine 3D deformations of a cell sheet, without introducing any new parameters. The forces from basal tension and apical belt tension are not in the same location. If the substrate can deform, cells therefore adopt a “lampshade” shape (Fig. 3A), which leads to a spontaneous curvature of the epithelial sheet. This curvature can be either positive or negative, depending on the relative values of apical belt tension and the basal tension (Fig. 4 and Fig. S5). We discuss in SI Text (Fig. S5) a more precise analytical criterion for the curvature sign.
Fig. 3.

Spontaneous curvature of an apically constricted tissue. (A) Sketch of our model. The cell is modeled as part of a sheet of constant height h between apical and basal sides. (B) Numerical integration of  and
and  as a function of apical belt tension
  . (C) Sketch of a biological application: lens placode formation. The apical belt tension is increased locally, causing the tissue to invaginate with radius of curvature R. (D) Curvature and bending rigidity of the cell sheet as a function of apical belt tension
  for various values of
  (yellow),
  (green),
  (purple), and
  (black). Note the change in convexity as
  changes sign. (E) Bending rigidity as a function of cell–cell adhesion, for various values of
  (orange),
  (green),
  (blue), and
  (black).
Fig. 4.

Phase diagram of the 3D architecture of epithelial tissue, as a function of apical belt tension  and lateral adhesion
  , for
, for  . The apical side is drawn in red and the basal side in blue. The apical side lines the interior of the sphere if
  , and the exterior is
  . We concentrate on the region
  : The curvature increases for increasing
  , either continuously or discontinuously (hatched regions). The epithelium is more columnar for high values of
  .
.
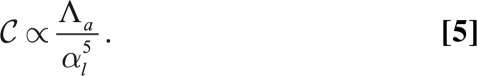
If all cells have the same morphology, the tissue bends and its global shape can be deduced from the individual cell properties. It is useful to define, in analogy to the theory of surfactants (32), the spontaneous curvature of asymmetric cells, i.e., the curvature of the cellular sphere that they would spontaneously form,
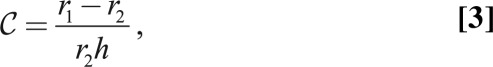 |
where h is the height of a cell as before, and  and
and  are, respectively, the characteristic length of the cell apical and basal surface.
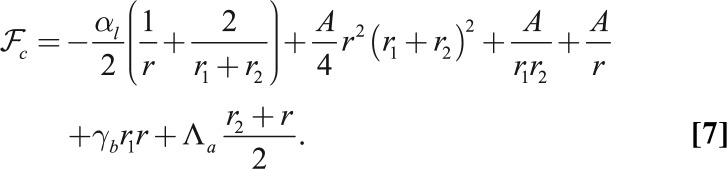
Considering as before a constant volume  , the effective energy of a cell (SI Text) is
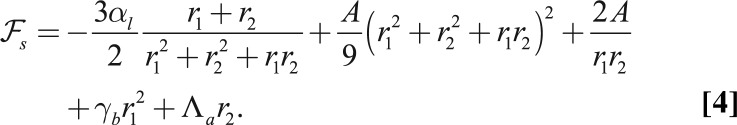 |
We include a bending force from the substrate in SI Text (Fig. S6). The cell shape asymmetry is driven by the contributions of  and
and  to the effective energy.
If  , the cell sheet is planar and the analysis of the previous section holds. When
  or
or  increases,
  and
and  become increasingly different. There are two limiting cases, as
  or
or  is increased: a smooth increase of the curvature or an abrupt transition from a flat to a curved sheet (Fig. 3B). We first set
  and examine the impact of the actin belt tension
  , whose importance is most often emphasized (1), and consider
  in SI Text (Figs. S5 and S7).
Curvature Induced by an Apical Belt Tension.
We determine numerically the mechanical equilibrium defined as  . We assume that the lateral adhesion dominates (
 > 0); therefore, the epithelium is columnar. When the lateral adhesion increases, the curvature
  of the epithelium decreases (Fig. 3D), because lateral adhesion favors symmetrical shapes. We derive scaling laws for two limiting cases of small and high curvatures:
  and
and  .
.
If  , we rewrite
  and expand the effective energy in powers of
  . We find
 |
In the opposite limit,  , we obtain
  ,
,  . The curvature is slightly sublinear:
  . These theoretical predictions agree qualitatively with the experiments of ref. 9, showing that the curvature of an epithelium increases (resp. decreases) with a higher (resp. lower) recruitment of myosin IIb and P-MLRC at the apex of the cell.
They could be tested quantitatively by measuring the curvature of an epithelial monolayer and comparing it to the stress in the apical belt from laser-cutting experiments. Alternatively, mimicking an apical constriction on a collagen scaffold on known mechanical properties (33) could allow for a noninvasive, quantitative measurement of bending forces. Even simpler, for any exponent n in the confinement energy, the scaling law
holds in the limit of high constriction, which could be tested without any need to measure tensions.
It is useful to define an effective bending rigidity  of the epithelial sheet, which quantifies the resistance of a cell layer to the apical constriction. A strength of our model is that we calculate this quantity from a realistic microscopic model and do not assume it a priori. For
  , the bending rigidity is constant (Fig. 3D) and depends very strongly on the value of the lateral adhesion:
 . For
. For  , because
  is quasi-linear with
  , the bending rigidity is also roughly constant, but has a much lower value, mostly independent of
  .
.
Moreover, for large values of the lateral adhesion  , the epithelium shows a discontinuous transition: The bending rigidity stays very high until a critical value of
  .
.
Finally, we give a phase diagram of 3D epithelial sheet organization. There are three spinodal “tongues” and thus three critical points. For  (Fig. 4), there is a range of stability of quasi-flat sheets, around
  (squamous cells if
  , columnar cells if
  ). When
  increases, the curvature of the cell sheet increases either continuously
  or discontinuously
  .
.
Curvature Induced by an Apical Surface Tension.
In some morphogenetic events, invagination is driven by the constriction of the entire apical cortex, instead of a circumferential apical belt (1). We set the belt tension  and call
  the apical surface tension, which adds a contribution
  in Eq. 4. The results are qualitatively similar to those of the previous section, although the scaling laws are different. In the regime of low apical tensions
  , the curvature is
  . In the regime of high apical tensions
  ,
,  ,
,  , and
, and  . Interestingly, these two scaling laws in
  are quite different and could be distinguishable in experiments. The scaling law
  also holds.
Cellular Tubes vs. Cellular Spheres
So far, we have calculated the spontaneous curvature of individual cells, assuming that the cell sheet would curve isotropically, with a spherical geometry. Nevertheless, other geometries are seen in vivo and could be more stable. We now compare the stability of spheres and tubes for various parameters. A cell in a tube is curved in one direction, and we define  as the dimension of the apical side in the curved direction,
  as the dimension of the basal side in the curved direction, and r as the dimension in the noncurved direction (Fig. 5 A and B).
Fig. 5.

(A and B) Comparison of the mechanical stability for cellular tubes, made of cells curved in one direction (A), and cellular spheres, curved in two directions (B). (C) Stability diagram as a function of lateral adhesion  and apical tension
  .
.
If the apical constriction is anisotropic, as in neural tube formation, a sheet bends only in one direction, creating a tube. The anisotropy is then built into the microscopic deformation. Nevertheless, we show here that tubes could be favored even if the apical constriction is isotropic, through a spontaneous symmetry breaking at the tissue level. This is because, for a given cell volume, a tubular morphology maximizes cell–cell adhesion, because a rectangular prism has a larger surface area than a regular prism. Therefore, high values of  tend to favor tubular geometries.
Using the same model as before, a tubular cell of volume  has an effective energy
 |
For an epithelium constricting through an apical belt, the spherical configuration is always the most stable, except at extreme values of  , in a very narrow parameter range. On the other hand, for an epithelium constricting through an actin cortex with apical tension
  , the range of parameters where tubes are more stable drastically widens. We compare the effective energies of the two configurations at steady state (Fig. 5C) and calculate a phase diagram as a function of
  and
and  .
.
In the case of apical belt tension and in the limit  , the scaling law of the spherical effective energy at mechanical equilibrium is
  , whereas for the cylindrical effective energy,
  , a larger exponent. This means that for large enough
  , spheres are always more stable, which restricts drastically the stability range of tubes.
In contrast, for apical surface tension and in the regime  , the energies of the two configurations have the same scaling,
  (Fig. S8A), so tubular configurations have a much larger stability range. Moreover, considering a nonnegligible cell–cell adhesion
  allows us to calculate the next term in the expansion of the energies:
  and
and 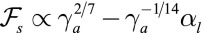 . When the apical tension
  increases, the cell–cell contribution stabilizes more and more the cylindrical morphology compared with the spherical. Therefore, when
  is large, cylindrical morphologies are more stable for large values of
  , as observed in the phase diagram.
Additionally, to fully explore the space of possible shapes, we consider the stability of cellular ellipsoids, made of cells that have two distinct curvatures  and
and  (Fig. S8B), which we calculate at mechanical equilibrium. The results confirm the previous stability diagram, the main difference being that the transition between a sphere and a tube is smooth; i.e., the stable shape is a more and more elongated ellipsoid far from the transition. For low values of
  , the ratio of the two curvatures is 1, before increasing sharply at the transition (Fig. S8C).
Buckling Induced by Cell Shape Changes
Finally, we consider the confinement of an epithelium to an area different from its equilibrium value. If this occurs, cells can accommodate the decreased area by increasing their height. However, the area accessible to cells can also increase to its value dictated by mechanical equilibrium through an out-of-plane deformation of the entire sheet. This occurs if the energetic cost of bending the sheet is larger than the energetic cost of compression and is analogous to the Eulerian buckling of an elastic sheet under compression. For example, during Drosophila wing development, the columnar epithelium forms several folds. Moreover, local mutations affecting the actin belt cause the epithelium to collapse to a lower height and a bigger area and thus to form additional folds (19).
Therefore, buckling instabilities can arise not only from stresses due to cell division (34), but also from cellular shape changes, caused by adhesion or apical contractility changes. To our knowledge, this last possibility has not been explored theoretically. We therefore compare the stability of confined and buckled epithelia and consider a one-dimensional layer of columnar cells, in the limit  (see SI Text for the other limit). The equilibrium base length is then
  . Confining a cell to a new base length
  costs an effective energy
 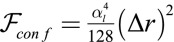 , where
  . In a buckled sheet, parameterized by the definition
  (Fig. 6), cells are forced to adopt a lampshade shape that has an energetic cost, but the amplitude and wavelength u and q are such as to accommodate cells to their equilibrium base length
  . The energetic cost of the buckled configuration for a cell (SI Text) is
  . Therefore, the confinement energy depends quadratically on the confinement
  , whereas the effective buckling energy is linear in
  . This means that small confinements are always accommodated by a uniform squeezing of the sheet, until a critical threshold where the sheet buckles. Not surprisingly, large wavelengths
  are favored and reduce the buckling energy, because less bending is required of each individual cell. The preferred wavelength is then the length of the sheet L, with a critical confinement threshold
 |
The threshold increases with  , in agreement with our previous observation that cell–cell adhesion increases the bending rigidity of a sheet. Conversely, we consider the complementary case where the projected area of the sheet stays fixed and a mutation causes cell–cell adhesion to decrease to
  . Again, the sheet buckles if the cell–cell adhesion decreases more than a threshold value
  .
.
Fig. 6.

Cell confinement and buckling. When a tissue is confined by external forces to an area lower than the area dictated by its mechanical equilibrium, it can either be homogeneously compressed or buckle to relieve the stress.
Discussion
In this article, we introduce a minimal model for epithelial cell morphology in three dimensions. Our model allows for the calculation of the equilibrium base length and height of epithelial cells as a function of three parameters: apical belt tension and cell–cell and cell–substrate tensions. These three parameters alone do not lead to stable equilibrium as soon as adhesion dominates contractile forces, and an additional term must be added to account for the fact that a cell cannot spread indefinitely. Several physical mechanisms could in principle be invoked, but the orders of magnitude we calculated suggest that the confinement energy of cytoplasmic components could be large enough to reproduce realistic aspect ratios.
It should be noted that the typical height of a squamous cell is similar to the typical radius of a columnar cell (on the order of a few microns) and that this value is comparable to the persistence length of intermediate filaments such as keratin ( ) (35), the length scale at which we expect confinement forces to be large. Therefore, the model that we propose could function as a passive size-sensing mechanism in epithelia. We insist, however, that most results presented here would not be qualitatively different if a wide range of other stabilizing mechanisms were used, for instance a regulation of the active tensions that would function as an active size-sensing mechanism.
This theory predicts nontrivial phase transitions: On planar substrates, the aspect ratio of cells varies either continuously or discontinuously with the parameters. We give analytical criteria to discriminate between the two regimes and discuss the implications during morphogenesis. We then derive a full phase diagram of epithelial morphology in three dimensions, and a central result of this article is a scaling law for the curvature of an epithelium as a function of apical belt tension and cell–cell lateral adhesion. It is thus controlled by few parameters, which are part of a larger regulatory network. They are, in general, not varied independently in vivo: Both tensions and the confinement energy of the cytoskeleton could be modified as a function of cellular morphology itself. In the case of a discontinuous morphological transition, this implies protein expression levels would in turn be discontinuous.
An interesting consequence of this phase diagram is that a region exists where both columnar and squamous epithelia are stable. If cells are confined to a constant number in a constant area (Fig. S9), we thus expect a phase separation, with a region of columnar cells and a region of squamous cells, even for identical cell and substrate properties. This echoes the morphological transition of the follicle cell epithelium into two distinct populations during Drosophila oogenesis (28).
Our theory can also be generalized to include external stresses acting on the sheet. Additional aspects of the cell biology, such as cell division or apoptosis, or active behaviors such as migration, oscillations, and fluid pumping could be incorporated as well in a straightforward manner. Moreover, numerical simulations would be necessary to investigate the role of noise and disorder in the morphology of epithelial sheets.
Supplementary Material
Footnotes
The authors declare no conflict of interest.
This article is a PNAS Direct Submission.
This article contains supporting information online at www.pnas.org/lookup/suppl/doi:10.1073/pnas.1312076111/-/DCSupplemental.
References
- 1.Dawes-Hoang RE, et al. Folded gastrulation, cell shape change and the control of myosin localization. Development. 2005;132(18):4165–4178. doi: 10.1242/dev.01938. [DOI] [PubMed] [Google Scholar]
- 2.Montell DJ. Morphogenetic cell movements: Diversity from modular mechanical properties. Science. 2008;322(5907):1502–1505. doi: 10.1126/science.1164073. [DOI] [PubMed] [Google Scholar]
- 3.Lecuit T, Lenne PF. Cell surface mechanics and the control of cell shape, tissue patterns and morphogenesis. Nat Rev Mol Cell Biol. 2007;8(8):633–644. doi: 10.1038/nrm2222. [DOI] [PubMed] [Google Scholar]
- 4.Jankowski JA, Harrison RF, Perry I, Balkwill F, Tselepis C. Barrett’s metaplasia. Lancet. 2000;356(9247):2079–2085. doi: 10.1016/S0140-6736(00)03411-5. [DOI] [PubMed] [Google Scholar]
- 5.Käfer J, Hayashi T, Marée AF, Carthew RW, Graner F. Cell adhesion and cortex contractility determine cell patterning in the Drosophila retina. Proc Natl Acad Sci USA. 2007;104(47):18549–18554. doi: 10.1073/pnas.0704235104. [DOI] [PMC free article] [PubMed] [Google Scholar]
- 6.Pouille PA, Farge E. Hydrodynamic simulation of multicellular embryo invagination. Phys Biol. 2008;5(1):015005. doi: 10.1088/1478-3975/5/1/015005. [DOI] [PubMed] [Google Scholar]
- 7.Hanahan D, Weinberg RA. Hallmarks of cancer: The next generation. Cell. 2011;144(5):646–674. doi: 10.1016/j.cell.2011.02.013. [DOI] [PubMed] [Google Scholar]
- 8.Weber KL, Fischer RS, Fowler VM. Tmod3 regulates polarized epithelial cell morphology. J Cell Sci. 2007;120(Pt 20):3625–3632. doi: 10.1242/jcs.011445. [DOI] [PubMed] [Google Scholar]
- 9.Chauhan BK, Lou M, Zheng Y, Lang RA. Balanced Rac1 and RhoA activities regulate cell shape and drive invagination morphogenesis in epithelia. Proc Natl Acad Sci USA. 2011;108(45):18289–18294. doi: 10.1073/pnas.1108993108. [DOI] [PMC free article] [PubMed] [Google Scholar]
- 10.Gelbart MA, et al. Volume conservation principle involved in cell lengthening and nucleus movement during tissue morphogenesis. Proc Natl Acad Sci USA. 2012;109(47):19298–19303. doi: 10.1073/pnas.1205258109. [DOI] [PMC free article] [PubMed] [Google Scholar]
- 11.Ziherl P, Krajnc M, Storgel N, Brezavscek AH. A tension-based model of flat and corrugated simple epithelia. Soft Matter. 2013;9(34):8368–8377. [Google Scholar]
- 12.Hočevar Brezavšček A, Rauzi M, Leptin M, Ziherl P. A model of epithelial invagination driven by collective mechanics of identical cells. Biophys J. 2012;103(5):1069–1077. doi: 10.1016/j.bpj.2012.07.018. [DOI] [PMC free article] [PubMed] [Google Scholar]
- 13.Hilgenfeldt S, Erisken S, Carthew RW. Physical modeling of cell geometric order in an epithelial tissue. Proc Natl Acad Sci USA. 2008;105(3):907–911. doi: 10.1073/pnas.0711077105. [DOI] [PMC free article] [PubMed] [Google Scholar]
- 14.Farhadifar R, Röper JC, Aigouy B, Eaton S, Jülicher F. The influence of cell mechanics, cell-cell interactions, and proliferation on epithelial packing. Curr Biol. 2007;17(24):2095–2104. doi: 10.1016/j.cub.2007.11.049. [DOI] [PubMed] [Google Scholar]
- 15.Gibson MC, Patel AB, Nagpal R, Perrimon N. The emergence of geometric order in proliferating metazoan epithelia. Nature. 2006;442(7106):1038–1041. doi: 10.1038/nature05014. [DOI] [PubMed] [Google Scholar]
- 16.Osterfield M, Du X, Schüpbach T, Wieschaus E, Shvartsman SY. Three-dimensional epithelial morphogenesis in the developing Drosophila egg. Dev Cell. 2013;24(4):400–410. doi: 10.1016/j.devcel.2013.01.017. [DOI] [PMC free article] [PubMed] [Google Scholar]
- 17.Gomez JM, Wang Y, Riechmann V. Tao controls epithelial morphogenesis by promoting Fasciclin 2 endocytosis. J Cell Biol. 2012;199(7):1131–1143. doi: 10.1083/jcb.201207150. [DOI] [PMC free article] [PubMed] [Google Scholar]
- 18.Melani M, Simpson KJ, Brugge JS, Montell D. Regulation of cell adhesion and collective cell migration by hindsight and its human homolog RREB1. Curr Biol. 2008;18(7):532–537. doi: 10.1016/j.cub.2008.03.024. [DOI] [PubMed] [Google Scholar]
- 19.Widmann TJ, Dahmann C. Dpp signaling promotes the cuboidal-to-columnar shape transition of Drosophila wing disc epithelia by regulating Rho1. J Cell Sci. 2009;122(Pt 9):1362–1373. doi: 10.1242/jcs.044271. [DOI] [PubMed] [Google Scholar]
- 20.Manning ML, Foty RA, Steinberg MS, Schoetz EM. Coaction of intercellular adhesion and cortical tension specifies tissue surface tension. Proc Natl Acad Sci USA. 2010;107(28):12517–12522. doi: 10.1073/pnas.1003743107. [DOI] [PMC free article] [PubMed] [Google Scholar]
- 21.Ingber DE, Prusty D, Sun Z, Betensky H, Wang N. Cell shape, cytoskeletal mechanics, and cell cycle control in angiogenesis. J Biomech. 1995;28(12):1471–1484. doi: 10.1016/0021-9290(95)00095-x. [DOI] [PubMed] [Google Scholar]
- 22.Coulombe PA, Wong P. Cytoplasmic intermediate filaments revealed as dynamic and multipurpose scaffolds. Nat Cell Biol. 2004;6(8):699–706. doi: 10.1038/ncb0804-699. [DOI] [PubMed] [Google Scholar]
- 23.Versaevel M, Grevesse T, Gabriele S. Spatial coordination between cell and nuclear shape within micropatterned endothelial cells. Nat Commun. 2012;3:671. doi: 10.1038/ncomms1668. [DOI] [PubMed] [Google Scholar]
- 24.de Gennes P-G. Scaling Concepts in Polymer Physics. Ithaca, NY: Cornell Univ Press; 1979. [Google Scholar]
- 25.Claessens MMAE, Tharmann R, Kroy K, Bausch AR. Microstructure and viscoelasticity of confined semiflexible polymer networks. Nat Phys. 2006;2(3):186–189. [Google Scholar]
- 26.Valentine MT, Perlman ZE, Mitchison TJ, Weitz DA. Mechanical properties of Xenopus egg cytoplasmic extracts. Biophys J. 2005;88(1):680–689. doi: 10.1529/biophysj.104.048025. [DOI] [PMC free article] [PubMed] [Google Scholar]
- 27.Maître JL, et al. Adhesion functions in cell sorting by mechanically coupling the cortices of adhering cells. Science. 2012;338(6104):253–256. doi: 10.1126/science.1225399. [DOI] [PubMed] [Google Scholar]
- 28.Kolahi KS, et al. Quantitative analysis of epithelial morphogenesis in Drosophila oogenesis: New insights based on morphometric analysis and mechanical modeling. Dev Biol. 2009;331(2):129–139. doi: 10.1016/j.ydbio.2009.04.028. [DOI] [PMC free article] [PubMed] [Google Scholar]
- 29.Solon J, Kaya-Copur A, Colombelli J, Brunner D. Pulsed forces timed by a ratchet-like mechanism drive directed tissue movement during dorsal closure. Cell. 2009;137(7):1331–1342. doi: 10.1016/j.cell.2009.03.050. [DOI] [PubMed] [Google Scholar]
- 30.Saez A, et al. Traction forces exerted by epithelial cell sheets. J Phys Condens Matter. 2010;22(19):194119. doi: 10.1088/0953-8984/22/19/194119. [DOI] [PubMed] [Google Scholar]
- 31.Zhang J, et al. Actin at cell-cell junctions is composed of two dynamic and functional populations. J Cell Sci. 2005;118(Pt 23):5549–5562. doi: 10.1242/jcs.02639. [DOI] [PubMed] [Google Scholar]
- 32.Israelachvili JN, Mitchell DJ, Ninham BW. Theory of self-assembly of hydrocarbon amphiphiles into micelles and bilayers. J Chem Soc Faraday Trans II. 1976;72:1525–1568. [Google Scholar]
- 33.Harris AR, et al. Characterizing the mechanics of cultured cell monolayers. Proc Natl Acad Sci USA. 2012;109(41):16449–16454. doi: 10.1073/pnas.1213301109. [DOI] [PMC free article] [PubMed] [Google Scholar]
- 34.Hannezo E, Prost J, Joanny JF. Instabilities of monolayered epithelia: Shape and structure of villi and crypts. Phys Rev Lett. 2011;107(7):078104. doi: 10.1103/PhysRevLett.107.078104. [DOI] [PubMed] [Google Scholar]
- 35.Mücke N, et al. Assessing the flexibility of intermediate filaments by atomic force microscopy. J Mol Biol. 2004;335(5):1241–1250. doi: 10.1016/j.jmb.2003.11.038. [DOI] [PubMed] [Google Scholar]
Associated Data
This section collects any data citations, data availability statements, or supplementary materials included in this article.