

Abstract
Synaptic vesicle recycling sustains high rates of neurotransmission at the ribbon-type active zones (AZs) of mouse auditory inner hair cells (IHCs), but its modes and molecular regulation are poorly understood. Electron microscopy indicated the presence of clathrin-mediated endocytosis (CME) and bulk endocytosis. The endocytic proteins dynamin, clathrin, and amphiphysin are expressed and broadly distributed in IHCs. We used confocal vglut1–pHluorin imaging and membrane capacitance (Cm) measurements to study the spatial organization and dynamics of IHC exocytosis and endocytosis. Viral gene transfer expressed vglut1–pHluorin in IHCs and targeted it to synaptic vesicles. The intravesicular pH was ∼6.5, supporting only a modest increase of vglut1–pHluorin fluorescence during exocytosis and pH neutralization. Ca2+ influx triggered an exocytic increase of vglut1–pHluorin fluorescence at the AZs, around which it remained for several seconds. The endocytic Cm decline proceeded with constant rate (linear component) after exocytosis of the readily releasable pool (RRP). When exocytosis exceeded three to four RRP equivalents, IHCs additionally recruited a faster Cm decline (exponential component) that increased with the amount of preceding exocytosis and likely reflects bulk endocytosis. The dynamin inhibitor Dyngo-4a and the clathrin blocker pitstop 2 selectively impaired the linear component of endocytic Cm decline. A missense mutation of dynamin 1 (fitful) inhibited endocytosis to a similar extent as Dyngo-4a. We propose that IHCs use dynamin-dependent endocytosis via CME to support vesicle cycling during mild stimulation but recruit bulk endocytosis to balance massive exocytosis.
Keywords: clathrin, dynamin, endocytosis, hearing, inner hair cell, pHluorin
Introduction
Sound encoding by inner hair cell (IHC) ribbon synapses is a fundamental step in hearing. Each of the active zones (AZs) of an IHC is thought to drive firing in a spiral ganglion neuron at rates of hundreds of Hertz during continued strong acoustic stimulation (for review, see Glowatzki et al., 2008; Meyer and Moser, 2010; Pangršič et al., 2012). This indefatigable signaling is accomplished through fast otoferlin-dependent replenishment of the readily releasable pool (RRP) (Pangršič et al., 2010; Levic et al., 2011), “non-inactivating” synaptic Ca2+ influx (Moser and Beutner, 2000; Schnee and Ricci, 2003; Yang et al., 2006; Cui et al., 2007), and efficient postsynaptic spike generation (Siegel, 1992; Rutherford et al., 2012). Fusion of vesicles at high rates is balanced by endocytosis, likely starting with lateral clearance of vesicular proteins and lipids from the AZ (for review, see Neher and Sakaba, 2008), which may involve an otoferlin-adaptor protein 2 interaction in IHCs (Duncker et al., 2013), followed by their endocytic retrieval from the plasma membrane (Parsons et al., 1994; Moser and Beutner, 2000; Beutner et al., 2001; Lenzi et al., 2002) and subsequent synaptic vesicle recycling (Siegel and Brownell, 1986; Griesinger et al., 2005). Two kinetically distinct types of endocytic retrieval—rapid (300 ms time constant) and slow (10–20 s time constant)—have been described for IHCs (Moser and Beutner, 2000; Beutner et al., 2001). Slow endocytosis has also been described in frog auditory hair cells, in which the time constant of retrieval seemed to scale with the amount of exocytosed vesicles (Cho et al., 2011). Rapid endocytosis in IHCs was elicited by Ca2+ uncaging, when cytosolic [Ca2+] reached at least 15 μm, and increasingly contributed to retrieval when [Ca2+] was further elevated. Which modes of endocytosis—“kiss-and-run” endocytosis, clathrin-mediated endocytosis (CME), or bulk endocytosis (for review, see Wu, 2004, 2007; Smith et al., 2008; Clayton and Cousin, 2009; Dittman and Ryan, 2009; Royle and Lagnado, 2010; Ferguson and De Camilli, 2012)—underlie these two types of membrane retrieval in IHCs remained unclear.
Little is known about the molecular regulation of hair cell endocytosis (Trapani et al., 2009; Boumil et al., 2010). In fitful mice, carrying a dynamin 1 missense mutation that interferes with dynamin 1 dimerization and function (Boumil et al., 2010), a subtle hearing impairment was found. It remained unclear whether this can be attributed to defective IHC endocytosis and whether dynamins 2 or 3 could partially compensate for the loss of dynamin 1 function. Moreover, although clathrin-coated pits and clathrin-coated vesicles can be found at the synaptic pole of IHCs (Siegel and Brownell, 1986; Sendin et al., 2007; Frank et al., 2010), the importance of CME for IHC endocytosis has not been tested yet. Finally, the spatial organization of endocytosis remained to be investigated. Here, we studied the molecular physiology of IHC endocytosis using electron microscopy, immunohistochemistry, vglut1–pHluorin imaging, patch-clamp membrane capacitance (Cm) recordings, Ca2+ uncaging, dynamin 1 mouse mutants, and pharmacological interference with dynamin and clathrin function.
Materials and Methods
Animals.
Littermate Dyn1ftfl/ftfl, Dyn1ftfl/+, and Dyn1+/+ mice (Boumil et al., 2010) were compared for a genetic approach to dynamin function. C57BL/6/J mice were used for experiments using pharmacological intervention with endocytic processes and flash photolysis of caged Ca2+. CD1 mice were used for vglut1–pHluorin imaging. Otof−/− and Otof+/+ mice (Roux et al., 2006; Reisinger et al., 2011) were used for flash photolysis of caged Ca2+. All mice were of either sex and examined at the age of 2–3 weeks. All experiments complied with national animal care guidelines and were approved by the University of Göttingen board for animal welfare and the animal welfare office of the state of Lower Saxony.
Immunohistochemistry and confocal microscopy of immunolabeled IHCs.
Freshly dissected apical cochlear turns were fixed with 4% formaldehyde in PBS for 1 h on ice. Thereafter, the tissue was washed three times for 10 min in PBS and incubated for 1 h in goat serum dilution buffer (GSDB: 16% normal goat serum, 450 mm NaCl, 0.3% Triton X-100, and 20 mm phosphate buffer, pH 7.4) in a wet chamber at room temperature. Primary antibodies were dissolved in GSDB and applied overnight at +4°C in a wet chamber. After washing three times for 10 min (wash buffer: 450 mm NaCl, 20 mm phosphate buffer, and 0.3% Triton X-100), the tissue was incubated with secondary antibodies in GSDB in a light-protected wet chamber for 1 h at room temperature. Then the preparations were washed three times for 10 min in wash buffer and once for 10 min in 5 mm phosphate buffer, placed onto glass microscope slides with a drop of fluorescence mounting medium (Mowiol or 2,2-thiodiethanol), and covered with thin glass coverslips. The following antibodies were used: mouse IgG1 anti-CtBP2 (also recognizing the ribbon protein ribeye; 1:200; BD Biosciences), mouse anti-otoferlin (1:500; Abcam), mouse anti-clathrin light chain (1:1000; specific for the neuronal splice variants; Synaptic Systems), mouse anti-dynamin 1/2/3 (1:200; BD Biosciences), rabbit anti-clathrin heavy chain (1:400; Biozol), rabbit anti-dynamin 1 (1:200; Synaptic Systems), rabbit anti-dynamin 3 (1:1000; Synaptic Systems), rabbit anti-calbindin D-28k (1:1000; Swant), rabbit anti-amphiphysin (1:400; Synaptic Systems), rabbit anti-vglut3 (1:500; Synaptic Systems), guinea pig anti-vglut1 (1:1000; Synaptic Systems), and secondary Alexa Fluor 488-, Alexa Fluor 568-, and Alexa Fluor 633-labeled goat anti-mouse, anti-guinea pig, and anti-rabbit antibodies (1:200; Invitrogen). Confocal images were acquired using a laser scanning confocal microscope (Leica TCS SP2 or SP5; Leica Microsystems) with 488 nm (argon), 561 nm (helium–neon), and 633 nm (helium–neon) lasers for excitation and a 63× oil-immersion objective [1.4 numerical aperture (NA); Leica]. Images were processed using NIH ImageJ and assembled for display in Adobe Illustrator software.
Electron microscopy.
Apical turns of the organ of Corti were prepared and either stimulated for 2 min at 36°C with a solution (in mm: 40 KCl, 108 NaCl, 1 MgCl2, 1.3 CaCl2, and 10 HEPES) and subsequently fixed for 1 h on ice with 4% PFA and 0.5% glutaraldehyde in 1× PBS, pH 7.2, or immediately fixed for 1 h on ice with the same fixative. Subsequently, samples were fixed overnight on ice with secondary fixative comprising 2% glutaraldehyde in 0.1 m sodium cacodylate buffer, pH 7.2. The samples were washed in sodium cacodylate buffer and postfixed on ice for 1 h with 1% osmium tetroxide (v/v) in 0.1 m sodium cacodylate buffer, followed by a 1 h washing step in sodium cacodylate buffer and three brief washing steps in distilled water. The samples were stained en bloc with 1% (v/v) uranyl acetate in distilled water for 1 h on ice. After a brief wash with distilled water, samples were dehydrated at room temperature in increasing ethanol concentrations, infiltrated in Epon resin [100% EtOH/Epon 1:1 (v/v), 30 and 90 min; 100% Epon, overnight], and embedded for 48 h at 70°C. After conventional embedding, 65–75 nm sections were obtained approaching from the anterior edge using an Ultracut E (Reichert-Jung). Sections were postfixed and stained with uranyl acetate/lead citrate following standard protocols. Micrographs were taken with a JEOL electron microscope (JEM 1011) equipped with a Gatan Orius 1200A camera using the Digital Micrograph software package at an 8000-fold magnification. The diameter of clathrin-coated and synaptic vesicles was measured between the inner membrane boundaries. The diameter (d) of clathrin-coated pits was determined by measuring the circumference (C) of the inner leaflet of the membrane and calculated using d = C/π.
Expression of vglut1–pHluorin in IHCs.
Complementary DNA of pHluorin-coupled VGLUT1 (kindly provided by Robert Edwards, University of California, San Francisco, San Francisco, CA) was subcloned into adeno-associated virus (AAV)–human beta actin promoter–eGFP-woodchuck posttranscriptional regulatory element-bovine growth hormone vector using an EcoRI and a HindIII restriction site introduced through PCR. Virus was produced as described previously (Kügler et al., 2007), using capsid proteins of serotype 1 and 2 (AAV1/2). IHCs were transduced by transuterine injection of otocysts in pregnant CD1 dams at postcoital day 11.5 (Bedrosian et al., 2006; Brigande et al., 2009; Reisinger et al., 2011).
Patch-clamp, flash photolysis of caged Ca2+, and confocal pHluorin imaging of IHCs.
IHCs from apical coils of freshly dissected organs of Corti were patch clamped at room temperature (22–24°C) as described previously (Moser and Beutner, 2000). For recordings of Ca2+ current and exocytosis, the pipette solution contained the following: 130 mm Cs-gluconate, 10 mm tetraethylammonium (TEA)-Cl, 10 mm 4-AP, 10 mm HEPES, 1 mm MgCl2, and 300 μg/ml amphotericin B (for perforated-patch recordings), pH 7.2. For ruptured patch recordings, 2 mm Mg-ATP and 0.3 mm Na-GTP (in all experiments but a subset displayed in Fig. 6) were added to the solution, as well as 30 μm of either Dyngo-4a (for pharmacological intervention with dynamin-mediated endocytosis; Howes et al., 2010; purchased from Tocris Bioscience) or Dyngo-8a (as a negative control; Daniel et al., 2012; kindly provided by Dr. Phillip Robinson, Children's Medical Research Institute, Westmead, Australia) or Pitstop 2 (for pharmacological intervention with CME). For experiments using GTPγS, the GTP in the intracellular solution was replaced by 0.3 mm GTPγS (Tocris Biosciences or Sigma-Aldrich). The extracellular solution contained the following (in mm): 99 NaCl, 35 TEA-Cl, 2.8 KCl, 2 or 5 CaCl2, 1 MgCl2, 5 4-AP, 1 CsCl, 10 HEPES, and 11.3 d-glucose, pH 7.2. For pHluorin imaging, the intracellular solution contained the following (in mm): 131.5 Cs-glutamate, 13 TEA-Cl, 20 CsOH-HEPES, 1 MgCl2, 2 MgATP, 0.3 NaGTP, 0.5 EGTA, and 0.04 dimeric carboxytetramethylrhodamine-conjugated ribeye-binding peptide (Francis et al., 2011). The extracellular solution contained the following (in mm): 104 NaCl, 35 TEA-Cl, 2.8 KCl, 5 CaCl2, 1 MgCl2, 10 NaOH–HEPES, and 11.3 d-glucose, pH 7.3. Flash photolysis of caged Ca2+ was performed as described previously (Beutner et al., 2001; Roux et al., 2006; Pangršič et al., 2010), and some of the responses were taken from previous work (Roux et al., 2006; Pangršič et al., 2010), in which endocytosis was not quantified. EPC-9 amplifiers (HEKA) controlled by Pulse or Patchmaster software (HEKA) were used for measurements. All voltages were corrected for liquid junction potentials. Currents were leak corrected using a p/10 protocol.
Figure 6.

Hydrolysis of GTP is required for normal exocytosis and endocytosis in IHCs. IHCs in acute explants of P14–P17 organs of Corti were patch clamped in ruptured patch configuration, with either 0.3 mm GTP (black), 0 mm GTP (dark gray), or 0.3 mm GTPγS (light gray) in the patch pipette. A, GTPγS-infused cells exhibit rapid increases in Cm, as opposed to the decrease found in GTP-infused cells. Bold lines represent the grand average, with the numbers at each point indicating the number of cells used in the average. Cm was monitored by repetitive 2-s-long recordings, of which the average is displayed. Most (9 of 13) cells treated with GTPγS showed a continuous Cm increase in membrane surface, whereas two showed a rapid Cm increase, followed by a Cm decline and another two showed a continuous Cm decline over the entire experiment. All control cells showed a continuous decline over the entire experiment. Some (3 of 10) cells infused with a GTP-free intracellular solution showed a slight increase of Cm, one showed constant Cm, and the rest showed a continuous decline over the entire experiment. B, Average ΔCm responses of the IHCs to 200 ms depolarizations to −14 mV in the presence of 0.3 mm GTPγS (light gray), 0 mm GTP (dark gray), or 0.3 mm GTP (black). Infusion of GTPγS blocks endocytosis and also reduces the amount of exocytosis, whereas lack of GTP leads to reduced exocytosis and a trend toward slower endocytosis (time constant of 8.3 ± 2.2 s without GTP vs 4.6 ± 1.1 with GTP, p = 0.16, one GTP-free recording did not show an exponential component of retrieval).
For Cm measurements, IHCs were stimulated by depolarizations of different durations to −14 mV at intervals of 60–120 s. We measured Cm changes (ΔCm) using the Lindau–Neher technique (Lindau and Neher, 1988) as described previously (Moser and Beutner, 2000). The exocytic ΔCm was quantified as the difference of the averaged Cm 400 ms before and after (skipping the first 100 ms) the depolarization. Mean ΔCm and Ca2+ charge estimates present grand averages calculated from the mean estimates of individual IHCs. This avoided dominance of IHCs contributing more sweeps. The endocytic decrease of Cm after a depolarization-induced exocytic ΔCm was measured over 20 s after a 2-s-long recording of Cm baseline and 20, 200, or 1000 ms of depolarization. Analysis of the linear component of endocytosis after brief depolarizations (20 ms) was performed by fitting a linear function to the postdepolarization Cm data, skipping the first 200 ms, and noting the point at which the line fit returned to baseline Cm. Recordings that did not return to baseline within 80 s were excluded from this analysis. We analyzed the exponential component of Cm decline after extended depolarization by fitting a linear function to the final 5 s of Cm data and subtracting the extrapolated fit. The residual was then fitted with an exponential function using a genetic curve-fitting algorithm (Sanchez del Rio and Pareschi, 2001). In a few cases, the fitting window for the linear component was slightly adjusted to exclude Cm artifacts. Recordings that could not be reliably fitted or that contained strong artifacts were discarded. All cells showed a pronounced, depolarization-independent decrease of Cm during the recording, which was corrected for by fitting and subtracting an exponential function to the baseline Cm as recorded during the entire experiment (see Fig. 5). Occasional increases of baseline Cm late in the recordings were not included into the fit, because we interpret them as pathological changes reflecting lack of compensation of excessive exocytosis after 1000 ms depolarization or compromised cell condition.
Figure 5.
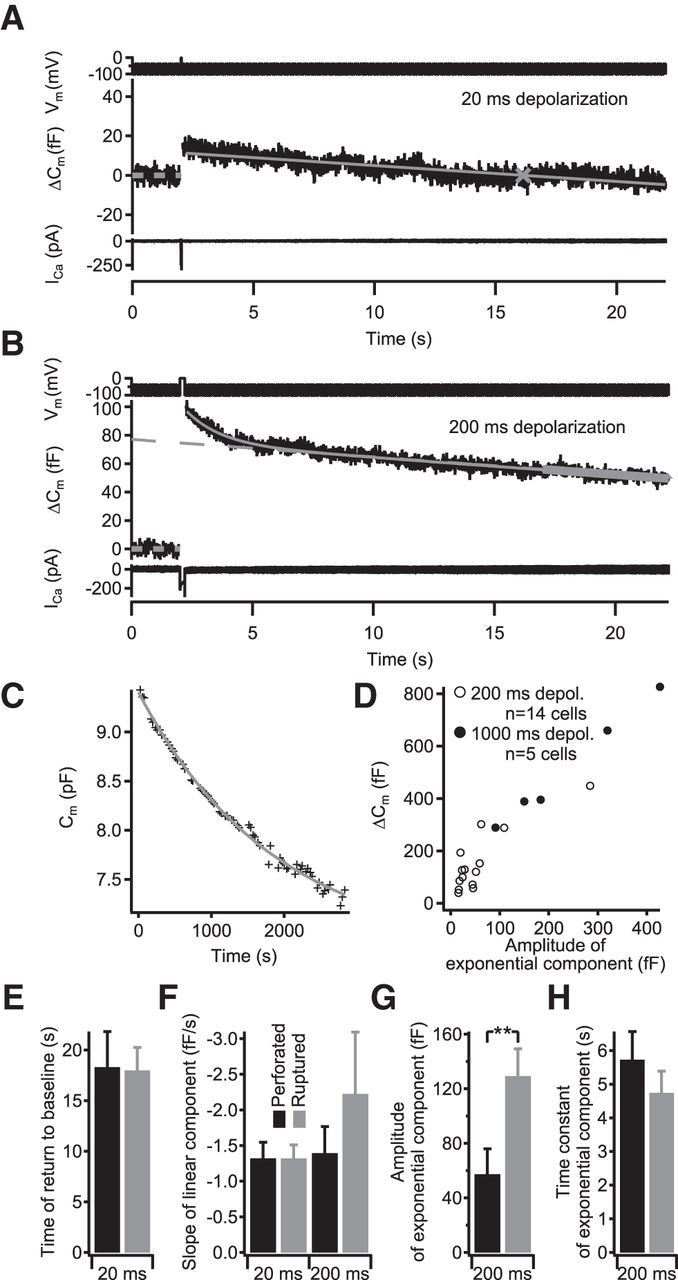
Endocytic Cm decline in control IHCs. A, B, Representative recordings in response to 20 (A) or 200 (B) ms depolarizations. The command voltage consisted of a 2-s-long predepolarization sine wave part, the depolarizing pulse, and a 20-s-long postdepolarization sine wave part (top). After the depolarization-induced Cm increase, the slope-corrected Cm traces (middle) typically showed a linear decay after 20-ms-long depolarizations (A), which was analyzed by subtracting the baseline Cm (dashed bold gray line) from 0–2 s and fitting a linear function to the Cm data (gray line), thus obtaining the time of return to baseline Cm (gray mark). The 200-ms-long depolarizations typically resulted in a combination of exponential and linear decay (B). This was analyzed by fitting a linear function to the final 5 s of Cm data (bold gray line), which was extrapolated (dashed gray line) and subtracted from the Cm data. The residual was fitted with an exponential function (gray line shows combined linear and exponential). C, Representative example of Cm slope correction in an IHC. The correction for baseline Cm drift was performed by monitoring the baseline Cm during the experiment (black symbols) and fitting an exponential function (gray line), which was then subtracted from the individual recordings. D, Recordings after longer depolarizations showed an exponential component whose amplitude increased with the total amount of previously exocytosed membrane. Open circles are cell averages from 200 ms depolarizations, and filled circles are cell averages from 1000 ms depolarizations. E–H, Comparison of time of return to baseline (E), slope of the linear component of membrane retrieval after short (left) and prolonged (right) exocytosis (F), and the amplitudes (G) and time constants (H) of the exponential component of membrane retrieval in from IHCs recorded in perforated-patch (black) or ruptured-patch configuration (gray). The perforated-patch data (n = 17 and n = 14 cells for short and prolonged depolarization, respectively) are taken from the Dyn+/+ cells shown in Figure 9, and the ruptured-patch data (n = 18 and n = 16 cells for short and prolonged depolarization, respectively) are pooled from the control cells shown in Figures 7 and 10.
For vglut1–pHluorin imaging, an Olympus Fluoview 300 confocal scanner mounted to a BX50WI microscope (0.9 NA, 60× water-immersion objective; Olympus), a 50 mW, 488 nm solid-state laser (Cyan; Newport-Spectraphysics), and a 1.5 mW, 543 nm helium–neon laser were used. Calibration of intravesicular pH was performed with extracellular solutions containing 20 μm carbonyl cyanide 4-(trifluoromethoxy)phenylhydrazone (FCCP). For non-neutral solutions, the pH buffer HEPES was replaced with equimolar amounts of MES (pH 5.5 and 6.5) or tricine (pH 8.0 and 9.0). Changes in vglut1–pHluorin fluorescence during patch-clamp recordings were monitored with 56 × 56 pixel (pixel size, 131 nm) images acquired at 10 Hz (first 4 s) and 2 Hz (after 4 s). Cells were stimulated by a 100 ms depolarization to −17 mV, after 1.5 s of baseline period. Fluorescence traces were extracted from 7 × 7 pixel regions of interest (ROIs) and corrected for bleaching. The bleaching rate was estimated by fitting the average fluorescence in the cytosolic region using a double-exponential function with a linear component. This function, scaled to the baseline fluorescence of each ROI, was subtracted from individual fluorescence traces to yield the ΔF trace. Analysis of electrophysiology and imaging data was performed in Igor Pro 6 software (Wavemetrics) and NIH ImageJ. Means were expressed ±SEM and compared using Student's unpaired t tests or Wilcoxon's rank tests as appropriate, with *p < 0.05, **p < 0.01, and ***p < 0.001. Average capacitance traces were filtered with a 50 Hz low-pass filter for better display of data.
Results
Structural correlates of endocytosis and expression of endocytic proteins in IHCs
Using electron microscopy, we observed clathrin-coated pits at the plasma membrane and clathrin-coated vesicles in the close vicinity of the IHC AZs (Fig. 1A–C). In addition, we found membrane infoldings and large cisternae most likely reflecting bulk endocytosis (Fig. 1A–D), which appeared more abundant in cells that had been stimulated with a high K+ solution before fixation (Fig. 1C,D). Some of these membranous structures also showed coated parts likely indicating the clathrin-mediated budding of vesicles from the previously endocytosed cisternae. Indeed, such coats also covered aspects of membrane infoldings that still remained connected to the surface (Fig. 1B,C). Interestingly, clathrin-coated vesicles were significantly larger (average diameter, 54.2 ± 1.0 nm) than synaptic vesicles (average diameter, 30.6 ± 0.4 nm; p < 0.001), which is evident from comparing the inner diameter of both structures (Fig. 1E). The same applies to clathrin-coated pits at the plasma membrane that exhibited an average diameter of 65.1 ± 6.6 nm.
Figure 1.

Clathrin-coated organelles and endocytic cisternae in IHCs. A–D, Representative electron micrographs of unstimulated (A, B) or high-K+-stimulated (C, D) IHC synapses illustrating the abundance of coated vesicles and cisternal membrane organelles as indications for CME and bulk endocytosis. White arrowheads point to coated pits forming at the plasma membrane (B, C); black arrows show examples of clathrin coats found on small vesicles or on cisternae in the perisynaptic cytoplasm (A–D). The black/white arrowhead indicates a large cistern that was still connected to the plasma membrane. D shows clathrin-coated pits emerging from a large cistern in the cytosol. Scale bars, 200 nm. E, Histogram of the inner diameters of synaptic vesicles (dark gray) and clathrin-coated vesicles (light gray) found in the proximity of synaptic ribbons.
We then used immunohistochemistry and confocal microscopy to demonstrate the expression and subcellular distribution of dynamin(s) (Fig. 2A–C), amphiphysin (Fig. 2D), the neuronal splice variant of clathrin light chain (Fig. 2E), and clathrin heavy chain (Fig. 2F) in IHCs. IHCs were successfully labeled by antibodies thought to selectively recognize dynamin 1 or dynamin 3 as well as by a pan-dynamin antibody, indicating expression of dynamins 1 and 3. Knock-out-controlled studies of dynamin expression in IHCs of hearing mice will have to await hair cell-specific deletion of dynamins. IHCs showed a broad distribution of dynamin 1 and 3, clathrin heavy chain, and weak amphiphysin immunofluorescence (Fig. 2A,C,D,F). Different from what was reported recently for retinal photoreceptors (Wahl et al., 2013), no obvious enrichment of these proteins around the ribbon-type AZ was found. Efferent (and potentially also afferent) neurons showed immunofluorescence for dynamins 1 and 3, clathrin light chain, and prominently for amphiphysin.
Figure 2.

Immunolocalization of endocytic proteins and clathrin-coated organelles in IHCs. A–F, Maximum projections of confocal stacks from whole-mount explants of apical organs of Corti of P14–P16 mice, immunolabeled for endocytic proteins. A, Dynamin 1 (green) and ctbp2/ribeye (magenta, labeling the ribbon synapses); B, dynamin 1/2/3 (green) and otoferlin (magenta); C, dynamin 3 (green) and otoferlin (magenta); D, amphiphysin (green) and ctbp2/ribeye (magenta); E, clathrin light chain (green) and calbindin (magenta); and F, clathrin heavy chain (green) and ctbp2/ribeye (magenta). IHCs show strong staining for dynamin and clathrin heavy chain and weak staining for amphiphysin throughout the cytosol. Scale bars, 10 μm.
Characterizing the use of vglut1–pHluorin for studying exocytosis and endocytosis at single IHC synapses
We used transuterine injections of AAV into the embryonic otocyst (Bedrosian et al., 2006; Brigande et al., 2009; Reisinger et al., 2011) to express vglut1–pHluorin in IHCs. Vglut1–pHluorin was distributed throughout the IHC and overlapped with vglut3 immunofluorescence in transfected IHCs (Fig. 3A,B). IHCs showed substantial vglut1–pHluorin fluorescence already at rest, which on average increased twofold on collapsing the vesicular pH gradient by application of 40 mm extracellular NH4Cl, pH 7.4. This modest fluorescence gain during dequenching indicates that the intravesicular pH of vglut1–pHluorin-positive IHCs is less acidic compared with that of conventional presynaptic terminals in culture (pH ∼5.5; Miesenböck et al., 1998), in which an ∼10-fold increase in fluorescence can be observed (Miesenböck et al., 1998). To address this question further, we studied the vglut1–pHluorin fluorescence as a function of pH using the protonophore FCCP (20 μm; Fig. 3C,D). We found changes in the range of 7- to 20-fold between pH 5.5 and pH 9 (Fig. 3C,D), demonstrating intact vglut1–pHluorin expression and function, as well as appropriate measurement conditions. Moreover, these experiments indicate that the intraluminal pH of vglut1–pHluorin-positive organelles in a resting IHC is ∼6.5. Given the concurrent presence of synaptic vesicle-like organelles and other intracellular membranous structures such as endocytic cisternae in the base of the IHC and the likely presence of vglut1–pHluorin in these compartments, organelles other than synaptic vesicles may contribute to the high background signal in IHCs.
Figure 3.

Expression and basic characterization of vglut1–pHluorin in IHCs. A, Subcellular localization of vglut1–pHluorin highly resembles that of the endogenous vesicular glutamate transporter vglut3. Single confocal section of immunolabeled IHCs showing expression pattern of vglut1–pHluorin (labeled with anti-vglut1 antibody, green) and vglut3 (magenta). Arrowheads indicate coexpression of vglut1 and vglut3 in IHCs; arrows indicate vglut1-positive postsynaptic boutons. Scale bar, 10 μm. B, Correlation plot of vglut1 and vglut3 immunofluorescence shows three populations: vglut1–pHluorin-transfected IHCs (arrowhead), vglut1-positive postsynaptic boutons (arrow), and nontransfected IHCs. C, Calibration of intravesicular pH using the ionophore FCCP. Confocal sections showing the fluorescence of vglut1–pHluorin-expressing IHCs in normal Ringer's solution (baseline) and when equilibrated to different pH with FCCP. Scale bar, 20 μm. D, Quantification of fluorescence in C, showing that resting fluorescence intensity corresponds to a pH of ∼6.5. The fluorescence of individual IHCs (red dots) at different pH was measured by defining an ROI encompassing the cytosolic region (excluding the nuclei) and normalized to the maximum intensity for each cell. These values are then averaged across all cells (black symbols).
Next, we combined confocal vglut1–pHluorin imaging with IHC patch clamp and marked the AZ by a ribeye-binding fluorescent peptide (Francis et al., 2011). Ca2+ influx elicited by 100-ms-long step depolarizations to −17 mV caused the appearance of significant vglut1–pHluorin fluorescence hotspots at the AZs (Fig. 4A–C; p < 0.01 for comparison with baseline), which was paralleled by exocytic increase of Cm (data not shown). ROIs centered on the plasma membrane away from the ribbons showed very little or no increase in fluorescence (Fig. 4A–C). The decline of synaptic vglut1–pHluorin fluorescence after exocytosis, reflecting the combination of membrane retrieval and re-acidification, appeared to proceed with a fast and a slow component, similar to that observed for the endocytic Cm decay (Fig. 5B). The fluorescence decline was significant already 10 s after the end of the stimulus (p < 0.01), but additional quantification of kinetics was hampered by the relatively low signal-to-noise ratio. In conclusion, pHluorin imaging is feasible in IHCs, albeit with lower signal-to-noise ratio than described for cultured neurons, and indicated preferential occurrence of exocytosis and endocytosis at AZs in IHCs.
Figure 4.

Depolarization-evoked prolonged increase in vglut1–pHluorin fluorescence at IHC AZs. A, Representative example of the change in fluorescence intensity of vglut1–pHluorin (ΔFpHluorin) in an IHC during a 100 ms depolarization to −17 mV, showing hotspots of exocytosis. The localized increase in fluorescence remained for an extended period of time after the end of depolarization (indicated below each image). Each image is the difference between an average image of 12 consecutive frames subtracted by the baseline fluorescence before depolarization (as indicated in C). Scale bar, 2 μm. B, The locations of AZs, marked by a fluorescent ribeye-binding peptide, coincided with the hotspots of exocytosis. Scale bar, 2 μm. C, Average change in vglut1–pHluorin fluorescence of synaptic (red) and nonsynaptic (black) ROIs (examples marked in A and B in red and yellow, respectively) over time, corrected for photobleaching using the cytosolic region (cyan area in A and B). Gray and black horizontal bars indicate the periods when baseline and raw images for A were acquired, respectively. Light red and gray traces represent vglut1–pHluorin fluorescence of individual ROIs.
Cm measurements reveal two kinetic components of membrane retrieval after Ca2+ influx-triggered exocytosis
We used perforated-patch recordings of IHC Cm to assess exocytosis and the time course of endocytic membrane retrieval after strong depolarization (to −14 mV) for different durations. We found that brief depolarizations (20 ms, primarily recruiting the RRP; Moser and Beutner, 2000) mostly resulted in a slow, linear Cm decline (Fig. 5A; also see Figs. 7, 9, 10), whereas longer depolarizations (200 and 1000 ms) additionally evoked an exponentially decaying Cm component (Fig. 5B; also see Figs. 6, 7, 9, 10), which became apparent when the amount of exocytosed membrane surpassed ∼30–40 fF, approximately three to four times the size of the RRP, and whose amplitude increased with the amount of preceding exocytosis (Fig. 5D). The time constant of the exponential Cm decline in perforated patch configuration averaged to 5.7 ± 0.8 s (n = 14 IHCs) and seemed primarily independent of the amount of exocytosis (Pearson's correlation coefficient of −0.09; and data not shown). The linear component of endocytosis was observed with similar rates also after long depolarizations, in which it was quantified by fitting a linear function to the final 5 s of the Cm data (Fig. 5B, thick gray line), indicating that this mode of endocytosis is limited in speed. Throughout these long recordings, we observed a slow Cm decline (Figs. 5C, 6A) that was also observed in the absence of stimulation and in otoferlin-deficient IHCs (data not shown), which almost completely lack depolarization-induced exocytosis (Roux et al., 2006). Possible mechanisms underlying this phenomenon include (1) an imbalance of basal exocytosis and endocytosis under these recording conditions and (2) a slow creeping up of membrane into the patch pipette attributable to capillary force. We attempted to correct for this trend in our endocytosis analysis as detailed in Materials and Methods. Recordings in the ruptured-patch configuration with 0.3 mm GTP in the pipette solution showed a robust endocytic Cm decline with properties that were mostly comparable with data acquired with perforated patch. Specifically, the time of return to baseline was unchanged for short depolarizations (Fig. 5E; 18.0 ± 2.3 vs 18.3 ± 3.5 s in ruptured patch vs perforated patch, respectively), indicating an unaltered linear component of membrane retrieval. Likewise, the kinetics of the exponential component were comparable (Fig. 5G; time constant: 4.7 ± 0.8 vs 5.7 ± 0.8 s), whereas its amplitude was significantly increased (Fig. 5H; 129 ± 20 vs 57 ± 18 fF, p < 0.01), suggesting a larger contribution of this component to overall retrieval.
Figure 7.
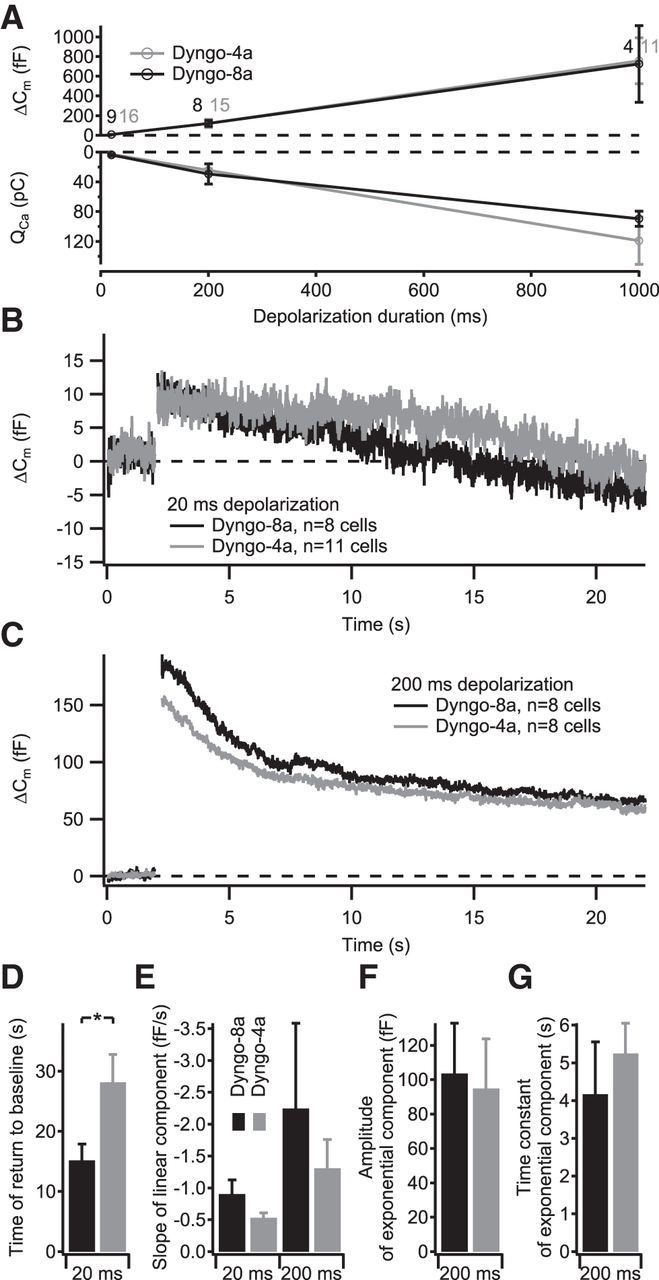
The dynamin inhibitor Dyngo-4a impairs the linear mode of membrane retrieval. IHCs in acute explants of P14–P17 organs of Corti were patch clamped in ruptured-patch configuration. A, Grand average of depolarization-evoked exocytic ΔCm (top) and integrated Ca2+ influx (bottom) of IHCs treated with 30 μm of the dynamin inhibitor Dyngo-4a (gray) or its inactive variant Dyngo-8a (black), applied via the patch pipette. The numbers at each point indicate the number of cells used for the average. B, C, Grand average of ΔCm measurements using 20 ms (B) or 200 ms (C) depolarizing stimuli from IHCs treated with Dyngo-4a (gray) or Dyngo-8a (black). D, Average time of Cm return to baseline obtained from fitting a linear function to the first 20 s of Cm data after the end of the 20 ms depolarizing pulses summarized in B. E, Average slope of the linear component of exocytosis for 20 ms depolarizing pulses (left, obtained by fitting a linear function to the first 20 s of postdepolarization Cm data) and 200 ms depolarizing pulses (right, obtained by fitting a linear function to the final 5 s of Cm data). F, G, Average amplitudes (F) and time constants (G) of exponential functions fitted to the data summarized in C after subtracting the linear decrease in Cm during the final 5 s of the recording.
Figure 9.
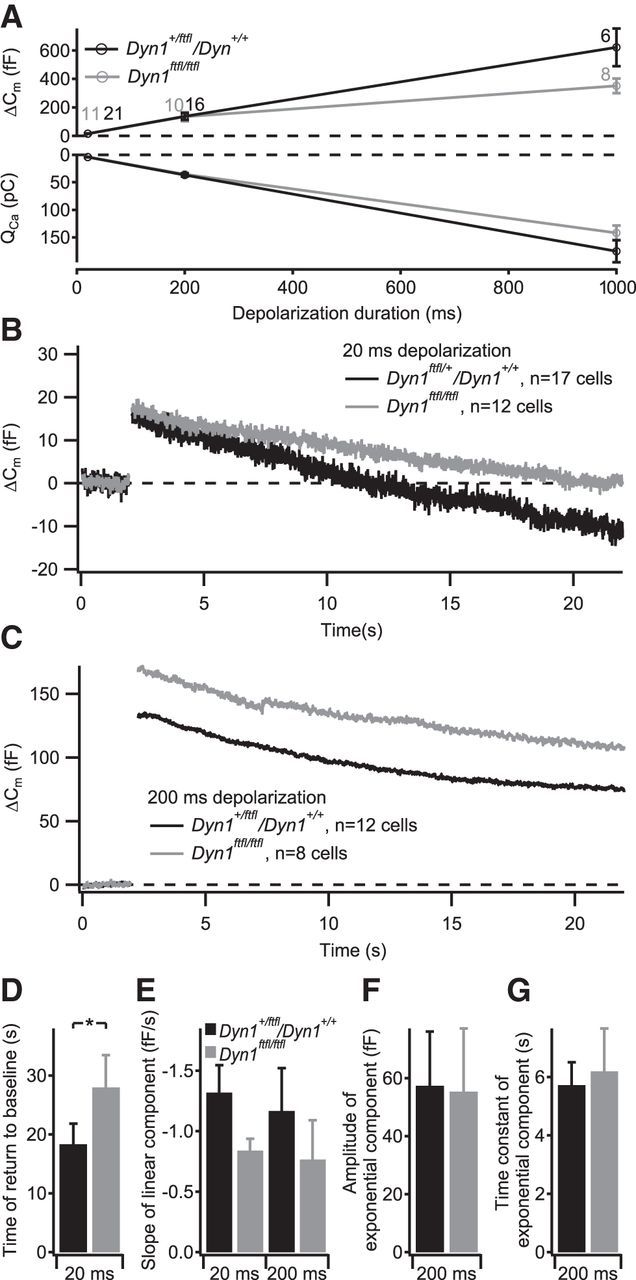
The fitful mutation of dynamin 1 impairs the linear component of membrane retrieval. IHCs in acute explants of P14–P17 organs of Corti were patch clamped in perforated-patch configuration. A, Grand average of depolarization-evoked exocytic ΔCm (top) and integrated Ca2+ influx (bottom) of IHCs from Dyn1ftfl/ftfl (gray) or littermate Dyn1ftfl/+ or Dyn1+/+ mice (black). The numbers at each point indicate the number of cells used for the average. B, C, Grand average of ΔCm measurements using 20 ms (B) or 200 ms (C) depolarizing stimuli. D, Average time of Cm return to baseline obtained from fitting a linear function to the first 20 s of Cm data after the end of the 20 ms depolarizing pulses summarized in B. E, Average slope of the linear component of exocytosis for 20 ms depolarizing pulses (left, obtained by fitting a linear function to the first 20 s of postdepolarization Cm data) and 200 ms depolarizing pulses (right, obtained by fitting a linear function to the final 5 s of Cm data). F, G, Average amplitudes (F) and time constants (G) of exponential functions fitted to the data summarized in C after subtracting the linear decrease in Cm during the final 5 s of the recording.
Figure 10.
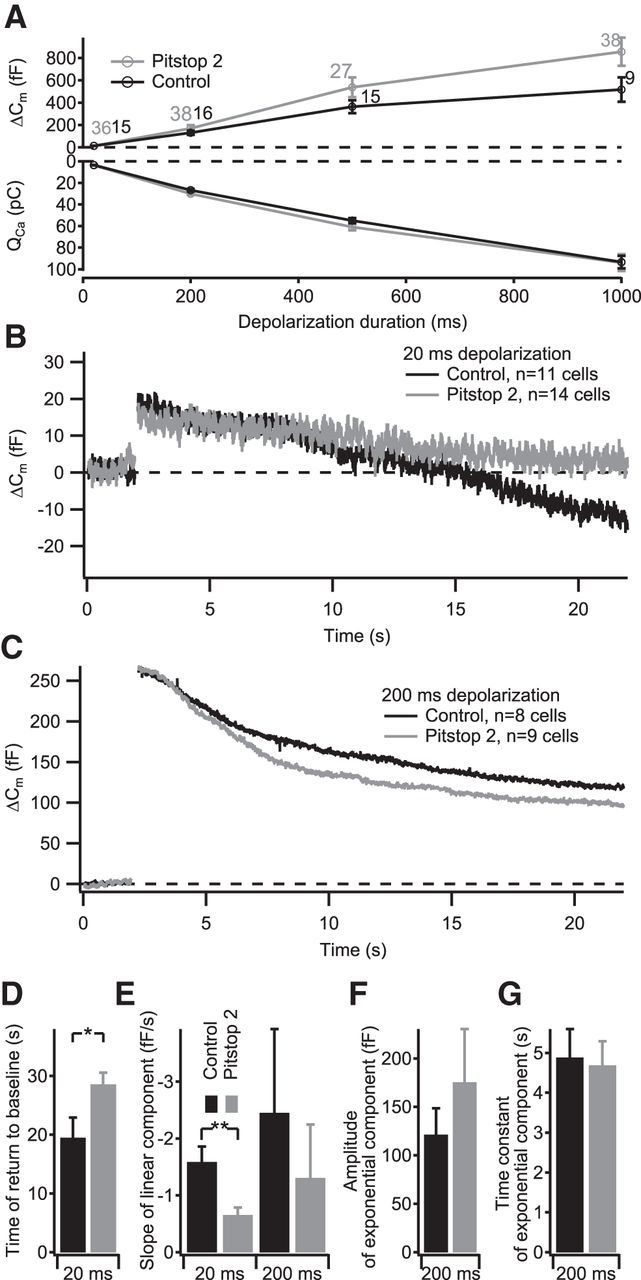
The clathrin inhibitor pitstop 2 blocks the linear component of membrane retrieval. IHCs in acute explants of P14–P17 organs of Corti were patch clamped in perforated-patch configuration. A, Grand average of depolarization-evoked exocytic ΔCm (top) and integrated Ca2+ influx (bottom) of IHCs treated with 30 μm pitstop 2 (gray) or control cells (black). The numbers at each point indicate the number of cells used for the average. B, C, Grand average of ΔCm measurements using 20 ms (B) or 200 ms (C) depolarizing stimuli. D, Average time of Cm return to baseline obtained from fitting a linear function to the first 20 s of Cm data after the end of the 20 ms depolarizing pulses summarized in B. E, Average slope of the linear component of exocytosis for 20 ms depolarizing pulses (left, obtained by fitting a linear function to the first 20 s of postdepolarization Cm data) and 200 ms depolarizing pulses (right, obtained by fitting a linear function to the final 5 s of Cm data). F, G, Average amplitudes (F) and time constants (G) of exponential functions fitted to the data summarized in C after subtracting the linear decrease in Cm during the final 5 s of the recording.
Hydrolysis of GTP is required for normal exocytosis and endocytosis in IHCs
To determine whether global inhibition of GTP hydrolysis would block endocytic membrane retrieval as shown previously in several secretory preparations, including retinal bipolar cells (Jockusch et al., 2005) and calyx of Held (Yamashita et al., 2005), we performed ruptured-patch experiments either removing GTP from the intracellular solution or replacing it with the nonhydrolysable GTP analog GTPγS (0.3 mm). We found that, in most cells, Cm increased rapidly right after infusion of GTPγS, which strongly contrasts with the typical Cm decline observed in ruptured-patch recordings with GTP in the patch pipette (Fig. 6A) and perforated-patch experiments (see above; Fig. 5C). Only 3 of 10 IHCs infused with GTP-free intracellular solution showed a slight increase in Cm. Although exocytosis triggered by Ca2+ influx is negligible at the negative holding potentials used (−84 mV), it remains unclear whether the observed Cm rise solely reflected constitutive exocytosis not further balanced by endocytosis or also included GTPγS-induced exocytosis (Fernandez et al., 1984; Rupnik and Zorec, 1995). Interestingly, Ca2+ influx-evoked exocytic Cm increments were reduced in amplitude in the absence of GTP and even more so in the presence of GTPγS (Fig. 6B). Because our standard exponential fit for correcting the slow changes of baseline Cm was not applicable, we fitted a linear function to the predepolarization Cm and subtracted it from the Cm trace. The exponential component of membrane retrieval seemed somewhat slower in the absence of GTP (time constant of 8.3 ± 2.2 s, p = 0.16, one recording did not show an exponential component of retrieval) and was primarily blocked in the presence of GTPγS (Fig. 6B). Recordings with GTPγS were generally less stable and often lost a few minutes after gaining access, limiting the depth of analysis.
Pharmacological interference with dynamin inhibits the linear component of membrane retrieval
In an attempt to more specifically unravel the role of dynamin in IHC endocytosis, we treated IHCs with 30 μm of the dynamin inhibitor Dyngo-4a (Howes et al., 2010) or its inactive variant Dyngo-8a (Daniel et al., 2012) applied via the patch pipette in ruptured-patch experiments. We found that neither Ca2+ current amplitude (Fig. 7A) nor exocytosis of the RRP or sustained exocytosis (measured by depolarizations of 20, 200, or 1000 ms duration, respectively; Fig. 7A) were different between both conditions. When examining the time course of endocytic membrane retrieval, we found that the linear Cm decline after RRP exocytosis (evoked by brief depolarizations) was slowed in Dyngo-4a-treated cells (Cm returned to baseline after ∼30 s compared with ∼15 s in Dyngo-8a-treated cells, p < 0.05; Fig. 7B,D). A trend toward slowed kinetics of the linear component of endocytosis of Dyngo-4a-treated cells was also observed in response to 200 ms depolarizations (Fig. 7C,E), but it did not quite reach statistical significance (p = 0.09). No difference was observed between both conditions for the amplitude (Fig. 7F) or the time constant (Fig. 7G) of the exponential component of the endocytic Cm decline after these prolonged depolarizations. In summary, the two kinetic modes of endocytic Cm retrieval appear to differ in their dynamin requirement.
To examine whether dynamin inhibition perhaps via a potential accumulation of vesicular membrane and proteins at the AZ membrane after repeated stimulation results in an impairment of exocytosis, we studied ΔCm in response to trains of 10 × 1 s depolarizations presented at 0.7 Hz but found no reduction in Dyngo-4a-treated cells when compared with Dyngo-8a-treated cells (Fig. 8). Instead, the slightly higher total ΔCm in Dyngo-4a-treated cells, not yet reaching statistical significance, potentially indicated a changed balance between exocytosis and endocytosis attributable to less efficient slow endocytosis in these cells. This suggests that the exponential component of endocytic membrane retrieval, which likely reflects bulk endocytosis and was not altered by Dyngo-4a inhibition of dynamin, provides for sufficient vesicle recycling and/or that there is a large reserve pool of synaptic vesicles that enables RRP replenishment.
Figure 8.

Prolonged exocytosis appears normal in Dyngo-4a-treated cells. IHCs in acute explants of P14–P17 organs of Corti were patch clamped in ruptured-patch configuration and exposed to trains of 10 × 1 s depolarizations to −14 mV at 0.7 Hz. Interpulse interval was 200 ms. No significant difference could be observed between cells treated with Dyngo-4a (gray) and Dyngo-8a (black) in the cumulative exocytic ΔCm.
Genetic disruption of dynamin 1 function inhibits the linear component of membrane retrieval
To verify the results of the pharmacological inhibition and to elucidate which dynamin isoform is involved, we turned toward studying endocytosis in IHCs of dynamin 1 mutant mice. We investigated fitful mouse mutants, carrying a point mutation in dynamin 1 that results in impaired dynamin 1 dimerization and function and causes a slight hearing deficit (Boumil et al., 2010). These mice offer the advantage that data from mature (P14–P17) IHCs can be acquired, in contrast to constitutive dynamin 1 knock-out mice that die before the onset of hearing (Ferguson et al., 2007; data not shown). In the mutant IHCs, we found unchanged Ca2+ currents and exocytosis (Fig. 9A). However, the time required for Cm to return to baseline after 20 ms depolarization was significantly slowed (p < 0.05; Fig. 9B,D). Conversely, endocytosis in response to prolonged depolarization appeared normal in fitful IHCs (Fig. 9C,F,G), although a trend toward slower rates of the linear Cm decline was observed, which did not reach statistical significance (Fig. 9E; p = 0.41). The similar effect of genetic disruption of dynamin 1 function on the linear component of endocytosis when compared with that of the pharmacological dynamin inhibition by Dyngo-4a suggests that Dyngo-4a primarily worked via inhibiting dynamin 1.
Pharmacological interference with clathrin function inhibits the linear component of membrane retrieval
We next used pitstop 2, a clathrin inhibitor (von Kleist et al., 2011), to test the clathrin dependence of IHC endocytosis. Pitstop 2 (30 μm, diluted in 0.1% DMSO) was applied to IHCs by bath perfusion for at least 10 min. Exocytosis and endocytosis were probed by 20-, 200-, and 1000-ms-long depolarizations to −14 mV. Exocytic Cm changes were not significantly altered compared with control cells for any of the stimulus durations (Fig. 10A). However, the Cm return to baseline after 20 ms depolarization (linear component) was slowed in the presence of pitstop 2 (Fig. 10B,D; p < 0.05). Again, a nonsignificant trend toward slower rates of the linear component was observed for the 200 ms depolarizations in pitstop 2-treated cells (Fig. 10E; p = 0.45). Conversely, the exponential component of the endocytic Cm decline in response to 200 ms depolarization was not affected (Fig. 10C,F,G), suggesting that this mode of membrane retrieval does not require clathrin function in IHCs. In summary, the data indicate that clathrin, as dynamin, is required for the linear component of endocytic Cm retrieval, whereas the exponential component seems independent of clathrin and dynamin 1 function.
Genetic disruption of otoferlin does not interfere with rapid endocytosis and its Ca2+ dependence
Otoferlin has been implicated in the regulation of vesicle fusion and replenishment in IHCs (Roux et al., 2006; Johnson and Chapman, 2010; Pangršič et al., 2010, 2012) and has been proposed recently to be involved in coupling exocytosis to endocytosis via its interaction with the endocytic adapter protein AP2 (Duncker et al., 2013). Analyzing endocytosis in IHCs lacking otoferlin is hampered by the strong reduction of Ca2+-triggered exocytosis. However, otoferlin-deficient IHCs display reduced but still sizable exocytosis and endocytosis in response to Ca2+ uncaging (Roux et al., 2006), whereby a quantitative analysis of endocytosis remained to be performed. Here, we analyzed the kinetics and Ca2+ dependence of rapid endocytosis in IHCs lacking otoferlin (Otof−/−; Roux et al., 2006; Pangršič et al., 2010; Reisinger et al., 2011). Figure 11A displays the average Cm responses of Otof+/+ and Otof−/− IHCs, pooling new results with previously published data (Roux et al., 2006; Pangršič et al., 2010). In line with strongly reduced exocytosis in Otof−/−, we found much lower maximal rates of endocytosis (Fig. 11B–D). The kinetics of rapid endocytosis (Fig. 11F) and its contribution to membrane retrieval (Fig. 11B,C,E) were similar between IHCs of the different genotypes. Moreover, as reported for wild-type IHCs (Beutner et al., 2001), the kinetics of rapid endocytosis seemed primarily independent of the [Ca2+] achieved by Ca2+ uncaging (Fig. 11F). In conclusion, these data suggest that the lack of otoferlin does not disrupt the rapid mode of endocytosis in IHCs.
Figure 11.
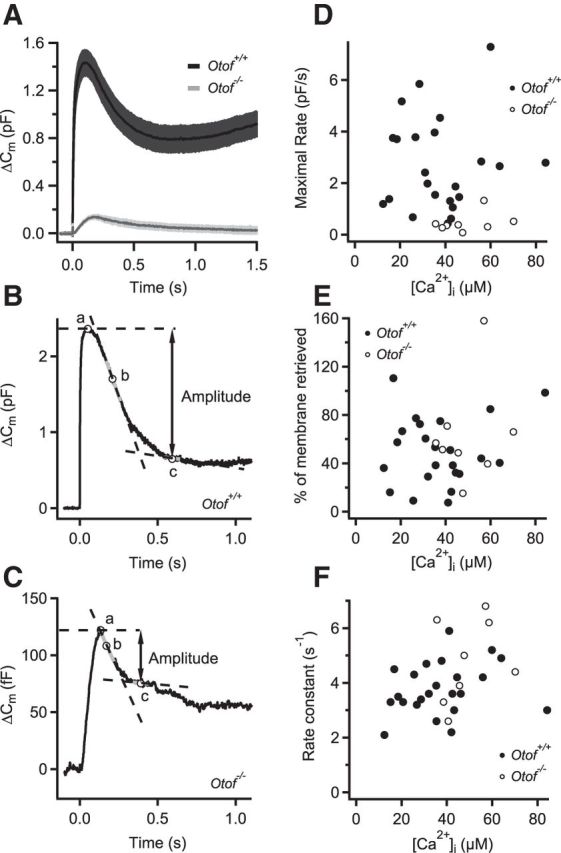
Rapid endocytic Cm decline after flash photolysis is primarily unaffected by otoferlin disruption. A, Average flash photolysis-evoked ΔCm responses in IHCs of wild-type (Otof+/+, black) and otoferlin knock-out (Otof−/−, gray) mice. UV Ca2+ uncaging was triggered at time point 0. B, C, Examples of a flash response in a wild-type (B) and otoferlin knock-out (C) IHC. Maximal rate of endocytosis was determined by fitting a line (dotted lines) to overlapping 100 ms segments of the Cm trace and finding the one with the most negative slope (at point b). The amplitude of endocytosis was then defined as the Cm difference between the point of maximal Cm response (point a) and the point at which the endocytic rate fell to 5% of the maximal rate (at point c). D, Maximal rate of endocytosis in Otof+/+ (filled circles) and Otof−/− (open circles) IHCs as a function of peak postflash [Ca2+]i. Slow and small exocytosis in Otof−/− IHCs was followed by endocytosis at lower rates. E, Percentage of exocytosed membrane that is retrieved until the rate of endocytosis is reduced to 5% of the maximal rate [see B and C: (point a − point c)/point a × 100]. F, The rate constant of endocytosis, obtained by dividing maximal endocytic rate by the amplitude of endocytosis, as a function of peak postflash [Ca2+]i. Endocytic rate constants that are independent of postflash [Ca2+]i were not significantly different between the two genotypes (Student's t test, p = 0.1).
Discussion
Here we characterized three kinetic modes of endocytic membrane retrieval in mouse IHCs and provide first insight into their molecular regulation. We present evidence for a slow clathrin- and dynamin 1-dependent mode of membrane retrieval. It apparently proceeds with a limited and nearly constant rate and probably represents CME. Ca2+ influx-triggered exocytosis exceeding approximately three to four equivalents of the RRP increasingly recruits an additional exponential component of membrane retrieval. It proceeds with a time constant of ∼6 s, seems to be clathrin and dynamin independent, and probably represents bulk endocytosis. Rapid endocytosis (time constant of ∼250 ms) after global [Ca2+] elevation to 15 μm or more seemed mostly unaffected by otoferlin disruption and, because of its speed, may reflect kiss-and-run endocytosis. Finally, we characterized vglut1–pHluorin imaging for studying exocytosis and endocytosis in IHCs and indicate local membrane cycling.
Insights into IHC endocytosis from Cm and pHluorin recordings
Analysis of hair cell endocytosis by Cm measurements and optical methods (Gale et al., 2001; Griesinger et al., 2002; Granseth et al., 2006; the present study) requires consideration of potential caveats. First, whole-cell Cm measurements lack spatial resolution and report the sum of exocytic membrane fusion and endocytic membrane fission. Finding that vglut1–pHluorin fluorescence primarily increases at ribbon-type AZs (Fig. 4) argues that Ca2+ influx-triggered exocytosis preferentially occurs synaptically, which is consistent with other lines of evidence (Griesinger et al., 2005; Schnee et al., 2005; Goutman and Glowatzki, 2007; Li et al., 2009; Meyer et al., 2009). vglut1–pHluorin fluorescence remained near the AZs for several seconds, which seems hard to reconcile with a vivid diffusion of exocytosed membrane and proteins to the apical pole of the hair cell for endocytosis (Griesinger et al., 2005). Therefore, we favor the hypothesis of a local recycling of synaptic vesicle membrane and proteins, which is further supported by parallel work using a novel fluorescent membrane tracer (N. H. Revelo, D. Kamin, A. B. Wong, K. Reuter, E. Reisinger, T. Moser, and S. O. Rizzoli, unpublished observations).
Second, the Cm decline reports the reduction of membrane accessible to voltage clamp. However, we cannot rule out that membrane infoldings that remained connected to the extracellular space via narrow membrane necks or even fission pores escaped the voltage clamp and were mistaken as completely retrieved. This could explain why pitstop 2 and Dyngo-4a apparently had no effect on the exponential component of the Cm decline, whereby the GTPγS effect might then be attributed to continued G-protein-driven asynchronous exocytosis (Fernandez et al., 1984; Rupnik and Zorec, 1995), balancing the extent of membrane infolding in a quantitative manner. Alternatively, the discrepancy between the effects of Dyngo-4a and GTPγS might be explained by the inhibition of activity of dynamin 3 by GTPγS but not Dyngo-4a. Third, using vglut1 rather than the physiologically expressed vglut3 for pHluorin imaging may have altered vesicular function, and future experiments using vglut3–pHluorin will be useful. Fourth, exocytosis and endocytosis are strongly influenced by temperature (Nouvian, 2007; Renden and von Gersdorff, 2007). It is possible that results obtained at physiological temperature differ from those presented here. Our data show that, contrary to a previous report (Parsons et al., 1994), endocytic membrane retrieval in hair cells can also be measured in ruptured-patch configuration, which likely relates to GTP being present in the intracellular solution in our experiments (Fig. 6) but not in the study by Parsons et al. (1994).
IHCs uses a rate-limited clathrin- and dynamin-dependent membrane retrieval that balances exocytosis at low rates of stimulation
Regardless of the amount of preceding exocytosis, we observed a linear decline of Cm that proceeded with a rate of ∼1–2 fF/s, which corresponds to the retrieval of approximately two to four synaptic vesicle equivalents (45 aF; Neef et al., 2007) per synapse and second. Inhibition of clathrin by pitstop 2 as well as block of dynamin by Dyngo-4a (IC50 for dynamin 1 of 0.4 μm; Daniel et al., 2012), but not its inactive control Dyngo-8a (IC50 for dynamin 1 of 47 μm; Daniel et al., 2012), inhibited this mode of membrane retrieval, indicating that it represents dynamin-dependent CME. Moreover, this component of Cm decline was also inhibited by a missense mutation in dynamin 1 (fitful) that we showed previously to interfere with dynamin 1 dimerization and to cause a mild hearing impairment (Boumil et al., 2010). Because the effects of the fitful mutation and of Dyngo-4a, which at concentration used (30 μm, applied via the patch pipette) likely blocks dynamin 1 and 2, were comparable, we suggest that dynamin 1 is the prevailing dynamin isoform mediating membrane fission during the linear component of Cm decline in IHCs of hearing mice. Although interference with dynamin and clathrin function did not reach significance for endocytosis after 200 ms stimuli, we assume that the substantial variability of the Cm decline masked the inhibition of the linear component of Cm decline. This slow mode of IHC endocytosis is reminiscent of the slow mode of endocytosis in goldfish retinal bipolar neurons for its clathrin and dynamin dependence (Jockusch et al., 2005). However, different from these ribbon synapses and the calyx of Held, which use a fast exponential mechanism of limited capacity to retrieve membrane after brief Ca2+ influx (Sun et al., 2002; Wu et al., 2005; Yamashita et al., 2005; Renden and von Gersdorff, 2007; Lou et al., 2008; Llobet et al., 2011), IHCs use this slow mode for compensating low rates of exocytosis.
The exponential component of Cm decline increases with the amount of exocytosis and likely represents bulk endocytosis
When the amount of exocytosis exceeded approximately three to four RRP equivalents, IHCs recruited a second, exponentially decaying component of Cm decline. This component increased in amplitude with the amount of preceding exocytosis (Fig. 5D) but the decay time constant was nearly constant, contrasting with reports from frog auditory hair cells in which the time constant scaled with preceding release (Cho et al., 2011). This component might represent bulk endocytosis (for review, see Clayton and Cousin, 2009), used in addition to the slower clathrin-dependent mode of membrane retrieval when a certain threshold of exocytosis or accumulated Ca2+ charge is passed. Indeed, there is good evidence for bulk endocytosis at ribbon synapses in general (Holt et al., 2003; Paillart et al., 2003; Coggins et al., 2007) and also at hair cell synapses (Fig. 1; Lenzi et al., 2002). However, different from bipolar cells (von Gersdorff and Matthews, 1994; Neves and Lagnado, 1999; Llobet et al., 2011), its contribution seems to increase with the amount of preceding exocytosis in IHCs (Fig. 5D). We postulate that IHCs use bulk endocytosis as a mechanism to increase the surface on which the endocytic machinery can operate to recycle vesicles, while maintaining the perisynaptic plasma membrane organization during strong exocytic load. This view is supported by the presence of cisternal membrane organelles around the AZ, which exceed the size of coated vesicles but in many cases show a clathrin coat on some part of the membrane (Fig. 1A,D). It will be interesting to test whether, as for bulk endocytosis in CNS terminals, this mode of endocytosis is regulated by Ca2+ and calcineurin (Clayton et al., 2009; Wu et al., 2009; Yamashita et al., 2010). However, CME seems not to immediately recycle synaptic vesicles either, because clathrin-coated vesicles are approximately twofold larger than synaptic vesicles in IHCs (Fig. 1E).
Coupling of exocytosis and endocytosis in IHCs
Coupling of exocytosis and endocytosis is probably critical in IHCs, given their high sustained release rates (hundreds of Hz; Frank et al., 2010; Pangršič et al., 2010, 2012), and its regulation may involve otoferlin (Duncker et al., 2013), which is required for efficient vesicle replenishment (Pangršič et al., 2010). Therefore, we revisited the question whether absence of otoferlin disrupts endocytic membrane retrieval and tested the impact of inhibiting endocytosis on exocytosis (Kawasaki et al., 2000; Hosoi et al., 2009). We quantified rapid endocytosis occurring after Ca2+ uncaging in IHCs of otoferlin knock-out mice (Roux et al., 2006; Reisinger et al., 2011) and found comparable time constants and contributions. This argues against an essential role of otoferlin in regulating this mode of hair cell endocytosis. Moreover, we did not observe a significant reduction of exocytosis with any of the manipulations that selectively impeded the linear component of endocytosis. This is different from the calyx of Held synapse, in which inhibited AZ clearance has been implicated to explain the slowing of vesicle replenishment during manipulation of endocytosis (Hosoi et al., 2009; Xu et al., 2013). However, even when massively driving exocytosis by repetitive stimulation with strong stimuli, which turned over membrane equivalent to >10% of the IHC plasma membrane, we did not find a reduction with Dyngo-4a, contrasting a recent report that Dynasore, another dynamin inhibitor, inhibits exocytosis (Duncker et al., 2013). The lack of a reduction of exocytosis in the presence of Dyngo-4a in our study despite ∼100 RRP equivalents turned over (1 pF cumulative Cm rise, RRP of ∼10 fF; Pangršič et al., 2010) argues against a rate limitation of AZ clearance attributable to inhibition of the linear component of endocytosis. However, we cannot rule out that a complete block of endocytosis may limit exocytosis via this mechanism.
Notes
Supplemental material for this article is available at www.innerearlab.uni-goettingen.de/materials.html. The material supplies alternative versions of the figures with additional display of the SEM of the average capacitance traces. This material has not been peer reviewed.
Footnotes
This work was supported by grants from the German Research Foundation through Collaborative Research Center 889 (Project A5 to T.M. and A7 to C.W.), the Center for Nanoscale Microscopy and Molecular Physiology of the Brain (T.M., S.K.), and the German Federal Ministry of Education and Research (through the Bernstein Focus for Neutotechnology Grant 01GQ0810 to T.M.). A.B.W. was supported by a Lichtenberg fellowship from the state of Lower Saxony (through the “Neurosenses” PhD program). We thank S. Gerke and C. Senger-Freitag for expert technical assistance. We also thank J. Daniel and P. Robinson for supplying us with Dyngo-8a. We thank J. Daniel and S. Rizzoli for feedback on this manuscript.
The authors declare no competing financial interests.
References
- Bedrosian JC, Gratton MA, Brigande JV, Tang W, Landau J, Bennett J. In vivo delivery of recombinant viruses to the fetal murine cochlea: transduction characteristics and long-term effects on auditory function. Mol Ther. 2006;14:328–335. doi: 10.1016/j.ymthe.2006.04.003. [DOI] [PMC free article] [PubMed] [Google Scholar]
- Beutner D, Voets T, Neher E, Moser T. Calcium dependence of exocytosis and endocytosis at the cochlear inner hair cell afferent synapse. Neuron. 2001;29:681–690. doi: 10.1016/S0896-6273(01)00243-4. [DOI] [PubMed] [Google Scholar]
- Boumil RM, Letts VA, Roberts MC, Lenz C, Mahaffey CL, Zhang ZW, Moser T, Frankel WN. A missense mutation in a highly conserved alternate exon of dynamin-1 causes epilepsy in fitful mice. PLoS Genet. 2010;6:e1001046. doi: 10.1371/journal.pgen.1001046. pii. [DOI] [PMC free article] [PubMed] [Google Scholar]
- Brigande JV, Gubbels SP, Woessner DW, Jungwirth JJ, Bresee CS. Electroporation-mediated gene transfer to the developing mouse inner ear. Methods Mol Biol. 2009;493:125–139. doi: 10.1007/978-1-59745-523-7_8. [DOI] [PMC free article] [PubMed] [Google Scholar]
- Cho S, Li GL, von Gersdorff H. Recovery from short-term depression and facilitation is ultrafast and Ca2+ dependent at auditory hair cell synapses. J Neurosci. 2011;31:5682–5692. doi: 10.1523/JNEUROSCI.5453-10.2011. [DOI] [PMC free article] [PubMed] [Google Scholar]
- Clayton EL, Cousin MA. The molecular physiology of activity-dependent bulk endocytosis of synaptic vesicles. J Neurochem. 2009;111:901–914. doi: 10.1111/j.1471-4159.2009.06384.x. [DOI] [PMC free article] [PubMed] [Google Scholar]
- Clayton EL, Anggono V, Smillie KJ, Chau N, Robinson PJ, Cousin MA. The phospho-dependent dynamin–syndapin interaction triggers activity-dependent bulk endocytosis of synaptic vesicles. J Neurosci. 2009;29:7706–7717. doi: 10.1523/JNEUROSCI.1976-09.2009. [DOI] [PMC free article] [PubMed] [Google Scholar]
- Coggins MR, Grabner CP, Almers W, Zenisek D. Stimulated exocytosis of endosomes in goldfish retinal bipolar neurons. J Physiol. 2007;584:853–865. doi: 10.1113/jphysiol.2007.140848. [DOI] [PMC free article] [PubMed] [Google Scholar]
- Cui G, Meyer AC, Calin-Jageman I, Neef J, Haeseleer F, Moser T, Lee A. Ca2+-binding proteins tune Ca2+-feedback to Cav1. 3 channels in mouse auditory hair cells. J Physiol. 2007;585:791–803. doi: 10.1113/jphysiol.2007.142307. [DOI] [PMC free article] [PubMed] [Google Scholar]
- Daniel JA, Malladi CS, Kettle E, McCluskey A, Robinson PJ. Analysis of synaptic vesicle endocytosis in synaptosomes by high-content screening. Nat Protoc. 2012;7:1439–1455. doi: 10.1038/nprot.2012.070. [DOI] [PubMed] [Google Scholar]
- Dittman J, Ryan TA. Molecular circuitry of endocytosis at nerve terminals. Annu Rev Cell Dev Biol. 2009;25:133–160. doi: 10.1146/annurev.cellbio.042308.113302. [DOI] [PubMed] [Google Scholar]
- Duncker SV, Franz C, Kuhn S, Schulte U, Campanelli D, Brandt N, Hirt B, Fakler B, Blin N, Ruth P, Engel J, Marcotti W, Zimmermann U, Knipper M. Otoferlin couples to clathrin-mediated endocytosis in mature cochlear inner hair cells. J Neurosci. 2013;33:9508–9519. doi: 10.1523/JNEUROSCI.5689-12.2013. [DOI] [PMC free article] [PubMed] [Google Scholar]
- Ferguson SM, De Camilli P. Dynamin, a membrane-remodelling GTPase. Nat Rev Mol Cell Biol. 2012;13:75–88. doi: 10.1038/nrm3266. [DOI] [PMC free article] [PubMed] [Google Scholar]
- Ferguson SM, Brasnjo G, Hayashi M, Wölfel M, Collesi C, Giovedi S, Raimondi A, Gong LW, Ariel P, Paradise S, O'Toole E, Flavell R, Cremona O, Miesenböck G, Ryan TA, De Camilli P. A selective activity-dependent requirement for dynamin 1 in synaptic vesicle endocytosis. Science. 2007;316:570–574. doi: 10.1126/science.1140621. [DOI] [PubMed] [Google Scholar]
- Fernandez JM, Neher E, Gomperts BD. Capacitance measurements reveal stepwise fusion events in degranulating mast cells. Nature. 1984;312:453–455. doi: 10.1038/312453a0. [DOI] [PubMed] [Google Scholar]
- Francis AA, Mehta B, Zenisek D. Development of new peptide-based tools for studying synaptic ribbon function. J Neurophysiol. 2011;106:1028–1037. doi: 10.1152/jn.00255.2011. [DOI] [PMC free article] [PubMed] [Google Scholar]
- Frank T, Rutherford MA, Strenzke N, Neef A, Pangršič T, Khimich D, Fejtova A, Gundelfinger ED, Liberman MC, Harke B, Bryan KE, Lee A, Egner A, Riedel D, Moser T. Bassoon and the synaptic ribbon organize Ca2+ channels and vesicles to add release sites and promote refilling. Neuron. 2010;68:724–738. doi: 10.1016/j.neuron.2010.10.027. [DOI] [PMC free article] [PubMed] [Google Scholar]
- Gale JE, Marcotti W, Kennedy HJ, Kros CJ, Richardson GP. FM1–43 dye behaves as a permeant blocker of the hair-cell mechanotransducer channel. J Neurosci. 2001;21:7013–7025. doi: 10.1523/JNEUROSCI.21-18-07013.2001. [DOI] [PMC free article] [PubMed] [Google Scholar]
- Glowatzki E, Grant L, Fuchs P. Hair cell afferent synapses. Curr Opin Neurobiol. 2008;18:389–395. doi: 10.1016/j.conb.2008.09.006. [DOI] [PMC free article] [PubMed] [Google Scholar]
- Goutman JD, Glowatzki E. Time course and calcium dependence of transmitter release at a single ribbon synapse. Proc Natl Acad Sci U S A. 2007;104:16341–16346. doi: 10.1073/pnas.0705756104. [DOI] [PMC free article] [PubMed] [Google Scholar]
- Granseth B, Odermatt B, Royle SJ, Lagnado L. Clathrin-mediated endocytosis is the dominant mechanism of vesicle retrieval at hippocampal synapses. Neuron. 2006;51:773–786. doi: 10.1016/j.neuron.2006.08.029. [DOI] [PubMed] [Google Scholar]
- Griesinger CB, Richards CD, Ashmore JF. FM1–43 reveals membrane recycling in adult inner hair cells of the mammalian cochlea. J Neurosci. 2002;22:3939–3952. doi: 10.1523/JNEUROSCI.22-10-03939.2002. [DOI] [PMC free article] [PubMed] [Google Scholar]
- Griesinger CB, Richards CD, Ashmore JF. Fast vesicle replenishment allows indefatigable signalling at the first auditory synapse. Nature. 2005;435:212–215. doi: 10.1038/nature03567. [DOI] [PubMed] [Google Scholar]
- Holt M, Cooke A, Wu MM, Lagnado L. Bulk membrane retrieval in the synaptic terminal of retinal bipolar cells. J Neurosci. 2003;23:1329–1339. doi: 10.1523/JNEUROSCI.23-04-01329.2003. [DOI] [PMC free article] [PubMed] [Google Scholar]
- Hosoi N, Holt M, Sakaba T. Calcium dependence of exo- and endocytotic coupling at a glutamatergic synapse. Neuron. 2009;63:216–229. doi: 10.1016/j.neuron.2009.06.010. [DOI] [PubMed] [Google Scholar]
- Howes MT, Kirkham M, Riches J, Cortese K, Walser PJ, Simpson F, Hill MM, Jones A, Lundmark R, Lindsay MR, Hernandez-Deviez DJ, Hadzic G, McCluskey A, Bashir R, Liu L, Pilch P, McMahon H, Robinson PJ, Hancock JF, Mayor S, Parton RG. Clathrin-independent carriers form a high capacity endocytic sorting system at the leading edge of migrating cells. J Cell Biol. 2010;190:675–691. doi: 10.1083/jcb.201002119. [DOI] [PMC free article] [PubMed] [Google Scholar]
- Jockusch WJ, Praefcke GJK, McMahon HT, Lagnado L. Clathrin-dependent and clathrin-independent retrieval of synaptic vesicles in retinal bipolar cells. Neuron. 2005;46:869–878. doi: 10.1016/j.neuron.2005.05.004. [DOI] [PubMed] [Google Scholar]
- Johnson CP, Chapman ER. Otoferlin is a calcium sensor that directly regulates SNARE-mediated membrane fusion. J Cell Biol. 2010;191:187–197. doi: 10.1083/jcb.201002089. [DOI] [PMC free article] [PubMed] [Google Scholar]
- Kawasaki F, Hazen M, Ordway RW. Fast synaptic fatigue in shibire mutants reveals a rapid requirement for dynamin in synaptic vesicle membrane trafficking. Nat Neurosci. 2000;3:859–860. doi: 10.1038/78753. [DOI] [PubMed] [Google Scholar]
- Kügler S, Hahnewald R, Garrido M, Reiss J. Long-term rescue of a lethal inherited disease by adeno-associated virus-mediated gene transfer in a mouse model of molybdenum-cofactor deficiency. Am J Hum Genet. 2007;80:291–297. doi: 10.1086/511281. [DOI] [PMC free article] [PubMed] [Google Scholar]
- Lenzi D, Crum J, Ellisman MH, Roberts WM. Depolarization redistributes synaptic membrane and creates a gradient of vesicles on the synaptic body at a ribbon synapse. Neuron. 2002;36:649–659. doi: 10.1016/S0896-6273(02)01025-5. [DOI] [PubMed] [Google Scholar]
- Levic S, Bouleau Y, Dulon D. Developmental acquisition of a rapid calcium-regulated vesicle supply allows sustained high rates of exocytosis in auditory hair cells. PLoS One. 2011;6:e25714. doi: 10.1371/journal.pone.0025714. [DOI] [PMC free article] [PubMed] [Google Scholar]
- Li GL, Keen E, Andor-Ardó D, Hudspeth AJ, von Gersdorff H. The unitary event underlying multiquantal EPSCs at a hair cell's ribbon synapse. J Neurosci. 2009;29:7558–7568. doi: 10.1523/JNEUROSCI.0514-09.2009. [DOI] [PMC free article] [PubMed] [Google Scholar]
- Lindau M, Neher E. Patch-clamp techniques for time-resolved capacitance measurements in single cells. Pflugers Arch. 1988;411:137–146. doi: 10.1007/BF00582306. [DOI] [PubMed] [Google Scholar]
- Llobet A, Gallop JL, Burden JJE, Camdere G, Chandra P, Vallis Y, Hopkins CR, Lagnado L, McMahon HT. Endophilin drives the fast mode of vesicle retrieval in a ribbon synapse. J Neurosci. 2011;31:8512–8519. doi: 10.1523/JNEUROSCI.6223-09.2011. [DOI] [PMC free article] [PubMed] [Google Scholar]
- Lou X, Paradise S, Ferguson SM, De Camilli P. Selective saturation of slow endocytosis at a giant glutamatergic central synapse lacking dynamin 1. Proc Natl Acad Sci U S A. 2008;105:17555–17560. doi: 10.1073/pnas.0809621105. [DOI] [PMC free article] [PubMed] [Google Scholar]
- Meyer AC, Moser T. Structure and function of cochlear afferent innervation. Curr Opin Otolaryngol Head Neck Surg. 2010;18:441–446. doi: 10.1097/MOO.0b013e32833e0586. [DOI] [PubMed] [Google Scholar]
- Meyer AC, Frank T, Khimich D, Hoch G, Riedel D, Chapochnikov NM, Yarin YM, Harke B, Hell SW, Egner A, Moser T. Tuning of synapse number, structure and function in the cochlea. Nat Neurosci. 2009;12:444–453. doi: 10.1038/nn.2293. [DOI] [PubMed] [Google Scholar]
- Miesenböck G, De Angelis DA, Rothman JE. Visualizing secretion and synaptic transmission with pH-sensitive green fluorescent proteins. Nature. 1998;394:192–195. doi: 10.1038/28190. [DOI] [PubMed] [Google Scholar]
- Moser T, Beutner D. Kinetics of exocytosis and endocytosis at the cochlear inner hair cell afferent synapse of the mouse. Proc Natl Acad Sci U S A. 2000;97:883–888. doi: 10.1073/pnas.97.2.883. [DOI] [PMC free article] [PubMed] [Google Scholar]
- Neef A, Khimich D, Pirih P, Riedel D, Wolf F, Moser T. Probing the mechanism of exocytosis at the hair cell ribbon synapse. J Neurosci. 2007;27:12933–12944. doi: 10.1523/JNEUROSCI.1996-07.2007. [DOI] [PMC free article] [PubMed] [Google Scholar]
- Neher E, Sakaba T. Multiple roles of calcium ions in the regulation of neurotransmitter release. Neuron. 2008;59:861–872. doi: 10.1016/j.neuron.2008.08.019. [DOI] [PubMed] [Google Scholar]
- Neves G, Lagnado L. The kinetics of exocytosis and endocytosis in the synaptic terminal of goldfish retinal bipolar cells. J Physiol. 1999;515:181–202. doi: 10.1111/j.1469-7793.1999.181ad.x. [DOI] [PMC free article] [PubMed] [Google Scholar]
- Nouvian R. Temperature enhances exocytosis efficiency at the mouse inner hair cell ribbon synapse. J Physiol. 2007;584:535–542. doi: 10.1113/jphysiol.2007.139675. [DOI] [PMC free article] [PubMed] [Google Scholar]
- Paillart C, Li J, Matthews G, Sterling P. Endocytosis and vesicle recycling at a ribbon synapse. J Neurosci. 2003;23:4092–4099. doi: 10.1523/JNEUROSCI.23-10-04092.2003. [DOI] [PMC free article] [PubMed] [Google Scholar]
- Pangršič T, Lasarow L, Reuter K, Takago H, Schwander M, Riedel D, Frank T, Tarantino LM, Bailey JS, Strenzke N, Brose N, Müller U, Reisinger E, Moser T. Hearing requires otoferlin-dependent efficient replenishment of synaptic vesicles in hair cells. Nat Neurosci. 2010;13:869–876. doi: 10.1038/nn.2578. [DOI] [PubMed] [Google Scholar]
- Pangršič T, Reisinger E, Moser T. Otoferlin: a multi-C2 domain protein essential for hearing. Trends Neurosci. 2012;35:671–680. doi: 10.1016/j.tins.2012.08.002. [DOI] [PubMed] [Google Scholar]
- Parsons TD, Lenzi D, Almers W, Roberts WM. Calcium-triggered exocytosis and endocytosis in an isolated presynaptic cell: capacitance measurements in saccular hair cells. Neuron. 1994;13:875–883. doi: 10.1016/0896-6273(94)90253-4. [DOI] [PubMed] [Google Scholar]
- Reisinger E, Bresee C, Neef J, Nair R, Reuter K, Bulankina A, Nouvian R, Koch M, Bückers J, Kastrup L, Roux I, Petit C, Hell SW, Brose N, Rhee JS, Kügler S, Brigande JV, Moser T. Probing the functional equivalence of otoferlin and synaptotagmin 1 in exocytosis. J Neurosci. 2011;31:4886–4895. doi: 10.1523/JNEUROSCI.5122-10.2011. [DOI] [PMC free article] [PubMed] [Google Scholar]
- Renden R, von Gersdorff H. Synaptic vesicle endocytosis at a CNS nerve terminal: faster kinetics at physiological temperatures and increased endocytotic capacity during maturation. J Neurophysiol. 2007;98:3349–3359. doi: 10.1152/jn.00898.2007. [DOI] [PubMed] [Google Scholar]
- Roux I, Safieddine S, Nouvian R, Grati M, Simmler MC, Bahloul A, Perfettini I, Le Gall M, Rostaing P, Hamard G, Triller A, Avan P, Moser T, Petit C. Otoferlin, defective in a human deafness form, is essential for exocytosis at the auditory ribbon synapse. Cell. 2006;127:277–289. doi: 10.1016/j.cell.2006.08.040. [DOI] [PubMed] [Google Scholar]
- Royle SJ, Lagnado L. Clathrin-mediated endocytosis at the synaptic terminal: bridging the gap between physiology and molecules. Traffic. 2010;11:1489–1497. doi: 10.1111/j.1600-0854.2010.01104.x. [DOI] [PMC free article] [PubMed] [Google Scholar]
- Rupnik M, Zorec R. Intracellular Cl− modulates Ca2+-induced exocytosis from rat melanotrophs through GTP-binding proteins. Pflugers Arch. 1995;431:76–83. doi: 10.1007/BF00374379. [DOI] [PubMed] [Google Scholar]
- Rutherford MA, Chapochnikov NM, Moser T. Spike encoding of neurotransmitter release timing by spiral ganglion neurons of the cochlea. J Neurosci. 2012;32:4773–4789. doi: 10.1523/JNEUROSCI.4511-11.2012. [DOI] [PMC free article] [PubMed] [Google Scholar]
- Sanchez del Rio M, Pareschi G. Global optimization and reflectivity data fitting for x-ray multilayer mirrors by means of genetic algorithms. SPIE Proceedings; 2001. pp. 88–96. [Google Scholar]
- Schnee ME, Ricci AJ. Biophysical and pharmacological characterization of voltage-gated calcium currents in turtle auditory hair cells. J Physiol. 2003;549:697–717. doi: 10.1113/jphysiol.2002.037481. [DOI] [PMC free article] [PubMed] [Google Scholar]
- Schnee ME, Lawton DM, Furness DN, Benke TA, Ricci AJ. Auditory hair cell-afferent fiber synapses are specialized to operate at their best frequencies. Neuron. 2005;47:243–254. doi: 10.1016/j.neuron.2005.06.004. [DOI] [PubMed] [Google Scholar]
- Sendin G, Bulankina AV, Riedel D, Moser T. Maturation of ribbon synapses in hair cells is driven by thyroid hormone. J Neurosci. 2007;27:3163–3173. doi: 10.1523/JNEUROSCI.3974-06.2007. [DOI] [PMC free article] [PubMed] [Google Scholar]
- Siegel JH. Spontaneous synaptic potentials from afferent terminals in the guinea pig cochlea. Hear Res. 1992;59:85–92. doi: 10.1016/0378-5955(92)90105-V. [DOI] [PubMed] [Google Scholar]
- Siegel JH, Brownell WE. Synaptic and Golgi membrane recycling in cochlear hair cells. J Neurocytol. 1986;15:311–328. doi: 10.1007/BF01611434. [DOI] [PubMed] [Google Scholar]
- Smith SM, Renden R, von Gersdorff H. Synaptic vesicle endocytosis: fast and slow modes of membrane retrieval. Trends Neurosci. 2008;31:559–568. doi: 10.1016/j.tins.2008.08.005. [DOI] [PMC free article] [PubMed] [Google Scholar]
- Sun JY, Wu XS, Wu LG. Single and multiple vesicle fusion induce different rates of endocytosis at a central synapse. Nature. 2002;417:555–559. doi: 10.1038/417555a. [DOI] [PubMed] [Google Scholar]
- Trapani JG, Obholzer N, Mo W, Brockerhoff SE, Nicolson T. synaptojanin1 is required for temporal fidelity of synaptic transmission in hair cells. PLoS Genet. 2009;5:e1000480. doi: 10.1371/journal.pgen.1000480. [DOI] [PMC free article] [PubMed] [Google Scholar]
- von Gersdorff H, Matthews G. Inhibition of endocytosis by elevated internal calcium in a synaptic terminal. Nature. 1994;370:652–655. doi: 10.1038/370652a0. [DOI] [PubMed] [Google Scholar]
- von Kleist L, Stahlschmidt W, Bulut H, Gromova K, Puchkov D, Robertson MJ, MacGregor KA, Tomlin N, Pechstein A, Chau N, Chircop M, Sakoff J, von Kries JP, Saenger W, Kräusslich HG, Shupliakov O, Robinson PJ, McCluskey A, Haucke V. Role of the clathrin terminal domain in regulating coated pit dynamics revealed by small molecule inhibition. Cell. 2011;146:471–484. doi: 10.1016/j.cell.2011.06.025. [DOI] [PubMed] [Google Scholar]
- Wahl S, Katiyar R, Schmitz F. A local, periactive zone endocytic machinery at photoreceptor synapses in close vicinity to synaptic ribbons. J Neurosci. 2013;33:10278–10300. doi: 10.1523/JNEUROSCI.5048-12.2013. [DOI] [PMC free article] [PubMed] [Google Scholar]
- Wu LG. Kinetic regulation of vesicle endocytosis at synapses. Trends Neurosci. 2004;27:548–554. doi: 10.1016/j.tins.2004.07.001. [DOI] [PubMed] [Google Scholar]
- Wu LG, Ryan TA, Lagnado L. Modes of vesicle retrieval at ribbon synapses, calyx-type synapses, and small central synapses. J Neurosci. 2007;27:11793–11802. doi: 10.1523/JNEUROSCI.3471-07.2007. [DOI] [PMC free article] [PubMed] [Google Scholar]
- Wu W, Xu J, Wu XS, Wu LG. Activity-dependent acceleration of endocytosis at a central synapse. J Neurosci. 2005;25:11676–11683. doi: 10.1523/JNEUROSCI.2972-05.2005. [DOI] [PMC free article] [PubMed] [Google Scholar]
- Wu XS, McNeil BD, Xu J, Fan J, Xue L, Melicoff E, Adachi R, Bai L, Wu LG. Ca2+ and calmodulin initiate all forms of endocytosis during depolarization at a nerve terminal. Nat Neurosci. 2009;12:1003–1010. doi: 10.1038/nn.2355. [DOI] [PMC free article] [PubMed] [Google Scholar]
- Xu J, Luo F, Zhang Z, Xue L, Wu XS, Chiang HC, Shin W, Wu LG. SNARE proteins synaptobrevin, SNAP-25, and syntaxin are involved in rapid and slow endocytosis at synapses. Cell Rep. 2013;3:1414–1421. doi: 10.1016/j.celrep.2013.03.010. [DOI] [PMC free article] [PubMed] [Google Scholar]
- Yamashita T, Hige T, Takahashi T. Vesicle endocytosis requires dynamin-dependent GTP hydrolysis at a fast CNS synapse. Science. 2005;307:124–127. doi: 10.1126/science.1103631. [DOI] [PubMed] [Google Scholar]
- Yamashita T, Eguchi K, Saitoh N, von Gersdorff H, Takahashi T. Developmental shift to a mechanism of synaptic vesicle endocytosis requiring nanodomain Ca2+ Nat Neurosci. 2010;13:838–844. doi: 10.1038/nn.2576. [DOI] [PMC free article] [PubMed] [Google Scholar]
- Yang PS, Alseikhan BA, Hiel H, Grant L, Mori MX, Yang W, Fuchs PA, Yue DT. Switching of Ca2+-dependent inactivation of Ca(v)1.3 channels by calcium binding proteins of auditory hair cells. J Neurosci. 2006;26:10677–10689. doi: 10.1523/JNEUROSCI.3236-06.2006. [DOI] [PMC free article] [PubMed] [Google Scholar]