Abstract
The aim of this work was to develop and characterize an ELISA to measure free ligand concentrations in rat serum in the presence of a Fab to the same ligand. A variety of experiments were conducted to understand optimal assay conditions and to verify that only free ligand was detected. The parameters explored included sample incubation time on plate, the initial concentrations of Fab and ligand, and the pre-incubation time required for the Fab-ligand complex concentrations to reach equilibrium. We found the optimal experimental conditions to include a 10-minute on-plate incubation of ligand-containing samples, with a 24-hour pre-incubation time for test samples of Fab and ligand to reach equilibrium. An alternative approach, involving removal of Fab-ligand complexes from the solution prior to measuring concentrations of the ligand, was also used to verify that the assay only measured free ligand. Rats were dosed subcutaneously with Fab and the assay was used to demonstrate dose-dependent suppression of endogenous free ligand levels in vivo.
Keywords: antibody, ELISA, free ligand, PK/PD, Fab
Introduction
Antibodies and antibody-related molecules are an important class of biotherapeutic agents. An important subset of the antibody-related therapeutics is the antibody that binds to a soluble endogenous ligand. A primary mechanism of action of these agents is to decrease free ligand levels, thus inhibiting the ability of the ligand to achieve its biological effect. The ability to interpret whether or not an anti-ligand antibody is achieving the desired effect on the target relies on the ability to measure ligand levels in the presence of the therapeutic agent. Further, pharmacokinetic/pharmacodynamic (PK/PD) modeling is becoming widely used in the development of these agents,1-5 and development of these models also relies heavily on the ability to quantify the ligand after administration of an anti-ligand antibody.
For some antibodies that target soluble ligands, decisions about optimal dosing regimens need to be made based solely on inferences made about duration of suppression of the target ligand. For example, in instances where there are no other biomarkers of antibody effects during early clinical studies, the target ligand data can become the sole method of determining dosing regimens for efficacy studies. Historically, total ligand (antibody-bound + free ligand) levels have been easier to obtain than free ligand levels after dosing a therapeutic antibody. With total ligand levels available, PK/PD modeling can be used to characterize the interaction between antibody and ligand based on total ligand levels and circulating antibody concentrations. The PK/PD model can then be used to predict free ligand levels, and thus the duration of ligand suppression following antibody dosing. However, as these types of models are still quite new, more data are necessary before conclusions can be generalized regarding the accuracy of these types of predictions. The ideal case would be to have direct measures of both total and free ligand available that would facilitate the development and exploration of assumptions involved in the quantitative PK/PD models used for these systems.
While it may be desirable to have measures of both total and free ligand following antibody dosing, the more direct measure of whether the desired effect has been achieved is the free ligand level, and obtaining free ligand data are critical for evaluating the assumptions of antibody-ligand PK/PD models. Measurement of free ligand levels in the presence of antibody presents a particular challenge, as the total ligand levels are often orders of magnitude greater than the free ligand levels, and even a small degree of exchange or contamination of the total ligand in the free assay will be unacceptable.4,6
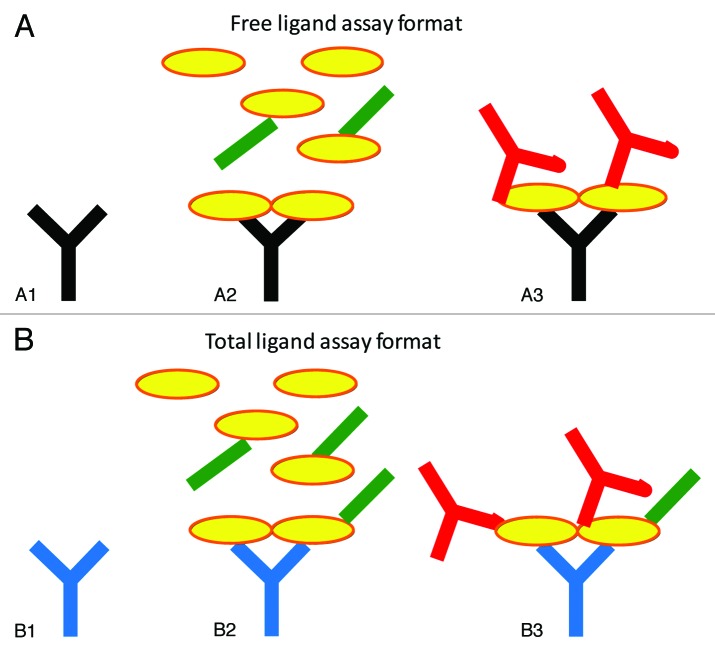
In recent years, a number of studies have examined the effect of dosed antibody on the in vivo levels of the target ligand. Of these, a subset has reported measurement of free ligand levels, including assays for IgE,7-12 Dkk-1,13 PCSK914,15 and VEGF.16 The format for measurement of free ligand in these cases has been similar, and has included capture with an antibody that binds to the same epitope on the ligand as does the therapeutic agent, thus theoretically not allowing the ligand in the sample to bind to the capture antibody on the plate if it is already bound by therapeutic antibody. A recent article highlighted some of the difficulties associated with bioanalytical analysis of free ligand in the presence of therapeutic antibody,6 but there are few, if any, reports in the literature that make mention of attempts to demonstrate that these assays are actually good representations of free ligand. Figure 1 illustrates common free and total ligand assay formats, and the formats used in the present study.
Figure 1. Schematic representations of the free (A) and total (B) ligand assays used in this study. The coating antibody (A1, black) in the free ligand assay binds to the same epitope as the therapeutic Fab. Thus, when samples containing ligand (yellow) and Fab (green) are added (A2), only free ligand should bind to the capture antibody, as long as there is no shifting of the equilibrium during analysis. The secondary antibody (A3, red) is a biotinylated anti-ligand antibody to allow detection. The total ligand assay (B) employs a capture antibody (B1, blue) that can bind the ligand in the presence of the anti-ligand Fab. When samples containing ligand (yellow) and Fab (green) are added (B2), both free and Fab-bound ligand can bind to the capture antibody. The biotinylated secondary antibody reagent (B3, red) can also bind in the presence of the Fab, thus allowing the detection of total (free and Fab-bound) ligand.
The objective of this study was to develop, optimize and probe the characteristics of an ELISA-based assay, similar in format to others previously reported, to measure free ligand levels in the presence of an anti-ligand therapeutic agent (in this case, a chimeric rat/mouse anti-ligand Fab). Optimal assay conditions were determined that minimized the potential for perturbation of antibody-ligand equilibria, and contamination of the free levels by total ligand. The results from the assay were compared with an alternative approach that removed Fab-ligand complexes prior to analysis of the ligand. The utility of the assay was demonstrated by measurement of free ligand levels in rat serum from an in vivo study with rats dosed with the anti-ligand Fab fragment.
Results
Assay range, accuracy and precision of free ligand assay
The precision and accuracy of quality control samples of ligand in the absence of anti-ligand Fab are shown in Table 1. The assay was determined to have adequate sensitivity for the intended use and had good precision and accuracy. The assay quantitation range applied to the experiments in this study was 0.22–16.2 pM.
Table 1. Precision and accuracy of free ligand assay in buffer, run over multiple days.
| pM | |||
|---|---|---|---|
| Controls | 11.5 | 5.9 | 0.73 |
| Experiment 1 | 11.6 | 5.8 | 0.68 |
| 11.3 | 6.4 | 0.70 | |
| Experiment 2 | 11.0 | 5.6 | 0.75 |
| 10.2 | 5.7 | 0.74 | |
| Experiment 3 | 11.8 | 5.7 | 0.76 |
| 11.1 | 6.3 | 0.81 | |
| mean | 11.2 | 5.9 | 0.74 |
| SD | 0.5 | 0.4 | 0.05 |
| %CV | 4.9 | 6.2 | 6.3 |
| % Theoretical | 97 | 101 | 101 |
Identification of optimal assay conditions
In vitro Fab/ligand spike samples were used to determine the optimal incubation time on the ELISA plate to minimize any potential for exchange between ligand bound to Fab in solution and the capture anti-ligand antibody on the plate. The Fab and ligand concentrations that were used for these experiments are shown in Table 2.
Table 2. In vitro Fab/ligand sample concentrations for assay optimization experiments.
| High concentration samples | Low concentration samples | |||
|---|---|---|---|---|
| Fab concentration (nM) | Ligand concentration (nM) | Fab concentration (nM) | Ligand concentration (nM) | |
| 500 | 10 | 0.3 | 0.012 | |
| 350 | 10 | 0.2 | 0.012 | |
| 200 | 10 | 0.1 | 0.012 | |
| 120 | 10 | 0.05 | 0.012 | |
| 80 | 10 | 0.025 | 0.012 | |
| 40 | 10 | 0.015 | 0.012 | |
| 20 | 10 | 0.010 | 0.012 | |
| 9.2 | 10 | 0.005 | 0.012 | |
In addition to determination of optimal on-plate incubation time, it was also necessary to establish that the in vitro Fab/ligand spike samples had reached binding equilibrium, prior to addition to the plate. Thus, a range of pre-incubation times (i.e., the amount of time the Fab and ligand spikes were incubated together prior to addition to the assay plate) were investigated to determine the amount of time necessary for the binding to reach equilibrium. It was necessary to investigate the optimal pre-incubation time and the optimal on-plate incubation time simultaneously due to the potential interaction between these two conditions on the assay result. The objective of optimizing the assay conditions is to minimize any artifactual measurement of free ligand in the assay. Either too short of a pre-incubation time (i.e., not allowing the binding to reach equilibrium) or too long of an on-plate incubation time (i.e., allowing time for re-distribution of ligand binding from Fab in solution to antibody on plate) would lead to the same result—artificially high levels of free ligand determined in the assay, which would lead to a higher Kd value determined from the fit of the data. Thus, as conditions are selected that lead to optimal on-plate incubation time, as well as optimal duration for pre-incubation of the spike samples, the Kd values should reach a plateau, indicating that binding equilibrium was reached and that no redistribution of the equilibrium is occurring on the plate.
Figure 2 exemplifies the free ligand data as measured in the assay over a range of on-plate incubation times. For the case shown in Figure 2, the samples were pre-incubated for 24 h prior to addition to plate. Similar data were obtained for each of the pre-incubation times. These data are not shown in raw ligand format, but, as will be described, the Kd values were determined from the fits of the data. Figure 2 highlights the re-distribution of binding that can occur when the samples are incubated on the plate for a long period of time. For both the low and the high concentration sets of spikes, higher free ligand levels are measured as the on-plate incubation time is increased. As expected, the effect is much more pronounced for the high concentration spikes compared with the low concentration spikes. For example, for the 24-h on-plate incubation of the high concentration spikes (Fig. 2B), all the samples were above the assay quantitation limit; data are shown as at the quantitation limit for visualization purposes in the plot.
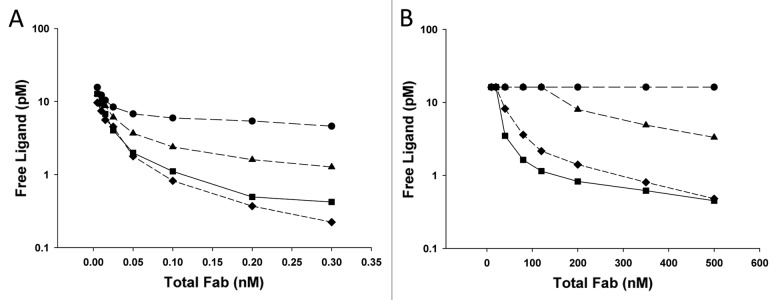
Figure 2. Free ligand levels as measured in the assay over a range of on-plate incubation times for (A) the low concentration Fab/ligand samples and (B) the high concentration Fab/ligand samples listed in Table 2. Samples were pre-incubated for 24 h prior to addition to plate. Samples were incubated on the plate for 10 min (squares), 1 h (diamonds), 6 h (triangles) or 24 h (circles). Samples above the quantitation limit of the assay are plotted at the quantitation limit for visualization purposes.
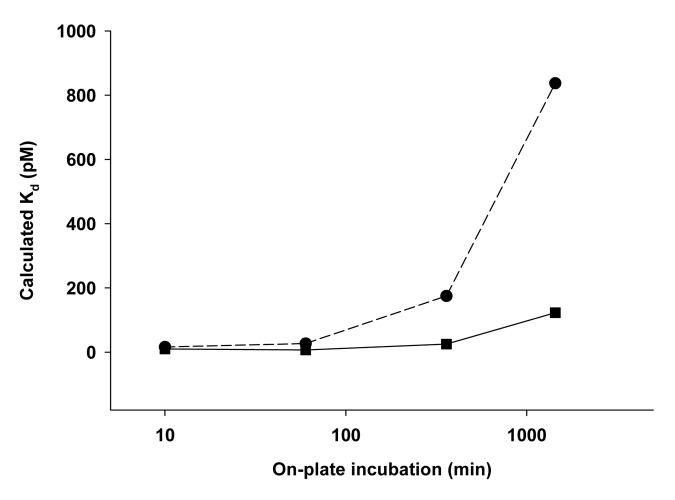
The Kd values obtained from fitting Equation 1 to the data in Figure 2 are shown in Figure 3. Because of the re-distribution of Fab-bound ligand in solution to the anti-ligand antibody on the plate, the assay over-reports the free ligand levels, which leads to a higher Kd value when the on-plate incubation time is too long. Figure 3 shows that for the low concentration sets of spikes, a plateau on the curve is reached at times less than 360 min on-plate. For the higher concentration sets of spikes, the plateau is not reached until on-plate incubation times of less than 60 min. For conciseness, only the Kd values are reported for the remaining sets of conditions (Fig. 4).
Figure 3. Kd values as a function of on-plate incubation time, obtained from fitting Equation 1 to the data in Figure 2 for the low concentration Fab/ligand samples (squares) and the high concentration Fab/ligand samples (circles). Higher Kd values suggest potential exchange from ligand bound to Fab in solution to the anti-ligand antibody on the plate, leading to an overestimation of the free ligand.
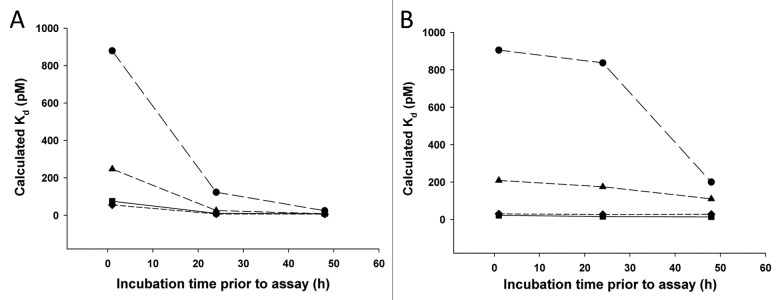
Figure 4. Kd values determined from all of the Fab/ligand concentration conditions and all of the pre-incubation and on-plate incubation times for the low concentration Fab/ligand samples (A) and the high concentration Fab/ligand samples (B). On-plate incubation times of 10 min (squares), 1 h (diamonds), 6 h (triangles) or 24 h (circles) are shown for the range of pre-incubation times for both sets of samples.
The Kd values determined from all of the Fab/ligand concentration conditions and all of the pre-incubation and on-plate incubation times are highlighted in Figure 4. Each curve on each plot is for a different on-plate incubation time; the x-axis shows the pre-incubation times. Thus, both the effect of longer pre-incubation time and longer on-plate incubation time for each set of spikes simultaneously are illustrated. For both the low and high concentration sets of spikes, the Kd values decrease with increased pre-incubation time, and decrease with shorter time on the plate. For both sets of concentration spikes, the Kd values appear to reach a plateau after 24-h pre-incubation time for the spikes and < 60 min on the plate. As expected based on the binding kinetics, the low concentration spikes appear to require a longer pre-incubation time to reach equilibrium, and the high concentration spikes undergo more exchange as they incubate on plate longer. The optimal set of conditions to suit the entire range of interest was determined to be a 24-h pre-incubation of the spikes and a 10 min on-plate incubation of the spikes.
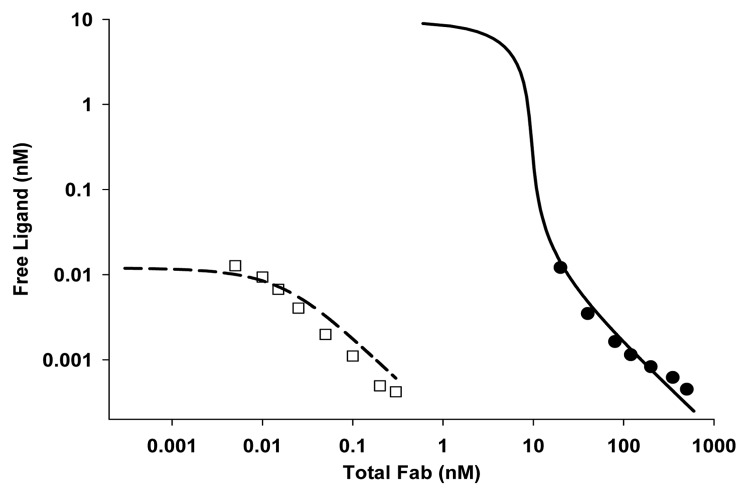
The fit of Equation 1 (see Materials and Methods) to both the low and high concentration spike data simultaneously is shown for the optimal assay conditions in Figure 5. A single parameter was adequate to characterize all of the free ligand data over many orders of magnitude of both Fab and ligand conditions. The Kd resulting from this simultaneous fit was ~15 pM.
Figure 5. The fit of Equation 1 to both the low (open squares) and high concentration (filled circles) spike data simultaneously for the optimal assay conditions. The model predictions are shown in lines (dashed for low concentration and solid for high concentration samples). A single fitted parameter was sufficient to characterize all of the data and the resulting Kd value was 15 pM.
Alternative approach to measuring free ligand
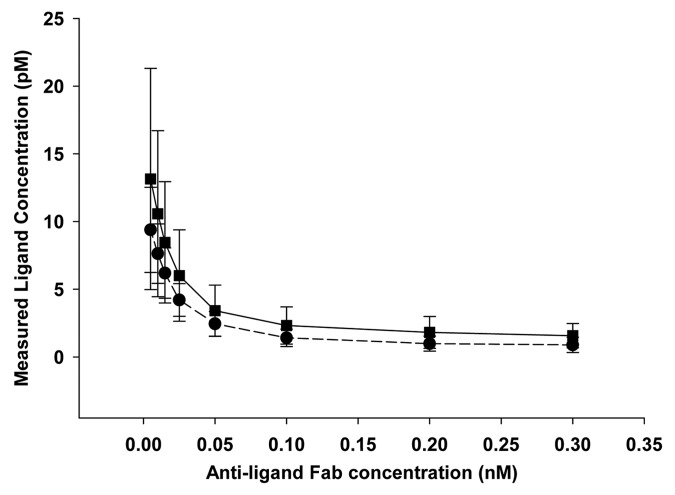
To provide further evidence that the free ligand ELISA was a good representation of free ligand, an alternative approach was developed that removed Fab-ligand complexes prior to analysis of ligand in a total ligand assay (i.e., the assay would detect both free ligand and Fab-bound ligand). Raw ligand levels from these experiments are shown in Figure 6, with accompanying parameter values shown in Table 3. Similar ligand levels were determined using the free ligand ELISA and by using the total ligand ELISA following removal of the complex. Additionally, Fab-ELISA analysis of complex-depleted samples also showed no measurable Fab levels (all levels were below 0.03 nM), providing further evidence that the complex removal step was adequate.
Figure 6. Ligand levels from complex-removal experiments as determined in the total ligand assay (squares) and the free ligand assay (circles). Symbols represent mean values and error bars the standard deviation of n = 4 experiments.
Table 3. Comparison of free ligand ELISA format with total ligand ELISA following removal of Fab-ligand complexes.
| Free assay | Complex removal | |
|---|---|---|
| Kd (pM) | 22 ± 10 | 32 ± 5 |
| Lt (pM) | 9 ± 2 | 11 ± 6 |
Equation 1 was fit to experimental results from both assays, with two parameters, Kd and total ligand (Lt), estimated. Values are mean ± SD of n = 4 experiments.
Application of the free ligand assay to an in vivo study
For practical considerations, the detailed investigation of optimal conditions for the free assay was conducted in buffer. Thus, for application to an in vivo study, the assay needed to be qualified in an appropriate matrix. We chose to use ligand-depleted rat serum as the ideal matrix for the rat PK/PD study. Rat serum was depleted of ligand, as described in Materials and Methods, and qualified under the optimal conditions established in buffer. The assay was quite well behaved in ligand-depleted serum, with a similar assay range as was established in buffer. Because of the very high sensitivity required of the assay for in vivo purposes, we chose to be more liberal in our acceptance criteria for the low QC sample, deeming a recovery within 35% to be acceptable. Table 4 shows the precision and accuracy data for the free assay in ligand-depleted rat serum.
Table 4. Precision and accuracy of free ligand assay in ligand-depleted rat serum.
| pM | ||||
|---|---|---|---|---|
| Controls | 11.5 | 5.9 | 0.73 | 0.37 |
| Sample 1 | 11.3 | 6.2 | 0.57 | 0.23 |
| Sample 2 | 10.4 | 5.4 | 0.64 | 0.21 |
| Sample 3 | 9.8 | 5.8 | 0.65 | 0.34 |
| Sample 4 | 9.9 | 5.9 | 0.69 | 0.22 |
| mean | 10.4 | 5.8 | 0.64 | 0.25 |
| SD | 0.7 | 0.4 | 0.05 | 0.06 |
| %CV | 6.8 | 6 | 8 | 23.3 |
| % Theoretical | 90 | 99 | 87 | 68 |
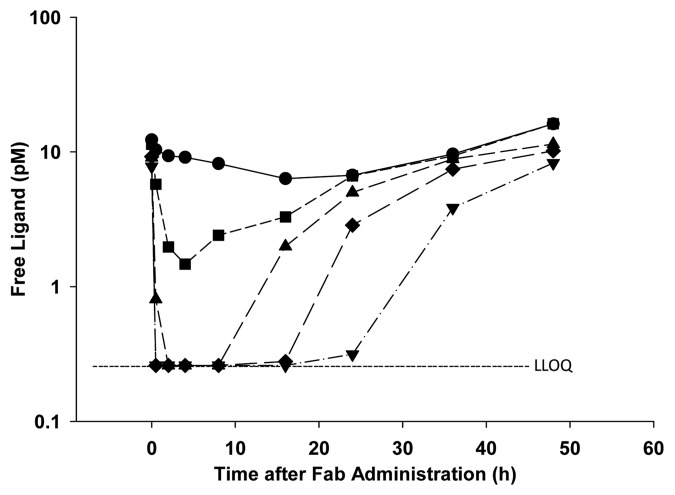
The free ligand ELISA was used to characterize endogenous ligand levels in rats following administration of the anti-ligand Fab by subcutaneous administration at dose levels up to 1 mg/kg Fab. Figure 7 shows the ligand concentration-time profiles over 2 d post-administration. Ligand levels show the expected initial rapid dose-dependent decrease, followed by the gradual return toward baseline levels over time, and suggest that the assay has the expected utility in vivo.
Figure 7. Free ligand concentration-time profiles following subcutaneous administration of anti-ligand Fab to Sprague-Dawley rats at doses of 0 (circles), 0.03 (squares), 0.1 (triangles), 0.3 (diamonds) or 1 (inverted triangles) mg/kg. Samples were pooled across a group of 6 rats at each time point prior to analysis. Samples below the lower limit of quantitation (LLOQ) are plotted at the limit of quantitation for visualization purposes.
Discussion
Although a number of reports have used assays to measure free ligand in the presence of anti-ligand antibody,7-16 there are well-recognized potential issues with these assays4,6 that should be explored to provide confidence that the conditions selected will provide a reliable assessment of unbound ligand. To our knowledge, there is a lack of experimental data to address some of the fundamental problems that may arise with free ligand assays. This work seeks to address some of those issues.
Assay range is one of the fundamental considerations for any bioanalytical assay, but there are particular issues specific to free ligand ELISAs. Special consideration should be given to both the high and low ends of the assay range. Dilution of study samples will be problematic when attempting to measure free ligand in the presence of anti-ligand antibody, as dilution will shift the equilibrium between ligand that is bound to the anti-ligand antibody and the free ligand in the solution. Because of this complication, it is desirable for the high end of the assay range to exceed the highest levels of free ligand one would expect to see in vivo. In the absence of anti-ligand antibody-induced stimulation of endogenous ligand production, the highest levels of free ligand should be those found at baseline in the absence of anti-ligand treatment. Thus, endogenous levels of ligand are a good guide for the high end of the assay range.
The low end of the assay range can present particular challenges, as many endogenous ligands of therapeutic interest are present at very low levels, even in the absence of anti-ligand antibody. Ideally, the low end of the free assay range would allow characterization of a broad range of free ligand levels following treatment with anti-ligand antibodies. For quantitative PK/PD purposes, the ability to quantify decreases of > 90% is desirable.
The most important issue with the free ligand assay format discussed herein, or with any other free ligand format, is the potential for the free ligand measurement to be contaminated by the bound ligand present in the sample. Following anti-ligand antibody treatment in vivo, total ligand levels often increase dramatically, while free ligand levels decrease dramatically. This creates a situation where total ligand levels can be many orders of magnitude higher than free ligand levels. Due to this difference in absolute ligand levels, even a very small degree of contamination (e.g., cross-reactivity, re-distribution of the equilibrium due to competition between the antibody on the assay plate and the antibody in solution) can lead to major inaccuracies in the free ligand levels determined in a free assay. Further, it is difficult, if not impossible to truly validate that the measurement is a true reflection of free ligand because these experiments have to be done in the presence of anti-ligand antibody, and no method is entirely free from similar considerations as discussed.
In the present work, we explored different approaches to provide convincing evidence that the free ligand assay we developed was a good representation of actual free levels and was not influenced by “contamination” from total ligand levels. We first examined the potential for re-distribution of the equilibrium by allowing anti-ligand Fab/ligand mixtures to incubate on the assay plate for up to 24 h. These experiments clearly demonstrated that the longer the samples were allowed to remain on the plate, the higher the signal became, leading to over-reporting of free ligand levels. As the incubation times became shorter, a plateau was reached in the free ligand levels reported by the assay, suggesting the degree of exchange had been minimized.
Another approach to qualifying the free levels involved comparing the free assay results to a total ligand assay that was used after physically removing the Fab-ligand complexes from the solutions. This type of approach is not well-suited for application to actual in vivo studies because the levels of Fab-ligand complex that would need to be removed present substantial methodological issues, and, as discussed previously, a small degree of contamination will greatly affect the free ligand results. As a tool to probe the validity of the free ligand ELISA results, however, we found that we could do incubations with low Fab/ligand spike concentrations and quantitatively remove the Fab-ligand complexes such that we could compare the free ligand results between a method that used physical removal of bound ligand and the free ligand ELISA.
One additional complicating factor arose as this latter approach was explored. Due to the kinetics of antibody-ligand binding, the amount of time to reach equilibrium is dependent upon the starting concentrations of antibody and ligand in the solution. As concentrations become smaller, the time to reach equilibrium for the antibody/ligand solutions becomes longer. Thus, if the Fab/ligand spikes are analyzed for free ligand levels before the reaction has reached equilibrium, the assay will report higher free ligand levels than would be found had the assay reached equilibrium. To further complicate this problem, the assay results will be indistinguishable from the case where there is re-distribution of the equilibrium from the ligand that is bound to the Fab in solution to the antibody that is on the assay plate. Unless the pre-incubation time for Fab-ligand to reach equilibrium and the incubation time on the plate were explored simultaneously, we could not be sure we had reached a true plateau value in the free assay. These experiments were thus performed over a very broad range of Fab/ligand concentrations and over broad ranges of pre-incubation and on-plate incubation times to identify the conditions that were ideal for all situations. Once the ideal conditions were identified, a Kd value was calculated from a simultaneous fit of all of the free ligand data across the broad range of conditions. Remarkably, a single parameter (Kd) was sufficient to fit the entire data set that encompassed ~5 orders of magnitude of Fab conditions and ~4 orders of magnitude of ligand conditions, with very good predictions of the observed free ligand levels (Fig. 5). Had the assay conditions not provided an accurate assessment of free ligand, it is unlikely that the simple binding equation would predict such a wide range of conditions so well. Additionally, with the low concentration conditions in place, the complex removal experiment was performed and the two assays provided very similar results (Fig. 6).
A final assessment of the assay was performed by testing whether free ligand levels determined in vivo following dosing of the anti-ligand Fab to rats would yield the expected free ligand profile. After qualifying the assay in ligand-depleted rat serum, the in vivo study was performed and showed the expected suppression of free ligand. While this experiment does not provide conclusive evidence on its own that there is no contamination from total ligand, when combined with the previous in vitro explorations, the data in total provide good support that the ELISA is providing a reliable measure of free ligand levels.
Additional aspects of free ligand assay development that are beyond the scope of the work presented here deserve some mention, and are worthy of additional study. These include determination of the ideal matrix for the assay, assessing the comparability of the standard to the actual circulating endogenous ligand, consideration of the relative affinity of the capture antibody and the therapeutic antibody to the ligand, and considering the potential effects of sample processing on the ligand–antibody interaction. These issues are not necessarily unique to free ligand assays and may be applicable to total endogenous ligand assays as well.
In this work, optimal assay conditions were determined for a free ligand assay in the presence of anti-ligand Fab. For this particular combination, optimal pre-incubation time for Fab/ligand spikes was determined to be 24 h, and optimal on-plate incubation time for the samples was determined to be 10 min. The assay was qualified as being a good representation of free ligand by comparison with an alternate assay approach, a total ligand assay after removal of the Fab–ligand complex. Due to practical considerations related to generation of large quantities of ligand-depleted serum, the optimal assay conditions were first determined in buffer, and then limited qualification based on optimal assay conditions was conducted in ligand-depleted serum to support an in vivo PK/PD study. The assay was shown to be useful for in vivo measurement of free ligand after subcutaneous dosing of anti-ligand Fab to rats. In developing free ligand ELISAs, careful consideration should be given to demonstrating that the assay conditions eliminate contamination from total ligand levels. As presented in this work, we recommend that this be done by exploring wide ranges of in vitro anti-ligand antibody:ligand concentration and incubation time conditions to minimize re-distribution of antibody-ligand equilibria and by comparing results to those from alternate experimental formats.
Materials and Methods
Assay format and establishment of range
The optimal assay range for the ligand was first established in the absence of anti-ligand Fab. The capture antibody was a monoclonal antibody (prepared in-house) that bound the same epitope on the ligand as the Fab. One hundred microliters of capture antibody (5 µg/mL), diluted in carbonate-bicarbonate buffer (Thermo Scientific, 28382), was added to each well of an Immulon 4 HBX (Dynex, 3855) microplate and incubated overnight at 4°C. Plates were washed four times with wash buffer (300 µL/well, Sigma, TBS-T #T-9039), blocked with 200 µl/well phosphate-buffered saline (PBS)-casein (Thermo Scientific, 37528) and then washed again. Ligand (in-house preparation) was diluted in PBS-casein, added to the plate and incubated for 10 min at room temperature. The plates were washed again and secondary antibody (R&D Systems) was added at a 1 µg/mL concentration and allowed to incubate for ~1 h at room temperature. The secondary antibody was a biotinylated anti-ligand antibody to a different epitope on the ligand than the capture antibody. Streptavidin-horseradish peroxidase (HRP, Jackson Immunoresearch, 016-030-084) was added and incubated for ~1 h at room temperature, and after washing, OPD substrate (Sigma, P9187) was used for color development and plates were read at A493 with reference at A700. A fixed weighted five parameter logistic curve was fit to the standard curve data, implemented with StatLia Software (Brendan Technologies version 3.2) and was used to determine concentrations in controls and samples.
Use of in vitro Fab/ligand samples to identify optimal assay conditions
Optimization of incubation conditions for Fab-ligand samples
In vitro Fab/ligand samples were used to test the ability of the assay to measure free ligand. Concentrations of Fab and ligand were selected based on the assay range and the expected Kd of the interaction. Experiments were conducted to determine the amount of time needed for the Fab/ligand spike samples to reach equilibrium binding. Pre-incubation of the in vitro spikes occurred for 1–48 h prior to addition to the assay plate.
Optimization of incubation time of sample on ELISA plate
Experiments were conducted to determine how long the samples could incubate on the plate without perturbation of the equilibrium and exchange of ligand bound to Fab in solution to antibody on the plate. On-plate incubations were allowed to occur for 10 min–24 h.
Mathematical analysis of assay results to determine Kd values
From the free ligand measurements with the in vitro Fab/ligand spikes, Kd values were calculated for each set of conditions using nonlinear least squares regression analysis (WinNonlin v5.3) and the following equation derived from Fab-ligand binding equilibria principles:
| (1) |
Lf refers to free ligand concentration (measured), Lt refers to total ligand (the known concentration added), Fabt refers to total Fab concentration (the known concentrations added), Kd refers to the apparent equilibrium dissociation constant (or apparent binding affinity) for the Fab-ligand interaction (estimated parameter based on free ligand vs. total Fab data).
Alternative assay for measuring free ligand
An alternative approach to measurement of free ligand was developed to confirm that the assay format discussed above provided a good representation of free ligand. Fab-ligand complexes were first removed from the solution and then the remaining ligand was assayed in a total ligand assay. As before, in vitro Fab/ligand samples were set up over a range of Fab:ligand ratios. After allowing binding to reach equilibrium, the Fab-ligand complexes were removed using magnetic beads labeled with antibodies against rat IgG and samples were analyzed in a total ligand assay that would detect both free and Fab-bound ligand. Samples were also analyzed in the free ligand assay to allow direct comparison of the two approaches. Additionally, a standard ELISA approach was used to assay the treated samples to demonstrate that no Fab remained after removal of the complexes.
Coupling of goat anti-rat IgG to magnetic beads
One mL tosyl-activated magnetic beads (Dynabeads, Invitrogen, 142-04) were transferred into a 1.5 mL eppendorf vial, placed on a magnet and the supernatant removed. Beads were then washed with 0.1 M borate buffer twice for 1 min. Goat anti-rat IgG (Southern Biotech, 3050-01) was prepared in 0.11 M borate buffer to yield a 1 mg/mL antibody solution. 0.6 mL goat anti-rat IgG solution was added into the washed beads along with 0.4 mL of 3 M ammonium sulfate. The mixture was incubated overnight at 37°C. The beads were then placed on the magnet and the supernatant was carefully discarded. Beads were washed twice with 1 mL PBS (pH7.4). 0.5% BSA in PBS was added to beads and incubated 1 h at 37°C. Supernatant was discarded and beads were washed twice with PBS and re-suspended in 0.1% BSA in PBS and stored at 4°C.
Removal of Fab-ligand complexes and analysis in total ligand assay
Goat anti-rat IgG-coupled magnetic beads (100 µL/sample) were added to the low concentration in vitro Fab/ligand samples (Table 2) and allowed to incubate for ~1 h on a rotator, at room temperature. Samples were then set on a magnet and the supernatant was collected for analysis. Supernatant (100 µL/well) was added to Immulon 4 microtiter plates that had been coated overnight at 4°C with polyclonal goat anti-ligand antibody (R&D Systems) and blocked with PBS Casein. Samples were incubated for ~1 h at room temperature. Plates were washed and 1 µg/mL (100 µL/well) polyclonal biotinylated goat anti-ligand antibody (R&D Systems) was added and allowed to incubate for ~1 h at room temperature. Plates were washed and streptavidin-HRP, at 1:2000 dilution, was added and allowed to incubate for ~1 h at room temperature. Plates were washed and then visualized using o-phenylenediamine (OPD) substrate (Sigma P9187).
ELISA for Fab
Supernatant from the incubation of samples with the anti-rat IgG-coated magnetic beads were also assayed in a Fab assay as an additional means to show that the complexes were indeed removed from the solution. For this assay, 96-well Immulon 4 microtiter plates were coated with 5 µg/mL goat anti-rat IgG (Southern Biotech, 3050-01), diluted in PBS, for at least 1.5 h at 37°C. Plates were washed and blocked with 200 µL/well PBS-casein for at least 30 min. After washing, 100 µL/well of supernatant was added and incubated ~1 h at room temperature. Plates were washed and 100 µL/well goat anti-mouse IgGk HRP (Southern Biotech, 1050-05), diluted 1:1000, was added and incubated ~1 h at room temperature. OPD substrate was used for visualization.
Rat study to demonstrate assay utility
The free ligand ELISA format described above was qualified in ligand-stripped rat serum and used to measure the in vivo effects of the Fab on free ligand levels. To prepare the matrix, ligand was stripped from serum by incubating the serum on Immulon 4 HBX (Dynex, 3855) microplates coated with polyclonal anti-ligand antibody (R&D Systems) followed by plates coated with the capture antibody from the free ligand ELISA (i.e., two incubations in series to remove the ligand). Precision and accuracy of quality control samples over the range of interest were then determined in matrix. After showing suitability of the assay in ligand-depleted matrix, rats were administered a single subcutaneous dose of 0.03–1 mg/kg Fab and free ligand levels were determined over the course of 48 h post-dosing.
Acknowledgments
The authors thank Patrick Grealish for generating and providing the anti-ligand Fab and Ryan Darling and Stuart Kuhstoss for providing the in-house generated assay reagents.
Disclosure of Potential Conflicts of Interest
No potential conflicts of interest were disclosed.
Footnotes
Previously published online: www.landesbioscience.com/journals/mabs/article/23508
References
- 1.Lobo ED, Hansen RJ, Balthasar JP. Antibody pharmacokinetics and pharmacodynamics. J Pharm Sci. 2004;93:2645–68. doi: 10.1002/jps.20178. [DOI] [PubMed] [Google Scholar]
- 2.Wang W, Wang EQ, Balthasar JP. Monoclonal antibody pharmacokinetics and pharmacodynamics. Clin Pharmacol Ther. 2008;84:548–58. doi: 10.1038/clpt.2008.170. [DOI] [PubMed] [Google Scholar]
- 3.Yu J, Karcher H, Feire AL, Lowe PJ. From target selection to the minimum acceptable biological effect level for human study: use of mechanism-based PK/PD modeling to design safe and efficacious biologics. AAPS J. 2011;13:169–78. doi: 10.1208/s12248-011-9256-y. [DOI] [PMC free article] [PubMed] [Google Scholar]
- 4.Davda JP, Hansen RJ. Properties of a general PK/PD model of antibody-ligand interactions for therapeutic antibodies that bind to soluble endogenous targets. MAbs. 2010;2:576–88. doi: 10.4161/mabs.2.5.12833. [DOI] [PMC free article] [PubMed] [Google Scholar]
- 5.Deng R, Jin F, Prabhu S, Iyer S. Monoclonal antibodies: what are the pharmacokinetic and pharmacodynamic considerations for drug development? Expert Opin Drug Metab Toxicol. 2012;8:141–60. doi: 10.1517/17425255.2012.643868. [DOI] [PubMed] [Google Scholar]
- 6.Lee JW, Kelley M, King LE, Yang J, Salimi-Moosavi H, Tang MT, et al. Bioanalytical approaches to quantify “total” and “free” therapeutic antibodies and their targets: technical challenges and PK/PD applications over the course of drug development. AAPS J. 2011;13:99–110. doi: 10.1208/s12248-011-9251-3. [DOI] [PMC free article] [PubMed] [Google Scholar]
- 7.Adelroth E, Rak S, Haahtela T, Aasand G, Rosenhall L, Zetterstrom O, et al. Recombinant humanized mAb-E25, an anti-IgE mAb, in birch pollen-induced seasonal allergic rhinitis. J Allergy Clin Immunol. 2000;106:253–9. doi: 10.1067/mai.2000.108310. [DOI] [PubMed] [Google Scholar]
- 8.Casale TB, Bernstein IL, Busse WW, LaForce CF, Tinkelman DG, Stoltz RR, et al. Use of an anti-IgE humanized monoclonal antibody in ragweed-induced allergic rhinitis. J Allergy Clin Immunol. 1997;100:110–21. doi: 10.1016/S0091-6749(97)70202-1. [DOI] [PubMed] [Google Scholar]
- 9.Hayashi N, Tsukamoto Y, Sallas WM, Lowe PJ. A mechanism-based binding model for the population pharmacokinetics and pharmacodynamics of omalizumab. Br J Clin Pharmacol. 2007;63:548–61. doi: 10.1111/j.1365-2125.2006.02803.x. [DOI] [PMC free article] [PubMed] [Google Scholar]
- 10.Lowe PJ, Tannenbaum S, Gautier A, Jimenez P. Relationship between omalizumab pharmacokinetics, IgE pharmacodynamics and symptoms in patients with severe persistent allergic (IgE-mediated) asthma. Br J Clin Pharmacol. 2009;68:61–76. doi: 10.1111/j.1365-2125.2009.03401.x. [DOI] [PMC free article] [PubMed] [Google Scholar]
- 11.Lowe PJ, Tannenbaum S, Wu K, Lloyd P, Sims J. On setting the first dose in man: quantitating biotherapeutic drug-target binding through pharmacokinetic and pharmacodynamic models. Basic Clin Pharmacol Toxicol. 2010;106:195–209. doi: 10.1111/j.1742-7843.2009.00513.x. [DOI] [PubMed] [Google Scholar]
- 12.Putnam WS, Li J, Haggstrom J, Ng C, Kadkhodayan-Fischer S, Cheu M, et al. Use of quantitative pharmacology in the development of HAE1, a high-affinity anti-IgE monoclonal antibody. AAPS J. 2008;10:425–30. doi: 10.1208/s12248-008-9045-4. [DOI] [PMC free article] [PubMed] [Google Scholar]
- 13.Betts AM, Clark TH, Yang J, Treadway JL, Li M, Giovanelli MA, et al. The application of target information and preclinical pharmacokinetic/pharmacodynamic modeling in predicting clinical doses of a Dickkopf-1 antibody for osteoporosis. J Pharmacol Exp Ther. 2010;333:2–13. doi: 10.1124/jpet.109.164129. [DOI] [PubMed] [Google Scholar]
- 14.Chan JC, Piper DE, Cao Q, Liu D, King C, Wang W, et al. A proprotein convertase subtilisin/kexin type 9 neutralizing antibody reduces serum cholesterol in mice and nonhuman primates. Proc Natl Acad Sci U S A. 2009;106:9820–5. doi: 10.1073/pnas.0903849106. [DOI] [PMC free article] [PubMed] [Google Scholar]
- 15.Ni YG, Di Marco S, Condra JH, Peterson LB, Wang W, Wang F, et al. A PCSK9-binding antibody that structurally mimics the EGF(A) domain of LDL-receptor reduces LDL cholesterol in vivo. J Lipid Res. 2011;52:78–86. doi: 10.1194/jlr.M011445. [DOI] [PMC free article] [PubMed] [Google Scholar]
- 16.Beer PM, Wong SJ, Hammad AM, Falk NS, O’Malley MR, Khan S. Vitreous levels of unbound bevacizumab and unbound vascular endothelial growth factor in two patients. Retina. 2006;26:871–6. doi: 10.1097/01.iae.0000233327.68433.02. [DOI] [PubMed] [Google Scholar]


