

SUMMARY
Spontaneous fMRI fluctuations are organized in large-scale spatiotemporal structures, or resting-state networks (RSN). However, it is unknown how task performance affects RSN dynamics. We use MEG to measure slow (~0.1 Hz) coherent fluctuations of band-limited power (BLP), a robust correlate of RSN, during rest and movie observation and compare them to fMRI-RSN. BLP correlation, especially in α band, dropped in multiple RSN during movie although overall topography was maintained. Variability of power correlation increased in visual occipital cortex, and transient decrements corresponded to scenes perceived as “event boundaries.” Additionally, stronger task-dependent interactions developed between vision and language networks in θ and β bands, and default and language networks in γ band. The topography of fMRI connectivity and relative changes induced by the movie were well matched to MEG. We conclude that resting-state and task network interactions are clearly different in the frequency domain despite maintenance of underlying network topography.
INTRODUCTION
Recent work in human functional neuroimaging has introduced an interesting paradox in brain-behavior relationships. It is traditionally believed that cognitive functions depend on the recruitment of distributed task specific networks of brain regions (Goldman-Rakic, 1988; Mesulam, 1990). However, in the last two decades, it has become apparent that networks of brain regions maintain even at rest, in the absence of any stimulus, responses, or task, a high degree of temporal correlation (Biswal et al., 1995; Deco and Corbetta, 2011; Fox and Raichle, 2007). Interestingly, the topography of these resting-state networks (RSN) closely resembles that of functional systems identified during task performance (Biswal et al., 1995; Greicius et al., 2003; Smith et al., 2009). The whole cerebral cortex in fact can be divided into a finite number of RSN that maintain relatively stable level of correlation, both within and across networks, along putative axes of functional organization (Doucet et al., 2011; Hacker et al., 2013; Lee et al., 2012; Yeo et al., 2011).
A fundamental issue is then to understand how the organization of the resting brain into a finite number of topographically distinct networks is modified both spatially and temporally during task performance to support the high dimensionality and flexibility of behavior.
Recent advances in MEG data analysis have allowed to recover RSN by mapping the interregional temporal correlation of band limited power (BLP) fluctuations, especially in α and β bands (Brookes et al., 2011a, 2011b; de Pasquale et al., 2010, 2012; Hipp et al., 2012; Liu et al., 2010). As the BLP essentially reflects the slower envelope of signal fluctuations within a given frequency range, it is well suited for comparison with fMRI (de Pasquale et al., 2010; Leopold et al., 2003).
Here, we examine whether the topography, strength, frequency content, and dynamics of BLP correlation is modified during natural vision (watching a movie) as compared to rest (fixation), and how these modulations relate to fMRI blood oxygen level-dependent (BOLD) signal connectivity changes. Natural vision stimulation is a relatively unconstrained paradigm, which has been, however, extensively adopted to study the functional organization of visual systems in both human and non-human primates (Bartels and Zeki, 2005; Golland et al., 2007; Hasson et al., 2004; Mantini et al., 2012, 2013; Nir et al., 2006; Nishimoto et al., 2011).
We test two “boundaries” hypotheses about the relationship between rest and task states. The first hypothesis is that RSN represents a state of “idling” (or inactivity) of the system that dynamically reorganizes to support task performance (Nir et al., 2006; Smith and Kohn, 2008). This hypothesis predicts a disruption of the spatial correlation and frequency structure of spontaneous activity during the movie, both within and between RSN. Reduction of noise correlation may represent a candidate physiological mechanism underlying such modulation (Nauhaus et al., 2009, 2012; Smith and Kohn, 2008). This hypothesis also predicts the formation of specific novel task networks, i.e., not present at rest, with specific topography and frequency content.
The second hypothesis is that RSN are priors for task networks, and are predictive of task-evoked activity and performance (Raichle, 2011). This idea is based on the noted similarity of RSN topography and task networks (Biswal et al., 1995; Greicius et al., 2003; Smith et al., 2009) and the resilience of RSN across behavioral states and levels of consciousness (Arfanakis et al., 2000; Fransson, 2006; Greicius et al., 2008; Greicius and Menon, 2004; Larson-Prior et al., 2009; Morgan and Price, 2004; Vincent et al., 2007). It is also supported by the observation that intrinsic BOLD fMRI fluctuations account for variability in task-evoked activity (Fox et al., 2006) and associated behavioral performance (Fox et al., 2007). In the context of MEG BLP-correlation, this second hypothesis predicts maintenance of within/between RSN topography during natural vision, and an increase of interaction between RSN as they go from a state of relative segregation at rest to a state of greater integration during task.
We focus on networks (visual, dorsal attention, auditory, language) that have been modulated in fMRI during the observation of natural scenes (Golland et al., 2007; Hasson et al., 2004; Nir et al., 2006), and the default mode network (Raichle et al., 2001; Shulman et al., 1997) that is active at rest but suppressed during task performance.
RESULTS
Total Interdependence within and across Networks
We recorded MEG signals in a group of twelve participants, each performing three different experimental blocks (runs) both during visual fixation (fixation) and the observation of three movie segments (about 5 min each) taken from the Italian version of The Good, the Bad and the Ugly (movie). In a separate recording session, each participant underwent fMRI during fixation and movie conditions (Figure 1).
Figure 1. Schematic Representation of the Experimental Paradigm for the MEG and fMRI Recording Sessions.

In separate sessions, MEG and fMRI recordings were acquired on the same participants during three blocks of visual fixation (fixation) and three movie segments taken from The Good, the Bad and the Ugly (movie). The order of MEG and fMRI recording sessions was counterbalanced across participants, while the order of the experimental conditions (fixation and movie) was fixed across subjects. See also Figure S1.
The MEG data analysis pipeline is the same as in de Pasquale et al. (2010, 2012) and Mantini et al. (2011) and returns estimates of band limited power (BLP) from the source-space signals for delta (δ), theta (θ), alpha (α), beta (β), gamma (γ) band (see Supplemental Information and Figure S1 available online).
To evaluate the modulation produced by movie watching on BLP interaction with respect to fixation, in sensory and attention networks, we computed the total interdependence function from BLP, a global measure of interaction at different frequencies, obtained from all the possible pairs of the principal nodes of each RSN (visual, auditory, and dorsal attention networks) (Experimental Procedures and Supplemental Information). The nodes of each RSN were defined a priori from an independent set based on meta-analyses of task fMRI studies (Baldassarre et al., 2012; He et al., 2007; Lewis et al., 2009; Table S1).
In both α and β bands, the within-network inter-nodal BLP interaction was stronger at lower (<2 Hz) than higher frequencies, with a moderate peak at about 0.1 Hz during fixation in agreement with previous MEG studies (Brookes et al., 2011b; de Pasquale et al., 2010, 2012; Hipp et al., 2012; Figure 2A). Movie watching decreased the total interdependence compared to fixation, at frequencies below 0.3 Hz in each RSN (Figure 2A, dotted lines; Supplemental Information). To quantify this observation, we compared values of interdependence between fixation and movie at frequencies < 0.3 Hz for different BLP frequencies (δ, θ, α, β, γ) and different RSN. Repeated-measures ANOVAs with network (visual, auditory, dorsal attention) and condition (fixation and movie) as main factors showed a significant reduction of the total interdependence in movie as compared to fixation. This reduction was significant in α BLP (main effect condition (F1,33 = 14.19, p < 0.001, pη2 = 0.30)), in β BLP (main effect condition (F1,33 = 5.21, p = 0.04, pη2 = 0.12)) (Figure 2B) while it did not reach significance in δ (F1,33 = 3.45, p = 0.07), θ (F1,33 = 1.24, p = 0.27) and γ BLP (F1,33 = 1.24, p = 0.30) (Figure S2). The decrement in total interdependence was consistent across different RSN (interaction network × Condition, both for α and β band [all p values > 0.05]).
Figure 2. Reduction of Total Interdependence during Movie Watching for the Within-Network Interaction.
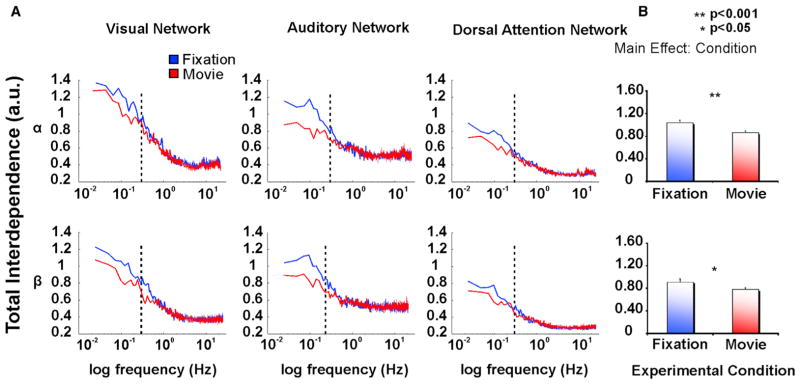
(A) Total Interdependence on a semilog scale in the α and β BLP for the visual (left column), auditory (middle column), and dorsal attention (right column) Network obtained from nodes of each network and averaged over runs, separately for fixation (blue line) and movie (red line). In both α and β bands, the internodal within-network interdependence is stronger at lower (<0.3 Hz, dotted lines) than higher frequency bands, with a maximum peak at about 0.1 Hz during fixation. Movie watching decreases the internodal interaction in each network.
(B) The statistically significant reduction of the total interdependence during movie among nodes within each network with respect to fixation, as revealed by the significant effect condition. Error bars indicate ± SEM.
Next, we considered modulation of total interdependence estimated across-RSN nodes, as opposed to within-RSN as in the previous analysis. Again, there was a significant reduction during movie with respect to fixation in α BLP (main effect condition (F1,33 = 5.66, p = 0.02, pη2 = 0.15)). Importantly, this effect was consistent across networks (interaction network × condition, p > 0.05). No significant modulation was detected in the other frequency bands (all p values > 0.05) (Figure S3).
Overall, in agreement with previous MEG reports (Brookes et al., 2011b; de Pasquale et al., 2010, 2012; Hipp et al., 2012), functional coupling between nodes of RSN was characterized by slow fluctuations of BLP at about 0.1 Hz. Watching a movie leads to an overall decrement of inter-nodal interaction at frequencies < 0.3 Hz, mainly in the α BLP, both within and across networks. Hence, visual stimulation seems to promote a reduction of functional connectivity as captured by α (and β for within-RSN) BLP interactions.
Whole-Brain MEG RSN Topography
Next, we considered whole-brain changes in the topography and strength of BLP correlation induced by movie watching. To map voxelwise modulation, BLP correlation maps were computed between a RSN node and the rest of the brain assuming the stationarity of BLP correlation (de Pasquale et al., 2010), using the Pearson product moment formula (Experimental Procedures). Individual node Z score correlation maps were averaged across runs and subjects to compute group-level maps in each condition (fixation, movie). To minimize the effect of field spread, difference maps between conditions were computed and then averaged across RSN nodes to yield voxel-wise BLP difference correlation maps between movie and fixation (Supplemental Information for details).
Figure 3A shows α BLP correlation changes from fixation to movie obtained by averaging all nodes in the visual network. Note the widespread decrement of correlation broadly across occipital visual cortex, bilaterally, extending into posterior parietal cortex (dorsal attention network) and temporal cortex (auditory network), especially in the right hemisphere. This pattern was similar across different nodes of the visual network as shown by a conjunction map that displays voxels with significant correlation across multiple node (Z score equal or greater than 4, p < 0.001 in each node). The map displays at least 6 of 10 nodes (more than half nodes of the visual RSN), which show significant temporal correlations (Figure 3B and Supplemental Information).
Figure 3. Topographic Changes of Stationary MEG Connectivity in the α BLP Induced by Movie Watching, in the Visual Network.

(A) Voxel-wise map showing the difference between movie and fixation obtained using different seed regions of the visual network averaged across runs and seeds, in the α BLP. Color scale reflects positive or negative modulations of Z score obtained from difference of correlation coefficients.
(B) Consistency maps across different nodes of the visual network. Regions in yellow-orange and in green-blue show consistent changes in correlation (positive or negative, respectively) across multiple nodes of the visual network. The map displays at least 6 of 10 nodes (more than half nodes), which show significant temporal correlations (Z score equal or greater than 4, p < 0.001 in each node). Color scale represents number of nodes with significant correlation at that voxel.
Topographically broad and consistent decreases in α BLP correlation were also observed by averaging nodes of the auditory or dorsal attention networks (Figures 4A and 4B). Seeding auditory regions (middle panel) yielded consistent decrements of BLP correlation in dorsal parietal and occipital cortex. Seeding dorsal attention regions (right panel) produced strong decrements in both auditory and visual regions. These functional connectivity changes were consistent across individual nodes (Figure 4B). Finally, we observed widespread decrements of α BLP correlation extending into the posterior parietal cortex (dorsal attention network) and temporal cortex (auditory network), especially on the right hemisphere (Figure S4A), when seeding nodes of the default mode network (Figure S4B).
Figure 4. Widespread Decrease of Stationary MEG Interregional Correlation Induced by Movie Watching across Different RSN.

(A) Voxel-wise maps as in Figure 3 showing widespread modulations of functional connectivity elicited by movie watching across different RSN relative to fixation, for the visual network (left column), auditory network (in the middle), and the dorsal attention network (right column), in the α BLP.
(B) Consistency maps across different nodes of the visual, dorsal attention, and auditory networks. Regions in yellow-orange and in green-blue show consistent changes in correlation (positive or negative, respectively) across multiple nodes in each RSN. The map displays more than half nodes (at least 6 of 10 nodes for the visual network; at least 3 of 4 nodes for the auditory network; at least 5 of 8 nodes for the dorsal attention network), which shows significant temporal correlations (Z score equal or greater than 4, p < 0.001 in each node). Color scale represents number of nodes with significant correlation at that voxel.
In contrast, α BLP correlation increased during movie, as compared to fixation, between visual occipital nodes and prefrontal (lateral, medial) and premotor regions in the left hemisphere (Figures 3A and 4A, left panel). This modulation was robust and consistent across multiple visual nodes (Figures 3B and 4B).
In summary, viewing complex visual scenes broadly reduces α BLP correlation both within and across networks, but also leads to the emergence of more focal increases of BLP correlation between visual occipital and left frontal cortex.
Regional Pairwise BLP Correlation within and across Networks
While the interdependence function provides a global measure of interaction, and voxel-wise maps provide information on changes in topography, we turned to regional analyses to quantify within- and between-networks pair-wise modulation of BLP correlation in visual, auditory, dorsal attention, language, and default-mode RSN. Nodes for the language network were not based on the maps in Figure 3 to avoid biases in node selection, but on independently defined fMRI nodes as in (de Pasquale et al., 2012). Similarly, nodes for the default mode were selected based from the fMRI literature as in (de Pasquale et al., 2010, 2012; Table S1). The default mode is an interesting case in study because its regions are thought to maintain high level of activity at rest that is suppressed during visual tasks. Hence, one might expect the pattern of connectivity modulation to be different from that of sensory/attention regions that are predominantly recruited during the movie.
First, we consider networks that are putatively driven by the task (visual, auditory, dorsal attention, language); next, we consider these networks in relation to default-mode RSN. This analysis was carried out both for MEG and fMRI on the same nodes (Supplemental Information).
Each element in i, j position of the covariance matrix displays the interregional Z score correlation difference (movie-fixation) between the pair of nodes (i, j) belonging either to the same RSN (within-network) or to different RSN (across-network interaction).
In agreement with measures of total interdependence (Figures 2, S2, and S3), the within-network BLP correlation decreased mainly in α and β during movie as compared to fixation (Figure 5). The significance of this decrease was quantitatively tested in each network with ANOVAs using band (δ, θ, α, β, γ) as a factor on the elements of the Z score difference covariance matrices. The results showed a significant main effect of band in the visual network (F4,36 = 47.39, p < 0.001, pη2 = 0.84) (Figure S6A) accounted for by stronger decrements in α BLP as compared to all other bands (all p values < 0.05); in β BLP as compared to δ (p < 0.001) and γ (p < 0.001); and in θ BLP as compared to δ (p = 0.002) and γ BLP (p < 0.001). There was also a significant main effect of band in the Auditory network (F4,12 = 79.94, p < 0.001, pη2 = 0.96) (Figure S6B) with significant decrements of α BLP with respect to δ (p < 0.001), θ (p < 0.001) and γ (p < 0.001); β BLP with respect to δ (p < 0.001), θ (p = 0.001) and γ BLP (p < 0.001); and in θ BLP with respect to δ (p < 0.01). Finally, in the dorsal attention network, the main effect band (F4,28 = 78.44 p < 0.001, pη2 = 0.92) (Figure S6C) depended on lower correlation during movie in α (all p values < 0.001) and β (all p values < 0.005) bands as compared to all other bands. The comparison between α and β BLP also reached significance, with a larger decrement of correlation in α (p < 0.001). In the language network, the main effect of band (F4,16 = 27.04 p < 0.001, pη2 = 0.87) was explained by increased correlation in the α, β, and γ bands with respect to δ and θ bands (all p values < 0.001). While the comparison between α and β bands did not reach the significance, the γ band was significantly stronger than β and only slightly significant with respect to α band (p = 0.06). In summary, regions within visual, auditory, and dorsal attention RSN decrease their BLP correlation, especially in the α and β bands, while regions within the language network increase their BLP correlation especially in the γ band.
Figure 5. MEG and fMRI Covariance Matrices Showing Changes of Interregional Connectivity under Natural Vision by Nodes and Bands.

Z scores difference covariance matrices showing changes of interregional correlation during movie watching relative to fixation, obtained using MEG across different BLPs and fMRI. Each row in the covariance matrices represents the stationary Z score difference correlation value between a node and other nodes of RSN. White cells represent nodes pairs, which do not pass the statistical threshold (z = 4 corresponding to p < 0.001). Cells with asterisks show significant value after the Bonferroni correction for multiple comparisons. See also Figure S5 and Table S1.
With regard to cross-network modulation, the visual network qualitatively showed decreased correlation with the dorsal attention and auditory networks, but increased correlation with the language network (Figure 5). This impression was confirmed in a repeated-measures two-ways ANOVA with network (visual and language; visual and auditory; visual and dorsal attention) and band (θ, δ, α, β, and γ) as factors. There was a significant effect of network (F2,18 = 108.29 p < 0.001, pη2 = 0.90) indicating decreased correlation between visual and dorsal attention (all p values < 0.001) and increased correlation between visual and language RSN (all p values < 0.001). Interestingly, these modulations were frequency specific (network × band: F8,72 = 31.51, p < 0.001, pη2 = 0.69). The increased correlation between visual and language nodes was stronger in θ with respect to α and δ (all p values < 0.001) and γ (p < 0.02), and in β with respect to α (p < 0.01), δ (p < 0.001) (Figure S6D). The comparison between β and θ and between β and γ did not reach significance (all p values > 0.05). Same results were obtained using nodes based on the maps of Figure 3 (Figure S5A). In contrast, correlation decreased more strongly for α BLP during movie with respect to fixation between visual and auditory nodes (all p values < 0.001) (Figure S6E) and between visual and dorsal attention nodes (Figure S6F) (all p values < 0.001). In summary, regions in the visual network decrease their α BLP interaction with regions in the dorsal attention network but increase their BLP interaction in β, θ, and γ with regions in the language network.
Next, we consider modulation in the default-mode network with respect to sensory and attention networks (Figure 6). Within-DMN BLP correlation dropped specifically in the α band during the movie condition as compared to fixation. With respect to cross-network interaction, α BLP correlation decreased between DMN and auditory and dorsal attention, while β BLP correlation decreased between DMN and auditory networks. However, the DMN increased correlation with the language network in the γ band. In summary, the default-mode network showed a pattern of BLP correlation modulation similar to other sensory and attention networks including decrements of within- and across-network interaction in the α band and increased interaction with the language network at higher (γ) frequencies.
Figure 6. Z Score Difference Covariance Matrices Averaged across Nodes.

Group-level Z score difference covariance matrices averaged across nodes of each RSN obtained using MEG across different BLPs and fMRI. Each row represents the averaged interregional Z score correlation between nodes either to the same RSN (within-network interaction) or to distinct networks (cross-network interaction). Color scale indicates increased in yellow-orange or decreased in green-blue interregional interaction. White cells represent nodes pairs, which do not pass the statistical threshold z = 2.4 (corresponding to p < 0.05). Cells with asterisks show significant value after the Bonferroni correction for multiple comparisons. See also Figure S6.
Control analyses were also carried out to examine the robustness of the results in relation to possible decreases in signal-to-noise due to α power decreases produced by visual stimulation in the movie condition (Berger, 1929; Supplemental Information and Figures S5B and S5C) and at the level of single subjects (Figures S5D and S5E).
Modulation of MEG versus fMRI Connectivity
One of the most influential observations shaping the debate on the function of RSN is that their topography is similar to that of task networks (Biswal et al., 1995; Greicius et al., 2003; Smith et al., 2009). This has suggested that RSN may be a prior for task-driven patterns of activity (Raichle, 2011).
Inspection of the covariance matrix for fMRI connectivity visà-vis MEG BLP correlation in different bands (Figure 5) and by network (Figure 6), shows significant decreases of fMRI connectivity during movie within visual (t test: p < 0.005) and dorsal attention networks as well as between networks (visual-auditory [p = 0.003]; visual-dorsal attention RSN [p < 0.001]). Functional MRI connectivity decreases qualitatively parallel α and β BLP correlation decreases within and across networks earlier described. In the language network, fMRI connectivity increased similarly to α, β, and γ BLP correlation in the same network (Figure 5). A discrepant result involves the auditory network that shows in MEG a drop of α and β BLP correlation, but an increased correlation in fMRI. This discrepancy is likely due to difference in the experimental environment between MEG and fMRI (Supplemental Information). Finally, interactions between Visual and Language RSN were characterized by small yet significant mean decrease in fMRI as opposed to an enhancement of BLP correlation, especially in θ and β (and γ) bands.
The pattern of fMRI connectivity for the default-mode network was similar to that of the visual network. Within-network fMRI connectivity decreased during movie in parallel to α/β BLP correlation decrements; cross-network fMRI connectivity decreased (from negative toward zero) with dorsal attention and visual networks in parallel to α BLP correlation decrements; finally, increases of BLP correlation between DMN and language in the γ band corresponded to a slight decrease in fMRI connectivity, similarly to what observed between visual and language networks (Figure 6).
An important finding is that modulations of BLP correlation in different frequencies were accompanied by an overall preservation of the large-scale topography of MEG and fMRI RSN across conditions, i.e., similar spatial patterns of correlation were observed in fixation and movie in both methods. This can be appreciated by inspecting separately MEG and fMRI covariance matrices in fixation and movie conditions (Figure 7A). In both methods the correlation was stronger within than across networks, a classic result in fMRI. Moreover even the local structure of correlation showed strong similarities. For example, nodes like left and right FEF displayed relative low interregional correlation in both methods; conversely, right vIPS displayed strong correlation with most visual nodes in both modalities.
Figure 7. MEG BLP versus fMRI Covariance Structures.

(A) Group-level Z score covariance matrices for fixation and movie by nodes for each MEG BLP and fMRI. Each row represents the interregional Z score correlation between nodes belonging either to the same RSN (within-network interaction) or to distinct networks (cross-network interaction).
(B) Spatial correlation between MEG and fMRI covariance structures for the within-network interaction in visual network (fMRI-α BLP correlation), during fixation and movie.
(C) Spatial correlation between MEG and fMRI covariance structures for the across-network interaction (fMRI-β BLP correlation) between the visual and the language network, during fixation and movie.
See also Table S2.
To quantify these effects, we computed the spatial correlation on group-level Z score covariance matrices using the Pearson product moment formula separately for fixation and movie. In each modality (fMRI or MEG) the spatial correlation between conditions (fixation, movie) was very high, except for the auditory network (visual network fMRI: r = 0.85 p < 0.001; MEG α BLP: r = 0.98, p < 0.001; auditory network fMRI: r = 0.45, p > 0.05; MEG α BLP: r = 0.99, p < 0.001; dorsal attention network fMRI: r = 0.93, p < 0.001; MEG α BLP: 0.96, p < 0.001).
In addition, the covariance matrices between fMRI and MEG were similar within each condition (fixation or movie). The strongest correlation was within visual and dorsal attention RSN across multiple bands (Figure 7B; visual network; all p values < 0.01; Table S2). In terms of cross-network interaction, MEG and fMRI covariance matrices were similar for visual-dorsal attention, and visual-language interaction matrices across multiple bands (Table S2). Interestingly, the correlation between visual and language nodes across modalities was significant during movie watching (p < 0.01) but not during fixation (p > 0.05) (Figure 7C; visual-language network). Notably, this positive correlation comes from narrowing of variability in the pairwise correlation values, with stronger BOLD correlation between pairs of regions in visual and language RSN corresponding to stronger BLP correlation in θ and β bands in MEG.
In DMN, MEG covariance matrices for fixation and movie were similar both for MEG (α BLP: r = 0.98, p < 0.001) and fMRI (r = 0.94, p < 0.001) and best correlated in the α band with fMRI covariance matrix (Table S2).
In summary, these findings show that the overall topography of RSN does not change going from fixation to movie and that fMRI and MEG topographies are similar especially in visual and dorsal attention RSN. However, going from fixation to movie observation induces frequency-specific changes of correlation with decrements of fMRI connectivity paralleling α BLP decreases in sensory/attention/default networks (visual, dorsal attention, DMN, and their interaction), the formation of stronger frequency specific RSN interactions, as indexed by enhancement of BLP correlation in θ, β, and γ bands between visual and language RSN and in the γ band between DMN and language, paralleling mean fMRI correlation decrements.
Temporal Dynamics of MEG RSN during Natural Vision
Previous MEG findings showed that BLP correlation in contrast to fMRI connectivity are patently nonstationary (de Pasquale et al., 2010, 2012); moreover, visual stimulation has been shown to produce transient breakdown of functional connectivity measured with fMRI specifically in visual cortex (Nir et al., 2006; this study). Hence, we examined the nonstationarity of BLP correlation in visual cortex in relation to some features of the movie.
Figure 8A depicts the prototypical fluctuations of α BLP correlation evaluated over a sliding window of 10 s within the visual network during fixation (in blue) and the observation of the first movie segment (in red). Qualitative inspection reveals that the temporal structure of BLP correlation is characterized by the emergence of nonstationary local minima over a time scale of 15–30 s. Therefore, to explore whether watching the movie influences the variability of α BLP correlation with respect to the variability during fixation, we computed the power spectrum density (PSD) for fixation and movie (Supplemental Information). Figure 8B shows that movie watching enhanced the amplitude of the slow fluctuations of the BLP correlation in the α band across nodes of the visual network with respect to fixation. To quantify this effect, the PSD was integrated over slow (0.005–0.10 Hz, in green), middle (0.1–0.2 Hz, in orange), and high (0.2–0.3 Hz, in blue) frequency bands, and two-way repeated-measures ANOVA was run with band (low, middle, high) and condition (fixation, movie) as main factors. There was a significant main effect condition (F1,19 = 91.46; p < 0.001, pη2 = 0.83) accounted for by a higher variability of BLP correlation fluctuations for movie compared to fixation. There was also a significant interaction condition × band (F2,38 = 38.50; p < 0.001, pη2 = 0.67), reflecting a stronger variability during movie in the low (0.005–0.10 Hz) (p < 0.001) and middle (0.1–0.2 Hz) (p = 0.002) frequency bands (Bonferroni post-hoc test) (Figure 8B). Fluctuations of β BLP correlation did not reveal any significant modulation (p > 0.05). Importantly, the same analysis computed for the cross-network interaction between the visual and language network (θ and β BLP) did not reveal any significant effect (p > 0.05). This suggests that the enhanced correlation between these two networks was stationary.
Figure 8. Dependence of MEG Visual Network on Specific Movie Features.

(A) Nonstationary α BLP correlation averaged across nodes of the visual network showing the emergence of significant local minima during the observation of the first movie block.
(B) Power spectrum density (PSD) of correlation time course for fixation (the blue line) and movie (the red line) averaged across runs and nodes. Error bars indicate ± SEM. Movie watching increases the spectral variability of BLP correlation in α BLP in the slow (0.005–0.1 Hz, in green) and middle (0.1–0.2 Hz, in orange) frequency bands, as revealed by the significant interaction condition × band (in the insert).
(C) Behavioral results showing the perceptual grouping processes across subjects, for the first movie block. Consistency analysis computed integrating the number of counts on 12 subjects as function of time shows that observers perceived natural scenes as structured into discrete events; BLP correlation and consistency measures were both binarized (panels D and E, respectively) to compute the lag cross-correlation (F). After the determination of a significant threshold (dashed lines) we identify two correlation peaks (see marks) at different time lags.
See also Figure S7.
Then, we considered the putative dependence of nonstationary properties of BLP correlation within the visual network upon specific features of the movie. Based on the observation that inter-regional BLP correlations are stronger at frequencies below 0.1 Hz, and that its variability is stronger even at lower frequencies (0.005–0.10 Hz) (Figure 8B), it is sensible to assume that events occurring on a similar time scale may represent an ideal candidate to modulate the α BLP correlation.
Psychological studies have shown that subjects perceive natural stimuli in temporal chunks that can be defined by event boundaries occurring at multiple timescales, ranging from fine-grained (a couple of seconds or less) to a coarse-grained scale (few tens of seconds) (Zacks et al., 2007; Zacks and Swallow, 2007). These “event boundaries” are associated to specific neural responses in visual and attention areas (Sridharan et al., 2007; Zacks et al., 2001) as seen through fMRI.
Hence, we hypothesized that the nonstationarity of power correlation in visual cortex was partly dependent on the perception of event boundaries in the movie. To test this hypothesis, we carried out a psychophysical control experiment on an independent sample of 12 participants, who were asked to segment the movie in temporal chunks that they found natural and meaningful (Supplemental Information).
Our observers perceived the movie as structured into discrete events, and interestingly, event boundaries occurred at similar times in the majority of subjects (Figure 8C). To examine the existence of possible temporal relationships between the emergence of transient drops of α BLP correlation (Figure 8A) and event boundary time series (Figure 8C), the two time series were binarized (Supplemental Information) and studied with lagged cross-correlation (Figures 8D–8F). Bootstrapping was used to determine a significant correlation threshold (r = 0.125, p = 0.001). In the first movie block, the highest significant correlation (r = 0.33, p < 0.01) between the two binarized time series occurred at lag = 23 s (Figure 8F). A second significant peak of correlation (r = 0.25, p < 0.01) occurred at around 36 s (see marks). In the second movie block a significant correlation peak (r = 0.30, p < 0.01) was identified at lag = 37 s. No significant correlation was detected in the third block.
To contrast these findings with dynamic changes in low-level features of the movie, the time course of the luminance for each movie block was computed. The luminance time courses were faster, had peaks at multiple frequencies in the PSD, and did not show a significant lagged correlation with the BLP in the visual network (Figure S7).
In summary, watching the movie increased the non-stationarity of α BLP correlation within visual cortex. Transient decrements of α BLP correlation in the visual RSN followed event boundaries in the movie that were consistently identified in an independent group of observers, but not luminance transients. In contrast, enhanced cross-network interaction between visual and language regions appeared to be stable over time or stationary. This is important as it suggests that task sets can engender interactions at longer time scales (tens of seconds) much slower than expected based on neuronal recordings (hundreds of milliseconds).
DISCUSSION
We used MEG to measure BLP correlation within/between fMRI-defined RSN to examine whether and how their strength and dynamics were influenced by going from restful fixation to an active task, i.e., watching a movie. In the same subjects, RSN topography was compared at rest and during movie watching using two measures of connectivity: BOLD fMRI connectivity and MEG BLP correlation. Three main findings will be discussed. First, RSN topography, both MEG and fMRI, did not change when watching a movie as compared to fixation. However movie watching caused robust decrements of ongoing resting-state correlation in the α/β BLP within/across multiple networks, the main MEG correlate of fMRI RSN, and the formation of more focal task-dependent temporal correlation in θ, β, and γ band BLP between networks. Finally, α BLP decrements in occipital visual cortex were non-stationary and correlated with event boundaries in the movie. See Methodological Considerations in Supplemental Information.
Preserved RSN Topography and Modulation of α and β BLP Connectivity during Natural Vision
Previous MEG studies have shown that it is possible to recover spatial covariance patterns or RSN similar to those observed in fMRI by mapping the temporal correlation of BLP, especially in the α and β bands, during resting wakefulness (Brookes et al., 2011a, 2011b; de Pasquale et al., 2010, 2012; Hipp et al., 2012; Liu et al., 2010). Interestingly, most of the BLP interaction occurs at very low frequency near 0.1 Hz, similarly to what observed with fMRI, despite MEG exquisite temporal resolution (milliseconds).
The first important result was that the topography of RSN, visualized for the first time with both fMRI and MEG in the same subjects, is significantly maintained going from rest to natural vision (Figure 7A). Moreover, fMRI connectivity was spatially similar to MEG-BLP connectivity across multiple frequency bands (Figure 7A; Table S2). Their similarity, especially for cross-network connections (visual-language or visual-dorsal attention), was stronger during the movie (Figure 7B).
The preservation of topography across task conditions is consistent with the resilience and independence of fMRI-RSN across levels of consciousness (Greicius et al., 2008; Larson-Prior et al., 2009; Vincent et al., 2007) and behavioral states (Arfanakis et al., 2000; Biswal et al., 1995; Fransson, 2006; Greicius and Menon, 2004; Greicius et al., 2009; Morgan and Price, 2004; Smith et al., 2009). The increased similarity between fMRI and MEG connectivity during the movie is likely due to increased cortical synchronization across subjects induced by sensory stimulation (Hasson et al., 2004; Mantini et al., 2012). Interestingly, increased cortical synchronization across subjects is present not just in humans, but also in nonhuman primates, and this signal has been used to map evolutionarily preserved or modified cortical networks across species (Mantini et al., 2013; Mantini et al., 2012).
However, natural vision induced a strong reduction of within-and between-network BLP correlation in the α and β bands, especially in the low frequency range (<0.3 Hz). This was shown with an analysis of interdependence (Figures 2, S2, and S3), with a voxel-wise seed based analysis (Figures 3, 4, and S4), and with pairwise regional analysis (Figures 5 and 6). The networks predominantly involved included the visual, auditory, dorsal attention, and the default-mode network.
What is the significance of preserved fMRI/MEG topography in lieu of robust frequency specific modulations of BLP connectivity? This important point requires first a brief detour to the neuro-physiological basis of the BOLD signal. It is now well established that BOLD signal changes produced by stimuli or tasks best correlate with local changes in the local field potential (LFP), a signal dominated by the electrical current flowing from all nearby dendritic synaptic activity within a volume of tissue. While stimulus- or task-evoked BOLD signal changes are strongly correlated with LFP changes across all bands, but especially in the γ band (Goense and Logothetis, 2008), spontaneous fluctuations of the signal in the resting state correlate with fluctuations of the slow cortical potentials (SCP) (<4 Hz) and BLP fluctuations of signals at higher frequencies (α, β, and γ bands) (He et al., 2008; Nir et al., 2008; Schölvinck et al., 2010). The link between low and high frequency activity, however, is not obligatory, but it can be dissociated with respect to RSN topography between behavioral states. For example, while SCP and fMRI RSN topography remain similar during wakefulness and sleep, γ BLP correlates with fMRI RSN topography only during wakefulness (Breshears et al., 2010; He et al., 2008). Finally, the phase of SCP may be nested with the power and phase of activity at higher frequencies (so called cross-frequency coupling or phase-power coupling) (Buzsáki and Draguhn, 2004; He et al., 2008; Monto et al., 2008; Schroeder and Lakatos, 2009). This mechanism allows for activity at lower frequencies to influence activity at higher frequencies that are involved in stimulus and task coding (Canolty et al., 2006; Jensen et al., 2012; Lakatos et al., 2008).
These findings have important implications for our work. First, the nested relationship between the low and high frequency activity may reconcile results from LFP recordings (He et al., 2008; Nir et al., 2008; Schölvinck et al., 2010) which emphasize SCP as the main correlate of RSN, and MEG recordings which highlight α/β BLP (Brookes et al., 2011a; Brookes et al., 2011b; de Pasquale et al., 2010, 2012; Hipp et al., 2012; Liu et al., 2010) and signal (Marzetti et al., 2013). A nested relationship between SCP and signals at higher frequencies can also explain the similarity between fMRI RSN and MEG-BLP topography across multiple frequency bands (Figure 7A; Table S2). Finally, maintenance of RSN topography during fixation and movie must reflect electrophysiological connectivity that is task-independent. It is well known that fMRI RSN topography approximate the network structure of anatomical connections over relatively long periods of time (~10–15 min) (Buckner et al., 2009; Honey et al., 2007; Sporns, 2011). Therefore, it is possible that part of the BLP topography just reflects task-independent physiological markers of anatomical connections possibly involved in synaptic homeostasis (Turrigiano, 2011).
At the same time, natural vision clearly affects components of the electrophysiological signal for relatively long periods, which include both a reduction of α/β BLP connectivity within/between multiple networks, as well as an enhancement of connectivity in θ, β, and γ BLP between networks (later considered). This leads to the question of whether these modulations reflect task-dependent versus task-independent modulations and, going back to the original hypotheses, whether RSN are priors for task network and performance, or just idling spatiotemporal neural structures that are reconfigured to enable task networks. Before we attempt to answer this question, let’s review the main assumptions behind each hypothesis.
The basic idea behind the prior hypothesis (Raichle, 2011) is that RSN fluctuations reflect excitability fluctuations of cortical circuitries. Through cross-frequency control mechanisms outlined above, the phase of low frequency activity may be modulated, as part of the temporally predictive context that is intrinsic to any behavior (Schroeder and Lakatos, 2009), and this can lead to an enhancement of synchronization of higher frequency activity. This hypothesis predicts not only a similar topography between rest and task, but also a strengthening of coupling of interactions present at rest during performance of a task.
The alternative “boundary” hypothesis is that RSN reflect idling cortical circuits, whose activity is independent of any particular task, and these spatiotemporal patterns must be suppressed or reorganized for task-specific activity patterns to emerge. As an example, a vast literature on EEG/MEG and cognitive states associates increments of α oscillations/power to inhibition of cortical processing, and α power/oscillations decrements to enhanced information processing (Capotosto et al., 2009; Jensen et al., 2012; Sauseng et al., 2013; Thut et al., 2006; VanRullen and Koch, 2003). Similarly, an expanding body of animal studies shows that tasks or stimuli decrease correlated noise in cortex. Significant decreases of spatial correlation of LFP during visual stimulation have been reported in monkey and cat primary visual cortex (Nauhaus et al., 2009; Nauhaus et al., 2012; Smith and Kohn, 2008). Overall these studies indicate that low-frequency fluctuations of correlated neural activity occur spontaneously not only at the level of brain regions or networks as amply documented by fMRI, ECOG, and MEG but also at the level of individual neurons and microcircuitries (Nauhaus et al., 2009; Nauhaus et al., 2012; Smith and Kohn, 2008). Both at small and large-scale levels, however, sensory stimuli and active processing disrupt correlated noise, and shift the neural dynamics toward higher frequencies and more specific task patterns of functional connectivity.
Our current interpretation is that prolonged, broad, and sustained reduction α/β BLP correlation in visual, dorsal attention, auditory, and default network, and across networks, are more consistent with a reduction of spontaneous cortical noise than a prior for task networks. The prolonged duration of α/β BLP reduction lasts longer than any reported task specific phase synchronization (Canolty et al., 2006; Jensen et al., 2012; Lakatos et al., 2008). Furthermore, when watching the movie, α/β BLP, i.e., the physiological marker of RSN, drops as coupling increases at higher frequencies in the same regions/networks. Resting- and task-state signals are characterized by different frequencies, which is against the idea that signals mediating RSN are simply strengthened or more synchronized during tasks. For these reasons, we believe that our data are more consistent with the “idling” hypothesis than a “prior” interpretation.
Task-Specific Interactions in θ, β, and γ BLP during Natural Vision
Watching the movie engendered more focal cross-network enhancement of BLP correlation in the θ and β bands between visual and language networks, and in the γ band between default-mode and language networks as compared to fixation (Figures 3, 6, and S6D). This result was obtained both with voxel-wise map contrast analysis (Figures 3 and 4), as well as regional pair-wise analyses on independent nodes from fMRI (Figures 5, 6, and S6). Increases of BLP correlation in θ and β (and γ) correlated with interregional decreases in fMRI. These findings indicate the formation of stronger task networks that are not recapitulated by spontaneous activity correlation at rest, and along with the reduction of α BLP correlation, show overall that resting-state and task interactions are different in the frequency domain. The functional significance of increased coupling between visual and language regions may be related to the demands of the movie including action understanding, semantics, lip reading, etc. The increased coupling between default mode and language could be related to the linguistic and verbal memory demands of the movie.
A widely accepted hypothesis is that synchronization of neural oscillations across brain areas is important for flexibly linking different task-relevant neuronal populations (Fries, 2005; Varela et al., 2001). For example, several studies have reported increases in β or γ coherence in task-relevant networks during attention (Siegel et al., 2008), perceptual tasks (Hipp et al., 2011), contingently upon the experience of pain (Betti et al., 2009; Gross et al., 2007), and between cortical and spinal cord neuronal populations during movement preparation (Schoffelen et al., 2005). Interestingly, theoretical and experimental work suggest an inverse relationship between cortical integration distance, or conduction delays, and the underlying temporal dynamics, with slower frequencies (e.g., θ or β bands) involved predominantly in the synchronization of large and distant neuronal assemblies, and γ band synchronization related to more local encoding (Kopell et al., 2000; von Stein and Sarnthein, 2000). This may account for the preferential coupling in θ and β band between two networks, visual and language, that are widely separate in distance, both geometrical and connectivity-wise (Doucet et al., 2011; Honey et al., 2007; Lee et al., 2012; Yeo et al., 2011). On the other hand, language and default-mode networks are closely related in connectivity space which may explain for the preferential correlation in γ BLP.
However, we should underscore that functional coupling between networks in our task was relatively constant in the course of the movie and occurred at a slower time scale (~0.1 Hz) than those typically described in the animal or EEG/MEG literature. Hence our findings are more consistent with task-dependent functional connectivity modulation that occurs on the scale of seconds to minutes during task performance, as described in recent fMRI experiments (Chadick and Gazzaley, 2011; Spreng et al., 2010; Zanto et al., 2011). Task performance also causes sustained changes in resting-state fMRI functional connectivity that can persist for minutes to hours after task termination (Albert et al., 2009; Lewis et al., 2009; Tambini et al., 2010). Overall ours, and these fMRI studies, strongly support the idea that task control may involve both phasic and more tonic components, and that the latter may involve slow changes in frequency-specific functional connectivity. Cross-network interaction over long time scales might be crucial for maintaining an internal scaffolding of task settings that facilitate more dynamic and rapid control and processing of sensory external inputs.
Nonstationarity of BLP Correlation in Visual Cortex and Its Biological Significance
A final finding was the enhancement of BLP correlation variability (or nonstationarity) in visual cortex during natural vision. Similar observations have been reported using fMRI in human visual cortex by Nir and coworkers (2006).
Interregional temporal correlations as seen through the lens of fMRI are largely stationary (but see Smith et al., 2012), due to the severe low-pass filter of the neurovascular coupling. In contrast, MEG BLP correlations are patently non-stationary (de Pasquale et al., 2010, 2012). Several “endogenous” mechanisms such as noise and synaptic delays (Deco and Corbetta, 2011; Deco et al., 2011), neuromodulation (Marder, 2011), and cognitive activity have been proposed to explain the nonstationary dynamics of functional connectivity (Sporns, 2011).
Here, we show that sensory inputs and their interaction with cognitive activity (event boundary detection) strongly affect the variability of temporal correlation in visual cortex. The power spectral density of α BLP correlation time course especially at the lower frequencies (0.01 < Hz < 0.2) was strongly enhanced by watching the movie as compared to visual fixation (Figure 8B). Furthermore, we observed a significant lagged correlation between the detection of event boundaries in the movie, as judged by an independent group of observers (Figure 8F) and the α BLP correlation time course. This lagged correlation was not simply due to the chance temporal interaction of BLP and psychophysical time series. It was also not due to low level sensory changes in the movie as indicated by the analysis on the luminance time course. Our interpretation is that it may reflect longer time-scale (tens of seconds) adjustments in functional connectivity induced by specific high-level sensory or cognitive events. This is in keeping with the event segmentation theory (EST) (Zacks et al., 2007), in which event segmentation may be the product of an adaptive mechanism that makes prediction about upcoming information by means of the integration between sensory clues and previous knowledge about event parts or actor’s goals and plans. This could involve top-down mechanisms to visual cortex that could modulate the strength of ongoing BLP correlation. We do not believe though nonstationary fluctuations in visual cortex BLP correlation are directly involved in processing event boundaries; rather, they reflect the time-varying influence on cortical noise reduction of task-specific processes. It is as if visual cortex takes a short break after detection of an event boundary.
Conclusions
This study provides a glimpse in the long-lasting adjustments of functional connectivity induced by natural vision on resting-state activity. RSN are similar to a complex space landscape formed by peak and valleys that slowly change over time. These peaks and valleys have also colors that correspond to their frequency specific correlation, perhaps more blue/green for α-band BLP correlation, and more orange/red for γ-band BLP correlation. As riveting as it can be, going to the movies only slightly changes this complex dynamic landscape as only few connections are actually driven by the task. Thus, the overall panorama does not change much. Yet the movie has a much stronger effect on the overall hue of this landscape. Major hills (networks) change their color from shades of blue/green to orange/red. Reducing cool colors (low frequency cortical noise) may be necessary to allow hot colors (high frequency task-related activity) to manifest. Future studies will need to determine whether the shape of this landscape or its colors could be affected by more extreme behavioral manipulations.
EXPERIMENTAL PROCEDURES
Participants and Data Acquisition
Twelve subjects (mean age 24.7, range 21–31 years; six females; all right-handed) performed separate MEG and fMRI recording sessions during fixation and movie watching. Neuromagnetic signals were recorded using a 153-magnetometer MEG system built at the University of Chieti (Della Penna et al., 2000) while fMRI was acquired on 3T MR Philips Achieva scanner. All participants signed prior to the experiment an informed consent form approved by the Ethics Committee of the University of Chieti.
Signal Preprocessing
An overview of the MEG data preprocessing is depicted in Figure S1. After ICA identification and classification algorithm (Supplemental Information), the source-space band-limited power (BLP) were computed as in de Pasquale et al. (2010, 2012),
| (Equation 1) |
in which Tp = 150 ms and qj (t) = [qjx (t) qjy(t) qjz(t)] is the source-space current density vector at voxel j at time t. Correlation time series between voxels j and s (the seed) were computed using the Pearson product moment formula:
| (Equation 2) |
where Tr is the epoch duration and overbars denote the mean over the appropriate interval. In the analysis assuming the stationarity rsj was computed over nonoverlapping windows spanning the whole recording (Tr ≈ 37 s). This approach was applied to obtain Z score differences maps over the whole brain and difference covariance matrices. In the analysis considering the nonstationarity, time courses of correlation were obtained evaluating rsj over 10 s window with 200 ms time step. Functional MRI (fMRI) data were preprocessed as in Mantini et al. (2012) (Supplemental Information).
Supplementary Material
Acknowledgments
This research was funded by the European Community’s Seventh Framework Programme Grant Agreement HEALTH-F2-2008-200728 (BrainSynch) and by the Human Connectome Project (1U54MH091657-01).V.B. was additionally supported by a fellowship from the University of Chieti. M.C. was supported by R01 MH096482-01 (NIMH) and 5R01HD061117-08 (NICHD).
Footnotes
Supplemental Information includes seven figures, two tables and Supplemental Experimental Procedures and can be found with this article online at http://dx.doi.org/10.1016/j.neuron.2013.06.022.
References
- Albert NB, Robertson EM, Miall RC. The resting human brain and motor learning. Curr Biol. 2009;19:1023–1027. doi: 10.1016/j.cub.2009.04.028. [DOI] [PMC free article] [PubMed] [Google Scholar]
- Arfanakis K, Cordes D, Haughton VM, Moritz CH, Quigley MA, Meyerand ME. Combining independent component analysis and correlation analysis to probe interregional connectivity in fMRI task activation datasets. Magn Reson Imaging. 2000;18:921–930. doi: 10.1016/s0730-725x(00)00190-9. [DOI] [PubMed] [Google Scholar]
- Baldassarre A, Lewis CM, Committeri G, Snyder AZ, Romani GL, Corbetta M. Individual variability in functional connectivity predicts performance of a perceptual task. Proc Natl Acad Sci USA. 2012;109:3516–3521. doi: 10.1073/pnas.1113148109. [DOI] [PMC free article] [PubMed] [Google Scholar]
- Bartels A, Zeki S. Brain dynamics during natural viewing conditions—a new guide for mapping connectivity in vivo. Neuroimage. 2005;24:339–349. doi: 10.1016/j.neuroimage.2004.08.044. [DOI] [PubMed] [Google Scholar]
- Berger H. On the electroencephalogram in man. Arch Psychiatr Nervenkr. 1929;87:527–543. [Google Scholar]
- Betti V, Zappasodi F, Rossini PM, Aglioti SM, Tecchio F. Synchronous with your feelings: sensorimotor gamma band and empathy for pain. J Neurosci. 2009;29:12384–12392. doi: 10.1523/JNEUROSCI.2759-09.2009. [DOI] [PMC free article] [PubMed] [Google Scholar]
- Biswal B, Yetkin FZ, Haughton VM, Hyde JS. Functional connectivity in the motor cortex of resting human brain using echo-planar MRI. Magn Reson Med. 1995;34:537–541. doi: 10.1002/mrm.1910340409. [DOI] [PubMed] [Google Scholar]
- Breshears JD, Roland JL, Sharma M, Gaona CM, Freudenburg ZV, Tempelhoff R, Avidan MS, Leuthardt EC. Stable and dynamic cortical electrophysiology of induction and emergence with propofol anesthesia. Proc Natl Acad Sci USA. 2010;107:21170–21175. doi: 10.1073/pnas.1011949107. [DOI] [PMC free article] [PubMed] [Google Scholar]
- Brookes MJ, Hale JR, Zumer JM, Stevenson CM, Francis ST, Barnes GR, Owen JP, Morris PG, Nagarajan SS. Measuring functional connectivity using MEG: methodology and comparison with fcMRI. Neuroimage. 2011a;56:1082–1104. doi: 10.1016/j.neuroimage.2011.02.054. [DOI] [PMC free article] [PubMed] [Google Scholar]
- Brookes MJ, Woolrich M, Luckhoo H, Price D, Hale JR, Stephenson MC, Barnes GR, Smith SM, Morris PG. Investigating the electrophysiological basis of resting state networks using magnetoencephalography. Proc Natl Acad Sci USA. 2011b;108:16783–16788. doi: 10.1073/pnas.1112685108. [DOI] [PMC free article] [PubMed] [Google Scholar]
- Buckner RL, Sepulcre J, Talukdar T, Krienen FM, Liu H, Hedden T, Andrews-Hanna JR, Sperling RA, Johnson KA. Cortical hubs revealed by intrinsic functional connectivity: mapping, assessment of stability, and relation to Alzheimer’s disease. J Neurosci. 2009;29:1860–1873. doi: 10.1523/JNEUROSCI.5062-08.2009. [DOI] [PMC free article] [PubMed] [Google Scholar]
- Buzsáki G, Draguhn A. Neuronal oscillations in cortical networks. Science. 2004;304:1926–1929. doi: 10.1126/science.1099745. [DOI] [PubMed] [Google Scholar]
- Canolty RT, Edwards E, Dalal SS, Soltani M, Nagarajan SS, Kirsch HE, Berger MS, Barbaro NM, Knight RT. High gamma power is phase-locked to theta oscillations in human neocortex. Science. 2006;313:1626–1628. doi: 10.1126/science.1128115. [DOI] [PMC free article] [PubMed] [Google Scholar]
- Capotosto P, Babiloni C, Romani GL, Corbetta M. Frontoparietal cortex controls spatial attention through modulation of anticipatory alpha rhythms. J Neurosci. 2009;29:5863–5872. doi: 10.1523/JNEUROSCI.0539-09.2009. [DOI] [PMC free article] [PubMed] [Google Scholar]
- Chadick JZ, Gazzaley A. Differential coupling of visual cortex with default or frontal-parietal network based on goals. Nat Neurosci. 2011;14:830–832. doi: 10.1038/nn.2823. [DOI] [PMC free article] [PubMed] [Google Scholar]
- de Pasquale F, Della Penna S, Snyder AZ, Lewis C, Mantini D, Marzetti L, Belardinelli P, Ciancetta L, Pizzella V, Romani GL, Corbetta M. Temporal dynamics of spontaneous MEG activity in brain networks. Proc Natl Acad Sci USA. 2010;107:6040–6045. doi: 10.1073/pnas.0913863107. [DOI] [PMC free article] [PubMed] [Google Scholar]
- de Pasquale F, Della Penna S, Snyder AZ, Marzetti L, Pizzella V, Romani GL, Corbetta M. A cortical core for dynamic integration of functional networks in the resting human brain. Neuron. 2012;74:753–764. doi: 10.1016/j.neuron.2012.03.031. [DOI] [PMC free article] [PubMed] [Google Scholar]
- Deco G, Corbetta M. The dynamical balance of the brain at rest. Neuroscientist. 2011;17:107–123. doi: 10.1177/1073858409354384. [DOI] [PMC free article] [PubMed] [Google Scholar]
- Deco G, Jirsa VK, McIntosh AR. Emerging concepts for the dynamical organization of resting-state activity in the brain. Nat Rev Neurosci. 2011;12:43–56. doi: 10.1038/nrn2961. [DOI] [PubMed] [Google Scholar]
- Della Penna S, Del Gratta C, Granata CG, Pasquarelli A, Pizzella V, Russo M, Torquati K, Erné SN. Biomagnetic systems for clinical use. Philos Mag B. 2000;80:937–949. [Google Scholar]
- Doucet G, Naveau M, Petit L, Delcroix N, Zago L, Crivello F, Jobard G, Tzourio-Mazoyer N, Mazoyer B, Mellet E, Joliot M. Brain activity at rest: a multiscale hierarchical functional organization. J Neurophysiol. 2011;105:2753–2763. doi: 10.1152/jn.00895.2010. [DOI] [PubMed] [Google Scholar]
- Fox MD, Raichle ME. Spontaneous fluctuations in brain activity observed with functional magnetic resonance imaging. Nat Rev Neurosci. 2007;8:700–711. doi: 10.1038/nrn2201. [DOI] [PubMed] [Google Scholar]
- Fox MD, Snyder AZ, Zacks JM, Raichle ME. Coherent spontaneous activity accounts for trial-to-trial variability in human evoked brain responses. Nat Neurosci. 2006;9:23–25. doi: 10.1038/nn1616. [DOI] [PubMed] [Google Scholar]
- Fox MD, Snyder AZ, Vincent JL, Raichle ME. Intrinsic fluctuations within cortical systems account for intertrial variability in human behavior. Neuron. 2007;56:171–184. doi: 10.1016/j.neuron.2007.08.023. [DOI] [PubMed] [Google Scholar]
- Fransson P. How default is the default mode of brain function? Further evidence from intrinsic BOLD signal fluctuations. Neuropsychologia. 2006;44:2836–2845. doi: 10.1016/j.neuropsychologia.2006.06.017. [DOI] [PubMed] [Google Scholar]
- Fries P. A mechanism for cognitive dynamics: neuronal communication through neuronal coherence. Trends Cogn Sci. 2005;9:474–480. doi: 10.1016/j.tics.2005.08.011. [DOI] [PubMed] [Google Scholar]
- Goense JB, Logothetis NK. Neurophysiology of the BOLD fMRI signal in awake monkeys. Curr Biol. 2008;18:631–640. doi: 10.1016/j.cub.2008.03.054. [DOI] [PubMed] [Google Scholar]
- Goldman-Rakic PS. Topography of cognition: parallel distributed networks in primate association cortex. Annu Rev Neurosci. 1988;11:137–156. doi: 10.1146/annurev.ne.11.030188.001033. [DOI] [PubMed] [Google Scholar]
- Golland Y, Bentin S, Gelbard H, Benjamini Y, Heller R, Nir Y, Hasson U, Malach R. Extrinsic and intrinsic systems in the posterior cortex of the human brain revealed during natural sensory stimulation. Cereb Cortex. 2007;17:766–777. doi: 10.1093/cercor/bhk030. [DOI] [PubMed] [Google Scholar]
- Greicius MD, Menon V. Default-mode activity during a passive sensory task: uncoupled from deactivation but impacting activation. J Cogn Neurosci. 2004;16:1484–1492. doi: 10.1162/0898929042568532. [DOI] [PubMed] [Google Scholar]
- Greicius MD, Krasnow B, Reiss AL, Menon V. Functional connectivity in the resting brain: a network analysis of the default mode hypothesis. Proc Natl Acad Sci USA. 2003;100:253–258. doi: 10.1073/pnas.0135058100. [DOI] [PMC free article] [PubMed] [Google Scholar]
- Greicius MD, Kiviniemi V, Tervonen O, Vainionpää V, Alahuhta S, Reiss AL, Menon V. Persistent default-mode network connectivity during light sedation. Hum Brain Mapp. 2008;29:839–847. doi: 10.1002/hbm.20537. [DOI] [PMC free article] [PubMed] [Google Scholar]
- Greicius MD, Supekar K, Menon V, Dougherty RF. Resting-state functional connectivity reflects structural connectivity in the default mode network. Cereb Cortex. 2009;19:72–78. doi: 10.1093/cercor/bhn059. [DOI] [PMC free article] [PubMed] [Google Scholar]
- Gross J, Schnitzler A, Timmermann L, Ploner M. Gamma oscillations in human primary somatosensory cortex reflect pain perception. PLoS Biol. 2007;5:e133. doi: 10.1371/journal.pbio.0050133. [DOI] [PMC free article] [PubMed] [Google Scholar]
- Hacker CD, Laumann TO, Szrama NP, Baldassarre A, Snyder AZ, Leuthardt EC, Corbetta M. Resting state network estimation in individual subjects. Neuroimage. 2013;82:616–633. doi: 10.1016/j.neuroimage.2013.05.108. [DOI] [PMC free article] [PubMed] [Google Scholar]
- Hasson U, Nir Y, Levy I, Fuhrmann G, Malach R. Intersubject synchronization of cortical activity during natural vision. Science. 2004;303:1634–1640. doi: 10.1126/science.1089506. [DOI] [PubMed] [Google Scholar]
- He BJ, Snyder AZ, Vincent JL, Epstein A, Shulman GL, Corbetta M. Breakdown of functional connectivity in frontoparietal networks underlies behavioral deficits in spatial neglect. Neuron. 2007;53:905–918. doi: 10.1016/j.neuron.2007.02.013. [DOI] [PubMed] [Google Scholar]
- He BJ, Snyder AZ, Zempel JM, Smyth MD, Raichle ME. Electrophysiological correlates of the brain’s intrinsic large-scale functional architecture. Proc Natl Acad Sci USA. 2008;105:16039–16044. doi: 10.1073/pnas.0807010105. [DOI] [PMC free article] [PubMed] [Google Scholar]
- Hipp JF, Engel AK, Siegel M. Oscillatory synchronization in large-scale cortical networks predicts perception. Neuron. 2011;69:387–396. doi: 10.1016/j.neuron.2010.12.027. [DOI] [PubMed] [Google Scholar]
- Hipp JF, Hawellek DJ, Corbetta M, Siegel M, Engel AK. Large-scale cortical correlation structure of spontaneous oscillatory activity. Nat Neurosci. 2012;15:884–890. doi: 10.1038/nn.3101. [DOI] [PMC free article] [PubMed] [Google Scholar]
- Honey CJ, Kötter R, Breakspear M, Sporns O. Network structure of cerebral cortex shapes functional connectivity on multiple time scales. Proc Natl Acad Sci USA. 2007;104:10240–10245. doi: 10.1073/pnas.0701519104. [DOI] [PMC free article] [PubMed] [Google Scholar]
- Jensen O, Bonnefond M, VanRullen R. An oscillatory mechanism for prioritizing salient unattended stimuli. Trends Cogn Sci. 2012;16:200–206. doi: 10.1016/j.tics.2012.03.002. [DOI] [PubMed] [Google Scholar]
- Kopell N, Ermentrout GB, Whittington MA, Traub RD. Gamma rhythms and beta rhythms have different synchronization properties. Proc Natl Acad Sci USA. 2000;97:1867–1872. doi: 10.1073/pnas.97.4.1867. [DOI] [PMC free article] [PubMed] [Google Scholar]
- Lakatos P, Karmos G, Mehta AD, Ulbert I, Schroeder CE. Entrainment of neuronal oscillations as a mechanism of attentional selection. Science. 2008;320:110–113. doi: 10.1126/science.1154735. [DOI] [PubMed] [Google Scholar]
- Larson-Prior LJ, Zempel JM, Nolan TS, Prior FW, Snyder AZ, Raichle ME. Cortical network functional connectivity in the descent to sleep. Proc Natl Acad Sci USA. 2009;106:4489–4494. doi: 10.1073/pnas.0900924106. [DOI] [PMC free article] [PubMed] [Google Scholar]
- Lee MH, Hacker CD, Snyder AZ, Corbetta M, Zhang D, Leuthardt EC, Shimony JS. Clustering of resting state networks. PLoS ONE. 2012;7:e40370. doi: 10.1371/journal.pone.0040370. [DOI] [PMC free article] [PubMed] [Google Scholar]
- Leopold DA, Murayama Y, Logothetis NK. Very slow activity fluctuations in monkey visual cortex: implications for functional brain imaging. Cereb Cortex. 2003;13:422–433. doi: 10.1093/cercor/13.4.422. [DOI] [PubMed] [Google Scholar]
- Lewis CM, Baldassarre A, Committeri G, Romani GL, Corbetta M. Learning sculpts the spontaneous activity of the resting human brain. Proc Natl Acad Sci USA. 2009;106:17558–17563. doi: 10.1073/pnas.0902455106. [DOI] [PMC free article] [PubMed] [Google Scholar]
- Liu Z, Fukunaga M, de Zwart JA, Duyn JH. Large-scale spontaneous fluctuations and correlations in brain electrical activity observed with magnetoencephalography. Neuroimage. 2010;51:102–111. doi: 10.1016/j.neuroimage.2010.01.092. [DOI] [PMC free article] [PubMed] [Google Scholar]
- Mantini D, Della Penna S, Marzetti L, de Pasquale F, Pizzella V, Corbetta M, Romani GL. A signal-processing pipeline for magnetoencephalography resting-state networks. Brain Connect. 2011;1:49–59. doi: 10.1089/brain.2011.0001. [DOI] [PubMed] [Google Scholar]
- Mantini D, Hasson U, Betti V, Perrucci MG, Romani GL, Corbetta M, Orban GA, Vanduffel W. Interspecies activity correlations reveal functional correspondence between monkey and human brain areas. Nat Methods. 2012;9:277–282. doi: 10.1038/nmeth.1868. [DOI] [PMC free article] [PubMed] [Google Scholar]
- Mantini D, Corbetta M, Romani GL, Orban GA, Vanduffel W. Evolutionarily novel functional networks in the human brain? J Neurosci. 2013;33:3259–3275. doi: 10.1523/JNEUROSCI.4392-12.2013. [DOI] [PMC free article] [PubMed] [Google Scholar]
- Marder E. Variability, compensation, and modulation in neurons and circuits. Proc Natl Acad Sci USA. 2011;108(Suppl 3):15542–15548. doi: 10.1073/pnas.1010674108. [DOI] [PMC free article] [PubMed] [Google Scholar]
- Marzetti L, Della Penna S, Snyder AZ, Pizzella V, Nolte G, de Pasquale F, Romani GL, Corbetta M. Frequency specific interactions of MEG resting state activity within and across brain networks as revealed by the multivariate interaction measure. Neuroimage. 2013;79:172–183. doi: 10.1016/j.neuroimage.2013.04.062. [DOI] [PMC free article] [PubMed] [Google Scholar]
- Mesulam MM. Large-scale neurocognitive networks and distributed processing for attention, language, and memory. Ann Neurol. 1990;28:597–613. doi: 10.1002/ana.410280502. [DOI] [PubMed] [Google Scholar]
- Monto S, Palva S, Voipio J, Palva JM. Very slow EEG fluctuations predict the dynamics of stimulus detection and oscillation amplitudes in humans. J Neurosci. 2008;28:8268–8272. doi: 10.1523/JNEUROSCI.1910-08.2008. [DOI] [PMC free article] [PubMed] [Google Scholar]
- Morgan VL, Price RR. The effect of sensorimotor activation on functional connectivity mapping with MRI. Magn Reson Imaging. 2004;22:1069–1075. doi: 10.1016/j.mri.2004.07.002. [DOI] [PubMed] [Google Scholar]
- Nauhaus I, Busse L, Carandini M, Ringach DL. Stimulus contrast modulates functional connectivity in visual cortex. Nat Neurosci. 2009;12:70–76. doi: 10.1038/nn.2232. [DOI] [PMC free article] [PubMed] [Google Scholar]
- Nauhaus I, Busse L, Ringach DL, Carandini M. Robustness of traveling waves in ongoing activity of visual cortex. J Neurosci. 2012;32:3088–3094. doi: 10.1523/JNEUROSCI.5827-11.2012. [DOI] [PMC free article] [PubMed] [Google Scholar]
- Nir Y, Hasson U, Levy I, Yeshurun Y, Malach R. Widespread functional connectivity and fMRI fluctuations in human visual cortex in the absence of visual stimulation. Neuroimage. 2006;30:1313–1324. doi: 10.1016/j.neuroimage.2005.11.018. [DOI] [PubMed] [Google Scholar]
- Nir Y, Mukamel R, Dinstein I, Privman E, Harel M, Fisch L, Gelbard-Sagiv H, Kipervasser S, Andelman F, Neufeld MY, et al. Interhemispheric correlations of slow spontaneous neuronal fluctuations revealed in human sensory cortex. Nat Neurosci. 2008;11:1100–1108. doi: 10.1038/nn.2177. [DOI] [PMC free article] [PubMed] [Google Scholar]
- Nishimoto S, Vu AT, Naselaris T, Benjamini Y, Yu B, Gallant JL. Reconstructing visual experiences from brain activity evoked by natural movies. Curr Biol. 2011;21:1641–1646. doi: 10.1016/j.cub.2011.08.031. [DOI] [PMC free article] [PubMed] [Google Scholar]
- Raichle ME. The restless brain. Brain Connect. 2011;1:3–12. doi: 10.1089/brain.2011.0019. [DOI] [PMC free article] [PubMed] [Google Scholar]
- Raichle ME, MacLeod AM, Snyder AZ, Powers WJ, Gusnard DA, Shulman GL. A default mode of brain function. Proc Natl Acad Sci USA. 2001;98:676–682. doi: 10.1073/pnas.98.2.676. [DOI] [PMC free article] [PubMed] [Google Scholar]
- Sauseng P, Gerloff C, Hummel FC. Two brakes are better than one: the neural bases of inhibitory control of motor memory traces. Neuroimage. 2013;65:52–58. doi: 10.1016/j.neuroimage.2012.09.048. [DOI] [PubMed] [Google Scholar]
- Schoffelen JM, Oostenveld R, Fries P. Neuronal coherence as a mechanism of effective corticospinal interaction. Science. 2005;308:111–113. doi: 10.1126/science.1107027. [DOI] [PubMed] [Google Scholar]
- Schölvinck ML, Maier A, Ye FQ, Duyn JH, Leopold DA. Neural basis of global resting-state fMRI activity. Proc Natl Acad Sci USA. 2010;107:10238–10243. doi: 10.1073/pnas.0913110107. [DOI] [PMC free article] [PubMed] [Google Scholar]
- Schroeder CE, Lakatos P. Low-frequency neuronal oscillations as instruments of sensory selection. Trends Neurosci. 2009;32:9–18. doi: 10.1016/j.tins.2008.09.012. [DOI] [PMC free article] [PubMed] [Google Scholar]
- Shulman GL, Fiez JA, Corbetta M, Buckner RL, Miezin FM, Raichle ME, Petersen SE. Common blood flow changes across visual tasks: 11. Decreases in cerebral cortex. J Cogn Neurosci. 1997;9:648–663. doi: 10.1162/jocn.1997.9.5.648. [DOI] [PubMed] [Google Scholar]
- Siegel M, Donner TH, Oostenveld R, Fries P, Engel AK. Neuronal synchronization along the dorsal visual pathway reflects the focus of spatial attention. Neuron. 2008;60:709–719. doi: 10.1016/j.neuron.2008.09.010. [DOI] [PubMed] [Google Scholar]
- Smith MA, Kohn A. Spatial and temporal scales of neuronal correlation in primary visual cortex. J Neurosci. 2008;28:12591–12603. doi: 10.1523/JNEUROSCI.2929-08.2008. [DOI] [PMC free article] [PubMed] [Google Scholar]
- Smith SM, Fox PT, Miller KL, Glahn DC, Fox PM, Mackay CE, Filippini N, Watkins KE, Toro R, Laird AR, Beckmann CF. Correspondence of the brain’s functional architecture during activation and rest. Proc Natl Acad Sci USA. 2009;106:13040–13045. doi: 10.1073/pnas.0905267106. [DOI] [PMC free article] [PubMed] [Google Scholar]
- Smith SM, Miller KL, Moeller S, Xu J, Auerbach EJ, Woolrich MW, Beckmann CF, Jenkinson M, Andersson J, Glasser MF, et al. Temporally-independent functional modes of spontaneous brain activity. Proc Natl Acad Sci USA. 2012;109:3131–3136. doi: 10.1073/pnas.1121329109. [DOI] [PMC free article] [PubMed] [Google Scholar]
- Sporns O. Networks of the Brain. Cambridge, MA: The MIT Press; 2011. [Google Scholar]
- Spreng RN, Stevens WD, Chamberlain JP, Gilmore AW, Schacter DL. Default network activity, coupled with the frontoparietal control network, supports goal-directed cognition. Neuroimage. 2010;53:303–317. doi: 10.1016/j.neuroimage.2010.06.016. [DOI] [PMC free article] [PubMed] [Google Scholar]
- Sridharan D, Levitin DJ, Chafe CH, Berger J, Menon V. Neural dynamics of event segmentation in music: converging evidence for dissociable ventral and dorsal networks. Neuron. 2007;55:521–532. doi: 10.1016/j.neuron.2007.07.003. [DOI] [PubMed] [Google Scholar]
- Tambini A, Ketz N, Davachi L. Enhanced brain correlations during rest are related to memory for recent experiences. Neuron. 2010;65:280–290. doi: 10.1016/j.neuron.2010.01.001. [DOI] [PMC free article] [PubMed] [Google Scholar]
- Thut G, Nietzel A, Brandt SA, Pascual-Leone A. Alpha-band electroencephalographic activity over occipital cortex indexes visuospatial attention bias and predicts visual target detection. J Neurosci. 2006;26:9494–9502. doi: 10.1523/JNEUROSCI.0875-06.2006. [DOI] [PMC free article] [PubMed] [Google Scholar]
- Turrigiano G. Too many cooks? Intrinsic and synaptic homeostatic mechanisms in cortical circuit refinement. Annu Rev Neurosci. 2011;34:89–103. doi: 10.1146/annurev-neuro-060909-153238. [DOI] [PubMed] [Google Scholar]
- VanRullen R, Koch C. Is perception discrete or continuous? Trends Cogn Sci. 2003;7:207–213. doi: 10.1016/s1364-6613(03)00095-0. [DOI] [PubMed] [Google Scholar]
- Varela F, Lachaux JP, Rodriguez E, Martinerie J. The brain-web: phase synchronization and large-scale integration. Nat Rev Neurosci. 2001;2:229–239. doi: 10.1038/35067550. [DOI] [PubMed] [Google Scholar]
- Vincent JL, Patel GH, Fox MD, Snyder AZ, Baker JT, Van Essen DC, Zempel JM, Snyder LH, Corbetta M, Raichle ME. Intrinsic functional architecture in the anaesthetized monkey brain. Nature. 2007;447:83–86. doi: 10.1038/nature05758. [DOI] [PubMed] [Google Scholar]
- von Stein A, Sarnthein J. Different frequencies for different scales of cortical integration: from local gamma to long range alpha/theta synchronization. Int J Psychophysiol. 2000;38:301–313. doi: 10.1016/s0167-8760(00)00172-0. [DOI] [PubMed] [Google Scholar]
- Yeo BTT, Krienen FM, Sepulcre J, Sabuncu MR, Lashkari D, Hollinshead M, Roffman JL, Smoller JW, Zöllei L, Polimeni JR, et al. The organization of the human cerebral cortex estimated by intrinsic functional connectivity. J Neurophysiol. 2011;106:1125–1165. doi: 10.1152/jn.00338.2011. [DOI] [PMC free article] [PubMed] [Google Scholar]
- Zacks JM, Swallow KM. Event segmentation. Curr Dir Psychol Sci. 2007;16:80–84. doi: 10.1111/j.1467-8721.2007.00480.x. [DOI] [PMC free article] [PubMed] [Google Scholar]
- Zacks JM, Braver TS, Sheridan MA, Donaldson DI, Snyder AZ, Ollinger JM, Buckner RL, Raichle ME. Human brain activity time-locked to perceptual event boundaries. Nat Neurosci. 2001;4:651–655. doi: 10.1038/88486. [DOI] [PubMed] [Google Scholar]
- Zacks JM, Speer NK, Swallow KM, Braver TS, Reynolds JR. Event perception: a mind-brain perspective. Psychol Bull. 2007;133:273–293. doi: 10.1037/0033-2909.133.2.273. [DOI] [PMC free article] [PubMed] [Google Scholar]
- Zanto TP, Rubens MT, Thangavel A, Gazzaley A. Causal role of the prefrontal cortex in top-down modulation of visual processing and working memory. Nat Neurosci. 2011;14:656–661. doi: 10.1038/nn.2773. [DOI] [PMC free article] [PubMed] [Google Scholar]
Associated Data
This section collects any data citations, data availability statements, or supplementary materials included in this article.