

Abstract
Structure elucidation of large membrane protein complexes still comprises a considerable challenge yet is a key factor in drug development and disease combat. Femtosecond nanocrystallography is an emerging technique with which structural information of membrane proteins is obtained without the need to grow large crystals, thus overcoming the experimental riddle faced in traditional crystallography methods. Here, we demonstrate for the first time a microfluidic device capable of sorting membrane protein crystals based on size using dielectrophoresis. We demonstrate the excellent sorting power of this new approach with numerical simulations of selected sub-micrometer beads in excellent agreement with experimental observations. Crystals from batch crystallization broths of the huge membrane protein complex photosystem I were sorted without further treatment, resulting in a high degree of monodispersity and crystallinity in the ~ 100 nm size range. Microfluidic integration, continuous sorting, and nanometer-sized crystal fractions make this method ideal for direct coupling to femtosecond nanocrystallography.
Keywords: dielectrophoresis, sorting, nanocrystallography, membrane protein, microfluidic
The importance of studying membrane proteins lies in their ubiquitous nature, representing 30% of cellular protein content,1 70% of drug targets,2 and their functionality as transporters, signal transduction mediators, and light harvesting centers as well as electron transfer mediators in photosynthesis,3 among other key processes.4 Membrane protein structure elucidation has been ridden with obstacles because of difficulties in forming large crystals necessary for traditional X-ray crystallography,5 in part due to the fact that these proteins are isolated as protein-detergent micelles.6 While smaller crystals may form more easily, they are destroyed by the high dose of radiation necessary to obtain adequate diffraction patterns and therefore cannot be used to obtain high quality structure information by traditional means.7
For these reasons, advancements in X-ray beam technology have furthered the development of new approaches to crystallography such as femtosecond nanocrystallography8–12 to obtain high resolution diffraction patterns from small membrane protein nanocrystals. Accordingly, X-ray exposure time is reduced to the femtosecond regime to outrun nanocrystal X-ray damage so that diffraction patterns can be obtained before the crystal is destroyed. The first proof of principle experiments for femtosecond nanocrystallography have been established with photosystem I (PSI)13 at 8 Å resolution and more recently, protein structure determination at atomic resolution has also been accomplished using this method.12, 14
In order to obtain high resolution diffraction patterns from crystals, a well-ordered crystal is necessary so that the diffracted signal is void of crystal lattice imperfections.7 Consequently, crystals in the sub-500 nm size regime are desired for improved shape transforms, crystal phasing uniformity, and compatibility with the beam diameter of the current state-of-the-art free electron lasers employed for nanocrystallography as well as the jetting system used to introduce crystals to the beam. Variations in crystal size and shape lead to large amounts of single crystal diffraction data with several hundred thousand images needed for one data set, thus a monodispersed sample of nanocrystals with a narrow size distribution could reduce the amount of data required by an order of magnitude. Nanocrystals are also desired for time-resolved studies as diffusion times of reactants into protein crystals are reduced. Obtaining a desired crystal size is difficult due to broad size distributions resulting from traditional crystallization, and moreover, first attempts to isolate nanocrystals such as gravitational settling procedures are time consuming and result in very low percent recoveries of desirably sized crystals.15 Here we present, for the first time, a microfluidic device that can sort and fractionate a bulk crystal solution to isolate a high yield of nanocrystals with a narrow size distribution.
The device (Figure 1a) is a microfluidic sorter in which electroosmosis is responsible for bulk fluid transport and the selective forces deviating particles of various sizes are caused by dielectrophoresis (DEP, see experimental section). A constriction is placed in a wide inlet channel (Figure 1b) to create an inhomogeneous electric field, a method known as insulator-based dielectrophoresis (iDEP).16 This sorter operates in a continuous mode in contrast to other nanoparticle sorting methods utilizing centrifugation17–19 and filtration.20 The latter methods are also critical for precious and low abundant protein nanocrystals as sample loss and crystal fragmentation may occur. Other sorting methods employ conjugated21 or chemically functionalized nanoparticles21, 22 for efficient separation yet are invasive to nanocrystallography and detrimental to downstream applications. Furthermore, free-flow fractionation methods are suitable to separate nanoparticles continuously; however, methods based on free-flow magnetophoresis23–27 require the nanoparticle to have magnetic properties thus cannot be applied to protein nanocrystals. DEP has also been previously applied to free-flow fractionation of nanoparticles,28 has been miniaturized to the microchip format,29–31 and employed to focus particle streams using microfluidic platforms.32, 33 Moreover, the ability to use an iDEP-based sorting design provides additional benefits compared to electrode-based microsorters.34–38 Embedding electrodes complicates device fabrication and can lead to electrode fouling and damage to sample analytes such as precious protein crystals that need to remain intact during sorting for further downstream applications.
Figure 1.

a) Schematic of the entire sorting device (without reservoirs for clarity). A single 100 μm inlet (I) channel is connected to five outlet channels (2 outer channels (O), 2 mid-outer channels (MO), 1 center channel (C)) where sorted fractions are collected. Positive potential (+HV) is applied to the inlet and negative potentials (−HV) are applied to outlets. The total device length is 5 mm. Scale bar is 1 mm. b) Zoomed in schematic of the constriction region connecting the inlet channel to the outlets. The 100 μm wide inlet converges into 30 μm evoking iDEP. In c), areas of high ∇E2 are shaded, in which the largest DEP response is realized. Due to negative DEP, particles are repelled from these areas proportional to their DEP mobilities. Larger particles focus inward towards the center of the device, as shown by the thicker, solid arrows. Conversely, smaller particles that experience less FDEP are deflected into the side outlet channels as illustrated with the thinner, dashed arrows. Scale bar is 20 μm.
Several microchannels are employed for operation: an inlet channel for sample injection and outlet channels to collect various sorted fractions. A reservoir is placed at each channel end to extract sorted particles and place independently controlled electrodes. To establish an inhomogeneous electric field inducing iDEP, an insulating material is shaped into a desired geometry to generate electric field gradients upon application of an external electric field. We demonstrate the proof of principle of this novel sorter with nanometer-sized beads and show that numerical models accounting for the transport process at the constriction are in excellent agreement with experiments. Furthermore, we applied this sorting mechanism to crystals of PSI, a large membrane protein complex consisting of 36 proteins and 381 cofactors.5 These crystals comprise one of the most challenging samples for any sorting device as they are very fragile due to having a solvent content of 78% and only four salt bridges acting as crystal contact sites. Yet, we demonstrate excellent sorting of size-heterogeneous PSI crystal samples using size characterization methods such as dynamic light scattering (DLS) and fluorescence microscopy as well as Second Order Non-linear Imaging of Chiral Crystals (SONICC) as a characterization method for sample crystallinity.
Results and Discussion
A schematic of the crystal sorter is shown in Figure 1 providing the overall channel layout (a) as well as the sorting region (b). The device is 5 mm in total length with a single inlet channel (I) of 100 μm width and 12 μm depth which leads to a series of five outlet channels (O: outer, MO: mid-outer, and C: center). A small overall channel length was selected so that high electric field gradients could be generated with low applied potentials in order to avoid Joule heating effects and sample destruction. The junction between the inlet and outlets is a constriction region (Figure 1b) of 30 μm width where regions of higher gradients of the electric field squared (∇E2) form. This geometry thus evokes DEP forces on nanometer- and micrometer-sized particles streaming through.39–42 The particles flow through the device from the inlet to outlets via electroosmosis and upon entering the constriction region experience a repulsive DEP force from the high gradient region inward caused by negative DEP (nDEP, see also experimental section), indicated as FDEP in Figure 1c. Larger particles with greater DEP mobilities (μDEP) experience more repulsion in this area and are focused into the center outlet (C) as indicated by solid, thick arrows. Conversely, smaller particles with lower μDEP experience less repulsion and are able to deflect into the side outlets (O, MO) as indicated by the thinner, dashed arrows.
Numerical Simulations
Numerical simulations with two representative bead sizes (90 nm and 0.9 μm) were performed to model the sorting efficiency and reveal the influence of DEP on the particle concentration profiles according to details described in the experimental section. In Figure 2a, the concentration distribution for 90 nm and 0.9 μm beads is shown when −20V is applied to all outlet channels (O, MO, C). Both particle sizes completely deflect into all outlet channels, thus no sorting occurs. Figures 2b and 2c represent the concentration distributions for polystyrene bead sorting parameters (−60V center outlet, −20V other outlets), with and without DEP considered. In the non-DEP case (Figure 2b), particles completely deflect into all outlets similar to the conditions of Figure 2a. However, when DEP is added (Figure 2c), a focusing effect on the 0.9 μm particles occurs as seen by > 95% of the initial concentration in the center outlet and < 5% of the initial concentration in the MO and O outlets. Furthermore, the smaller, 90 nm nanoparticles deflect and are equally distributed into all outlet channels (> 95% concentration). The 90 nm particles are effectively isolated in the MO and O outlet channels, thus demonstrating a sorting effect.
Figure 2.
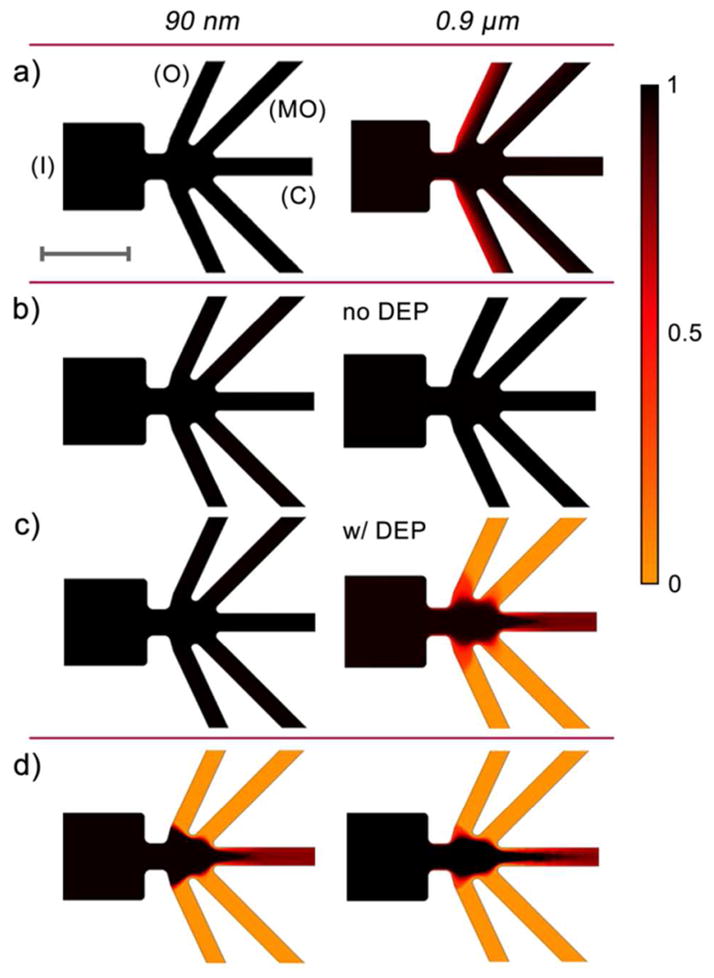
Concentration distributions as obtained from numerical simulations (for details see the experimental section) of 90 nm and 0.9 μm particles in the microsorter at various potential schemes (+10V inlet in all cases). a) −20V in all outlets shows equal distribution for both particle sizes. b) −60V in the center outlet (−20V in all other outlets) with DEP shows focusing of 0.9 μm particles whereas 90 nm particles completely deflect. c) −60V in center outlet without DEP shows deflection of both particle sizes. b) and c) indicate the importance of DEP in the sorting mechanism. d) Increasing the potential in the center outlet to highly negative values (below −80V) can focus both particle sizes, indicating the importance of an optimal potential scheme. The color legend represents the concentration normalized to the inlet concentration. Scale bar is 100 μm.
These aforementioned simulations provide evidence that DEP plays a significant role in the sorting process. Moreover, Figure 2d considers a higher negative potential (< −80V) focusing both the 90 nm and 0.9 μm particles into the center outlet (> 95% concentration) with little deflection into the side outlets (< 5% concentration). The importance of an optimal potential scheme balancing the flow at the constriction with the DEP forces is thus demonstrated with this series of simulations. Altogether, numerical modeling demonstrated that this novel microfluidic sorter provides the needed flexibility to adjust the potentials in each outlet channel to optimize the sorting efficiency.
Bead Sorting
The sorting device was subsequently tested experimentally with 90 nm and 0.9 μm fluorescently labeled polystyrene beads with known nDEP behavior. Beads were suspended in low conductivity buffer (15 μS/cm) to obtain ionic strengths similar to crystallization buffers used with PSI crystals (see below). Channels were dynamically coated with F108 blocking polymer to reduce severe adsorption of polystyrene beads to PDMS channel walls, reduce electroosmotic flow (EOF),43, 44 and avoid clogging due to particle aggregation.45 Bead experiments were initially performed by applying low potentials (−20V to all outlet reservoirs with +10V to the inlet) in order to avoid possible damage to protein crystals in future experiments. At this potential scheme, both bead types flowed into all outlet channels without sorting, which is in agreement with the corresponding simulation for identical potentials (Figure 2a). To induce focusing, a larger negative potential (−80V and below) was applied to the center outlet and the outcome was again in agreement with simulation data (Figure 2d) as both bead sizes focused in the center outlet channel. Finally, the optimum sorting condition was found at approximately −60V in the center outlet while maintaining −20V in all other outlets. The 0.9 μm particles focused into the center outlet (Figure 3a) whereas the 90 nm particles deflected into all outlets (Figure 3b).
Figure 3.
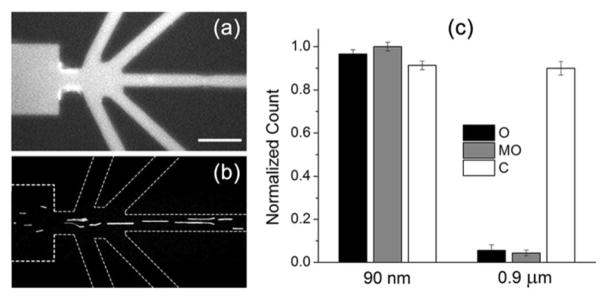
a) Fluorescence microscopy snapshot showing the 90 nm beads distributed in all outlet channels when −60V is applied to the center outlet (−20V to all other outlets). b) Fluorescence microscopy snapshot of the 0.9 μm beads focusing at the same potential scheme as in (a). Scale bar is 50 μm. c) Quantified particle distributions in each outlet channel for both particle sizes as measured by fluorescence intensity for the 90 nm beads and particle counting of 0.9 μm beads (see experimental section for details). A relatively equal distribution is seen for 90 nm beads whereas 90% of the 0.9 μm beads focus into the center outlet. Error bars represent the standard deviation.
Fluorescence intensities of the 90 nm beads in the outlet channels relative to the inlet channel were analyzed and 0.9 μm beads were counted since they are large enough to be imaged individually. An almost equal distribution of 90 nm beads was found in all outlet channels whereas 90% of the 0.9 μm beads focused into the center outlet (Figure 3c). This result is thus in excellent agreement with simulations shown previously in Figure 2c. We attribute this sorting phenomenon to an optimum DEP condition acting on the two bead sizes focusing the larger particles while allowing smaller particles to disperse into the side outlet channels (MO and O). Four trials were further analyzed to determine the sorting efficiency as a percentage defined by the ratio of concentration in the deflected solution versus the initial concentration. Figure 3c indicates that a sorting efficiency of > 90% is achieved for the 90 nm beads in the O and MO channels. For the 0.9 μm beads, a sorting efficiency of 90% in the center (C) outlet is observed. Additionally, because of an equal distribution of smaller, 90 nm particles into all outlets, 80% recovery of these particles is obtained since four of the five outlets contained the smaller, 90 nm particles at approximately the same concentration. These results indicate high recovery of the 90 nm beads with negligible dilution which is ideal for nanocrystallography where the smaller particle size range is targeted. Movies showing the behavior of the two bead sizes under the conditions of Figure 3 are provided in the Supporting Information (Videos S-1 and S-2).
Photosystem I Experiments
PSI crystals were prepared and suspended in a low salt MES buffer containing the detergent β-DDM which forms protein-detergent micelles that mimic the natural lipophilic membrane environment to maintain protein stability and solubility. Interestingly, crystal adsorption to non-coated PDMS channels was insignificant in preliminary experiments. Consequently, the native protein crystallization buffer was used to maintain the optimum environment for crystal stability during all sorting experiments and a channel coating agent was not employed. The procedure to sort crystals was similar to that of the beads, however, lower potentials were used because EOF velocity increases in native PDMS channels.43 Optimal sorting was achieved with −45V applied to the center outlet, −20V to the side outlets, and +10V to the inlet whereby larger crystals migrate towards the center channel and smaller crystals deflect into the MO and O side outlet channels. A fluorescence microscopy snapshot under these conditions is shown in Figure 4a and a movie of this process is available in the Supporting Information (Video S-3). This potential scheme was appropriate under the low ionic strength conditions of PSI; however, this scheme can be adjusted to achieve an effective DEP response from protein crystals that are stable at high ionic strength, if required.
Figure 4.
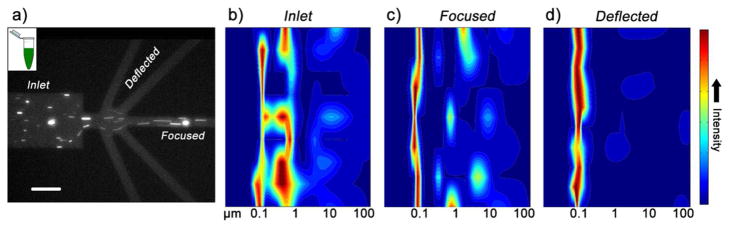
a) Fluorescence image of PSI crystal sorting. Large crystals are shown focusing in the center of the device and smaller particles (as indicated by bulk fluorescence) are deflected into side outlet channels. Scale bar is 50 μm. b) DLS heat map of the bulk crystal solution injected into the inlet and c) of the center outlet focused solution. In (b) and (c), a broad size distribution is determined ranging from approximately 80 nm to 20 μm. d) DLS heat map of the solution deflected into O and MO side outlets from the same experiment showing a narrower size distribution of fractionated nanocrystals around 100 nm in size.
Unlike the simple two-sized bead model, the crystal bulk solution contained a large size distribution making it difficult to determine the crystal sizes being sorted into the side channels via fluorescence microcopy. We thus utilized DLS to characterize sorted PSI crystal fractions.46 Figures 4b–4d show DLS measurements in the form of intensity heat maps for the inlet bulk solution, the combined deflected solutions, and the center outlet solution, respectively. As expected, the bulk solution had a wide size distribution with particle radii ranging from ~ 80 nm to ~ 20 μm. The center outlet shows a similar distribution since particles of all sizes flowed into the center outlet. More importantly, the deflected solutions contained nanocrystals with a size range of ~ 80–200 nm indicating excellent selectivity for the desired size range below 500 nm. It is also worth noting that a DLS signal from the PSI trimer which is ~ 10 nm in size47 is absent, indicating the crystals did not dissociate during sorting and that the sorted solution is mainly PSI crystals. The proposed dielectrophoretic sorter for nanocrystals thus proved suitable to sort PSI nanocrystals in a size range preferred for femtosecond nanocrystallography. This is a vast improvement over current, low yielding settling procedures to isolate nanocrystals from protein crystallization trials of PSI that are currently the only method available to safely harvest nanocrystals.
For complete compatibility with current nanocrystallography instrumentation,48 a sample volume > 250 μl is required. Thus, higher throughput capabilities of our device were tested with multiple PSI sorting experiments (see experimental section for details). To improve the flow rate through the device by a factor of three, a different potential scheme was utilized. Increasing the inlet and center outlet potentials to +60V and −60V, respectively, while decreasing the MO and O side outlet potentials to −5V facilitated sorting at higher flow rates (3 μl/h). To analyze whether this new higher throughput scheme could actually provide a high volume of fractionated nanocrystals, the deflected solutions were extracted from multiple experiments to attain a total volume of 300 μl of deflected solution.
Fluorescence microscopy images of the inlet and center outlet reservoirs can be seen in Figures 5a and 5b. To quantify the sorting efficiency, an imaging threshold analysis was performed to count particles present in the image frame as DLS is not suitable to quantify larger particle sizes and highly polydispersed samples. As expected, both solutions contain a large variation in crystal size. Figures 5c and 5d show histogram distributions of the crystal radii obtained from two image frames of the inlet and center outlet reservoirs. Particles with radii as large as 20 μm were detected in these solutions, which is in agreement with the DLS analysis of the low throughput experiments. Particles in the low micrometer range were present in the largest numbers, indicating their focusing into the center outlet (no deviation into the MO and O outlets).
Figure 5.

a) Fluorescence image of the inlet reservoir and b) of the center outlet reservoir solution after sorting a highly polydispersed, larger volume sample (+60V inlet, −60V center outlet, −5V MO and O side outlets). Scale bars are 50 μm. In c) and d) a histogram of the size distribution from an imaging threshold analysis is shown in which a wide range of particle sizes from 800 nm to 20 μm are detected for both the bulk and center outlet solutions. The lower limit of detection for this method is 800 nm, therefore, nanocrystals below 800 nm could not be individually resolved.
Images of the deflected solution in the outlet reservoirs highly contrasted that seen in the inlet and center outlet reservoirs. As illustrated in Figure 6a, the majority of particles in the reservoir consisted of sizes below the optical resolution limit, indicating that nanocrystals were the major component of this solution. Furthermore, because of the higher concentration of crystals obtained from the high throughput experiment, second harmonic generation imaging analysis could be used to verify crystallinity. This analysis is important to verify the crystalline content of the sorted solution after the crystals were subjected to an electric field. Second harmonic generation via SONICC was utilized due to its powerful imaging capability to exclusively detect protein crystals while not producing signal for the trimer or the majority of salt crystals.49, 50 Figure 6b shows the resulting SONICC image of a droplet of sorted crystals which indicates non-centrosymmetric ordered crystals in the solution and thus verifies that crystallinity is maintained during the sorting process.
Figure 6.

a) Fluorescence microscopy image of the solution in the O outlet reservoir containing the deflected solution (same experiment as Figure 5). As observed, very few particles can be individually resolved compared to the bulk and center outlet reservoirs shown in Figure 5, indicating a high content of nanocrystals. Scale bar is 50 μm. b) SONICC image of the high volume sample indicating crystallinity of the sample after having passed through the sorting device, as indicated by the second harmonic generation signal observed. c) DLS heat map of the deflected solution mainly containing nanocrystals (~ 60–300 nm) with a small contribution from microcrystals. d) Histogram of the DLS measurement: The major peak represents crystals with radii of 100 ± 30 nm, and an overall distribution shows a radii range of ~ 60–300 nm. A small contribution by microcrystals of ~ 1 μm in size is also seen here.
To analyze crystal size in the large volume deflected solution, DLS was again used. Figure 6c shows the DLS heatmap of the deflected solution and Figure 6d shows a histogram of particle radius with respect to counts for the corresponding DLS run. The major peak corresponds to a 100 ± 30 nm radius and a slight increase in the overall radius distribution compared to the lower throughput sorting (Figure 4) is observed with an overall radius distribution of ~ 60–300 nm and a small contribution from particles with radii of ~ 1 μm. The slight broadening of the main peak could be due to the duration of the experiment and the equilibrium between the crystal and surrounding solution where protein molecules are gained and lost over time causing larger crystals to form at the expense of smaller crystals. This “high throughput” experiment demonstrates the capability of this novel microfluidic sorter to provide large (~ 300 μl) volumes of fractionated nanocrystals without considerable dilution in the side channels. Moreover, the size distribution remains narrow and within the realm desired for femtosecond nanocrystallography.
Conclusions
We demonstrated a novel sorter for nanoparticles and large membrane protein complex crystals realized within a microfluidic device employing DEP. Numerical simulations of the sorting device first demonstrated its suitability for particle sorting of solutions containing sub-micrometer particles. Optimal conditions for polystyrene bead sorting revealed in numerical modeling were in excellent agreement with experimental results employing 90 nm and 0.9 μm beads. Applying similar conditions in low conductivity buffer to PSI crystals demonstrated that nanocrystals of ~ 100 nm in size can be isolated from a bulk solution containing a broad crystal size range. Even when multiple experiments were performed to provide a large volume of sorted sample, the process was reproducible and resulted in a large volume (~ 300 μL) of fractionated nanocrystals (~ 60–300 nm). This volume is in the range typically required for nanocrystallography experiments and we have applied for beam time to test the sorted PSI crystals at the Linac Coherent Light Source. Furthermore, PSI remained crystalline as it passed through the sorting system as confirmed by second harmonic generation imaging. The flexibility of this device thus allows fine-tuning for optimal separation of delicate particles such as protein crystals even in the demonstrated case of fragile, PSI nanocrystals exhibiting high solvent content.
In the future, isolated nanocrystals extracted from the presented microfluidic chips can be delivered to femtosecond nanocrystallography experiments for membrane protein structure determination. The described method represents a relatively simple microfabrication method, comprised of elastomer molding procedures and can thus be seamlessly used in crystallography laboratories. Applied potentials are below 100V and can be provided through readily available voltage sources. Furthermore, for protein crystals in high ionic strength buffers, experimental parameters (i.e. electric potentials) can be adjusted to improve the DEP response, or in more extreme cases, the device design can be tailored to accommodate a given DEP characteristic. We thus expect our method to be easily applied to a large variety of protein crystals and to be highly relevant to the endeavor of protein structure determination via nanocrystallography. Besides reservoir recovery, the employed microfabrication method could also be directly coupled to a similarly fabricated nozzle51 to deliver crystals for femtosecond nanocrystallography. These optimal samples would aid in improving the efficiency of protein crystallography afforded by this new technology, enabling structure elucidation and a new understanding of many proteins with unknown structures that catalyze key functions in biology.
Experimental
Numerical Simulations
To evoke DEP52 in the nanocrystal sorting device, electric field gradients (∇E) are created at the constriction region as demonstrated in Figure 1c. The dielectrophoretic force, FDEP, acting at the constriction region is given by Equation 1:53
| (1) |
where r is the particle radius, εm is the medium permittivity, and fCM is the Clausius-Mossotti factor. The dependency of FDEP on r is exploited to sort particles by size within the microfluidic device. The sign of the DEP force is governed by fCM, which under direct current (DC) conditions, is defined by the medium and particle conductivities, σm and σp:54
| (2) |
For the polystyrene beads employed in the modeling study as well as proof of principle experiments, σp was considered negligible,30 therefore fCM is negative and nDEP prevails, in which particles experience more repulsion from regions with higher ∇E2.
Two particle sizes (90 nm and 0.9 μm) representative of the polystyrene bead experiments were modeled using Comsol Multiphysics 4.3. The DEP component was accounted for by the DEP velocity (uDEP) and mobility (μDEP):29
| (3) |
Considering a fCM of −0.5, μDEP values for the 90 nm and 0.9 μm particles were calculated to be −1.05 × 10⁻²¹ m4/V2·s and −1.05 × 10⁻¹⁹ m4/V2·s, respectively. A two order of magnitude difference is apparent, reflecting the greater DEP response from the larger particles. In the case when no DEP contribution was considered, μDEP was set to zero. Additionally, the electrokinetic (EK) component was accounted for by the electrokinetic velocity (uEK) and mobility (μEK):
| (4) |
where μEO is the electroosmotic mobility, μEP is the electrophoretic mobility, and E is the electric field strength. Because polystyrene particles are large and exhibit negligible surface charge, the electrophoretic component is considered small compared to the electroosmotic mobility.55 Thus, μEP was neglected and a μEO of 1.5 × 10⁻⁸ m2/V·s, as previously determined in similar devices and buffer conditions,43 substituted for μEK.
Diffusion coefficients, D, for each particle size were calculated using the Stokes-Einstein equation, resulting in values of 4.9 × 10⁻¹² m2/s and 4.9 × 10⁻¹³ m2/s for the 90 nm and 0.9 μm particles, respectively. Concentration profiles were obtained by computing the total flux, J, incorporating DEP, EK, and diffusion:56
| (5) |
The system was solved at steady state, therefore:
| (6) |
The device geometry drawn in the software was an exact replicate (sans reservoirs) of the microfluidic channel system used experimentally. The solution conductivity used for all simulations was 15 μS/cm and applied potentials were +10V in the inlet (I), −20V in the side outlets (MO and O), and ranged from −20V to −80V in the center outlet (C). The Transport of Diluted Species package incorporated the μDEP and D for each particle size using the values presented above. The numerical model was solved for the electric field and creeping flow driven by EOF, which allowed for the transport of the particles to be calculated. With this modeling framework, concentration profiles were acquired for the constriction region and surrounding channel sections as shown in Figure 2 and discussed in the results and discussion section.
Materials and Chemicals
SU-8 photoresist was purchased from Microchem, USA. N-dodecyl-beta-maltoside (β-DDM) was from Glycon Biochemicals, Germany. 2-(N-morpholino)ethanesulfonic acid (MES), 4-(2-hydroxyethyl)piperazine-1-ethanesulfonic acid (HEPES), and poly(ethylene glycol)-block-poly(propylene glycol)-block-poly(ethylene glycol) (brand name Pluronic® F108) were from Sigma-Aldrich, USA. Fluorescently labeled polystyrene beads (1% w/v in aqueous suspension) with diameters of 90 nm (“pink”, Ex: 570 nm, Em: 590 nm) and 0.9 μm (“yellow”, Ex: 470 nm, Em: 490 nm) were obtained from Spherotech, USA. Polydimethylsiloxane (PDMS) (Sylgard® 184) was from Dow Corning, USA and glass microscopy slides were purchased from Fisher Scientific, USA.
Device Fabrication
The microfluidic sorter was fabricated using standard photolithography and soft lithography as reported previously.42 Briefly, AutoCAD software (Autodesk, USA) was used to design the sorting structure that was transferred to a chrome mask (Photosciences, USA). The mask was then used to create a silicon master wafer by patterning structures with the negative photoresist SU-8 via photolithography employing suitable exposure and developing steps. A PDMS mold was cast using the master wafer as a template in which the negative relief of the structure formed microchannels in the polymer. The complete device structure was removed from the mold, cut, and reservoirs were punched at the channel ends. The PDMS slab was then irreversibly bonded to a glass microscope slide using oxygen plasma treatment to create a sealed channel system.
Photosystem I crystallization
PSI was purified and crystallized as previously described.15 Briefly, PSI trimers isolated from the cyanobacterium Thermosynechococcus elongatus were completely dissolved in 5mM MES buffer containing 0.02% β-DDM and a high concentration of MgSO4 (typically 100–150 mM) at pH 6.4. Nucleation is induced by depleting the salt concentration via the dropwise addition of MgSO4-free buffer to achieve a final salt concentration of 6 mM MgSO4. The concentration of protein in this low ionic strength solution is then slowly increased to a chlorophyll concentration of 10 mM, corresponding to a protein concentration of 35 μM PSI trimer, and the solution is allowed to incubate overnight for crystallization to occur. The crystals are then subjected to several washing steps with buffer containing 3 mM MgSO4 and suspended in MgSO4-free buffer containing 5mM MES and 0.02% β-DDM (pH 6.4).
Sorting Experiments
For polystyrene bead experiments, 5 μl of 20 mM HEPES, 1 mM F108 buffer (pH 5.1) was added to all outlet reservoirs to fill channels via capillary action. 90 nm (size confirmed by DLS) and 0.9 μm polystyrene beads were diluted and mixed in the same buffer and sonicated to create homogenous dispersions. The 1% stock solution was used at a final dilution of 1:2000 (0.9 μm beads) and 1:1000 (90 nm beads).
For PSI experiments, crystals were suspended in their MgSO4-free crystallization buffer (5mM MES, 0.02% β-DDM detergent, pH 6.4). Platinum wire electrodes were placed in all reservoirs and electrodes from a multichannel DC voltage source (HVS448, Labsmith, USA) were connected. 5 μl of particle/crystal suspension was added to the inlet reservoir and Labsmith Sequence software (ver. 1.15, Labsmith, USA) was used to manually control each electrode voltage independently. Sorting experiments were generally run for 30 minutes during method development and testing. In addition to single run, small volume experiments, a scale up sorting experiment was performed with PSI to attain a total sorted sample volume of 300 μl. In this case, the small volume sorting experiment was performed 15 times at 3 hour durations per run to obtain a total of 300 μl of sorted nanocrystals from the MO and O reservoirs (see Figure 1).
Imaging of polystyrene beads was performed using a fluorescence microscope (IX71, Olympus, USA) with a dual band filter set (GFP/DsRed, Semrock, USA) to narrow the fluorescence excitation and emission to that of the bead fluorophores. The filter set contained a 468/34–553/24 nm exciter, 512/23–630/91 nm emitter, and 493–574 nm dichroic. An attached optical beamsplitter (Optosplit, Cairn Research, UK) containing 510/20 nm and 655/40 nm emission filters and a 580 nm dichroic mirror (Semrock, USA) was used to separate the fluorescence signal from each bead type into its own frame using a single b/w CCD camera (iXon, Andor, UK). Imaging of PSI crystals was performed using fluorescence microscopy with a microscope filter set containing a 470/40 nm excitation filter, 580 nm dichroic mirror (Semrock, USA), and a 690/70 nm emission filter (Chroma, USA). The optical beamsplitter was not employed for crystal sorting experiments. Micro-Manager (ver. 1.4, UCSF, USA) and ImageJ (ver. 1.46, NIH, USA) software were used for image acquisition, processing, and analysis.
Sample Analysis
For polystyrene beads, 90 nm bead data was analyzed using fluorescence intensity in microchannel sections due to resolution limits of these smaller beads. Bead concentrations in each outlet channel were determined by comparing the fluorescence intensities of the outlet channels to that of the inlet channel. For 0.9 μm bead data, the Image J particle tracking plugin was used to count particles in the outlet channels for quantitative analysis.
For PSI small volume experiments, DLS (Spectro Size 302, Molecular Dimensions, USA) was used to analyze reservoir solutions and determine particle size distributions. After sorting crystals for approximately one hour, reservoir solutions were extracted with a transfer pipette and stored at 4°C. A 3 μl hanging droplet was setup in a 24 well crystallization plate and aligned to the DLS laser until a response signal was obtained. Each sample was subjected to 10 consecutive measurements lasting 30 seconds which were combined to intensity heat maps. For the large volume PSI experiments, DLS and second harmonic generation microscopy imaging via SONICC (SONICC instrument, Formulatrix, USA) were performed on the sorted solution to confirm nanocrystal isolation and post-sorting integrity of protein crystals, respectively. To quantify crystal sizes in the center reservoirs, an imaging threshold analysis was further performed to count particles present in the image frame. The image frame dimensions in pixels were scaled to micrometers and areas were obtained for each of the traced particles to calculate particle radius, assuming a spherical geometry. The lower limit of detection for this method was approximately 800 nm due to the inability to differentiate smaller particles.
Supplementary Material
Acknowledgments
Financial Support from the National Institute of General Medical Sciences, National Institute of Health, grant #R01-GM095583 is gratefully acknowledged. We also thank M. Jaworski for his help in drawing Figure 1b.
Footnotes
Supporting Information Available: Includes Videos S-1, S-2, and S-3. This material is available free of charge via the Internet at http://pubs.acs.org.
References
- 1.Almén MS, Nordström KJ, Fredriksson R, Schiöth HB. Mapping the Human Membrane Proteome: A Majority of the Human Membrane Proteins Can Be Classified According to Function and Evolutionary Origin. BMC Biol. 2009;7:50. doi: 10.1186/1741-7007-7-50. [DOI] [PMC free article] [PubMed] [Google Scholar]
- 2.Lundstrom K. Structural Genomics and Drug Discovery. J Cell Mol Med. 2007;11:224–238. doi: 10.1111/j.1582-4934.2007.00028.x. [DOI] [PMC free article] [PubMed] [Google Scholar]
- 3.Schubert WD, Klukas O, Krauss N, Saenger W, Fromme P, Witt HT. Photosystem I of Synechococcus Elongatus at 4 a Resolution: Comprehensive Structure Analysis. J Mol Biol. 1997;272:741–769. doi: 10.1006/jmbi.1997.1269. [DOI] [PubMed] [Google Scholar]
- 4.Fromme P, Spence JC. Femtosecond Nanocrystallography Using X-Ray Lasers for Membrane Protein Structure Determination. Curr Opin Struct Biol. 2011;21:509–516. doi: 10.1016/j.sbi.2011.06.001. [DOI] [PMC free article] [PubMed] [Google Scholar]
- 5.Jordan P, Fromme P, Witt HT, Klukas O, Saenger W, Krauss N. Three-Dimensional Structure of Cyanobacterial Photosystem I at 2. 5 a Resolution. Nature. 2001;411:909–917. doi: 10.1038/35082000. [DOI] [PubMed] [Google Scholar]
- 6.Fromme P, Witt HT. Improved Isolation and Crystallization of Photosystem I for Structural Analysis. Biochim Biophys Acta, Bioenerg. 1998;1365:175–184. [Google Scholar]
- 7.Hunter MS, DePonte DP, Shapiro DA, Kirian RA, Wang X, Starodub D, Marchesini S, Weierstall U, Doak RB, Spence JC, et al. X-Ray Diffraction from Membrane Protein Nanocrystals. Biophys J. 2011;100:198–206. doi: 10.1016/j.bpj.2010.10.049. [DOI] [PMC free article] [PubMed] [Google Scholar]
- 8.Chapman HN. X-Ray Imaging Beyond the Limits. Nat Mater. 2009;8:299–301. doi: 10.1038/nmat2402. [DOI] [PubMed] [Google Scholar]
- 9.Spence JC, Weierstall U, Chapman HN. X-Ray Lasers for Structural and Dynamic Biology. Rep Prog Phys. 2012;75:102601. doi: 10.1088/0034-4885/75/10/102601. [DOI] [PubMed] [Google Scholar]
- 10.Johansson LC, Arnlund D, White TA, Katona G, Deponte DP, Weierstall U, Doak RB, Shoeman RL, Lomb L, Malmerberg E, et al. Lipidic Phase Membrane Protein Serial Femtosecond Crystallography. Nat Methods. 2012;9:263–265. doi: 10.1038/nmeth.1867. [DOI] [PMC free article] [PubMed] [Google Scholar]
- 11.Koopmann R, Cupelli K, Redecke L, Nass K, Deponte DP, White TA, Stellato F, Rehders D, Liang M, Andreasson J, et al. In vivo Protein Crystallization Opens New Routes in Structural Biology. Nat Methods. 2012;9:259–262. doi: 10.1038/nmeth.1859. [DOI] [PMC free article] [PubMed] [Google Scholar]
- 12.Redecke L, Nass K, DePonte DP, White TA, Rehders D, Barty A, Stellato F, Liang M, Barends TR, Boutet S, et al. Natively Inhibited Trypanosoma Brucei Cathepsin B Structure Determined by Using an X-Ray Laser. Science. 2013;339:227–230. doi: 10.1126/science.1229663. [DOI] [PMC free article] [PubMed] [Google Scholar]
- 13.Chapman HN, Fromme P, Barty A, White TA, Kirian RA, Aquila A, Hunter MS, Schulz J, DePonte DP, Weierstall U, et al. Femtosecond X-Ray Protein Nanocrystallography. Nature. 2011;470:73–77. doi: 10.1038/nature09750. [DOI] [PMC free article] [PubMed] [Google Scholar]
- 14.Boutet S, Lomb L, Williams GJ, Barends TR, Aquila A, Doak RB, Weierstall U, DePonte DP, Steinbrener J, Shoeman RL, et al. High-Resolution Protein Structure Determination by Serial Femtosecond Crystallography. Science. 2012;337:362–364. doi: 10.1126/science.1217737. [DOI] [PMC free article] [PubMed] [Google Scholar]
- 15.Hunter MS, Fromme P. Toward Structure Determination Using Membrane-Protein Nanocrystals and Microcrystals. Methods. 2011;55:387–404. doi: 10.1016/j.ymeth.2011.12.006. [DOI] [PMC free article] [PubMed] [Google Scholar]
- 16.Srivastava SK, Gencoglu A, Minerick AR. Dc Insulator Dielectrophoretic Applications in Microdevice Technology: A Review. Anal Bioanal Chem. 2011;399:301–321. doi: 10.1007/s00216-010-4222-6. [DOI] [PubMed] [Google Scholar]
- 17.Novak JP, Nickerson C, Franzen S, Feldheim DL. Purification of Molecularly Bridged Metal Nanoparticle Arrays by Centrifugation and Size Exclusion Chromatography. Anal Chem. 2001;73:5758–5761. doi: 10.1021/ac010812t. [DOI] [PubMed] [Google Scholar]
- 18.Majewski P, Krysiński P. Synthesis, Surface Modifications, and Size-Sorting of Mixed Nickel-Zinc Ferrite Colloidal Magnetic Nanoparticles. Chem--Eur J. 2008;14:7961–7968. doi: 10.1002/chem.200800369. [DOI] [PubMed] [Google Scholar]
- 19.Chen G, Wang Y, Tan LH, Yang M, Tan LS, Chen Y, Chen H. High-Purity Separation of Gold Nanoparticle Dimers and Trimers. J Am Chem Soc. 2009;131:4218–4219. doi: 10.1021/ja900809z. [DOI] [PubMed] [Google Scholar]
- 20.Akthakul A, Hochbaum AI, Stellacci F, Mayes AM. Size Fractionation of Metal Nanoparticles by Membrane Filtration. Adv Mater. 2005;17:532–535. [Google Scholar]
- 21.Gerion D, Parak WJ, Williams SC, Zanchet D, Micheel CM, Alivisatos AP. Sorting Fluorescent Nanocrystals with DNA. J Am Chem Soc. 2002;124:7070–7074. doi: 10.1021/ja017822w. [DOI] [PubMed] [Google Scholar]
- 22.Yang J, Lee JY, Too HP. Size Sorting of Au and Pt Nanoparticles from Arbitrary Particle Size Distributions. Anal Chim Acta. 2005;546:133–138. [Google Scholar]
- 23.Jores K, Mehnert W, Drechsler M, Bunjes H, Johann C, Mäder K. Investigations on the Structure of Solid Lipid Nanoparticles (Sln) and Oil-Loaded Solid Lipid Nanoparticles by Photon Correlation Spectroscopy, Field-Flow Fractionation and Transmission Electron Microscopy. J Controlled Release. 2004;95:217–227. doi: 10.1016/j.jconrel.2003.11.012. [DOI] [PubMed] [Google Scholar]
- 24.Pamme N, Manz A. On-Chip Free-Flow Magnetophoresis: Continuous Flow Separation of Magnetic Particles and Agglomerates. Anal Chem. 2004;76:7250–7256. doi: 10.1021/ac049183o. [DOI] [PubMed] [Google Scholar]
- 25.Latham AH, Freitas RS, Schiffer P, Williams ME. Capillary Magnetic Field Flow Fractionation and Analysis of Magnetic Nanoparticles. Anal Chem. 2005;77:5055–5062. doi: 10.1021/ac050611f. [DOI] [PubMed] [Google Scholar]
- 26.Pamme N, Wilhelm C. Continuous Sorting of Magnetic Cells via on-Chip Free-Flow Magnetophoresis. Lab Chip. 2006;6:974–980. doi: 10.1039/b604542a. [DOI] [PubMed] [Google Scholar]
- 27.Calzolai L, Gilliland D, Garcìa CP, Rossi F. Separation and Characterization of Gold Nanoparticle Mixtures by Flow-Field-Flow Fractionation. J Chromatogr, A. 2011;1218:4234–4239. doi: 10.1016/j.chroma.2011.01.017. [DOI] [PubMed] [Google Scholar]
- 28.Gascoyne PR, Vykoukal J. Particle Separation by Dielectrophoresis. Electrophoresis. 2002;23:1973–1983. doi: 10.1002/1522-2683(200207)23:13<1973::AID-ELPS1973>3.0.CO;2-1. [DOI] [PMC free article] [PubMed] [Google Scholar]
- 29.Srivastava SK, Artemiou A, Minerick AR. Direct Current Insulator-Based Dielectrophoretic Characterization of Erythrocytes: Abo-Rh Human Blood Typing. Electrophoresis. 2011;32:2530–2540. doi: 10.1002/elps.201100089. [DOI] [PubMed] [Google Scholar]
- 30.Srivastava SK, Baylon-Cardiel JL, Lapizco-Encinas BH, Minerick AR. A Continuous Dc-Insulator Dielectrophoretic Sorter of Microparticles. J Chromatogr, A. 2011;1218:1780–1789. doi: 10.1016/j.chroma.2011.01.082. [DOI] [PubMed] [Google Scholar]
- 31.Salomon S, Leichlé T, Nicu L. A Dielectrophoretic Continuous Flow Sorter Using Integrated Microelectrodes Coupled to a Channel Constriction. Electrophoresis. 2011;32:1508–1514. doi: 10.1002/elps.201000675. [DOI] [PubMed] [Google Scholar]
- 32.Fiedler S, Shirley SG, Schnelle T, Fuhr G. Dielectrophoretic Sorting of Particles and Cells in a Microsystem. Anal Chem. 1998;70:1909–1915. doi: 10.1021/ac971063b. [DOI] [PubMed] [Google Scholar]
- 33.Müller T, Gradl G, Howitz S, Shirley S, Schnelle T, Fuhr G. A 3-D Microelectrode System for Handling and Caging Single Cells and Particles. Biosens Bioelectron. 1999;14:247–256. [Google Scholar]
- 34.Holmes D, Sandison ME, Green NG, Morgan H. On-Chip High-Speed Sorting of Micron-Sized Particles for High-Throughput Analysis. IEE Proc : Nanobiotechnol. 2005;152:129–135. doi: 10.1049/ip-nbt:20050008. [DOI] [PubMed] [Google Scholar]
- 35.Kralj JG, Lis MT, Schmidt MA, Jensen KF. Continuous Dielectrophoretic Size-Based Particle Sorting. Anal Chem. 2006;78:5019–5025. doi: 10.1021/ac0601314. [DOI] [PubMed] [Google Scholar]
- 36.Bligh M, Stanley KG, Hubbard T, Kujath M. Sorting Microparticles into Lateral Streams Using a Two-Phase Rectangular Electrokinetic Array. J Micromech Microeng. 2008;18:045002. [Google Scholar]
- 37.Pommer MS, Zhang Y, Keerthi N, Chen D, Thomson JA, Meinhart CD, Soh HT. Dielectrophoretic Separation of Platelets from Diluted Whole Blood in Microfluidic Channels. Electrophoresis. 2008;29:1213–1218. doi: 10.1002/elps.200700607. [DOI] [PubMed] [Google Scholar]
- 38.Cheng IF, Froude VE, Zhu Y, Chang HC. A Continuous High-Throughput Bioparticle Sorter Based on 3d Traveling-Wave Dielectrophoresis. Lab Chip. 2009;9:3193–3201. doi: 10.1039/b910587e. [DOI] [PubMed] [Google Scholar]
- 39.Lapizco-Encinas BH, Simmons BA, Cummings EB, Fintschenko Y. Insulator-Based Dielectrophoresis for the Selective Concentration and Separation of Live Bacteria in Water. Electrophoresis. 2004;25:1695–1704. doi: 10.1002/elps.200405899. [DOI] [PubMed] [Google Scholar]
- 40.Nakano A, Chao TC, Camacho-Alanis F, Ros A. Immunoglobulin G and Bovine Serum Albumin Streaming Dielectrophoresis in a Microfluidic Device. Electrophoresis. 2011;32:2314–2322. doi: 10.1002/elps.201100037. [DOI] [PMC free article] [PubMed] [Google Scholar]
- 41.Martinez-Duarte R. Microfabrication Technologies in Dielectrophoresis Applications--a Review. Electrophoresis. 2012;33:3110–3132. doi: 10.1002/elps.201200242. [DOI] [PubMed] [Google Scholar]
- 42.Nakano A, Camacho-Alanis F, Chao TC, Ros A. Tuning Direct Current Streaming Dielectrophoresis of Proteins. Biomicrofluidics. 2012;6:034108. doi: 10.1063/1.4742695. [DOI] [PMC free article] [PubMed] [Google Scholar]
- 43.Hellmich W, Regtmeier J, Duong TT, Ros R, Anselmetti D, Ros A. Poly(Oxyethylene) Based Surface Coatings for Poly(Dimethylsiloxane) Microchannels. Langmuir. 2005;21:7551–7557. doi: 10.1021/la0510432. [DOI] [PubMed] [Google Scholar]
- 44.Viefhues M, Manchanda S, Chao TC, Anselmetti D, Regtmeier J, Ros A. Physisorbed Surface Coatings for Poly(Dimethylsiloxane) and Quartz Microfluidic Devices. Anal Bioanal Chem. 2011;401:2113–2122. doi: 10.1007/s00216-011-5301-z. [DOI] [PMC free article] [PubMed] [Google Scholar]
- 45.Bhattacharya S, Chao TC, Ros A. Insulator-Based Dielectrophoretic Single Particle and Single Cancer Cell Trapping. Electrophoresis. 2011;32:2550–2558. doi: 10.1002/elps.201100066. [DOI] [PubMed] [Google Scholar]
- 46.Berne B, Pecora R. Dynamic Light Scattering: With Applications to Chemistry, Biology, and Physics. John Wiley & Sons; New York, USA: 1976. [Google Scholar]
- 47.Boekema EJ, Dekker JP, van Heel MG, Rögner M, Saenger W, Witt I, Witt HT. Evidence for a Trimeric Organization of the Photosystem I Complex from the Thermophilic Cyanobacterium Synechococcus Sp. FEBS Lett. 1987;217:283–286. [Google Scholar]
- 48.Weierstall U, Spence JC, Doak RB. Injector for Scattering Measurements on Fully Solvated Biospecies. Rev Sci Instrum. 2012;83:035108. doi: 10.1063/1.3693040. [DOI] [PubMed] [Google Scholar]
- 49.Wampler RD, Kissick DJ, Dehen CJ, Gualtieri EJ, Grey JL, Wang HF, Thompson DH, Cheng JX, Simpson GJ. Selective Detection of Protein Crystals by Second Harmonic Microscopy. J Am Chem Soc. 2008;130:14076–14077. doi: 10.1021/ja805983b. [DOI] [PMC free article] [PubMed] [Google Scholar]
- 50.Kissick DJ, Wanapun D, Simpson GJ. Second-Order Nonlinear Optical Imaging of Chiral Crystals. Annu Rev Anal Chem. 2011;4:419–437. doi: 10.1146/annurev.anchem.111808.073722. [DOI] [PMC free article] [PubMed] [Google Scholar]
- 51.Doak RB, DePonte DP, Nelson G, Camacho-Alanis F, Ros A, Spence JC, Weierstall U. Microscopic Linear Liquid Streams in Vacuum: Injection of Solvated Biological Samples into X-Ray Free Electron Lasers. Proceedings of the 28th International Symposium on Rarefied Gas Dynamics. 2012;1501:1314–1323. [Google Scholar]
- 52.Pohl HA. Biophysical Aspects of Dielectrophoresis. J Biol Phys. 1973;1:1–16. [Google Scholar]
- 53.Pohl HA. Dielectrophoresis: The Behavior of Neutral Matter in Nonuniform Electric Fields. Cambridge University Press; Cambridge, UK: 1978. [Google Scholar]
- 54.Ozuna-Chacón S, Lapizco-Encinas BH, Rito-Palomares M, Martínez-Chapa SO, Reyes-Betanzo C. Performance Characterization of an Insulator-Based Dielectrophoretic Microdevice. Electrophoresis. 2008;29:3115–3122. doi: 10.1002/elps.200700865. [DOI] [PubMed] [Google Scholar]
- 55.Green NG, Morgan H. Dielectrophoresis of Submicrometer Latex Spheres. 1. Experimental Results. J Phys Chem B. 1998;103:41–50. [Google Scholar]
- 56.Cummings EB, Singh AK. Dielectrophoresis in Microchips Containing Arrays of Insulating Posts: Theoretical and Experimental Results. Anal Chem. 2003;75:4724–4731. doi: 10.1021/ac0340612. [DOI] [PubMed] [Google Scholar]
Associated Data
This section collects any data citations, data availability statements, or supplementary materials included in this article.