

Abstract
Self-assembly of small molecules, as a more common phenomenon than one previously thought, can be either beneficial or detrimental to cells. Despite its profound biological implications, how the self-assembly of small molecules behave in cellular environment is largely unknown and barely explored. This work studies four fluorescent molecules that consist of the same peptidic backbone (e.g., Phe-Phe-Lys) and enzyme trigger (e.g., a phosphotyrosine residue), but bear different fluorophores on the side chain of the lysine residue of the peptidic motif. These molecules, however, exhibit different ability of self-assembly before and after enzymatic transformation (e.g., dephosphorylation). Fluorescent imaging reveals that self-assembly directly affects the distribution of these small molecules in cellular environment. Moreover, cell viability tests suggest that the states and the location of the molecular assemblies in the cellular environment control the phenotypes of the cells. For example, the molecular nanofibers of one of the small molecules apparently stabilize actin filaments and alleviate the insult of an F-actin toxin (e.g., latrunculin A). Combining fluorescent imaging and enzyme-instructed self-assembly of small peptidic molecules, this work not only demonstrates that self-assembly as a key factor for dictating the spatial distribution of small molecules in cellular environment. In addition, it illustrates a useful approach, based on enzyme-instructed self-assembly of small molecules, to modulate spatiotemporal profiles of small molecules in cellular environment, which allows the use of the emergent properties of small molecules to control the fate of cells.
INTRODUCTION
This article reports the imaging of spatiotemporal distribution of four different fluorescent small molecules in cellular environment and illustrates molecular self-assembly for governing the distribution of small molecules to control cell behaviors. As a ubiquitous process in nature, endogenous protein monomers self-organize to form certain structures (e.g., filaments of actin, vinculin, and tubulin)1 in the cellular environment, which are indispensable for normal cellular functions (e.g., cell migration, mitosis, and mass transportation). More importantly, cellular functions rely on the kinetics of assembly, disassembly, and reorganization of protein monomers/filaments instead of a static state. Regulated by relevant enzymes and co-factors, these highly dynamic behaviors of protein assemblies not only lead to varied spatiotemporal profiles of proteins,2 but also highlight the unique emergent properties of molecular assemblies or aggregates. For example, the functions of tubulin filaments (e.g., as part of the machinery of mitosis) drastic differ from the functions of a single tubulin (e.g., as a GTPase).3 Like proteins, small molecules also self-assemble to form supramolecular structures that are capable to modulate cell differentiation,4 to maintain cell growth,5-6 or to induce cell death.7-9 Moreover, the investigation of the false positives from high throughput drug screening confirms that the aggregates of small molecules are able to sequester enzymes, unfold proteins, and interact with cell surface receptors.10-11 Despite these intriguing results, it remains largely unknown that how the assemblies (or aggregates) of small molecules behave in cellular environments to affect cells. Therefore, it is necessary and useful to develop a facile and reliable method for evaluating the spatiotemporal profiles of the self-assembly (or aggregates) of small molecules in cellular environment.
The rapid development of molecular imaging at the end of last century has tremendously advanced the understanding of the distribution of proteins in cellular environment. Coupling with the development of fluorescence microscopy,12-13 the discovery and exploration of green fluorescence protein (GFP) has brought a groundbreaking methodology that are revolutionizing cell biology since it permits tracking the proteins of interest in living organisms.14 Proper gene fusion allows the protein of interest to be GFP-tagged, which is readily visualized under a fluorescent microscope over time to reveal the spatiotemporal profiles of the proteins of interest.15 While fluorescent protein tag is a mature methodology that helps elucidate the functions of a wide range of proteins16-17 or some glycoproteins in various sophisticated biological processes, small molecular fluorescent probes are just beginning to be used for assaying the self-assembly of small molecules in cellular environment. For example, Rao and coworkers have demonstrated a furin catalyzed chemical condensation to form oligomers for imaging the protease activity in a single living cell.18 Although the cell-compatible furin substrate condenses to form oligomer upon enzymatic activation, the covalent oligomerization is irreversible and hardly addresses the behaviors of the assemblies of small molecules formed via supramolecular interactions. Based on our exploration of enzyme-instructed self-assembly of small molecules,19-22 we have demonstrated the first example of imaging enzyme-triggered self-assembly of small molecules inside live cells.23 In that study, we incorporate a fluorophore, nitrobenzoxadiazole (NBD)24 into a precursor (e.g., 2a), which forms a hydrogelator (3a) upon the action of an enzyme (e.g., phosphatases) (Figure 1). While the monomeric precursor (2a) fluoresces weakly, the assemblies of the hydrogelators (3a) give high fluorescent contrast against the background. This unique feature allows us to establish that a highly active phosphatase, PTP1B, located at the outer membrane of endoplasmic reticulum (ER), catalyzes the formation of molecular assemblies (as nanofibers) via the self-assembly of the hydrogelators when the PTP1B, intracellularly, converts the precursors to the hydrogelators.23, 25
Figure 1.
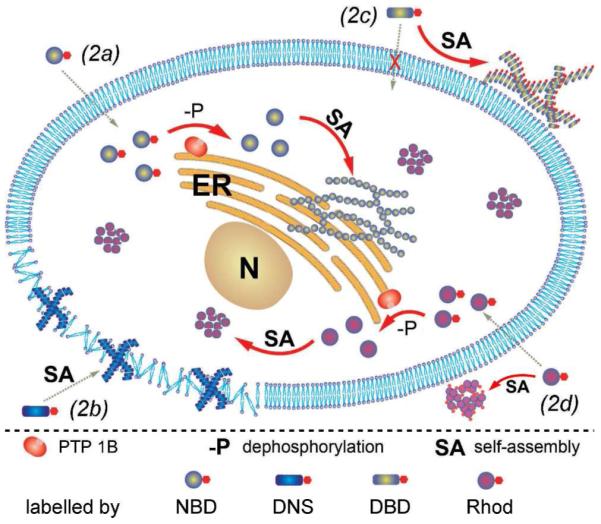
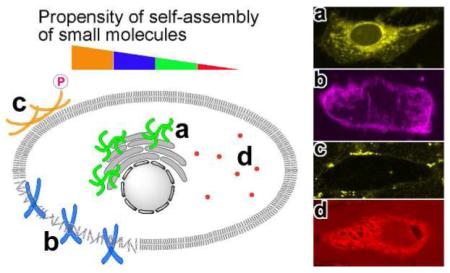
Illustration of the distinct spatial distribution of the small molecules in cellular environment due to their different propensity of self-assembly before or after dephosphorylation.
The successful imaging of the fluorescent molecular nanofibers formed by the self-assembly of small molecules in live cells encouraged us, in this work, to use other fluorophores to evaluate the self-assembly of small molecules in cell environment. As shown in Scheme 1, we replace NBD on 2a with three commonly used fluorophores (i.e., dansyl (DNS),26 4-(N,N-dimethylsulfamoyl)-2,1,3-benzoxadiazole (DBD),27 and rhodamine28) and obtain the analogues of 2a (i.e., 2b, 2c, and 2d). Despite they all contain the same peptidic backbone (i.e., Phe-Phe-Lys) and a tyrosine phosphate residue, the resulting molecules (2b, 2c, and 2d) exhibit drastically different states of self-assembly (or aggregation) even before the action of alkaline phosphatase in vitro, according to several complementary methods, such as TEM, light scattering, and isothermal titration (ITC), for characterizing molecular self-assembly or aggregation. The self-assemblies of these molecules differ and thus result in the distinct spatial distribution of their assemblies when they incubate with cells (Figure 1). Unexpectedly, the intracellular molecular nanofibers of the small molecules (3a) are able to curtail the effect of an F-actin toxin (i.e., latrunculin A) and maintain the adhesion of cells to the surface of culture dish. 3b mainly localizes in the cell membrane, resulting in considerable cytotoxicity. 2c and 3c hardly accumulate intracellularly and exhibit little effect on cell adhesion. The aggregates of 2d and 3d homogeneously distribute outside and inside cells, without noticeable localization, and exhibit the conventional dosage dependent cytotoxicity.29 These results, undoubtedly, confirm that the assemblies of small molecules control cell fate. This work also illustrates a useful enzyme-based approach to modulate spatiotemporal profiles of small molecules in cellular environment, a, possibly profound, phenomenon that promises wide range of applications in bio-medicine.
Scheme 1.

The general synthetic route of the fluorescent phosphorylated precursors and the enzymatic dephosphorylation
RESULTS AND DISCUSSION
Synthesis
As described in Scheme 1, the synthesis of the fluorescent small molecules starts from the preparation of the common peptidic motif (1) via Fmoc-based solid phase peptide synthesis (SPPS). Being cleaved off from resin by TFA (with 1% of water), 1 precipitates out of anhydrous diethyl ether as light yellow solid at 0 °C, followed by the purification with semi-preparative HPLC. Under the specific conditions listed in Scheme 1, 1 reacts with the corresponding amine-reactive fluorogenic molecules (NBD-Cl, DNS-Cl, DBD-F, and NHS-rhodamine) to form the precursors 2a, 2b, 2c, and 2d, in 67%, 87%, 81%, and 60% isolated yields, respectively. All the resulting molecules (2a-2d) are also purified by HPLC.
Hydrogelation and fluorescence
While the tetrapeptidic backbone provides the basis for intermolecular hydrogen bonding, the naphthyl group and phenyl groups (on phenylalanine) favor intermolecular aromatic-aromatic interactions. These intermolecular interactions (e.g., hydrogen bonding and hydrophobic interactions) usually facilitate the self-assembly of the small molecules in water to form molecular nanofibers.30-33 At adequate concentrations, the molecular nanofibers entangle in water to result in a hydrogel.34-35 Thus, hydrogelation and/or the formation of nanofibers (or other ordered nanostructures) become a convenient preliminary assay for indicating the molecular self-assembly in water.22, 35 Since a phosphate group on the tyrosine residue usually increases the solubility of a peptide, we expect that precursors 2b, 2c, and 2d, like 2a, will dissolve in water and act as substrates for alkaline phosphatase (ALP). In an ideal case, ALP catalyzes the dephosphorylation of the precursors to produce the corresponding hydrogelators for self-assembly in water. So, we examine the enzymatic hydrogelation of 2a-d as the initial test for evaluating the ability of 3a-d to self-assemble in water. The following sections discuss each pair of precursor/hydrogelator in more details, particularly on the states of their assemblies (i.e., as monomers, ordered aggregates (e.g., nanofibers), or disordered aggregates (e.g., precipitates)) before and after the enzymatic dephosphorylation.
The enzymatic conversion of 2a to 3a
We have reported part of the properties of 2a/3a.23 In brief, 2a dissolves well in water to form a solution, and 3a is prone to form supramolecular nanofibers/hydrogels. As monomers, 2a exhibits weak fluorescence. After complete dephosphorylation of 2a, the product, 3a, forms a hydrogel when its concentration exceeds the critical gelation concentration (CGC) (0.2 wt%, Figure S1). The resulting hydrogel of 3a (Figure 2A, inset), exhibiting higher fluorescence than the solution of 2a, consists of a large amount of nanofibers that have quite uniform diameters (10±2 nm) and entangle with each other to form a network (Figure 2A).
Figure 2.
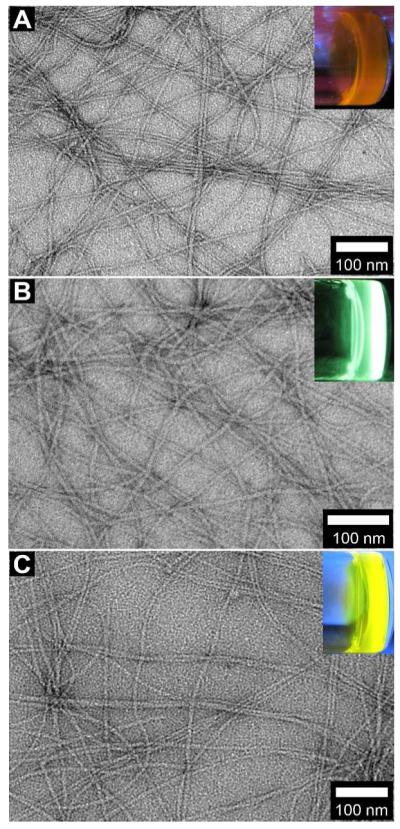
Typical transmission electron microscopic (TEM) images show the nanofibers in the hydrogels, which are resulted from alkaline phosphatase catalyzed dephosphorylation, of (A) 3a (0.6 wt%, pH 7.4); (B) 3b (0.6 wt%, pH 7.4); and (C) 3c (0.6 wt%, pH 7.4). Insets: each hydrogel under excitation of a handhold UV lamp (λex = 365 nm).
The enzymatic conversion of 2b to 3b
Similar to 2a, 2b dissolves in water to form a clear solution at pH 7.4 and the concentration of 0.6 wt%. The solution gives a green-yellow fluorescence. After the addition of ALP, the solution becomes a self-supported hydrogel of 3b, which gives a green fluorescence (Figure 2B, inset). This blue shift, from the emission of the solution of 2b at 562 nm to that of the hydrogel of 3b at 545 nm (Figure 3A), indicates the change of the microenvironment of the fluorophore (i.e., the DNS groups are in hydrophobic environment inside the supramolecular nanofibers) and agrees with the sol-gel transition. TEM confirms that numerous nanofibers at a width around 11±2 nm in the hydrogel of 3b (Figure 2B). Being different from 2a/3a, both 2b and 3b fluoresce strongly.
Figure 3.

(A) The fluorescence spectra of the solution of 2b (0.6 wt%, pH 7.4) and the hydrogel of 3b (0.6 wt%, pH 7.4) that is formed by adding in 20 U/mL of ALP into the solution of 2b. (B) The fluorescence spectra of the fresh prepared solution, viscous solution of 2c (0.6 wt%, pH 7.4), and the hydrogel of 3c (0.6 wt%, pH 7.4) that is formed by adding in 20 U/mL of ALP into fresh prepared solution of 2c.
The enzymatic conversion of 2cto 3c
Unlike 2a and 2b, 2c appears to self-assemble significantly in the solution (at pH 7.4, 0.6 wt%). The solution gradually becomes a highly viscous liquid within 4 hours (Figure S2, inset) of the dissolution of 2c. TEM (Figure S2) reveals scattered nanofibers of 2c (9±3 nm) in the liquid, indicating the self-assembly of 2c before the addition of ALP. However, being treated with ALP, the viscous liquid fails to form a self-supported hydrogel (Figure S3B) because the nanofibers of 2c likely impede the conversion of 2c to 3c (determined by HPLC, Figure S3A). To examine the enzymatic dephosphorylation of the assemblies of 2c, we monitor the conversion from 2c to 3c by analytical reverse phase high pressure liquid chromatography (RP-HPLC). After adding the ALP into the viscous solution (Figure S3A) of 2c (0.6 wt% in concentration), we find, at room temperature, 7.0% of 2c being converted to 3c (calculated by UV absorbance at 430 nm, a characteristic UV absorbance peak of DBD residue) three hours after adding ALP. Raising the temperature to 37 °C and stirring the reaction mixture (Figure S3A), we obtain the final yield of 3c to be about 30% after 24 hours. The incomplete conversion of 2c results a mixture of 2c and 3c, which fails to form a stable gel (Figure S3B). Despite that there is a “burst” conversion of 2c to 3c after changing conditions (e.g., raising temperature or starting stirring) each time, the conversion quickly slows down (Figure S3). Since changing the conditions disfavor the self-assembly of 2c, these results confirm that the formation of the nanofibers of 2c or the nanofibers of the mixture of 2c and 3c, retards the conversion of 2c to 3c catalyzed by ALP.
Therefore, it is not surprising that a self-supported hydrogel of 3c (Figure 2C, inset) only forms upon the prompt addition of ALP into a freshly prepared solution of 2c (0.6 wt%, pH 7.4), that is, before 2c self-assembles extensively. The TEM of the hydrogel indicates that the nanofibers, with a quite uniform diameter of 10±3 nm (Figure 2C), have much higher density in the hydrogel of 3c than in the viscous solution of 2c. Most of the nanofibers pair in parallel, suggesting the strong inter-fiber interactions. According to Figure 3B, the hydrogel of 3c shows the highest fluorescent intensity, while the viscous solution is slightly brighter than the freshly prepared solution. Since all these three samples have the same concentration of the fluorophore (i.e., DBD), the stronger fluorescence suggests a higher quantum yield of the fluorophore after the formation of the nanofibers. That is, the stable hydrogel of 3c contains nanofibers to encapsulate the DBD, which changes the local microenvironment (from a hydrophilic environment in the aqueous solution to a hydrophobic one inside nanofibers) of the fluorophores, thus increases the quantum yield and results in the highest quantum yield among these three cases.
The enzymatic conversion of 2d to 3d
The replacement of NBD by rhodamine produces compounds 2d and 3d (Figure S4), neither of which behaves as a hydrogelator. After 2d being dissolved in water (pH 7.4, 0.6 wt%) and treated with ALP, the product of dephosphorylation, 3d, fails to form a hydrogel (Figure S5). The solution of 2d gives a strong fluorescence at 586 nm (λex = 573 nm), while the solution of 3d emits at the same wavelength but with a weaker intensity (Figure S6). The decreased fluorescent intensity may imply the formation of aggregates (vide infra) after dephosphorylation because the self-quenching36 could originate from the energy transfer from the excited monomers to the aggregates.37
Molecular self-assembly (or aggregation) determined by light scattering
The self-assembly of 2c before the addition of ALP indicates that this type of small molecules (i.e., 2a-d) may self-assemble in water before dephosphorylation or without forming a hydrogel. Thus, it is necessary to examine the state of the precursors and hydrogelators at the concentration below CGC. As a statistical method to determine microscopic heterogeneity in solution, light scattering measures the objects at a sub-micron size and gives an angle-dependent signal if the scatters are larger than λ/10.38 Specifically, static light scattering (SLS) measures the average intensity of scattered light for probing the sizes and shapes of particles, while dynamic light scattering (DLS) measures the correlation of scattered light for detecting the concentration fluctuation induced by particles that diffuse in solution.39 So we choose light scattering for evaluating the molecular assemblies of the analogues of 2a and 3a in the solutions.
To establish a reference point, to map the experiment parameters, and to understand the results from light scattering, we first carry out a comprehensive light scattering study on the parent compound, 1, since it shares the same self-assembly motif and enzyme triggers with 2a, 2b, 2c, and 2d. The DLS autocorrelation decay curve of 1 at 6 mg/mL remains unchanged between 2 hr and 48 hr (Figure S7A), indicating that the assemblies are stable in solution in terms of association-disassociation. The decay curves exhibit angle-dependent scattering due to the large size of assemblies (estimated to be larger than 63 nm). The curves (Figure S7B) of the serial dilution of 1 from 6 mg/mL to 0.12 mg/mL become noisy between 0.6 mg/mL and 0.12 mg/mL, indicating that the critical aggregation concentration (CAC) is between 0.12 and 0.6 mg/mL (141 to 705 μM) for the formation of assemblies in the solution of 1. After adding ALP to the solution of 1, the dephosphorylated molecule (2, Scheme S1) becomes more hydrophobic and easier to self-assemble. For example, at the concentration of 6 mg/mL, there are large amounts of supramolecular assemblies of 1, which likely co-assemble with the newly formed molecules of 2 and quickly generate long nanofibers that merely move in solution (Figure S7C). The static scattering intensity is expected to increase during the initial period of dephosphorylation when there are limited amount of assemblies. Figure S7D shows the DLS autocorrelation functions measured at different times. In this system after 148 min the gelation process is practically completed. From the light scattering results of 1, we find several features: (i) stable supramolecular assemblies of 1 form before dephosphorylation if the CAC of 1 is reached; (ii) the CAC of 1 is between 0.6 mg/mL (705 μM) and 0.12 mg/mL (141 μM); (iii) DLS is unable to give accurate sizes of the individual assemblies beyond certain concentration (i.e., in the semi-dilute concentration range where the assemblies overlap) or after long duration of dephosphorylation of 1. Thus, we only conduct SLS measurements of 2a-d for assessing the extent of the self-assembly or aggregation of the molecules before and after dephosphorylation.
Despite SLS usually measures the weight average molecular weight (Mw) of polymers according to Zimm plot with double extrapolation to zero angle and zero concentration,40 the above DLS results of 1 clearly show that the dynamic properties of supramolecular assemblies change due to disassembly upon dilution. Thus, we fix the concentrations of 2a-d at 500 μM (within the range of CAC of 1) to obtain a qualitative comparison of their assemblies before and after dephosphorylation. As shown in Figure 4, control experiments (the curves of PBS and “PBS+E”) indicate the addition of ALP (at the amount used for catalyzing hydrogelation) hardly contributes to the SLS signal at all angles (30°, 60°, 90 °, and 120°). The solution of 2a exhibits a scattering intensity as low as the controls, indicating little self-assembly of 2a at 500 μM. After the addition of ALP into the solution of 2a and the completion of dephosphorylation, the resulting 3a shows an obvious increase in light scattering at 30°, suggesting that 3a forms assemblies at 500 μM. While the scattering intensities at other angles are much smaller than that of 30° (remain as low as the blank), the angle-dependent light scattering reveals that the assemblies of 3a are also larger than 63 nm. Similarly, the SLS signals of 500 μM of 2b, 3b, 2c, and 3c show the increases of the intensities of scattering after the addition of ALP. Although the light scattering intensity of 2c is higher than that of 2b at 30°, which indicates more extensive self-assembly of 2c than that of 2b, 3b and 3c still exhibit similar magnitudes of self-assembly according to their comparable light scattering intensities. Both 2d and 3d exhibit the highest SLS signals at 30°. Since they are unable to form hydrogels, this result suggests that the molecules of 2d or 3d likely form non-fibrillar, disordered aggregates.
Figure 4.
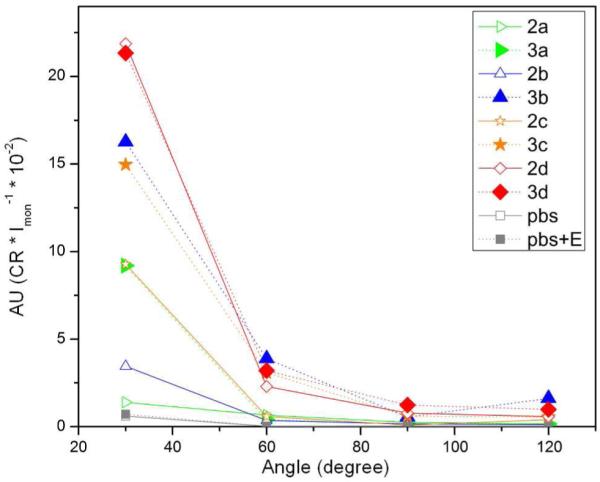
Static light scattering (SLS) measurements show the relative scattering intensity of 2a-d, and their corresponding dephosphorylated products 3a-d at the concentrations of 500 μM in PBS buffer. (ALP, 5U/mL).
TEM of molecular assemblies (below CGC)
Although light scattering is a useful technique to detect the existence of the particular assemblies of small molecules and their quantities in solution, it is less straightforward for depicting the morphology of the assemblies due to the disassembly of these supramo-lecular assemblies upon dilution. As a complementary method to light scattering for identifying the microscopic morphology of supramolecular assemblies, TEM distinguishes the fibrillar or non-fibrillar morphology. Thus, we use TEM to evaluate the morphology of supramolecular assemblies in each sample measured by SLS in Figure 4.
As shown in Figure 5, TEM confirms that, indeed, there is hardly any obvious aggregates in 500 μM solution of 2a, agreeing well with the result from SLS of 2a. TEM shows that the corresponding dephosphorylated product, 3a, of which the solution obviously scatters the incident light at 500 μM, self-assemble to form a network consisting of uniform nanofibers that have almost the same diameter (10±2 nm) as the nanofibers existed in the hydrogel of 3a.23 TEM identifies only a small amount of nanofibers with finite lengths in the solution of 2b at 500 μM, which agrees with its weak SLS signal. After dephosphorylation, TEM reveals that the molecules of 3b at 500 μM form polymorphismic nanoscale aggregates that consist of nanofibers surrounded by non-fibrillar aggregates. The relative large amount of non-fibrillar aggregate in the solution of 3b agrees with its stronger signal in SLS than that of 3a. A significant amount of nanofibers in the solution of 2c coincides with its rather strong light scattering signal (e.g., being comparable to that of 3a). TEM of 500 μM of 3c shows the morphology of a crowded network of nanofibers. Differing from the nanofibers of 3a, most of the nanofibers of 3c exist as bundles, implying the strong inter-nanofibers interactions. The formation of the nanofibers of 2c also agrees with the slow dephosphorylation during enzymatic hydrogelation of 2c/3c (vide supra). As discussed above, neither 2d nor 3d is a hydrogelator. Their aggregates are disordered and non-fibrillar, and, after dephosphorylation, the resulted 3d forms much more aggregates than 2d does. Some of these large aggregates may precipitate out of the solution, thus canceling the increase of the scattering due to the larger size aggregates, which finally yields the little change between the light scattering intensities of 2d and 3d (vide supra).
Figure 5.

TEM images of the representative morphology of molecular assemblies before and after adding ALP (5 U/mL). (A) 2a, (B) 2a + ALP, (C) 2b, (D) 2b + ALP, (E) 2c, (F) 2c + ALP, (G) 2d, and (H) 2d + ALP (in 1x PBS buffer, 500 μM of 2a-d, negatively stained by 2% UA,41 scale bar = 100 nm).
Critical aggregation concentration (CAC) determined by isothermal titration calorimetry (ITC)
Thermodynamics is another important aspect for understanding the supramolecular self-assembly. Recent studies have demonstrated that ITC is the most precise and direct technique to measure the thermodynamic parameters (e.g., ΔH, Ka, TΔS) in an association reaction by titrating ligands (titrant in the syringe) into a solution containing the binding partner (titrand in the sample cell) at a constant temperature, which is maintained by an external heat source. Thus, the heat effect generated by the reaction equals to the required external heat power but with opposite sign. ITC, as a standard method to titrate a micelle solution into water, also determines critical micellization concentration (CMC).42 Using the similar experiment procedure and principle for determining CMC, here we titrate the solutions containing supramolecular assemblies of 2a-d into a PBS buffer to determine the CACs of the precursors (2a-d).
As shown in Figure 6, the injection of each precursor solution at a given concentration (Figure 6) into PBS buffer gives a total heat flow (ΔHinj), which accounts for the heat generated by dilution (ΔHdil) and the disassociation of the assemblies (ΔHdis). In general, the magnitude of ΔHdil is small and almost a constant (equals to the several final injections on the “saturation” plateau). ΔHdis is positive and decreases since the titration builds the concentration of the titrant in the sample cell that suppresses the disassociation of the titrant from syringe on the following injection. Once the heat flow curve reaches the plateau, it indicates the balance of disassociation and association. Using this definition, we calculate the CACs. According to Figure 6, the CAC point appears to reach at the injection number of 17, 16, 10, and 15 for 2a, 2b, 2c, and 2d, respectively, thus the corresponding CACs are [2a]CAC = 770.6 μM, [2b]CAC = 288.2 μM, [2c]CAC = 95.2 μM, and [2d]CAC = 272.7 μM. These CACs are comparable to the concentration range of the self-assembly of 1 obtained by light scattering (vide supra).
Figure 6.
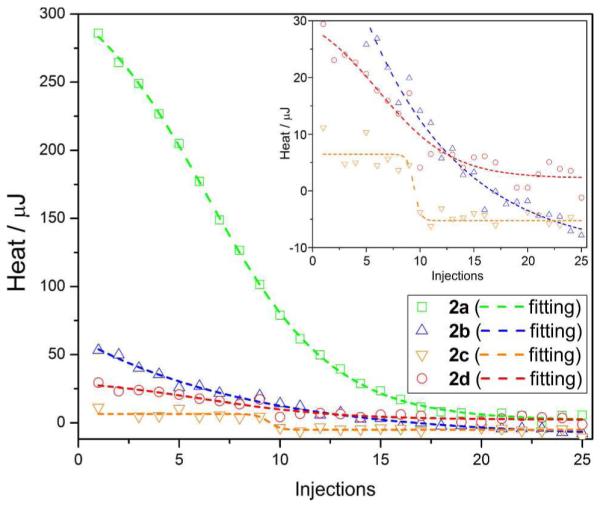
ITC heat flows versus the number of injections for the determination of the critical aggregation concentration (CAC) at pH 7.4 at 30 °C. Heat flow of the titration of 6 mM of 2a, 2 mM of 2b, 1 mM of 2c, or 2 mM of 2d in PBS, in steps of 25 × 2 μL, into PBS buffer (190 μL) in the sample cell. The CAC is defined as c0 × 2n/(2n+190) in which n stands for the number of injections when the fitting curve plateaus. Inset enlarges the Y-axis from −10 to 30 μJ range.
Thermodynamically, at a given temperature (e.g., 30 °C in this experiment), the precursors self-assemble to form supramolecular assemblies, which means the self-assembly is a spontaneous process (ΔGagg<0). Therefore, the disassociation of the assemblies is a non-spontaneous process (ΔGdis>0). When being titrated into a PBS buffer, the assemblies absorb heat to disassociate, which means the disassociation is an endothermic process (ΔHdis>0). Along the disassociation process, the entropy of not only those precursors but also water molecules (which presumably align on the molecular surface) increase, thus ΔSdis>0. However, it is possible that the entropy term partially reduces the enthalpy term. Thus, there is little energetic barrier in both assembly and disassembly pathway, which leads to an extremely broad transition from monomer to polymerized form (e.g., disordered aggregates or nanofibers). Thus, the CAC determined here distinguishes the “monomer rich” and “assembly rich” states instead of a distinctive concentration to separate non-aggregate and aggregate phase.43 The Gibbs free energy equation has another implication: when the temperature exceeds a critical point (Tcri), ΔHdis will become smaller than TΔSdis, leading to ΔGdis<0, which indicates that the disassociation process will be favorable. We notice that 2c has a relatively sharp transition in ITC curve, suggesting its distinct distribution between the states of monomers and nanofibers. In comparison, 2b and 2d have a slower transition and the most flatten transition, respectively. These transitions correspond to their broad transition among monomers and polymorphic assemblies or disordered aggregates (Figure 6 inset). This kind of difference also correlates well with their molecular distributions in cellular environment, shown by fluorescent imaging (vide infra).
Fluorescent imaging
Based on the successful method to image enzyme-triggered self-assembly of small molecules inside live cells,23 we investigate the spatial distribution of each kind of molecules in cellular environment by fluorescent microscopy. We incubate HeLa cells with each precursor (2a-d) at the same concentration of 500 μM in PBS buffer (in which we know the morphology of the microstructure of the assemblies in each solution) and compare the fluorescent images of these live cells after 30 minutes of incubation. During the incubation, we also capture real time images to elaborate the spatiotemporal profile of these emergent fluorescent assemblies (Figure S8). The resulting images show that the diffusion of each kind of fluorescent molecule into cell bodies at different rates and different locations. For example, after adding 2a to the cells, we find the fluorescence of 2a outside cells remains very weak during the 30 min experiment, which provides a clear background and enables the visualization of the development of fluorescence inside live cells. At the time point of 30 min, all the cells glow brighter at the center of cell bodies than around the outer membrane (Figure 7A). As we reported earlier, this result indicates the formation of the nanofibers of 3a inside cells catalyzed by an effective phosphatase, PTP1B.23
Figure 7.
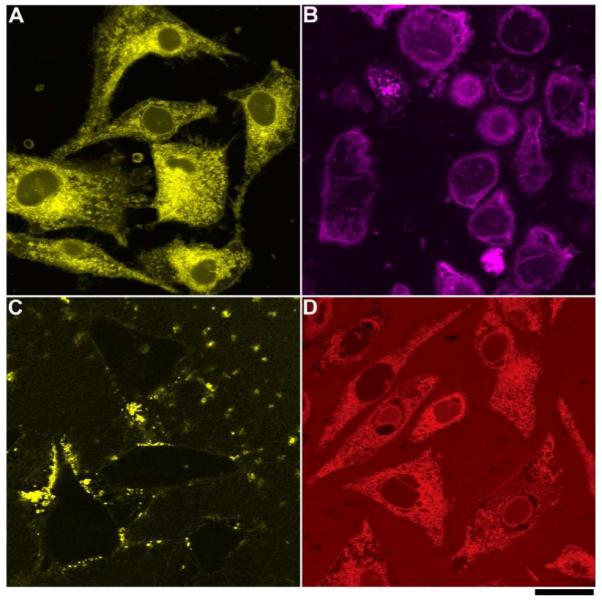
Fluorescent confocal microscope images of the HeLa cells incubated with 500 μM of (A) 2a, (B) 2b, (C) 2c, and (D) 2d in PBS buffer after 30 min incubation show the different spatial distribution of fluorescent molecules in cellular environment. Scale bar = 25 μm.
Unlike 2a, 2b mainly localizes in membrane of the cells in a relatively homogeneous manner (Figure 7B). Comparing to 2a, the similar low background fluorescence outside the cells confirms that there is insignificant amount of 2b outside cells while the different spatial distribution indicates that the assemblies of 2b/3b mainly reside near cell membrane instead of endoplasmic reticulum (ER). In the fluorescent image, we observe that several aggregates of 2b remained outside cells, during the 30 min imaging, just behave like 2c (e.g., the brightest spot in Figure 7B, middle-right bottom). But certain portion of 2b can enter cells and get dephosphorylated to form 3b, which may self-assemble on cell membranes. In addition, after 30 min incubation with 500 μM of 2b, the cells round up, agreeing with the significant cytotoxicity of 2b (Figure 8). The difference in localization of the assemblies, between 2a/3a and 2b/3b, is consistent with that they bear different fluorophores and exhibit different self-assembly propensities of the precursors. The preference of 2b/3b to the cell membrane likely originates from the dansyl-lysine motif because dansyl-lysine exhibits significant higher solubility in phospholipid membrane than it does in water26 and dansyl group is compatible with the head group of phosphatidylcholine.
Figure 8.
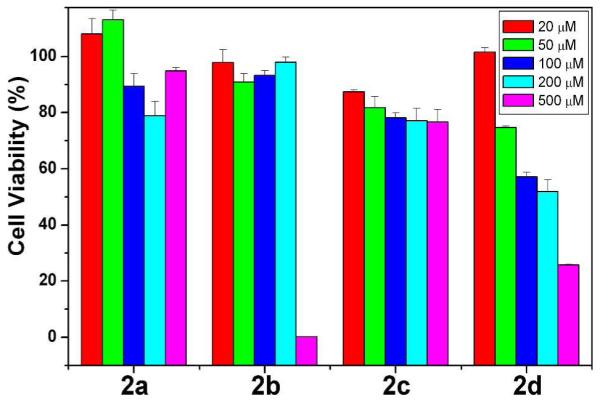
MTT cell viability test shows the different cytotoxicity of 2a-2d against HeLa cells at 48 hours.
As discussed early, 2c dissolved in PBS buffer results a highly viscous solution that contains significant amount of nanofibers. Thus, the confocal image shows that 2c in PBS buffer forms a large amount of fluorescent assemblies only outside the cells (Figure 7C). During the 30 min incubation, the fluorescent assemblies distribute heterogeneously outside cells and barely change their locations, suggesting that the HeLa cells are unable to uptake the nanofibers of 2c.
To exclude the possibility that the localization is simply the properties of monomeric fluorophores, additional control experiments at different concentrations of the hydrogelators will be helpful since they will affect the concentration dependent self-assembly process without alternating the properties of individual molecules. In contrast to the in Fig. 7B, when a group of HeLa cells are incubated with 200 nM of 2b, the Z-slices of a confocal image stack (Figure S9) clearly show the homogeneous distribution of 3b within the cell cytoplasm. This result proves that 2b, as monomers, exhibits little preference to cell membrane. In addition, the distribution of 2c also shows a concentration-dependent behavior. When another group of HeLa cells are incubated with 2c at the concentration of 10 μM (below the CAC), the merged fluorescent and bright field images (Figure S10) clearly shows that 2c enters the cells. Thus, these two control experiments undoubtedly support that the spatiotemporal profiles are dependent on the state of aggregation (or self-assembly) instead of monomeric hydrogelators. Since it is known that the rate of the formation of the hydrogelators depends on the concentration of ALP,44 one may argue that the precursors at concentrations of 500 μM over-whelm any natural cellular enzymatic mechanism. This scenario is unlikely for phosphatases because their high activity (e.g., PTP1B on ER45). In addition, our previous works confirm that there is hardly any inhibition of intracellular phosphatases when the concentration of the precursor is at 500 μM.23, 25
Although they are unable to form nanofibers and hydrogels, the molecules of 2d or 3d still form disordered aggregates. Since the monomers and the aggregates of 2d or 3d are highly fluorescent, the whole cell body homogeneously exhibits fluorescence (Figure 7D) after the HeLa cells being incubated with 2d, though the solution of 2d outside cells exhibit significant background fluorescence. Since the molecular structures of 2a and 2d only differ from the fluorescent groups and these two fluorescent groups exhibit little specific binding to cellular organelles, the formation of these two different patterns likely originates from the difference between their manners of self-assembly or aggregation.
Thus, the results of fluorescent imaging indicate that 2a, 2b, 2c, and 2d, though sharing the same self-assembly motif and enzyme responsive residue (i.e., phosphotyrosine), have different propensity of self-assembly, which directly affects the cell response and results in the distinct spatiotemporal distribution of their assemblies when they interact with live cells.
Cell compatibility
The difference in cell imaging of the precursors implies cell responses may depend on the self-assembly or aggregation of the precursors. One most important phenotype is the cell viability. We conduct MTT cell viability assay by incubating HeLa cells with each kind of precursor at the concentrations in a serial dilution from 500 μM to 20 μM and measure the cell viability after 48 hours. As shown in Figure 8, 2a is more or less compatible with cells at all the tested concentrations, which coincides with that 2a is less prone to self-assemble. However, since 2a, at 500 μM, diffuse inside the cells and accumulate in the form of intracellular nanofibers after dephosphorylation in the ER region,23 the induced ER stress may warrant further studies. 2b starts to show the significant cytotoxicity at the concentration between 200 and 500 μM, which coincides to its CAC. As revealed by the fluorescent imaging, the supramolecular assemblies of 2b (and probably the mixture of 2b/3b) likely interact with cell membrane and impair the membrane integrity, thus leading cell death consequently. Interestingly, despite that the molecules of 2c self-assemble to form long nanofibers at the concentration of 500 μM, 2c exhibits little cytotoxicity. Together with the result from fluorescent imaging, this result indicates that, as the nanofibers outside the cells, 2c is rather innocuous to cells despite its smallest CAC among the precursors tested in this work. In contrast 2a-c, after 2d diffuses inside cells and undergoes dephosphorylation to form 3d, the polydispersity of 3d retains a portion of its monomers of which the concentration increases with the initial concentration of 2d and the incubation time. Thus, the toxicity of 2d exhibits a dosage dependence after 48 hours, giving the IC50 around 200 μM, which even lower than its CAC. This result also agrees with that rhodamine fluorophore, itself, is cytotoxic via the inhibition of mitochondria functions. These results of cell viability confirm the cytotoxicity of the precursors and the hydrogelators closely relate to the spatiotemporal distribution of their self-assemblies.
Intracellular nanofibers stabilize F-actin filaments
The cell imaging result in Figure 7A, reported previously,23 largely serves as a comparison of other imaging data in Figure 7. In this study, we unexpectedly found that the supramolecular nanofibers of 3a are able to stabilize the F-actin filaments in the cells insulted by latruncunlin A (4), an F-actin toxin that disrupts the actin cytoskeleton. Being able to bind to actin monomer (G-actin) with 1:1 stoichiometry, 4 specifically inhibits G-actin polymerization that forms F-actin.46 Losing the F-actin filaments, cells decrease cellular adhesion, thus each individual cell rounds up, detaches from its substrate surface (e.g., culture dish), and undergoes apoptosis. During the imaging experiment (i.e., the fluorescence staining of F-actin and nuclei accompanied with chemical fixation, to see SI), the detached (floating) cells will be washed away, and, as the result, no fluorescence appears during the imaging.
To determine the suitable condition for 4 to inhibit the actin filaments, we use 4, from 1 μM to 10 μM, to treat HeLa cells from 15 min to 1 hour, and find that 30 min of treatment 10 μM of 4 is sufficient to induce the detachment of most of the HeLa cells from the substrate (Figure S11). After the HeLa cells being pre-incubated with 500 μM of 2a for one hour, the same treatment (30 min., 10 μM of 4) fails to result in cell detachment, as indicated by, fluorescent imaging, which shows the unperturbed adherence of the HeLa cells to the substrate. The staining of actins also reveals that abundant F-actins exist in the cytoplasm (Figure S12C). The dramatic different cellular responses to the F-actin toxin (4) between the untreated and 2a treated HeLa cells likely originate from the formation of intracellular molecular nanofibers of 3a. The merged fluorescent image (Figure S12D) indicates certain co-localization of 3a and F-actin, suggesting that the interaction between molecular nanofibers and actins, which is consistent with a previous study.47 Since latrunculin A (4) inhibits the polymerization of actin by forming a 1:1 stoichiometric complex with actin monomers (Kd = 0.240.4 μM), the stabilization effects of 3a may stem from the binding between the nanofibers of 3a and actin filament to reduce the interaction between 4 and actins.
The pre-incubation of 2b, 2c, or 2d, with the HeLa cells, prior to the treatment of 4, exhibits weak or none protective effect against the action of 4. For example, cells incubated with 2b already start to round up before the addition of 4, which likely originates from the cytotoxicity of 2b at 500 μM (Figure 8). Not surprisingly, the subsequent treatment of 4 makes all the cells to detach from the substrate (Figure S13A). Most of the HeLa cells incubated with 2c, behaving the same as the untreated HeLa cells, detach from the culture dish after being treated by 4 (Figure S13B). This result agrees with that the molecular nanofibers of 2c hardly accumulate intracellularly. Although 2d diffuses inside cells and form non-fibrillar aggregates of 3d intracellularly, which apparently results in that a significant number of cells remain adhering to the substrates. However, F-actins exist at a much lower level in cytoplasm (Figure S13C) in comparison to the case of 2a. These results not only establish the formation of different kinds of supramolecular assemblies inside cells, but also further confirm that the spatiotemporal profiles of the assemblies of these small molecules affect the phenotypes of the cells.
CONCLUSIONS
The experimental results of this work suggest that the precursors and hydrogelators exhibit the spatiotemporal behaviors depicted in Figure 1: 2a remains as monomers and diffuses inside the cell driven by concentration gradient. 2a turns to 3a inside the cell via dephosphorylation catalyzed by PTP1B, and initiates the molecular self-assembly near ER.23 2b, largely existing as monomers, undergoes dephosphorylation to form 3b that self-assembles to result in molecular assemblies, which largely localize in the cell membrane and impair the membrane integrity to cause the cell death. 2c self-assembles significantly to form the nanofibers before dephosphorylation. The nanofibers of 2c localize mainly outside the cells with slow dephosphorylation, thus 2c is also much less cytotoxic. 2d resides both outside and inside the cells while the portion of 2d inside the cell undergo dephosphorylation, and form non-fibrillar aggregates of 3d that apparently are cytotoxic at a high concentration. These results also imply that, unless the purpose is to image the self-assembly of small molecules, the aggregate of a fluorophore, alone, is undesirable for cell imaging. On the other hand, the extensive knowledge of small molecular gelators22, 34-35 also provides a large pool of candidates for exploring molecule self-assemblies in cellular environment.
In summary, these results confirm that the assemblies of small molecules are able to exhibit biological activities drastic from the individual monomers of the molecules.9 As the first example of the systematic study of the spatiotemporal profiles of the assemblies of small molecules in cellular environment, this work illustrates several trends or issues that worth consideration when one investigates the (ordered) assemblies or (disordered) aggregates of small molecules for biomedical applications. (i) A small structural difference in the small molecules may result in the significantly different behavior of self-assembly. For example, 2a and 2c behave completely different despite the fluorophores on them are rather similar. Therefore, it is important to determine experimentally the self-assembly of the molecules of interests. (ii) The critical aggregation concentration (CAC) usually is an order of magnitude lower than the CGC. After the use of hydrogelation as a simple, preliminary assay for determining molecular self-assembly in water, it is essential to use multiple assays or techniques (e.g., ITC, SLS, DLS, and TEM) to verify the presence of molecular assemblies or aggregates if they are the subject of study. (iii) It is possible that the self-assembly of small molecules to result in various microscopic morphology (fibrillar or non-fibrillar) even by the same molecule (e.g., the case 3b). Such a polymorphism not only highlights the need of more advanced methodology for determining the dynamic “atomistic structures” of molecular assemblies, but also underscores that the reproducible phenotypes generated by the molecular assemblies of small molecules are more useful and accessible information in the current stage of the study of molecular assemblies of small molecules. (iv) The molecular self-assembly of small molecules could be beneficial or detrimental to cells, which depends on the distribution of the supramolecular assemblies and their interaction with cellular components. Thus, the use of supramolecular self-assembly to provide the contrast for the fluorescence imaging to identify the spatiotemporal profiles of molecular assemblies in cellular environment should be particularly worthwhile and useful approaches. (v) The unexpectedly observed the stabilization of F-actin by the nanofibers of 3a, the impairment of cell membrane induced by the assemblies of 3b, the innocuous assemblies of 2c to cells, and the cell cytotoxicity induced by aggregates of 3d, reflect the interactions of the supramolecular assemblies with bio-macromolecules in live cells, which promise the use of extra- and intracellular supramolecular self-assemblies for cellular regulation. Such studies, in combination and being benefitted from the development of enzymatic reactions,48 will contribute to an emerging field like supramolecular chemical biology or ultimately may lead to a new paradigm in chemistry and biology.
Supplementary Material
ACKNOWLEDGMENT
The authors acknowledge the National Institute of Health (NIH R01CA142746), Human Frontiers Science Program (HFSP), MRSEC, start-up fund of Brandeis for funding to B. X. and National Research Council Research Associateship Award to Y. G. at NICHD. Y. G., P. C., and F. H. acknowledge the support of the Intramural Research Program of the NICHD/NIH.
Footnotes
Supporting Information. Details of synthesis, hydrogelation tests, TEM, fluorescence spectra, dynamic light scattering, and fluorescence images. This material is available free of charge via the Internet at http://pubs.acs.org.
REFERENCES
- 1.Alberts B. Essential Cell Biology. 3rd ed Garland Science; New York: 2009. [Google Scholar]
- 2.Hall A. Rho GTPases and the actin cytoskeleton. Science. 1998;279(5350):509–514. doi: 10.1126/science.279.5350.509. [DOI] [PubMed] [Google Scholar]
- 3.Hyman AA, Salser S, Drechsel DN, Unwin N, Mitchison TJ. Role of Gtp Hydrolysis in Microtubule Dynamics - Information from a Slowly Hydrolyzable Analog, Gmpcpp. Mol. Biol. Cell. 1992;3(10):1155–1167. doi: 10.1091/mbc.3.10.1155. [DOI] [PMC free article] [PubMed] [Google Scholar]
- 4.Silva GA, Czeisler C, Niece KL, Beniash E, Harrington DA, Kessler JA, Stupp SI. Selective differentiation of neural progenitor cells by high-epitope density nanofibers. Science. 2004;303(5662):1352–1355. doi: 10.1126/science.1093783. [DOI] [PubMed] [Google Scholar]
- 5.Jayawarna V, Ali M, Jowitt TA, Miller AE, Saiani A, Gough JE, Ulijn RV. Nanostructured hydrogels for three-dimensional cell culture through self-assembly of fluorenylmethoxycarbonyl-dipeptides. Adv. Mater. 2006;18(5):611. + [Google Scholar]
- 6.Haines LA, Rajagopal K, Ozbas B, Salick DA, Pochan DJ, Schneider JP. Light-activated hydrogel formation via the triggered folding and self-assembly of a designed peptide. J. Am. Chem. Soc. 2005;127(48):17025–17029. doi: 10.1021/ja054719o. [DOI] [PMC free article] [PubMed] [Google Scholar]
- 7.Yang ZM, Xu KM, Guo ZF, Guo ZH, Xu B. Intracellular enzymatic formation of nanofibers results in hydrogelation and regulated cell death. Adv. Mater. 2007;19(20):3152. + [Google Scholar]
- 8.Zorn JA, Wille H, Wolan DW, Wells JA. Self-Assembling Small Molecules Form Nanofibrils That Bind Procaspase-3 To Promote Activation. J. Am. Chem. Soc. 2011;133(49):19630–19633. doi: 10.1021/ja208350u. [DOI] [PMC free article] [PubMed] [Google Scholar]
- 9.Kuang Y, Xu B. Disruption of the Dynamics of Microtubules and Selective Inhibition of Glioblastoma Cells by Nanofibers of Small Hydrophobic Molecules. Angew. Chem. Intl. Ed. 2013 doi: 10.1002/anie.201302658. n/a-n/a. [DOI] [PMC free article] [PubMed] [Google Scholar]
- 10.Sassano MF, Doak AK, Roth BL, Shoichet BK. Colloidal Aggregation Causes Inhibition of G Protein-Coupled Receptors. J. Med. Chem. 2013;56(6):2406–2414. doi: 10.1021/jm301749y. [DOI] [PMC free article] [PubMed] [Google Scholar]
- 11.McGovern SL, Caselli E, Grigorieff N, Shoichet BK. A common mechanism underlying promiscuous inhibitors from virtual and high-throughput screening. J. Med. Chem. 2002;45(8):1712–1722. doi: 10.1021/jm010533y. [DOI] [PubMed] [Google Scholar]
- 12.Li GW, Xie XS. Central dogma at the single-molecule level in living cells. Nature. 2011;475(7356):308–315. doi: 10.1038/nature10315. [DOI] [PMC free article] [PubMed] [Google Scholar]
- 13.Gadella TWJ, Jovin TM, Clegg RM. Fluorescence Lifetime Imaging Microscopy (Flim) - Spatial-Resolution of Microstructures on the Nanosecond Time-Scale. Biophys. Chem. 1993;48(2):221–239. [Google Scholar]
- 14.Heim R, Cubitt AB, Tsien RY. Improved Green Fluorescence. Nature. 1995;373(6516):663–664. doi: 10.1038/373663b0. [DOI] [PubMed] [Google Scholar]
- 15.Misteli T, Spector DL. Applications of the green fluorescent protein in cell biology and biotechnology. Nat. Biotechnol. 1997;15(10):961–964. doi: 10.1038/nbt1097-961. [DOI] [PubMed] [Google Scholar]
- 16.Tsien RY. The green fluorescent protein. Annu Rev Biochem. 1998;67:509–544. doi: 10.1146/annurev.biochem.67.1.509. [DOI] [PubMed] [Google Scholar]
- 17.Mizusawa K, Takaoka Y, Hamachi I. Specific Cell Surface Protein Imaging by Extended Self-Assembling Fluorescent Turn-on Nanoprobes. J. Am. Chem. Soc. 2012;134(32):13386–13395. doi: 10.1021/ja304239g. [DOI] [PubMed] [Google Scholar]
- 18.Liang GL, Ren HJ, Rao JH. A biocompatible condensation reaction for controlled assembly of nanostructures in living cells. Nat. Chem. 2010;2(1):54–60. doi: 10.1038/nchem.480. [DOI] [PMC free article] [PubMed] [Google Scholar]
- 19.Li JY, Kuang Y, Gao Y, Du XW, Shi JF, Xu B. D-Amino Acids Boost the Selectivity and Confer Supramolecular Hydrogels of a Nonsteroidal Anti-Inflammatory Drug (NSAID) J. Am. Chem. Soc. 2013;135(2):542–545. doi: 10.1021/ja310019x. [DOI] [PMC free article] [PubMed] [Google Scholar]
- 20.Gao Y, Kuang Y, Guo ZF, Guo ZH, Krauss IJ, Xu B. Enzyme-Instructed Molecular Self-assembly Confers Nanofibers and a Supramolecular Hydrogel of Taxol Derivative. J. Am. Chem. Soc. 2009;131(38):13576–13577. doi: 10.1021/ja904411z. [DOI] [PubMed] [Google Scholar]
- 21.Yang ZM, Gu HW, Fu DG, Gao P, Lam JK, Xu B. Enzymatic formation of supramolecular hydrogels. Adv. Mater. 2004;16(16):1440. + [Google Scholar]
- 22.Yang Z, Liang G, Xu B. Enzymatic hydrogelation of small molecules. Acc. Chem. Res. 2008;41(2):315–326. doi: 10.1021/ar7001914. [DOI] [PubMed] [Google Scholar]
- 23.Gao Y, Shi JF, Yuan D, Xu B. Imaging enzyme-triggered self-assembly of small molecules inside live cells. Nat. Commun. 2012;3 doi: 10.1038/ncomms2040. [DOI] [PMC free article] [PubMed] [Google Scholar]
- 24.Barak LS, Yocum RR, Nothnagel EA, Webb WW. Fluorescence Staining of the Actin Cytoskeleton in Living Cells with 7-Nitrobenz-2-Oxa-1,3-Diazole-Phallacidin. Proc. Natl. Acad. Sci. USA. 1980;77(2):980–984. doi: 10.1073/pnas.77.2.980. [DOI] [PMC free article] [PubMed] [Google Scholar]
- 25.Li JY, Gao Y, Kuang Y, Shi JF, Du XW, Zhou J, Wang HM, Yang ZM, Xu B. Dephosphorylation of D-Peptide Derivatives to Form Biofunctional, Supramolecular Nanofibers/Hydrogels and Their Potential Applications for Intracellular Imaging and Intratumoral Chemotherapy. J. Am. Chem. Soc. 2013;135:9907–9914. doi: 10.1021/ja404215g. [DOI] [PMC free article] [PubMed] [Google Scholar]
- 26.Humphries GMK, Lovejoy JP. Dansyl Lysine - a Structure-Selective Fluorescent Membrane Stain. Biophys. J. 1983;42(3):307–310. doi: 10.1016/S0006-3495(83)84398-7. [DOI] [PMC free article] [PubMed] [Google Scholar]
- 27.Uchiyama S, Santa T, Okiyama N, Fukushima T, Imai K. Fluorogenic and fluorescent labeling reagents with a benzofurazan skeleton. Biomed. Chromatogr. 2001;15(5):2954–318. doi: 10.1002/bmc.75. [DOI] [PubMed] [Google Scholar]
- 28.Kawamura A. Fluorescent antibody techniques and their applications. University of Tokyo Press; 1969. [Google Scholar]
- 29.Brunton LL, B. D. K., Murri N, Dandan RH, Knollmann BC. Goodman & Gilman’s The Pharmacological Basis of Therapeutics. 12th ed McGraw-Hill; New York: 2011. [Google Scholar]
- 30.Ma ML, Kuang Y, Gao Y, Zhang Y, Gao P, Xu B. Aromatic-Aromatic Interactions Induce the Self-Assembly of Pentapeptidic Derivatives in Water To Form Nanofibers and Supramolecular Hydrogels. J. Am. Chem. Soc. 2010;132(8):2719–2728. doi: 10.1021/ja9088764. [DOI] [PubMed] [Google Scholar]
- 31.Cheetham AG, Zhang PC, Lin YA, Lock LL, Cui HG. Supramolecular Nanostructures Formed by Anticancer Drug Assembly. J. Am. Chem. Soc. 2013;135(8):2907–2910. doi: 10.1021/ja3115983. [DOI] [PMC free article] [PubMed] [Google Scholar]
- 32.Pochan DJ, Schneider JP, Kretsinger J, Ozbas B, Rajagopal K, Haines L. Thermally reversible hydrogels via intramolecular folding and consequent self-assembly of a de Novo designed peptide. J. Am. Chem. Soc. 2003;125(39):11802–11803. doi: 10.1021/ja0353154. [DOI] [PubMed] [Google Scholar]
- 33.Boekhoven J, Koot M, Wezendonk TA, Eelkema R, van Esch JH. A Self-Assembled Delivery Platform with Post-production Tunable Release Rate. J. Am. Chem. Soc. 2012;134(31):12908–12911. doi: 10.1021/ja3051876. [DOI] [PubMed] [Google Scholar]
- 34.Terech P, Weiss RG. Low molecular mass gelators of organic liquids and the properties of their gels. Chem. Rev. 1997;97(8):3133–3159. doi: 10.1021/cr9700282. [DOI] [PubMed] [Google Scholar]
- 35.Estroff LA, Hamilton AD. Water gelation by small organic molecules. Chem. Rev. 2004;104(3):1201–1217. doi: 10.1021/cr0302049. [DOI] [PubMed] [Google Scholar]
- 36.Arbeloa FL, Ojeda PR, Arbeloa IL. Fluorescence Self-Quenching of the Molecular-Forms of Rhodamine-B in Aqueous and Ethanolic Solutions. J. Lumin. 1989;44(142):105–112. [Google Scholar]
- 37.Chen RF, Knutson JR. Mechanism of Fluorescence Concentration Quenching of Carboxyfluorescein in Liposomes - Energy-Transfer to Nonfluorescent Dimers. Anal. Biochem. 1988;172(1):61–77. doi: 10.1016/0003-2697(88)90412-5. [DOI] [PubMed] [Google Scholar]
- 38.Arimori S, Takeuchi M, Shinkai S. Oriented molecular aggregates of porphyrin-based amphiphiles and their morphology control by a boronic acid sugar interaction. Supramol. Sci. 1998;5(1-2):1–8. [Google Scholar]
- 39.Berne BJ. Dynamic Light Scattering. Courier Dover Publications; 2000. [Google Scholar]
- 40.Zimm BH. The scattering of light and the radial distribution function of high polymer solutions. J. Chem. Phys. 1948;16(12):1093–1099. [Google Scholar]
- 41.Frado LL, Craig R. Electron-Microscopy of the Actin-Myosin Head Complex in the Presence of Atp. J. Mol. Biol. 1992;223(2):391–397. doi: 10.1016/0022-2836(92)90659-8. [DOI] [PubMed] [Google Scholar]
- 42.Heerklotz H, Seelig J. Titration calorimetry of surfactant-membrane partitioning and membrane solubilization. Biochim. Biophys. Acta-Biomembranes. 2000;1508(1-2):69–85. doi: 10.1016/s0304-4157(00)00009-5. [DOI] [PubMed] [Google Scholar]
- 43.Dudowicz J, Freed KF, Douglas JF. Lattice model of equilibrium polymerization. IV. Influence of activation, chemical initiation, chain scission and fusion, and chain stiffness on polymerization and phase separation. J Chem Phys. 2003;119(23):12645–12666. [Google Scholar]
- 44.Yang ZM, Liang GL, Ma ML, Gao Y, Xu B. In vitro and in vivo enzymatic formation of supramolecular hydrogels based on self-assembled nanofibers of a beta-amino acid derivative. Small. 2007;3(4):558–562. doi: 10.1002/smll.200700015. [DOI] [PubMed] [Google Scholar]
- 45.Tonks NK, Diltz CD, Fischer EH. Purification of the major protein-tyrosine-phosphatases of human-placenta. J. Biol. Chem. 1988;263:6722–6730. [PubMed] [Google Scholar]
- 46.Spector I, Shochet NR, Kashman Y, Groweiss A. Latrunculins - Novel Marine Toxins That Disrupt Microfilament Organization in Cultured-Cells. Science. 1983;219(4584):493–495. doi: 10.1126/science.6681676. [DOI] [PubMed] [Google Scholar]
- 47.Gao Y, Long MJC, Shi JF, Hedstrom L, Xu B. Using supramolecular hydrogels to discover the interactions between proteins and molecular nanofibers of small molecules. Chem. Commun. 2012;48(67):8404–8406. doi: 10.1039/c2cc33631f. [DOI] [PMC free article] [PubMed] [Google Scholar]
- 48.Borisova SA, Zhao LS, Melancon CE, Kao CL, Liu HW. Characterization of the glycosyltransferase activity of DesVII: Analysis of and implications for the biosynthesis of macrolide antibiotics. J. Am. Chem. Soc. 2004;126(21):6534–6535. doi: 10.1021/ja049967j. [DOI] [PubMed] [Google Scholar]
Associated Data
This section collects any data citations, data availability statements, or supplementary materials included in this article.