

Abstract
While traditional models of protein adsorption focus primarily on direct protein-surface interactions, recent findings suggest that protein-protein interactions may play a central role. Using high-throughput intermolecular resonance energy transfer (RET) tracking, we directly observed dynamic, protein-protein associations of bovine serum albumin on poly(ethylene glycol) modified surfaces. The associations were heterogeneous and reversible, and associating molecules resided on the surface for longer times. The appearance of three distinct RET states suggested a spatially heterogeneous surface – with areas of high protein density (i.e. strongly-interacting clusters) coexisting with mobile monomers. Distinct association states exhibited characteristic behavior, i.e. partial-RET (monomer-monomer) associations were shorter-lived than complete-RET (protein-cluster) associations. While the fractional surface area covered by regions with high protein density (i.e. clusters) increased with increasing concentration, the distribution of contact times between monomers and clusters was independent of solution concentration, suggesting that associations were a local phenomenon, and independent of the global surface coverage.
Keywords: Protein adsorption, protein-protein interactions, single-molecule, total internal reflection fluorescence microscopy (TIRFM), solid-liquid interface, bovine serum albumin
Introduction
Non-specific protein adsorption and deposition at the liquid-solid interface is an important, often problematic, phenomenon in a wide variety of technological applications including biomaterials, food science, pharmaceutical protein stability, membrane filtration, etc.1–5 Precise control of protein adsorption is necessary in applications involving separation and purification (e.g. chromatography, filtration) and identification (e.g. biosensors, immunological assays). While dynamic protein behavior at interfaces (e.g. adsorption, diffusion, desorption, and aggregation) has been studied extensively for the last few decades, little consensus has developed regarding the role of protein-protein interactions with respect to protein layer deposition.2,6,7 Although protein clusters have been observed and modeled for some protein-surface systems,8–14 many models of protein adsorption do not specifically consider protein-protein associations, and little information exists about the dynamics of these associations.
In previous work, single-molecule total internal reflection fluorescence microscopy (SM-TIRFM) was used to directly examine the dynamic behavior of isolated proteins at interfaces (e.g. adsorption, desorption, surface diffusion at ultra-low surface coverage).15–17 By studying the behavior of “probe” proteins in crowded environments, SM-TIRFM also provided indirect information about protein-protein interactions that lead to protein layer formation.18,19 These studies have shown that protein behavior under extremely dilute conditions (where protein-protein interactions are negligible) is significantly different than at higher protein concentrations, highlighting the importance of protein-protein interactions for protein layer formation and interfacial aggregation. For example, fibrinogen and bovine serum albumin (BSA) oligomers or aggregates were found to reside on the surface for orders of magnitude longer than protein monomers.15,17 On nanostructured high-density polyethylene, under conditions of high surface coverage, particularly strong protein-protein interactions between fibrinogen molecules led to extraordinarily long residence times and anisotropic lateral diffusion.19,20
Traditional experimental methods have also suggested that protein-protein interactions and aggregation affects the arrangement of adsorbed protein at the interface.14,21 For example, protein clustering has been observed in atomic force microscopy images.9–13,22 However, these methods cannot directly observe dynamic protein-protein interactions and cluster formation. From a theoretical perspective, several aggregation mechanisms have been proposed that include spatially heterogeneous protein surface coverage, with areas of high protein density and low protein density.11,22–27 However, such mechanisms are often omitted from models due to their complexity, and the lack of direct experimental support. In this work, dynamic protein-protein interactions were directly observed using intermolecular resonance energy transfer (RET) and SM-TIRFM.
RET studies have typically been designed to observe specific interactions, involving either intramolecular structure (e.g. DNA secondary structure, protein folding)28,29 or intermolecular binding (e.g. protein-ligand complexes).30,31 Because protein-protein interactions at interfaces are often non-specific and may not have well-defined geometric motifs, the structurally-specific labeling approaches used to study specific binding are not well-suited for studying this phenomenon. In the current work, proteins are labeled at multiple random sites in order to capture non-specific protein-protein interactions. Stochastically-labeled proteins display fluorophores that are, on average, well-distributed across a protein’s surface, ensuring that when two proteins interact, at least one RET pair is in close enough proximity for energy transfer to occur. Multiple labels are also useful because many proteins are of comparable size or larger than typical distances over which RET occurs (i.e. the Förster radius). While singly-labeled interacting proteins could orient such that their fluorophores are too far apart for measurable RET to occur, this situation is much less likely in a scenario with multiple labels. While the presence of multiple labels complicates the quantitative interpretation of specific types of associated objects (e.g. the relative distance between proteins or the number of proteins involved in an associated object), it does qualitatively capture association events and permit discrimination between broad classes of associated protein objects (e.g. dimers vs. larger clusters).
Using intermolecular RET and SM-TIRFM, this work makes direct observations of the frequency of protein-protein associations, types of associations, and time intervals prior to dissociation (contact times) for BSA on a polyethylene glycol (PEG)-modified surface. Protein-protein interactions were found to be frequent and reversible, and the characteristic time scale for dissociation (i.e. the contact time) correlated with the type of association. Furthermore, the interfacial aggregation dynamics were found to depend in a predictable way upon BSA concentration in solution.
Materials and methods
Surface and protein solution preparation
Fused silica wafers were functionalized with a hydrophilic methoxy-terminated polyethylene glycol silane (mPEG MW 5000, Nanocs) as described previously.15 Briefly, fused silica wafers were cleaned by immersion in warm piranha solution then treated with UV-ozone. A self-assembled monolayer of mPEG was formed by immersing cleaned wafers in a toluene solution of 0.15 mg/ml mPEG for two hours at 60°C then rinsed thoroughly with toluene and isopropanol. The contact angle was measured to be 33 ± 2°, consistent with previous contact angle values measured for PEG-modified surfaces.15,32,33 The surface thickness was 2.4 ± 0.3 nm (measured by variable angle ellipsometry, experimental details described previously15) corresponding to a grafting density of 0.28 ± 0.04 chains/nm2 or 31 ± 4 monomer units/nm2. This grafting density, which has been shown to confer improved protein resistance to the surface,34,35 indicated a polymer brush conformation in which the grafting sites were separated by less than two times the radius of gyration such that there were no bare patches of fused silica. Therefore PEG self-assembled monolayers were approximated as homogeneous surfaces. Further analysis of the spatial distribution of association locations showed that the number of unique locations for protein-protein interactions increased systematically with increasing bulk protein concentration, suggesting that cluster formation did not occur preferentially at surface defect sites. A further discussion of this analysis is presented in Supporting Information, Section 1.
Single-molecule tracking
Fluorescence from individual proteins was visualized with a custom-built prism-based TIRFM system, flow cell, and Nikon TE-2000 microscope with 60x objective as described previously.15,36 Illumination was provided by a diode-pumped solid-state laser (Cobalt Samba, 532nm) to excite donor fluorophores. Phosphate buffered saline (Gibco, pH 7.4) solution containing both 1×10⁻⁶ - 1×10⁻⁷ mg/ml donor-labeled BSA (BSAD, on average 5 Alexa Fluor 555 fluorophores per molecule, Invitrogen) and 2.5×10⁻⁴ – 2.5×10⁻⁶ mg/ml acceptor-labeled BSA (BSAA, on average 5 Alexa Fluor 647 fluorophores per molecule, Invitrogen) was introduced to the surface via a custom-built flow cell. In the mixture of BSAD and BSAA, the concentration of BSAD was selected such that the point-spread functions of individual molecules did not overlap. The concentration of BSAA was one to two orders of magnitude greater than that of BSAD to yield sufficiently frequent BSAD-BSAA associations. BSAA-BSAA associations were therefore even more probable, but not observed directly due to the lack of direct excitation of acceptor fluorophores. Flow was stopped after introduction of BSA solution and the temperature was maintained at 25°C ± 1°C. In each experiment, a movie, or sequence of 1000 frames, was recorded with a frame acquisition time of 200 ms. This acquisition time provided a satisfactory signal-to-noise ratio while also providing the ability to capture sufficiently fast protein dynamics. Fifteen or more movies were recorded for each concentration over a 2 h time period. Dynamic protein behavior was not observed to change significantly over this time period, indicating a steady-state process in dynamic equilibrium.
Dual-channel imaging was accomplished with an Optosplit II (Cairn) containing a dichroic mirror with a nominal separation wavelength of 610 nm (Chroma), a 565 ± 12.5 nm bandpass filter (Semrock) for the donor channel, and a 685 ± 20 nm bandpass filter (Semrock) for the acceptor channel. Due to the large spectral separation of Alexa Fluor 555 and Alexa Fluor 647, no significant direct excitation of acceptor or donor bleed-through into the acceptor channel was observed in our experiments, as was demonstrated previously for this optical system and RET-pair.37 Channels were aligned to within 1-2 pixels with an alignment grid prior to experiments. Fine sub-pixel alignment corrections were made before object identification and tracking analysis by convolving the two channels as a function of an offset and identifying the offset that maximized the intensity-intensity product of the two channels, as described previously.29 Essentially, this strategy aligns the channels using objects that appear in both channels as registration marks. Proper alignment coordinates causes many ‘same’ objects to align in the two channels, thereby producing a strong alignment signal. In contrast, improper alignment randomly aligns a much smaller number of ‘different’ objects throughout the image, producing a weak alignment signal.
Single-molecule trajectories were constructed by identifying objects in each frame and then linking objects from frame-to-frame. Individual proteins appeared as diffraction limited spots and were identified by convolving the image with a disk matrix prior to thresholding, as described previously.17 Object positions for a given image were calculated as the centroid of intensity with a localization precision of ~50nm.38,39 Duplicate objects, which appeared in the same position simultaneously in both donor and acceptor channels, were identified and combined. The center of intensity position used for this combined object was determined by the channel with the better ratio of fluorescence signal to local background. The center of intensity positions were linked together to form a trajectory for each molecule by identifying the nearest objects in sequential frames that were also less than 4 pixels (908 nm) apart. A molecule’s intensity for each frame in each channel (donor intensity, FD, and complementary acceptor intensity, FA) was calculated as the sum of all pixels assigned to the object by the thresholding algorithm, minus a local median background contribution for each pixel.
Analysis of protein-protein associations
A BSA molecule (66.5 kDa) can be approximated as an equilateral triangular with sides, width, and depth of 8.0 nm, 3.0 nm, and 3.0 nm respectively.40 The Förster radius, the radius at which energy transfer was 50% efficient, for the RET pair used in these studies was expected to be 5.1 nm.41 Given the number of fluorescent labels per molecule BSA (~5) and the molecular dimensions, assuming stochastic labeling of protein lysine residues, it was highly likely that any collision between a BSAD and a BSAA molecule resulted in at least one proximal RET-pair. Similarly, it was also likely that donor fluorophores farther from this proximal RET-pair underwent less efficient RET, resulting in non-zero emission from these donor fluorophores.
Intermolecular RET was used as a direct indicator of protein-protein associations. Due to the presence of multiple fluorescent labels on each molecule, any significant emission in the acceptor channel was presumed to indicate an interaction (contact) between one BSAD molecule and one or more BSAA molecules. We defined ‘significant emission’ in the acceptor channel as any observation for which we could state with 84% confidence that FA>0. In order to do this, we calculated the error (σ) in FA, considering uncertainty due both to assignment of the per-pixel background subtraction and to an expected Poisson distribution in the number of collected photons. Assuming that observations of FA were distributed normally about their true value, a one-tailed z-test allowed us to conclude that FA>0 (i.e. ‘significant emission’) with 84% confidence (i.e. z=1) if FA>zσ. Thus, any observation of acceptor intensity greater than its uncertainty was deemed ‘associated’. We also note that although classification of data into discrete associated and unassociated states requires an arbitrary choice of confidence interval, we found that numerical values to describe associations varied only weakly with confidence interval (e.g. higher confidence intervals slightly decreased the frequency and duration of apparent association events). More importantly, the qualitative trends described in the Results were unaffected by choice of confidence interval.
The extent of RET observed (measured via FA and FD) is a function of the physical distances between all donor and acceptor fluorophores present in a BSAD-BSAA interaction. An apparent relative donor-acceptor distance, dapp = (FD/FA) 1/6 was examined in order to better understand the potential geometries of protein-protein associations.41–44 Here, the apparent relative distance provides a convenient way to display the RET signal, but should not be interpreted as a quantitative distance due to the fact that the average RET efficiency over each observation period depends on multiple RET events between multiple RET pairs with stochastically-distributed donor-acceptor distances. Nevertheless, dapp was found to be a useful index for qualitatively distinguishing between broad classes of protein-protein associations without quantifying individual donor-acceptor separations. Three broad categories of RET efficiencies, and association geometries, were identified. Partial-RET associations, where both donor and acceptor emission were observed (0.5< dapp <1.7 in Figure 2), were defined as observations in which both FA and FD were greater than zero at 84% confidence. Complete-RET associations, representing situations where every donor fluorophore on the BSAD molecule was close to one or more acceptor fluorophores, were defined as observations where only FA > 0 (shown as dapp <0.5 in Figure 2). This situation likely occurred only when multiple BSAA molecules were present (Figure 1c). Finally unassociated, zero-RET, events (Figure 1a) were defined as trajectory steps where only FD > 0 (shown as dapp >1.7, Figure 2). An individual molecule experienced any of these states – partial-RET, complete-RET, and zero-RET – for various intervals during its surface residence time.
Figure 2.

(a) Probability distribution of apparent relative distance, dapp , for BSA on PEG at an [BSAA] = 2.5×10⁻⁴ mg/ml. The ‘box-like’ ends of the distribution represent object times where either FD or FA was not significantly greater than 0, and the dapp-value could not be accurately calculated. A step-function was used to describe these extreme dapp-values. The area under each ‘box’ is proportional to the number of observation where FD was not significant for 0.0< dapp <0.5 and the number of observations where FA was not significant for 1.7< dapp <2.2. (b) Object fluorescence intensities in the acceptor channel and donor channel are shown for several trajectories at [BSAA] = 2.5×10⁻⁴ mg/ml. Acceptor channel intensities significantly above 0 represent protein-protein associations and are highlighted as either complete-RET or partial-RET. Zero-RET states are shown in white. Protein-protein association contact times were extracted from many individual object trajectories.
Figure 1.

Multiply-labeled BSA RET (a) zero-RET, donor fluorescence only; (b) partial-RET, both donor and acceptor fluorescence; (c) complete-RET, acceptor fluorescence only; (d) physical interpretation of RET states a-c.
The amount of time two or more proteins remained associated, or the contact time, was calculated as the number of sequential frames - multiplied by the acquisition time – in which the acceptor intensity remained significantly above local background noise. Objects that initially adsorbed in the associated state, and remained associated for their entire surface residence times were excluded from contact time distributions since it was impossible to quantify the time spent between association and dissociation for these objects. Only associated objects, where association was observed in addition to either dissociation or desorption (with desorption from an associated state also presumed to represent the end of the association), were included in the contact time distribution. Donor fluorophore photobleaching could also erroneously cause apparent desorption as well as apparent dissociation of an associated protein. However, donor fluorophore photobleaching occurred on a time scale that was an order of magnitude slower than observed contact times (see Supporting Information, Section 3).
The cumulative probability distribution, P, of observing a given contact time, t, or greater was then constructed by determining the number of associations, n, with a contact time greater than t and normalizing by the total number of associations observed:
| (1) |
For part of the subsequent analysis, associations were classified as either partial-RET or complete-RET. Association intervals that contained both partial-RET and complete-RET observations were assigned as either a complete-RET or partial-RET association based on which state represented a larger fraction of the interval. Association intervals with an equal number of partial-RET and complete-RET observations were classified as complete-RET associations.
Like desorption, to a first approximation, dissociation was expected to be a first-order process with respect to the labeled-observable species. However, protein-protein interactions were inherently heterogeneous (e.g. orientation, number of proteins). This heterogeneity led to varied association and dissociation dynamics and a range of characteristic corresponding kinetic rates. In the case where there were multiple first-order dissociation rates, the cumulative contact time distribution was modeled by Equation 2
| (2) |
where fi is the relative fraction of all contact time associations represented by population i and a characteristic contact time of τi for M populations. The normalization constant, A, is not a free parameter, but is given by such that f(t)=1 at t=tmin, where tmin is the minimum observable contact time. A value of A−1 corrects for the fact that finite time resolution inherently neglects short-lived associations.45 The given formula for A performs this correction self-consistently by calculating the number of objects that would be neglected based on the model fit to the measurable contact time distribution. Fractions and characteristic contact times were extracted by fitting Equation 2 to an experimental cumulative distribution, P(t), described in Equation 1. We reported the standard error of the fit for each parameter.
An object’s surface residence time (i.e. the time between adsorption and desorption) was calculated as the number of frames in which the object was identified multiplied by the acquisition time of 200 ms. The deactivation of donor fluorophores through photobleaching would also appear as a desorption event. The characteristic time scale of donor fluorophore photobleaching was quantified by immobilizing BSAD molecules at the interface and measuring the rate of apparent desorption (see Supporting Information Section 3.2 for details). The characteristic photobleaching time of 57 ± 2 s was an order of magnitude longer than the mean characteristic residence time of associating proteins, indicating that photobleaching did not significantly contribute to desorption events. Objects with residence times of two frames or less were not used in subsequent analysis in order to eliminate false protein identifications that were actually due to stochastic noise. The effect of finite movie length, in which longer surface residence times have a lower a priori probability of being observed, was accounted for by multiplying the number of objects observed to have a given residence time by a correction factor. Experimental cumulative residence time distributions were constructed as in Equation 1 by summing the number of objects observed residing from time t’>t and correcting for finite movie lengths with a correction factor: where T is the length of the movie and H is the Heaviside step function. Cumulative residence time distributions from multiple movies for each bulk protein concentration were averaged by weighting each movie by the number of objects observed in that movie. The number of objects with a given residence time follows Poisson statistics with the error shown for each data point representing 68% confidence intervals for a Poisson distribution as described previously.45
Results
Direct observation of protein-protein interactions
We observed dynamic protein associations and dissociations under conditions of intermediate surface coverage, which was substantially higher than the situation where all proteins are isolated, and conversely, substantially lower than complete monolayer coverage. In these experiments, PEG-modified surfaces were exposed to protein solutions comprised of 10−6-10−7 mg/ml of BSAD and 1-2 orders of magnitude greater concentration (2.5×10⁻⁴-2.5×10⁻⁶ mg/ml) of BSAA. As an upper limit, the ratio of solution volume to surface area in our flow cell (1.3×10⁻⁴ m), at 2.5×10⁻⁴ mg/ml concentration, would yield 0.033 mg/m2 if all protein adsorbed. The surface coverage of BSA on our PEG-modified surfaces at 2.5×10⁻⁴ mg/ml was measured to be 0.0011 ± 0.0004 mg/m2, consistent with previous observations of low BSA surface coverage, relative to other surface chemistries, on PEG-modified surfaces.46–48 Thus the bulk concentrations used two orders of magnitude below the theoretical amount of protein required to cover the surface in a monolayer (typically 1-5 mg/m2).49 These concentrations allowed us to assess dynamic protein behavior at low overall protein surface coverage, representative of early stages of layer formation sometimes known as the induction phase.18,49–52 In previous SM-TIRFM experiments of protein adsorption we used extremely low bulk protein solution concentrations (equivalent to a maximum coverage of 1.3×10⁻⁵ mg/m2 assuming all protein adsorbed) to ensure isolated proteins at the interface.15–17 The concentrations used here were 102-104 fold higher, leading to a measurable frequency of protein-protein interactions, which was evident by the observation of dynamic RET signals. Therefore even at the highest BSAD and BSAA solution concentrations of 1×10⁻⁶ mg/mL and 2.5×10⁻⁴ mg/mL respectively, we were able to resolve single molecule diffraction limited spots due to low BSAD surface coverage (0.098 molecules per μm2 or 0.0051 molecules per pixel) and to measure protein-protein associations due to relatively high BSAA surface coverage (estimated at 25 molecules per μm2).
After exposing a PEG-modified surface to a BSA solution described above, no further protein solution was added to the system and movies were acquired over a two-hour period. The surface coverage and distribution of associations did not change significantly over the entire two hours. We therefore concluded that, under the conditions studied here, an equilibrium between surface and solution protein populations was quickly established and did not evolve with time (e.g. no irreversible cluster growth was observed at these concentrations). Therefore we believe we observed the dynamic exchange of protein monomers and clusters to and from the surface as well as the association and dissociation of interfacial protein oligomers and clusters under a steady-state, dynamic equilibrium process.
Figure 2 shows the distribution of apparent relative donor to acceptor distances, dapp, for each observation in a representative experiment (i.e. FD and FA for all steps associated with a given molecule and for all trajectories). Given the criteria for ‘significant emission’ described above, the dapp-value ranges for three RET states – zero-RET, partial-RET, and complete-RET – can be directly distinguished in the distribution. Due to the complexity of our system (e.g. multiply labeled BSA molecules, diversity of protein-protein orientations, and averaging of different orientations over each observation window) dapp values should not be interpreted as quantitative distance but as a convenient way to qualitatively distinguish structural states. Partial-RET (FA>0 and FD>0) and complete-RET (only FA>0) protein-protein associations (dapp <1.7) were clearly differentiated from isolated BSAD molecules (dapp >1.7) exhibiting zero-RET (FD>0 and FA=0). In Figure 2, step-functions were used to describe extreme dapp-values of zero-RET and complete-RET observations as these dapp-values could not be calculated.
The distribution of partial-RET dapp-values exhibited two peaks. The presence of two apparent peaks (rather than one peak) was an artifact due to the relatively lower probability of identifying objects where FD≅FA (i.e. objects that appear dim in both channels). Indeed the two peaks converged towards one peak when the threshold for identifying objects was decreased (Supporting Information, Section 2). While decreasing the threshold allowed us to capture more objects where FD≅FA, the erroneous identification of objects increased. Therefore we set thresholds conservatively to minimize artifacts due to mis-identifying noise as fluorescent proteins.
Dynamic protein-protein association and dissociation events were inferred from transitions between the three RET states. The time spent associated, or contact time, was calculated as the time between association and dissociation or desorption for 10,000-100,000 molecular trajectories. Several representative trajectories of donor and acceptor channel intensity are shown in Figure 2b. These trajectories contain examples of both complete-RET and partial-RET associated and zero-RET unassociated intervals. As is common with single-molecule data, the trajectory intensities were sometimes noisy. Because of this noise, any strict criterion used to define ‘significant emission’ will necessarily result in some erroneous state assignments. However, by choosing a reasonable criterion that can be applied in a rigorous algorithm, we were able to process large numbers of trajectories without potentially introducing human bias. The consequences of occasional misidentification are two-fold. First, by erroneously identifying partial-RET or complete-RET one-frame association events (e.g. due to short signal fluctuations) we may overestimate the number of short-lived associations. Associations that last for one image could be ignored in our analysis except that we may then also be ignoring true short-lived associations. Second, mistaken identification of zero-RET states in the middle of complete-RET or partial-RET associations would break up long associations into many shorter ones, resulting in an inflated total number of associations and shorter contact times. This concern is greatly mitigated by the fact that our main findings do not rely on a strictly quantitative analysis, instead examining the relative frequencies of each state. Keeping these caveats in mind, the characteristic contact times can reasonably be used as order of magnitude estimates.
Protein-protein associations were heterogeneous and reversible
Interestingly, most proteins remained associated for very short times, with greater than 90% of associated proteins dissociating in less than 2 s. Cumulative contact time distributions, representing the probability that two (or more) proteins remained associated for a time t or greater, are depicted in Figure 3. Under the low coverage conditions of these experiments, one might naively expect dissociation to be a first order process (i.e. one associated protein oligomer/cluster splitting into two or more proteins). On the log-linear plot in Figure 3, a single first-order (decaying exponential) process would appear as a straight line. Clearly the behavior appears nonlinear on these axes, suggesting that multiple classes of association processes occurred, each with a characteristic contact time or dissociation rate. For example, three populations were sufficient to describe the contact time cumulative distribution of all associations in Figure 3.
Figure 3.
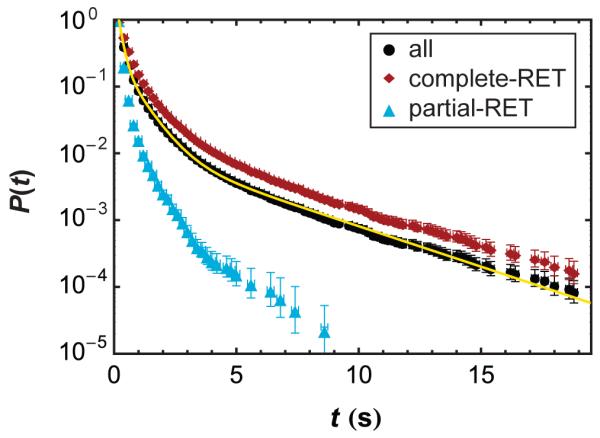
Cumulative contact time distributions of BSA (2.5 × 10⁻⁴ mg/ml) on PEG for all associations, only complete-RET associations, and only partial-RET associations. Error bars represent the Poisson distribution confidence interval of 68%. The yellow line is a fit to the data for all associations using Equation 2 with three populations (M = 3).
The majority of dissociation events belonged to the population with the shortest characteristic contact time, and successively longer contact times represented smaller and smaller fractions of events (see Table 1). At a BSAA concentration of 2.5×10⁻⁴ mg/ml (shown in Figure 3) 88 ± 1% of the association events exhibited a characteristic contact time of 0.13 ± 0.01s, 10.3 ± 0.2% of the events dissociated with a characteristic time of 0.75 ± 0.02s, and the remaining 1.4 ± 0.1% had a characteristic time of 4.4 ± 0.1s. Notably, as the bulk concentration decreased, the fraction of short-lived associations increased, as shown in Table 1. The contact time distribution shown in Figure 3 represented 65,588 dynamic associations, allowing relatively rare, long-lived associations to be characterized with statistical significance.
Table 1.
Association population fractions and characteristic contact times for each bulk BSAA concentration.
| [BSAA] | ||||||
|---|---|---|---|---|---|---|
| 2.5×10⁻⁴ mg/ml | 2.5×10⁻⁵ mg/ml | 2.5×10⁻⁶ mg/ml | ||||
| population | fi | τi (s) | fi | τi (s) | fi | τi (s) |
| 1 | 0.88(1) | 0.13(1) | 0.95(1) | 0.11(1) | 0.97(1) | 0.10(1) |
| 2 | 0.103(2) | 0.75(2) | 0.045(2) | 0.52(2) | 0.026(2) | 0.44(2) |
| 3 | 0.014(1) | 4.4(1) | 0.0075(3) | 2.68(6) | 0.0022(2) | 2.26(9) |
It is interesting to note that the majority of associations exhibited a characteristic contact time that was less than the acquisition time of 200 ms. Indeed, this suggests that many short-lived associations were presumably not detected. However, the time resolution was sufficient to allow us to identify associations with contact times on the order of 200 ms or greater that belonged to this short-lived population. Thus it was possible to determine the characteristic contact time for the entire short-lived population (according to Equation 2) based on the tail of this population.
We found that the association state (i.e. complete-RET or partial-RET) greatly influenced the contact time for a given association. In particular, complete-RET associations accounted for all contact times longer than 10 s in Figure 3. Importantly, while complete-RET contact times were longer, partial-RET associations accounted for the majority of associations. For example, at [BSAA] = 2.5×10⁻⁴ mg/ml, partial-RET associations accounted for 65 ± 9% of all dynamic associations and this fraction rose with decreasing [BSAA].
Protein-protein associations led to longer surface residence times
Proteins that associated at some point during their surface residence time, on average, resided on the surface longer than proteins that remained unassociated for their entire surface residence time. Previous work in our group had shown that dimers and larger oligomers resided on the surface for significantly longer time intervals than monomeric protein.15 In the current work, we found that protein oligomerization was dynamic, allowing us to directly compare the surface behavior of objects that dynamically associated (oligomer formation) to those that remained unassociated (monomers). Molecular trajectories that underwent at least one association event resided on the surface for 3-4 times longer on average and accounted for all surface residence times longer than 10 s (Figure 4). Because interacting and associated proteins remained on the surface much longer, they contributed disproportionally to the total surface coverage. These findings support the notion that protein-protein interactions are crucial in explaining protein interfacial phenomena at high surface coverage (i.e. protein layer formation).
Figure 4.
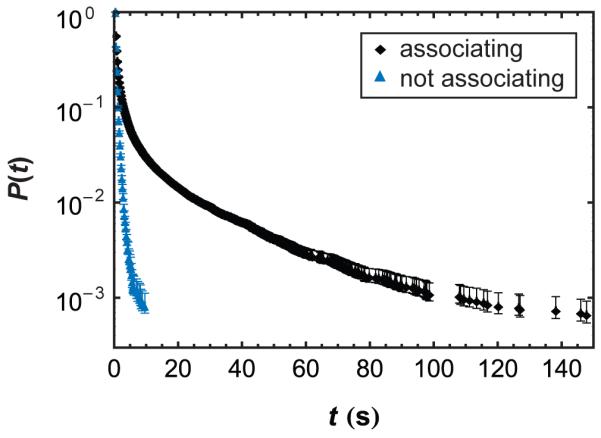
Cumulative surface residence time distribution of objects associated at some time during their trajectory and those that remained unassociated for their entire surface residence times for a [BSAA] = 2.5×10⁻⁵ mg/ml.
Fractions of clusters and free monomers changed systematically with protein concentration
To examine the effects of surface coverage on protein-protein interactions, bulk protein solution concentrations were varied by two orders of magnitude. The average fraction of time a molecule spent in the complete-RET state (tcomplete), partial-RET state (tpartial), or zero-RET (tunassociated) state was quantified for each concentration in Figure 5. These fractions were calculated by counting the number of observations of all steps of all trajectories in each state, including molecular trajectories that were either unassociated (monomers) or associated (oligomers/clusters) for their entire trajectories, and normalizing by the total number of observations. Two clear trends emerged: (1) the fraction of time molecules spent unassociated decreased with increasing concentration; and (2) the fraction of time molecules spent completely associated increased with increasing concentration. The latter trend could indicate either that protein-cluster interactions were more frequent or longer-lasting at higher surface densities. However, as discussed below, Figure 6a shows that the complete-RET contact times were similar across all concentrations. Thus, protein-cluster interactions became more frequent at higher surface density, and this was likely due to an increasing number density of clusters with increasing surface coverage. Further analysis of cluster spatial distributions showed that the number of unique cluster locations did indeed increase with increasing bulk protein concentrations (Supporting Information Section 1).
Figure 5.
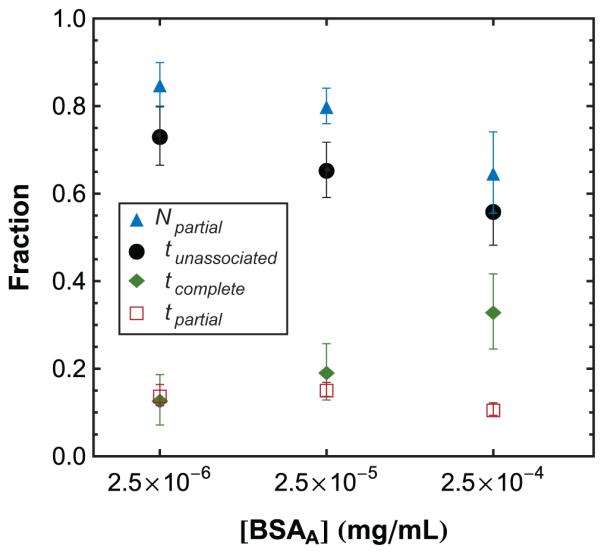
Effects of BSAA concentration. The average fraction of time spent in complete-RET associated (tcomplete), partial-RET associated (tpartial), and zero-RET unassociated (tunassociated) states is shown as a function of bulk BSAA concentration. The average number fraction of all associations that were partial-RET associations (Npartial) is also shown. Error bars represent the standard deviation between movies for experiments at a given concentration.
Figure 6.
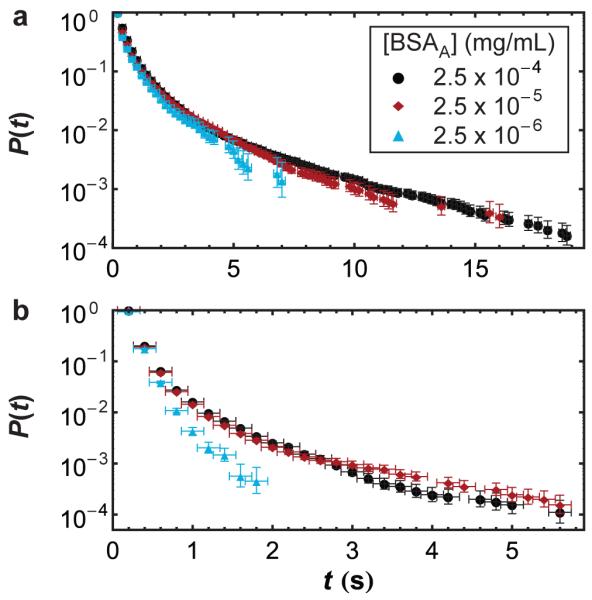
Contact time cumulative distribution for (a) complete-RET associations and (b) partial-RET associations for each bulk BSAA concentration.
Unlike the case for complete-RET associations, the fraction of time spent partially associated remained relatively low, at 10-15%, and did not exhibit a clear trend as the bulk protein concentration varied. Although higher surface coverage implies that more proteins are available to interact on the surface, these observations suggests that the partial-RET state must compete with the longer-lasting complete-RET state. Indeed, Figure 5 shows that the relative number of partial-RET associations (Npartial) decreased with increasing concentration. Our data suggest that proteins added to a cluster-laden surface preferentially associate with clusters in much the same way that surfactant monomers form micelles aggregates above a critical concentration. Ultimately we expect partial-RET states to be absent at complete monolayer coverage, since cluster formation, unlike micellization, is not necessarily self-limiting.
Figure 6b shows the cumulative contact time distribution for partial-RET associations at different bulk concentrations of BSAA. At the lowest concentration, contact times followed nearly a mono-exponential decay, but the longer tails of the contact time distribution indicated the presence of some longer-lived partial-RET associations at higher BSAA concentrations. Thus, we hypothesize that partial-RET interactions were mostly monomer-monomer at the lowest BSAA concentration but that some BSAD monomers did interact with the borders of larger clusters at higher BSAA concentrations. In these proposed partial-RET border interactions, even though a BSAD molecule interacts closely only with approximately one BSAA at a time, it may interact sequentially with different BSAA molecules in the cluster, thereby increasing the total amount of time it spends associated with the cluster.
Discussion
The surface coverage in these experiments was two to four orders of magnitude below that required for full monolayer coverage yet high enough to observe protein-protein associations. Because the surface was only partially covered with protein, we envision a surface with distinct local environments: areas with high local surface density (i.e. protein clusters) and areas with low surface density (where isolated monomers interact only with the surface). This picture is consistent with previous observations of BSA clustering at the oil-water interface and other proteins at the solid-liquid interface.12,18,21,22,26,27
We propose that the observation of a partial-RET event vs. a complete-RET event was related to the number of proteins involved in the association (as shown schematically Figure 1). Because proteins were labeled with multiple fluorescent dyes, complete-RET was extremely unlikely for an individual BSAD-BSAA interaction because some donor fluorophores would always be far (relative to the Förster radius) from the nearest acceptor. A similar situation would result when a BSAD molecule associated with a protrusion from a larger cluster of BSAA molecules. If, however, a BSAD molecule interacted simultaneously with multiple BSAA molecules, it was possible for each donor fluorophore to abut an acceptor fluorophore, leading to a high-RET situation where little or no donor radiation was emitted. In this scenario, partial-RET events are proposed to represent dynamic dimers or a BSAD molecule interacting with the edge of a BSAA cluster. Complete-RET events are proposed to represent a BSAD molecule interacting with multiple BSAA monomers, oligomers, or larger clusters.
This interpretation of partial-RET and complete-RET is also consistent with contact time observations (Figure 3). One might expect two interacting proteins to remain associated for less time than multiple proteins or protein clusters. Indeed, partial-RET contact times were significantly shorter than complete-RET contact times. While some longer-lived partial-RET associations were observed at high concentrations (see Figure 6b), it is clear from Figure 3 that partial-RET associations were dominated by short associations.
Heterogeneous surface coverage models generally predict that the ratio of surface area occupied by protein clusters to the area occupied by monomers should increase with increasing protein surface coverage. Intuitively, we expect to see a greater number of high density, cluster regions at higher bulk protein concentrations, and this matches observations made in this work. The average fraction of time spent in complete-RET states (high density/clusters), as well as the number of unique cluster locations (Supporting Information Figure S1), did indeed increase with increasing bulk concentration while the time spent in the zero-RET state decreased (Figure 5).
Interestingly, contact times of complete-RET associations were essentially independent of concentration (Figure 6a). Similarly, partial-RET contact times were similar for the two higher concentrations tested in this work (Figure 6b). Therefore, we propose that BSAD-BSAA interactions within a cluster depend primarily on the local environment and are independent of the global surface coverage. Thus, the number or size of clusters might change with concentration but the dynamics in these local environments remain relatively constant.
Ultimately these findings support a nucleation and growth model of BSA at protein surface coverage below that of a close-packed monolayer. A nucleation and growth model of surface coverage has been proposed and developed for many different interfacial phenomena including epitaxial growth and self-assembled monolayer growth.53–55 Similar models have been applied to protein crystallization in solution as well.56,57 Surface clustering has been proposed previously for protein surface layer formation, and data from optical waveguide lightmode spectroscopy and atomic force microscopy experiments have indicated the presence of surface clusters.11,12,21,22,24,52,58,59 Due to poor spatial or temporal resolution of these techniques, it has been difficult, until now, to make dynamic in situ measurements of cluster formation. This capability, demonstrated in the present work, helps to address the underlying mechanisms of surface clustering in protein layers.
Three cluster formation mechanisms have previously been proposed: (1) oligomer adsorption from solution, (2) cooperative adsorption of proteins onto existing clusters, and (3) protein adsorption and surface diffusion to clusters.7,12,24 Kastantin et al. showed that oligomers formed in solution adsorbed to the interface, demonstrating that mechanism 1 is feasible and that mechanism 2 is also possible, although it was not directly tested here.15
Protein surface mobility has generally been ignored in adsorption models, mainly because protein surface mobility has not been extensively studied. The implicit assumption of surface immobility has usually led to a preference for mechanism 2 over mechanism 3.26,27 However, lateral protein diffusion has recently become more widely acknowledged. An upper limit of protein mobility has been measured with fluorescence recovery after photobleaching (FRAP) techniques on the order of 10−9 – 10−10 cm2 s−1.48,60–62 Our lab has observed protein surface diffusion and quantified surface diffusion distributions for fibrinogen and BSA on several surfaces, where monomers exhibit diffusion coefficients on the order of 10−9 – 10−10 cm2 s−1, consistent with FRAP measurements.15,16
In the present work, molecules moved on the surface with an average diffusion coefficient of 4.5±0.1 × 10⁻¹⁰ cm2 s−1 (see Supporting Information, Section 4). This diffusion coefficient implies that a single BSAD molecule collides with at least one BSAA molecule every 1 s given a BSAA surface coverage of 25 molecules/μm2 at a [BSAA] = 2.5×10⁻⁵ mg/ml. Consistent with this estimation, a high frequency of dynamic association and dissociation events were observed (~60% of all trajectories experienced at least one association or dissociation event). Observations of protein diffusion and dynamic protein association at the surface clearly show that mechanism 3 is important to include in any mechanistic picture of surface clustering under these solution and surface conditions. Certainly the molecular mobility might be expected to change as the surface becomes increasingly covered by an incipient protein layer, and in principle this might be probed by following fluorescently-labeled proteins in the presence of very high concentrations of unlabeled protein. In fact we have performed such experiments, and have observed continued mobility even at high surface coverage. However, these observations are difficult to interpret due to the inability to explicitly distinguish between molecules adsorbed directly to the surface and proteins adsorbed to the protein layer itself. The latter process is insignificant at the low surface coverage utilized for the RET experiments reported here, but becomes increasingly important at high surface coverage.
Based on this experimental evidence, we propose a mechanism whereby individual proteins can adsorb to a surface, diffuse to, associate with, and/or dissociate from a cluster, and desorb from the surface. This is consistent with the mechanism proposed by Kim et al.12 who hypothesized that clusters formed when lysozyme molecules diffused slowly on a mica surface and collided with other adsorbed lysozyme molecules. A similar, more detailed mechanism was proposed for BSA at the liquid-liquid interface that included adsorption, nucleation, growth, and desorption (dissociation was ignored).18 Our observations indicate that this mechanism applies to solid-liquid interfaces as well. However, clusters may form and grow more slowly at the solid-liquid interface due to slower diffusion and the ability of clusters to dissociate.
Conclusions
Intermolecular RET and SM-TIRFM was used to identify three distinct RET states for donor-labeled BSA diffusing on a PEG monolayer: partial-RET associated, complete-RET associated, and zero-RET unassociated. The frequency of protein-protein associations and time spent associated (contact time) were quantified by observing transitions between these three states. Protein-protein associations were shown to be both heterogeneous (partial-RET and complete-RET associations exhibited different contact times) and reversible (90% remained associated for 2 s or shorter) and proteins that underwent associations exhibited increased surface residence times. Therefore, not only are protein-protein interactions on the surface dynamic, these interactions can also result in increased time for direct protein-surface interactions that have been proposed to drive protein unfolding over relatively slow time scales.59,63
At the partial surface coverage conditions used here, the surface distribution of proteins was heterogeneous, consisting of local environments of high protein density (clusters) and low protein density (free monomers) and the relative fractions of clusters and free monomers were surface coverage dependent. However, the dynamics within a local environment (e.g. within a cluster) were independent of surface coverage. In particular, the complete-RET contact time distribution did not change significantly with concentration. These observations suggest a model of heterogeneous surface coverage of clusters and free monomers where the local surface environment dynamics (near clusters or in free space) are independent of surface coverage in the coverage regime studied in this work.
The direct observation of dynamic non-specific protein-protein associations at the solid-liquid interface provides important insights into the complex mechanisms by which protein layers form. Many previous kinetic models of protein adsorption, such as random sequential adsorption (RSA), assume immobile, non-associating proteins.8,64 Protein cluster formation, especially dynamic protein cluster formation, are not anticipated for proteins in such models. These experiments provide direct evidence that surface diffusion and dynamic surface protein-protein association and dissociation must be incorporated in such kinetic models. Future applications of this experimental approach will examine the effects of surface chemistry, environmental conditions, and choice of protein on clustering behavior.
Supplementary Material
Acknowledgements
BBL acknowledges support from the National Science Foundation Industry/University Cooperative Research Center for Membrane Science, Engineering and Technology (IIP1034720). Support for RW and the development of high-throughput dual-channel tracking methods was provided by the U.S. Department of Energy Basic Energy Sciences, Chemical Sciences, Geosciences, and Biosciences Division (under award DE-SC0001854). Support for MK was provided by the National Institute of Biomedical Imaging and Bioengineering of the National Institutes of Health (under award #5R21EB015532-02).
References
- (1).Nakanishi K, Sakiyama T, Imamura K. J. Biosci. Bioeng. 2001;91:233–244. doi: 10.1263/jbb.91.233. [DOI] [PubMed] [Google Scholar]
- (2).Vogler EA. Biomaterials. 2012;33:1201–1237. doi: 10.1016/j.biomaterials.2011.10.059. [DOI] [PMC free article] [PubMed] [Google Scholar]
- (3).Ratner BD, Bryant SJ. Annu. Rev. Biomed. Eng. 2004;6:41–75. doi: 10.1146/annurev.bioeng.6.040803.140027. [DOI] [PubMed] [Google Scholar]
- (4).Mansouri J, Harrisson S, Chen V. J. Mater. Chem. 2010;20:4567–4586. [Google Scholar]
- (5).Bee JS, Randolph TW, Carpenter JF, Bishop SM, Dimitrova MN. J. Pharm. Sci. 2011;100:4158–4170. doi: 10.1002/jps.22597. [DOI] [PubMed] [Google Scholar]
- (6).Norde W. Colloids Surf. B. Biointerfaces. 2008;61:1–9. doi: 10.1016/j.colsurfb.2007.09.029. [DOI] [PubMed] [Google Scholar]
- (7).Rabe M, Verdes D, Seeger S. Adv. Colloid Interface Sci. 2011;162:87–106. doi: 10.1016/j.cis.2010.12.007. [DOI] [PubMed] [Google Scholar]
- (8).Talbot J, Tarjus G, Van Tassel PR, Viot P. Colloids Surf. A. Physicochem. Eng. Asp. 2000;165:287–324. [Google Scholar]
- (9).Wang X, Wang Y, Xu H, Shan H, Lu JR. J. Colloid Interface Sci. 2008;323:18–25. doi: 10.1016/j.jcis.2008.04.024. [DOI] [PubMed] [Google Scholar]
- (10).McMaster TJ, Miles MJ, Shewry PR, Tatham AS. Langmuir. 2000;16:1463–1468. [Google Scholar]
- (11).Mulheran P, Pellenc D, Bennett RA, Green RJ, Sperrin M. Phys. Rev. Lett. 2008;100:068102. doi: 10.1103/PhysRevLett.100.068102. [DOI] [PubMed] [Google Scholar]
- (12).Kim DT, Blanch HW, Radke CJ. Langmuir. 2002;18:5841–5850. [Google Scholar]
- (13).Cullen DC, Lowe CR. J. Colloid Interface Sci. 1994;166:102–108. [Google Scholar]
- (14).Daly SM, Przybycien TM, Tilton RD. Colloids Surf. B. Biointerfaces. 2007;57:81–8. doi: 10.1016/j.colsurfb.2007.01.007. [DOI] [PubMed] [Google Scholar]
- (15).Kastantin M, Langdon BB, Chang EL, Schwartz DK. J. Am. Chem. Soc. 2011;133:4975–4983. doi: 10.1021/ja110663u. [DOI] [PMC free article] [PubMed] [Google Scholar]
- (16).Langdon BB, Kastantin M, Schwartz DK. Biophys. J. 2012;102:2625–2633. doi: 10.1016/j.bpj.2012.04.027. [DOI] [PMC free article] [PubMed] [Google Scholar]
- (17).Walder R, Schwartz DK. Langmuir. 2010;26:13364–13367. doi: 10.1021/la1023357. [DOI] [PubMed] [Google Scholar]
- (18).Walder R, Schwartz DK. Soft Matter. 2011;7:7616–7622. [Google Scholar]
- (19).Kastantin M, Keller TF, Jandt KD, Schwartz DK. Adv. Funct. Mater. 2012;22:2617–2623. [Google Scholar]
- (20).Keller TF, Schönfelder J, Reichert J, Tuccitto N, Licciardello A, Messina GML, Marletta G, Jandt KD. ACS Nano. 2011;5:3120–3131. doi: 10.1021/nn200267c. [DOI] [PubMed] [Google Scholar]
- (21).Ramsden JJ, Bachmanova GI, Archakov AI. Phys. Rev. E. 1994;50:5072–5076. doi: 10.1103/physreve.50.5072. [DOI] [PubMed] [Google Scholar]
- (22).Pellenc D, Bennett RA, Green RJ, Sperrin M, Mulheran PA. Langmuir. 2008;24:9648–9655. doi: 10.1021/la801246k. [DOI] [PubMed] [Google Scholar]
- (23).Minton AP. Biophys. Chem. 2000;86:239–247. doi: 10.1016/s0301-4622(00)00151-4. [DOI] [PubMed] [Google Scholar]
- (24).Minton AP. Biophys. J. 2001;80:1641–1648. doi: 10.1016/S0006-3495(01)76136-X. [DOI] [PMC free article] [PubMed] [Google Scholar]
- (25).Rabe M, Verdes D, Seeger S. Soft Matter. 2009;5:1039–1047. [Google Scholar]
- (26).Rabe M, Verdes D, Seeger S. J. Phys. Chem. B. 2010;114:5862–5869. doi: 10.1021/jp909601m. [DOI] [PubMed] [Google Scholar]
- (27).Rabe M, Verdes D, Zimmermann J, Seeger S. J. Phys. Chem. B. 2008;112:13971–13980. doi: 10.1021/jp804532v. [DOI] [PubMed] [Google Scholar]
- (28).Kastantin M, Schwartz DK. Small. 2013;9:933–941. doi: 10.1002/smll.201202335. [DOI] [PMC free article] [PubMed] [Google Scholar]
- (29).Kastantin M, Schwartz DK. ACS Nano. 2011;5:9861–9869. doi: 10.1021/nn2035389. [DOI] [PMC free article] [PubMed] [Google Scholar]
- (30).Alvarez-Curto E, Pediani JD, Milligan G. Anal. Bioanal. Chem. 2010;398:167–80. doi: 10.1007/s00216-010-3823-4. [DOI] [PubMed] [Google Scholar]
- (31).Truong K, Ikura M. Curr. Opin. Struct. Biol. 2001;11:573–578. doi: 10.1016/s0959-440x(00)00249-9. [DOI] [PubMed] [Google Scholar]
- (32).Papra A, Gadegaard N, Larsen NB. Langmuir. 2001;17:1457–1460. [Google Scholar]
- (33).Janssen D, De Palma R, Verlaak S, Heremans P, Dehaen W. Thin Solid Films. 2006;515:1433–1438. [Google Scholar]
- (34).Unsworth LD, Sheardown H, Brash JL. Langmuir. 2008;24:1924–1929. doi: 10.1021/la702310t. [DOI] [PubMed] [Google Scholar]
- (35).Pasche S, De Paul SM, Vörös J, Spencer ND, Textor M. Langmuir. 2003;19:9216–9225. [Google Scholar]
- (36).Honciuc A, Harant AW, Schwartz DK. Langmuir. 2008;24:6562–6566. doi: 10.1021/la8007365. [DOI] [PubMed] [Google Scholar]
- (37).McLoughlin SY, Kastantin M, Schwartz DK, Kaar JL. Proc. Natl. Acad. Sci. doi: 10.1073/pnas.1311761110. In Press. DOI: 10.1073/pnas.1311761110. [DOI] [PMC free article] [PubMed] [Google Scholar]
- (38).Kastantin M, Schwartz D. Microsc. Microanal. 2012;18:793–797. doi: 10.1017/S1431927612000438. [DOI] [PMC free article] [PubMed] [Google Scholar]
- (39).Kastantin M, Walder R, Schwartz DK. Langmuir. 2012;28:12443–56. doi: 10.1021/la3017134. [DOI] [PMC free article] [PubMed] [Google Scholar]
- (40).Carter DC, Ho JX. Adv. Protein Chem. 1994;45:153–203. doi: 10.1016/s0065-3233(08)60640-3. [DOI] [PubMed] [Google Scholar]
- (41).Lakowicz JR. In: Principles of Fluorescence Spectroscopy. Lakowicz JR, editor. Springer; New York: 2006. pp. 443–475. [Google Scholar]
- (42).Jares-Erijman EA, Jovin TM. Nat. Biotechnol. 2003;21:1387–1395. doi: 10.1038/nbt896. [DOI] [PubMed] [Google Scholar]
- (43).Roda A, Guardigli M, Michelini E, Mirasoli M. Anal. Bioanal. Chem. 2009;393:109–123. doi: 10.1007/s00216-008-2435-8. [DOI] [PubMed] [Google Scholar]
- (44).Wu P, Brand L. Anal. Biochem. 1994;218:1–13. doi: 10.1006/abio.1994.1134. [DOI] [PubMed] [Google Scholar]
- (45).Kastantin M, Schwartz DK. ChemPhysChem. 2013;14:374–380. doi: 10.1002/cphc.201200838. [DOI] [PubMed] [Google Scholar]
- (46).Norde W, Gage D. Langmuir. 2004;20:4162–7. doi: 10.1021/la030417t. [DOI] [PubMed] [Google Scholar]
- (47).Prime K, Whitesides G. J. Am. Chem. Soc. 1993:10714–10721. [Google Scholar]
- (48).Yang Z, Galloway JA, Yu H. Langmuir. 1999;15:8405–8411. [Google Scholar]
- (49).Norde W, Favier JP. Colloids and Surfaces. 1992;64:87–93. [Google Scholar]
- (50).Kwok KC, Yeung KM, Cheung NH. Langmuir. 2007;23:1948–52. doi: 10.1021/la061779e. [DOI] [PubMed] [Google Scholar]
- (51).Tanaka M, Mochizuki A, Shiroya T, Motomura T, Shimura K, Onishi M, Okahata Y. Colloids Surfaces, A. Physicochem. Eng. Asp. 2002;203:195–204. [Google Scholar]
- (52).Calonder C, Tie Y, Van Tassel PR. Proc. Natl. Acad. Sci. U. S. A. 2001;98:10664–10669. doi: 10.1073/pnas.181337298. [DOI] [PMC free article] [PubMed] [Google Scholar]
- (53).Amar JG, Family F, Lam P. Phys. Rev. B. 1994;50:8781–8797. doi: 10.1103/physrevb.50.8781. [DOI] [PubMed] [Google Scholar]
- (54).Doudevski I, Schwartz DK. J. Am. Chem. Soc. 2001;123:6867–6872. [Google Scholar]
- (55).Doudevski I, Schwartz DK. Appl. Surf. Sci. 2001;175:17–26. [Google Scholar]
- (56).Durbin SD, Feher G. Annu. Rev. Phys. Chem. 1996;47:171–204. doi: 10.1146/annurev.physchem.47.1.171. [DOI] [PubMed] [Google Scholar]
- (57).Durbin SD, Carlson WE. J. Cryst. Growth. 1992;122:71–79. [Google Scholar]
- (58).Nygren H, Alaeddin S, Lundström I, Magnusson K-E. Biophys. Chem. 1994;49:263–272. [Google Scholar]
- (59).Tie Y, Calonder C, Van Tassel PR. J. Colloid Interface Sci. 2003;268:1–11. doi: 10.1016/s0021-9797(03)00516-2. [DOI] [PubMed] [Google Scholar]
- (60).Yuan Y, Velev OD, Lenhoff AM. Langmuir. 2003;19:3705–3711. [Google Scholar]
- (61).Tilton R, Gast A, Robertson C. Biophys. J. 1990;58:1321–1326. doi: 10.1016/S0006-3495(90)82473-5. [DOI] [PMC free article] [PubMed] [Google Scholar]
- (62).Tilton R, Robertson C, Gast A. J. Colloid Interface Sci. 1990;137:192–203. [Google Scholar]
- (63).Wertz CF, Santore MM. Langmuir. 2001;17:3006–3016. [Google Scholar]
- (64).Andrade JD, Hlady V. Adv. Polym. Sci. 1986;79:1–63. [Google Scholar]
Associated Data
This section collects any data citations, data availability statements, or supplementary materials included in this article.