Abstract
Background & Aims
Pancreatic ductal adenocarcinoma (PDAC) is characterized by a prominent desmoplastic microenvironment that contains many different immune cells. Activated pancreatic stellate cells (PSCs) contribute to the desmoplasia. We investigated whether distinct stromal compartments are differentially infiltrated by different types of immune cells.
Method
We used tissue microarray analysis to compare immune cell infiltration of different pancreatico-biliary diseased tissues (PDAC, ampullary carcinoma, cholangiocarcinoma, mucinous cystic neoplasm, chronic inflammation, and chronic pancreatitis), and juxtatumoral stromal (<100 μm from tumor) and panstromal compartments. We investigated the association between immune infiltrate and patient survival times. We analyzed T-cell migration and tumor infiltration in LSL-KrasG12D/+; LSL-Trp53R172H/+; Pdx-1-Cre (KPC) mice, and the effects of all-trans retinoic acid (ATRA) on these processes.
Results
Juxtatumoral compartments in PDAC samples from 2 independent groups of patients contained increased numbers of myeloperoxidase+ and CD68+ cells, compared with panstromal compartments. However, juxtatumoral compartments of PDACs contained fewer CD8+, FoxP3+, CD56+, or CD20+ cells than panstromal compartments, a distinction absent in ampullary carcinomas and cholangiocarcinomas. Patients with PDACs that had high densities of CD8+ T-cells in the juxtatumoral compartment had longer survival times than patients with lower densities. In KPC mice, administration of ATRA, which renders PSCs quiescent, increased numbers of CD8+ T-cells in juxtatumoral compartments. We found that activated PSCs express cytokines, chemokines, and adhesion molecules that regulate T-cell migration. In vitro migration assays showed that CD8+ T-cells from PDAC patients had increased chemotaxis towards activated PSCs, which secrete CXCL12, compared with quiescent PSC or tumor cells. These effects could be reversed by knockdown of CXCL12 or treatment of PSCs with ATRA.
Conclusion
Based on studies of human PDAC samples and KPC mice, activated PSCs appear to reduce migration of CD8+ T-cells to juxtatumoral stromal compartments, preventing their access to cancer cells. Deregulated signaling by activated PSCs could prevent an effective anti-tumor immune response.
Keywords: anti-tumor immunity, pancreatic cancer, mouse model, immune regulation
INTRODUCTION
Despite our increased understanding of pancreatic ductal adenocarcinoma (PDAC) from transgenic mouse models,1 this human disease remains resistant to systemic therapies. Genomic and epigenetic alterations that are characteristic of all cancers provide a diverse set of antigens that immune cells can use to distinguish and selectively target malignant cells.2-4 The importance of tumor-infiltrating lymphocytes, in particular anti-tumor CD8+ cytotoxic T-cell location, has been highlighted by their prognostic value in many human cancers.2-7 However, similar immunohistological analysis investigating the correlation of T-cell infiltration with pancreatico-bilary cancer prognosis has been understudied to date. Increased infiltration of immunosuppressive cells such as tumor-associated macrophages (TAMs), myeloid derived suppressor cells (MDSCs) and regulatory T-cells (Tregs) has been detected in the inflammatory tumor microenvironment of genetic mouse models of PDAC (including ‘KPC’ mice: LSLKrasG12D/+; LSL-Trp53R172H/+; Pdx-1-Cre) during disease progression to invasive cancer.8 In human disease, increased Tregs infiltration was found to be increased in PDAC tissue when compared to non-malignant pancreas, whereas no differences were observed in peripheral blood mononuclear cells of healthy donors compared to cancer patients.9
PDAC is characterized by a pronounced desmoplastic reaction mediated by the activation of quiescent pancreatic stellate cells (PSC).10 We have previously demonstrated that this critical event is reversible.11 Importantly, in situ hybridization studies from other groups have demonstrated differential gene expression signatures when comparing defined stromal compartments in PDAC that include the juxtatumoral stroma (immediately adjacent to the tumor epithelial cells) and the panstromal compartment (non-adjacent to tumor cells).12, 13 In this present study, we show for the first time that there is differential immune cell infiltrate unique to these PDAC stromal compartments and that enhanced juxtatumoral CD8+ T-cell infiltrate correlates with better patient survival. Our experimental assays, including the use of the KPC PDAC mouse model, show that CD8+ T-cells are prevented from targeting PDAC cells by activated PSC that reside in the panstromal compartment. Of translational relevance, rendering activated PSC quiescent reduced PDAC patient CD8+ T-cell in vitro migration and adhesion towards PSC and allowed enhanced in vivo juxtatumoral infiltration of CD8+ T-cells.
MATERIALS AND METHODS
Tissue microarray, staining and analysis
Tissue microarrays were constructed with pancreatic tissues collected at cancer resection or biopsy (Supplementary Tables 1-2) at Barts Health NHS Trust (City and East London Research Ethics Committee (REC) 07/0705/87) as described before.14 Regions of tumor, stroma and normal pancreas were marked on Hematoxylin and Eosin (H&E) stained slides of the donor tissue blocks and three 1mm cores of each region were sampled per patient using the Tissue Arrayer Minicore® 3 (Alphelys, Plaisir, France). The TMA’s and whole sections (all formalin-fixed paraffin embedded 4μm sections) were stained with various antibodies (Supplementary Table 3).
Ariol imaging analysis system (Genetix, New Milton, UK) was used to determine immune cell densities. Briefly, software is trained by the user to distinguish and quantify positive (brown: DAB reaction) and negative (blue: hematoxylin counter-stain) cells by their color, shape, size and staining intensity characteristics as described before.15 The juxtatumoral compartment was delineated by using the marker tool to draw around cancer cells (approximately 100μm) in all TMA cores. Panstromal density of immune cell infiltrate was calculated by subtracting the density of the juxtatumoral compartment from the density of the whole TMA core. The median of all analyzed tumor cores (n=6) for each patient was used. Different methods were used to determine immune cell density (Supplementary Figures 1-4). Statistical tests were carried out in Prism software (Graphpad). The X-tile software v.3.6.116, 17 (Yale University) was used to analyze the impact of immune cell infiltrates on patient prognosis by the minimum p-value method.15 Miller-Seigmund p-value corrections were applied.18
Mouse model of PDAC
KPC mice were treated with all-trans retinoic acid (ATRA) dissolved in sesame oil at a dose of 10mg/kg administered daily for 5 days (n=6) or vehicle (n=4), as described before (Supplementary Table 4).11 The whole diseased pancreas, spleen (positive control) and salivary gland (negative control) were stained for immune cells on a single slide.
Culture conditions
Stellate cells (PS1) and primary PSC (pPSC) were rendered quiescent (qPSC) by daily treatment with 1μM ATRA under subdued light conditions over seven days.11 PSCs treated with vehicle (ethanol) were used as activated PSC (aPSC) phenotype. Conditioned media from cancer cells lines (AsPc1, Capan1) or PSC was collected.
Migration assay
Healthy donor (National Blood Service (Brentwood, UK): North London REC) or PDAC patient (Brent REC 05/Q0408/65) lymphocytes were obtained from buffy coats. CD3+, CD4+ CD19+, CD56+ and CD8+ T-cells were negatively selected using magnetic-activated cell sorting cell isolation kits (Miltenyi Biotec, Surrey, UK).
1 × 10⁵ CD3+, CD4+ CD8+, CD19+ or CD56+ cells in 200 μl of FBS-replete RPMI-1640 were incubated for four-eight hours in sterile, 5.0μm pore Transwells™ (Corning) to assess the differential migration of T-cells to the conditioned media (500 μl). The migrated cells were then harvested after eight hours of incubation and cells counted with the Casy counter (Roche, UK). Background migration (unsupplemented media) was subtracted. All migration was relative to media with fetal bovine serum (FBS) to enable comparison across biological repeats.
Adhesion assays
Activated or quiescent PSC were incubated with 5×10⁴ CD3+ at 37°C for one hour, washed repeatedly, fixed with Cellstor (4% PFA, 20 minutes; Cellpath, Newton, UK) and the number of adherent T-cells relative to PSC were counted based on cell morphologies and staining patterns. A median of counts from six fields gave a data point for one patient. Each experiment was repeated in triplicate.
Gene-expression
Re-analysis of gene expression microarrays of qPSC compared to aPSC11 for significantly differentially expressed genes performed using DAVID.19
Enzyme linked immunosorbent assay (ELISA) and qPCR
Quantikine® ELISA kits (R & D Systems, Abingdon, UK) were used to measure the concentrations of candidate chemokines (manufacturer’s instructions). qPCR were carried out as described.20
RNAi
5nm CXCL12 GeneSolution siRNA (Qiagen, West Sussex, UK) was used alongside All-stars Negative Control siRNA (Qiagen, West Sussex, UK) with INTERFERin™ (Polyplus-transfection SA, France) in Opti-MEM® reduced serum media (Life Technologies Ltd. Paisley, UK) as per manufacturer’s instructions to perform RNAi experiments. Recombinant human CXCL12 (R&D Systems, Abingdon, UK) was used as a positive control.
RESULTS
Immune cell infiltration in pancreatico-biliary diseases (PBD)
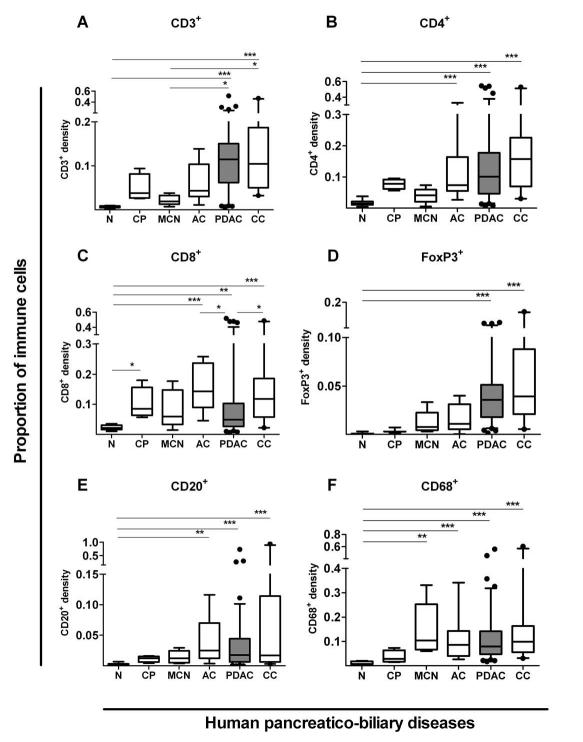
We performed an unbiased, automated evaluation of immune cell infiltrate for pancreatico-biliary cancers such as PDAC, ampullary carcinoma (AC) and cholangiocarcinoma (CC) using dedicated tissue micro-arrays (TMA). These tumors were compared alongside other PBD including borderline malignant condition: mucinous cystic neoplasm (MCN); chronic inflammation: chronic pancreatitis (CP); and normal donor control TMAs (Supplementary Tables 1-2). Our immune cell density measurements were validated in whole tissue sections and by two distinct methods: as a percentage of all cells and by cell numbers per unit area (Supplementary Figures 1-4). Our results showed that immune cell densities were significantly increased in malignant (PDAC, CC, AC) tumors that are associated with an adverse prognosis,21 compared to other PBD and healthy controls (Figure 1). Increased Treg (FoxP3+) infiltrate in human PDAC was confirmed as reported before.9 In contrast, the density of CD8+ T-cell infiltrate in PDAC was comparable to chronic pancreatitis but significantly reduced compared to AC and CC (P<0.01). These findings in human PDAC when compared with other PBD, reported for the first time, are consistent with reduced infiltration of CD8+ cytotoxic T-cells recently reported in the KPC mouse model of PDAC.8, 22, 23
Figure 1. Immune cell infiltrate in human pancreatico-biliary diseases.
Immune cells infiltrates were measured in pancreatico-biliary diseases such as chronic pancreatitis (CP, n=4), mucinous cystic neoplasms (MCN, n=6), ampullary carcinoma (AC, n=9), pancreatic ductal adenocarcinoma (PDAC, n=93-98, shaded box), cholangiocarcinoma (CC, n=21) and normal tissues (N, n=11-14) using Ariol (Genetix) software as described in Supplementary Figures 1-4. Box (median with interquartile ranges (25th and 75th)) and whisker (5th and 95th centiles) plots (outliers are represented by individual dots) demonstrate that all diseases demonstrate significant, yet varied, density and profile for CD3+(A), CD4+(B), CD8+(C), CD20+(D), FoxP3+(E), and CD68+(F) immune cells infiltrate as compared by Kruskal-Wallis test (p-value < 0.0001 for all immune cells). Further statistical comparisons between columns were done by Dunn’s post test and indicated by *** p< 0.001; ** p= 0.001 to 0.01; * p= 0.01 to 0.05.
Differential immune cell infiltrate in stromal sub-compartments
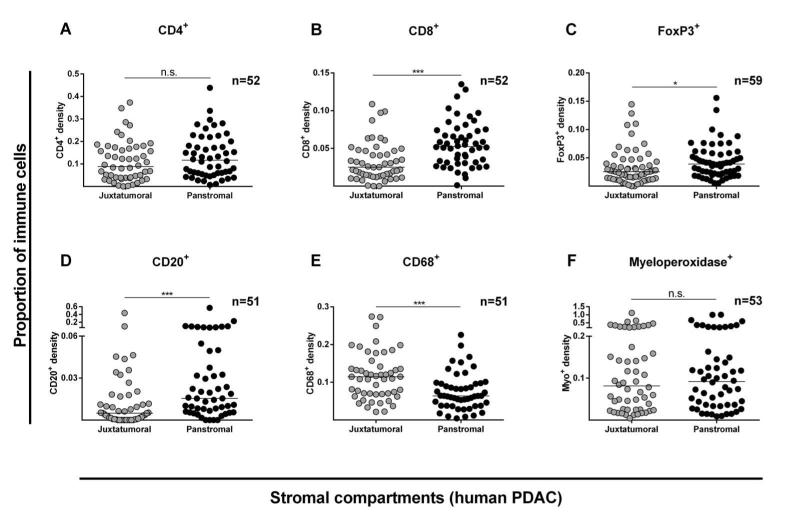
We next characterized the immune infiltrate within stromal sub-compartments of PDAC and identified that cytotoxic effector T-cells (CD8+), Tregs (FoxP3+), B-cells (CD20+) and natural killer or NK-cells (CD56+) were significantly reduced in juxtatumoral compartments compared to the panstromal areas. This was in contrast to neutrophil (myeloperoxidase+) and macrophage (CD68+) stromal infiltration (Figure 2, Supplementary Figure 5).13 This differential immune cell infiltrate, particularly for CD8+ T-cells, was confirmed in an independent TMA cohort of PDAC patients composed mainly of advanced cancers (Supplementary Figure 6). Interestingly, this differential immune cell infiltrate was not observed in AC (Supplementary Figure 7) or CC (Supplementary Figure 8). Our analysis showed that tissue immune cell infiltrate had no correlation with circulating immune cell counts (Supplementary Figures 9-11). The paucity of functional vasculature close to the PDAC tumor cells (juxtatumoral) is well established.24 Taken together these observations strongly suggest a hitherto unreported PDAC-specific CD8+ T-cell trafficking defect within human PDAC tissues.
Figure 2. Stromal compartment specific immune cell infiltration in human PDAC.
Proportion of immune cell infiltrate was determined as shown in Supplementary Figure 1-4. Juxtatumoral stromal (within 100μm of tumor cells (single or islands /ducts)) and panstromal (the rest of the tumor stroma) were defined. Each data point represents a single patient (median scores of all TMA cores (n=6)) and lines represent median for the cohort of patients. Comparison of immune cell infiltration in these two PDAC stromal compartments was made for CD4+ (A), CD8+ (B), FoxP3+ (C), CD20+ (D), CD68+ (E) and Myeloperoxidase+ (F) cells, and also for CD3+ and CD56+ cells (Supplementary Figure 5). Whilst PDAC tissues demonstrate a significantly higher density in the juxtatumoral stroma relative to the panstromal compartment for CD68+ cells, the reverse was true for CD8+, FoxP3+ and CD20+ cells with an equal density for CD4+ and Myeloperoxidase+ cells implying a differential immune cell infiltration defect. Mann Whitney U test; p-values are two-tailed.
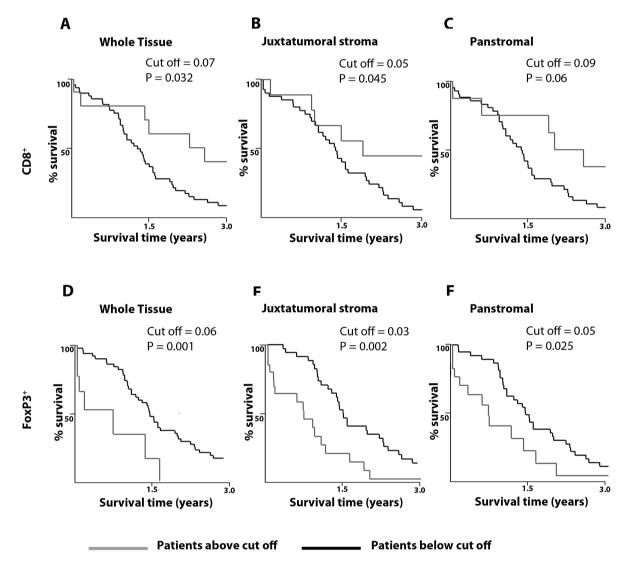
Our data further demonstrates for the first time that a higher CD8+ T-cell juxtatumoral infiltrate is associated with improved survival post-surgical resection as analyzed by X-Tile software (Figure 3, Supplementary Table 5).17, 25 Of interest, a lower juxtatumoral Treg (FoxP3+) infiltrate also demonstrated a pro-survival effect in PDAC patients. Taken together, this data suggests that reduced infiltration of anti-tumor CD8+ T-cells to target tumor epithelial cells in the PDAC microenvironment has important clinical impact.
Figure 3. Correlation of stromal compartment-specific immune cell infiltration with survival.
Prognostic implications upon differential immune cell infiltration for CD8+ (A-C) and FoxP3+ (D-F) cells in whole PDAC tissue (A, D), the juxtatumoral compartment (B, E) and the panstromal compartment (C, F) was determined using optimal cut-off for proportion of immune cells using X-tile software (Yale).15-17 Survival comparisons were made between patients with low (black) and high (grey) density of the immune cell infiltrate. Miller-Seigmund corrections of p-values were performed to account for multiple comparisons (Supplementary table 5). The various optimal cut-off for proportion of immune cells defining high versus low infiltrate are indicated. Patients with high densities of CD8+ in the whole PDAC tissue (A) or the juxtatumoral compartment (B) demonstrate a statistically significant survival benefit; however, this was not true for panstromal compartment (C). Lower FoxP3+ infiltration in all compartments resulted in better survival.
Reversal of the juxtatumoral exclusion of cytotoxic T-cells in murine PDAC
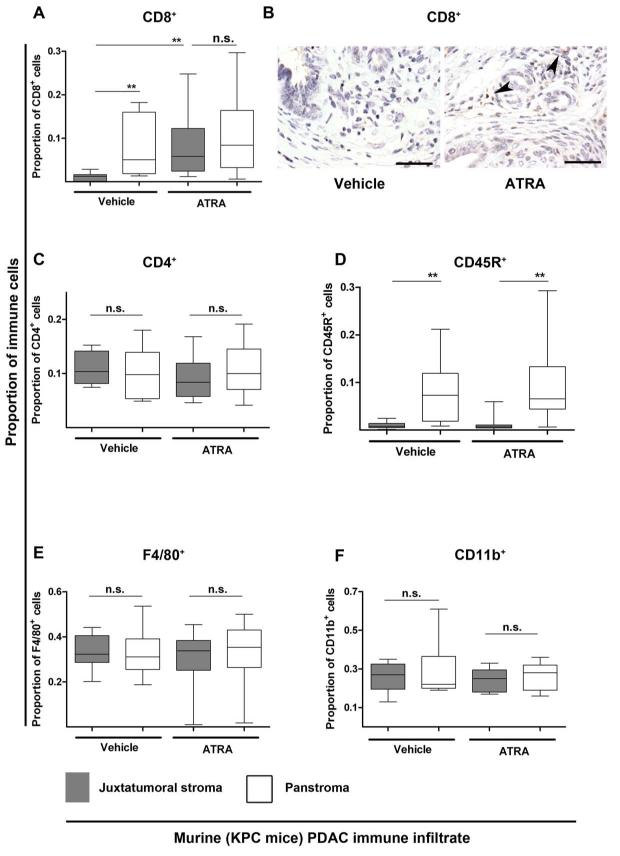
We next identified similar juxtatumoral exclusion of CD8+ T-cells and CD45R+ B-cells, but not F4/80+ macrophages in the PDAC microenvironment of KPC mice (Figure 4, Supplementary Figure 12). Previously we have demonstrated that treating these PDAC mice with ATRA renders activated pancreatic stellate cells (PSC) quiescent leading to stromal collapse and a detrimental effect on resident tumor cells through a multitude of signaling cascades.11 In the present study, we found that ATRA treatment enhanced juxtatumoral CD8+ T-cell infiltration but not CD45R+ B-cells or F4/80+ macrophages. Recent studies suggest that MDSCs have an important role in the PDAC-associated CD8+ T-cell infiltration defect.22, 23 Thus, we examined this population of immune cells in our ATRA-treated KPC mice experiments but did not observe any changes in MDSC (CD11b+) infiltrate. Thus, it is conceivable that activated PSC in PDAC sequester anti-tumor CD8+ T-cell migratory and adhesive function preventing access to the tumoral cells. Since it is not technically feasible to study the dynamic spatial interactions between PSC and immune cells by current in vivo models, we designed novel in vitro chemotaxis assays examining the possible immunomodulatory role of PSC.
Figure 4. Juxtatumoral exclusion of CD8+ T-cells in KPC mice is reversed upon stromal collapse engineered by targeting stellate cells with ATRA.
KPC mice with fully developed tumours (day 60-200) were enrolled into a pre-clinical trial where they were either given vehicle (n=4) or ATRA (n=6). ATRA, selectively targets and restores stellate cells quiescence.11 Proportion of CD8+ (A,B), CD4+ (C), CD45R+ (D), F4/80+ (E) and CD11b+ (F) cells in the panstromal and juxtatumoral compartments were measured as shown in Supplementary Figure 12. All data are presented as box (median with interquartile ranges (25th and 75th)) and whisker (5th and 95th centiles) plots. The juxtatumoral exclusion of CD8+ (cytotoxic T-cells) and CD45R+ (B-cells) cells was demonstrated in vehicle-treated mice. There was a significant increase in the CD8+ T-cell infiltrate (A,B) into the juxtatumoral compartment upon treatment of mice with ATRA which was not seen for CD4+ (helper T-cells), CD45R+ (B-cells), F4/80+ (macrophages) or CD11b+ (MDSC) cells.
Scale bar: 100μm
Mann-Whitney U-test, all p-values are two-tailed. ** p= 0.001 to 0.01; n.s.= not significant
CD8+ T-cells migrate preferentially towards activated PSC
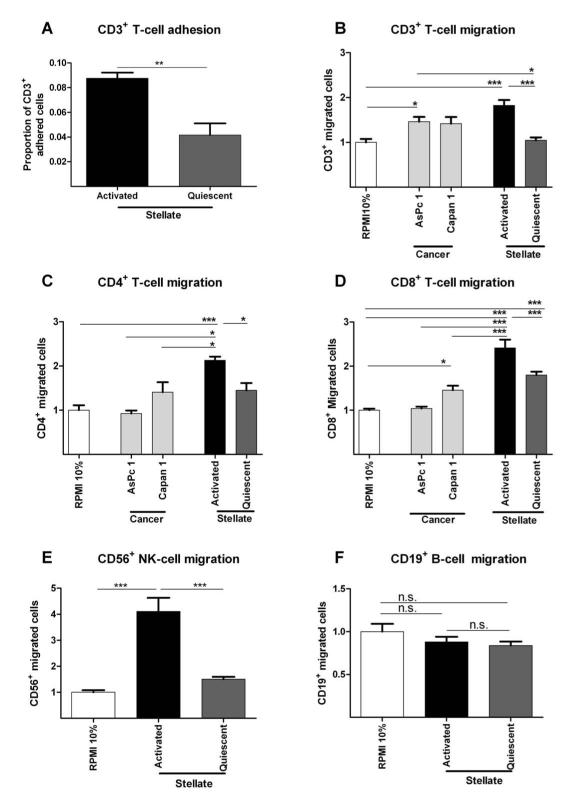
Quiescent (normal pancreas) and activated (PDAC) PSCs have distinct phenotypes.11 Our chemotaxis assays showed that healthy donor CD3+ T-cells adhered and migrated preferentially to activated PSC (aPSC) conditioned medium compared to quiescent PSC (qPSC) or cancer cell (Capan1 and AsPc1) conditioned medium that contained serum (Figure 5, Supplementary Figure 13). Notably, quiescent PSC induced chemotactic responses were remarkably similar to baseline levels.
Figure 5. In vitro immune-stellate cells interactions.
Immuno-magnetic bead separated immune cells from un-diseased human donors (n=4) were used. Pancreatic stellate cells (PSC) were rendered quiescent using ATRA.11 Proportion of adherent T-cells to aPSCs or qPSCs were quantified after incubation for one hour and fixation and staining. (A; paired t-test; p-value is two-tailed). Transwell (5 μm) migration assays of different immune cells towards conditioned media (CM) from activated (aPSC), quiescent (qPSC) PSC and cancer cells (Capan1 and AsPc1) were carried out over 4-8 hours. Background migration of T-cells towards serum-free RPMI was subtracted to give ‘specific’ migration and normalized to migration towards RPMI supplemented with 10% FBS (‘basal’ serum directed migration) as shown in Supplementary Figure 13. These conditions served as internal controls for comparison across biological replicates.
We demonstrated reduced migration of CD3+ (B), CD4+ (C) and CD8+ (D), CD56+ (E) but not CD19+ qPSC CM compared with aPSC CM. The absolute CD4+ (B) cell number migration was minimal with little difference over the basal migration. Migration of all subsets of T-cells towards aPSC CM was higher than migration towards cancer cell CM. The most dramatic, and perhaps clinically relevant, fold change in migration of T-cells was seen with CD8+ T-cells (D) and NK cells (E).
Bar chart represents mean ± SEM. *** p< 0.001; ** p= 0.001 to 0.01; * p= 0.01 to 0.05, Comparisons were conducted with ANOVA with comparisons between columns using Bonferroni’s Multiple Comparison Test.
In line with our in vivo histological observations, the differential migration of CD4+ helper T-cells towards cancer cells or PSC was not as significant when compared to CD8+ T-cell experiments (Figure 5C,D). CD56+ NK-cells showed preferential migration to aPSC compared to qPSC, while CD19+ B-cells did not (Figure 5E,F). Together with our earlier KPC mouse study findings, we believe that these results suggest that panstromal-associated aPSC attract and adhere to CD8+ T-cells preventing their effective juxtatumoral infiltration.
CXCL12 mediates the increased T-cell migration towards aPSC
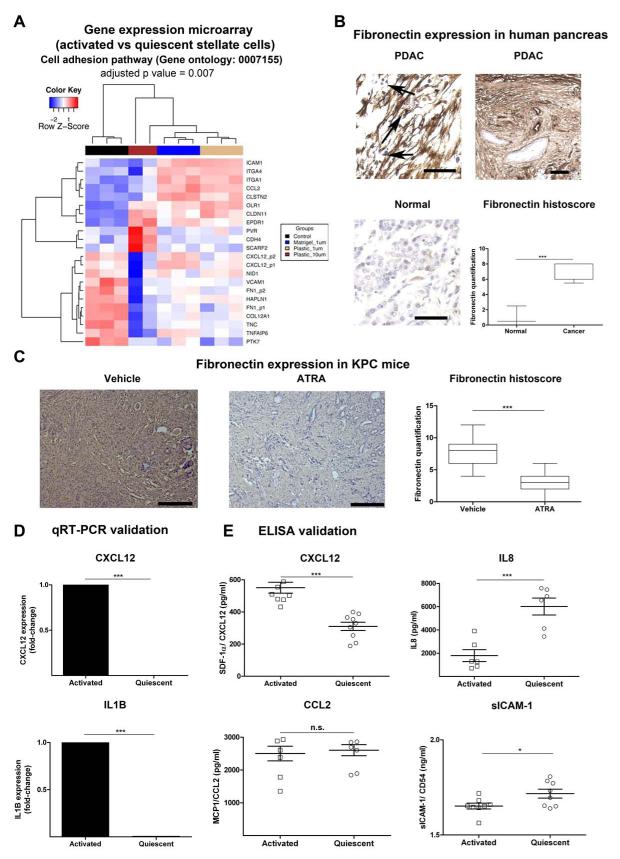
Re-analysis of our previous Affymetrix gene expression data of PSC in PDAC revealed that aPSC alter the expression of a number of cytokines/chemokines and adhesion-mediating molecules compared to qPSC (Figure 6A, Supplementary Figure 14).11 The transcriptomic changes for a number of these molecules was validated at the protein level both in vitro and in vivo in human PDAC by others26 and us (Figure 6B-E).11, 20 Notably, fibronectin expression was markedly increased in human PDAC (especially in the panstromal compartment compared to normal pancreas, Figure 6B). Fibronectin expression in murine PDAC was markedly reduced following ATRA treatment (Figure 6C).
Figure 6. Adhesion molecule and cytokine changes upon activation of PSC.
(A) Re-analysis of gene expression microarrays of qPSC compared to aPSC11 for significantly differentially expressed genes involved in cell adhesion (Gene Ontology GO:0007155) gene set enrichment test = 0.007, performed using DAVID (Benjamini-Hochberg test).19 Hierarchy clustering of all samples (replicates) from four groups, aPSC or control (black) and qPSC under different treatment conditions such as when plated on Matrigel and treated with 1 μM ATRA (blue), when plated on Plastic and treated with 1 μM ATRA (burlywood) and plastic with 10 μM ATRA (dark brown), was performed based on the expression profiles of these differentially expressed probes using the Euclidean metric. Also see Supplementary Figure 14 for the significant changes in gene expression derived from the time-course experiment as well as changes in cytokine-cytokine receptor interaction pathway.
(B) Fibronectin was further assessed in normal human pancreas and human PDAC demonstrating upregulation of fibronectin expression in cancer, particularly in the panstromal compartment where they sequester immune cells (black arrow). Scale bar, 100 μm. Box (median with interquartile ranges (25th and 75th)) and whisker (5th and 95th centiles) plots of fibronectin immunostain is demonstrated. Mann-Whitney U-test.
(C) Upon treatment with ATRA, KPC mice demonstrated a significant reduction of fibronectin deposition. Scale bar, 100 μm. Box (median with interquartile ranges (25th and 75th)) and whisker (5th and 95th centiles) plots of fibronectin immunostain is demonstrated. Mann-Whitney U-test.
(D) qRT-PCR demonstrated significant alteration of some of the transcripts identified by gene-expression microarray analysis. Other transcripts have been studied before.11 Bar chart represents mean ± SEM. Paired t-test; p values are two-tailed.
(E) Concentrations of the proteins in conditioned media collected from qPSC and aPSC using ELISA. Surprisingly at protein level, there was no/little difference in secretion between qPSC and aPSC for sICAM1/ CD54 and MCP1/ CCL2. However, confirming the gene expression data, aPSC secreted less IL8 than qPSC and the reverse was true for SDF-1α/ CXCL12. Summary data represents mean ± SEM. Paired t-test; p values are two-tailed.
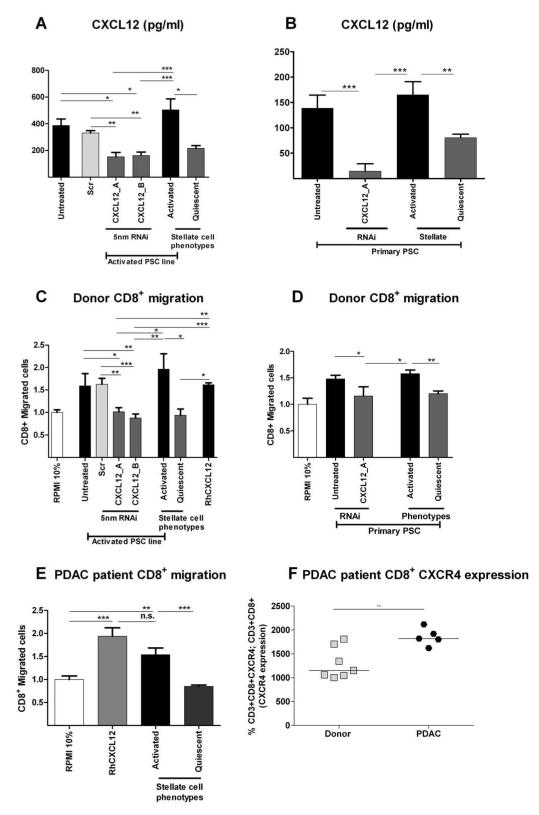
Of the multitude of signaling cascades/adhesion molecules deregulated with an activated PSC phenotype, we chose to study upregulated CXCL12 in aPSC because of its well-established chemotactic properties for T-cells.27 CXCL12 knock-down in both in vitro aPSC and primary PDAC patient PSC resulted in a reduction of healthy donor and PDAC patient CD8+ and CD4+ T-cells T-cell migration to levels comparable to qPSC (Figure 7, Supplementary Figure 17). Our flow cytometric analysis showed that whilst the circulating effector/memory T-cell ratio28, 29 was similar in PDAC patients compared to age-matched healthy donors (Supplementary Figures 15-16), the CXCR4 expression was markedly upregulated in PDAC patient T-cells (Figure 7F, Supplementary Figure 17A). Taken together, this data suggests an important role for the CXCL12/CXCR4 axis in regulating T-cell trafficking.
Figure 7. T-cell migration is mediated by CXCL12.
CXCL12 was knocked down in PSC cell line (PS1: A) and primary PSCs (B) with two distinct targeting siRNAs and appropriate controls. CXCL12 secretion was measured in conditioned media. PSC treated with siRNA for CXCL12 demonstrated significant reduction of CXCL12 secretion (A,B) which was equivalent to quiescent PSC levels. Migration of normal human donor CD8+ T-cells to conditioned media of CXCL12 knockdown PSC (C: PS1 cell line and D: primary PSC) demonstrated significant reduction, which was equivalent to qPSC levels. Similar results were found with PDAC patient CD8+ T-cells (E). PDAC patient CD8+ T-cells demonstrated significant upregulation of CXCR4 as measured by Flow-cytometry (F).
*** p< 0.001; ** p= 0.001 to 0.01; * p= 0.01 to 0.05. Comparisons were conducted with ANOVA with comparisons between columns using Bonferroni’s Multiple Comparison Test.
DISCUSSION
PDAC has a 5-year overall patient survival of 3-5% making it the PBD with the worst prognosis.21 In this report, we performed a comprehensive global as well as stromal compartment-specific comparison of immune infiltrate in a variety of PBD. We show an increasing immune cell infiltrate from normal (healthy pancreas tissue) to inflammatory (CP), borderline (MCN) and to malignant (AC, PDAC and CC) diseases. To our knowledge, we identify for the first time that higher CD8+ T-cell infiltration in PDAC tumors correlates with better patient survival, a finding that that provides evidence for anti-tumor CD8+ T-cell cancer immunoediting in human PDAC.2
The PDAC stromal microenvironment is composed of activated myo-fibroblasts including aPSC, extracellular matrix, blood vessels and various immune cells, whose individual contribution to tumor progression remains elusive.26 The PDAC stroma has been classified into two compartments based on differential gene expression:13, 30 the juxtatumoral and panstromal compartments. Our immunohistochemistry analysis revealed that whilst some immune cells (CD68+ macrophages, myeloperoxidase+ neutrophils) infiltrate the juxtatumoral compartment, others (CD8+ T-cells, FoxP3+ Tregs CD56+ NK-cells, CD20+ B-cells) are sequestrated in the panstromal compartment. The use of the KPC mouse model of PDAC that exhibits an intact in situ cellular desmoplastic component allowed us to confirm panstromal sequestration of CD8+ T-cells and CD45R+ B-cells, but not CD4+ T-cells or F4/80+ macrophages, in agreement with the human data.
More importantly, we could demonstrate that in vivo ATRA treatment, that converts aPSC to a qPSC phenotype11, specifically enhanced CD8+ T-cell infiltration towards tumor cells but no change was demonstrable for the CD4+ T-cells, CD45R+ B-cells, F4/80+ macrophages and MDSC (CD11b+) infiltrate. In the absence of appropriate tools we were unable to define MDSC infiltrate in stromal tissue compartments in human PDAC.31 MDSCs have been postulated to drive CD8+ T-cells exclusion recently in murine KPC-derived subcutaneous PDAC models devoid of in situ cellular desmoplastic component, particularly stellate cells.22, 23 Of interest, in vitro but not in vivo studies demonstrate the PSC may modulate differentiation of MDSC in an IL6-STAT3 dependent manner.32 Depletion of FAPα+ stromal cells in a subcutaneous mouse model of PDAC resulted in immunological control (CD8+ T-cell-mediated) of tumor growth, a phenomenon not seen in Rag-2 deficient mice.33 The relationship between FAPα cells and PSC remains to be established. Furthermore, in a cohort of surgically incurable PDAC patients and in KPC mice, combining gemcitabine therapy with an agonist CD40 antibody led to significant tumor regression. CD40-activated macrophages were found to infiltrate the tumors to facilitate the depletion of the stroma. This depletion of tumor stroma was associated with tumor immunoclearance.34 Our data suggest CD8+ T-cells may be involved in tumor immunoclearance if their trafficking is unimpeded by the ‘PDAC stromal barrier’, a finding substantiated by murine PDAC investigations.8, 34
Our ex vivo migratory bioassays using both healthy donor and PDAC patient cytotoxic CD8+, CD4+ helper T-cells and NK-cells showed that aPSC conditioned media attracted increased numbers of these lymphocytes compared to tumor cells or qPSC. Taken together, these data provide evidence that aPSC are key regulators of the immune cell infiltrate in the PDAC stromal microenvironment. Understanding the complex temporal (disease progression) and spatial (stromal compartment) relationship between aPSC, FAPα+ stromal cells, CD8+ T-cells, MDSC, Tregs and NK-cells in the PDAC disease process will be important for identifying novel cellular and molecular targets for therapy.35
Recently, we demonstrated that aPSC modulate a range of cellular process in tumor cells in a dose-dependent manner. These findings suggest a vital role for aPSC in PDAC disease progression mediated through perturbation of multitude of signaling cascades.20 Our analysis of the transcriptome of PDAC-associated aPSC revealed deregulated adhesion and chemokine/cytokine genes.11 We hypothesized that these molecules likely contribute to stromal microenvironment-specific regulation of immune cell trafficking and infiltration into the tumor.35,36 In this present study, we focused on CXCL12 that was upregulated in aPSC and is known to be an important chemoattractant for T-cells.27 Our chemotaxis assays showed that both donor and PDAC patient CD8+ and CD4+ T-cells showed elevated migration towards aPSC compared to qPSC that was CXCL12-dependent in CD8+ T-cells. CXCL12-siRNA treated aPSC cells or conversion of aPSC to qPSC reduced CXCL12 expression and T-cell chemotaxis. Notably, we show that PDAC patient T-cells express higher levels of the CXCL12 receptor (CXCR4) compared to healthy donor T-cells, but with no change in the proportion of effector or memory T-cells. Taken together, this data suggests an important role for stromal PSC:T-cell interaction and the CXCL12/CXCR4 axis in PDAC. Moreover, CXCL12 has been implicated in the maintenance of PDAC cancer stem cells in a PSC niche by regulating the expression of sonic hedgehog.37, 38
Further work remains to be done to delineate the relative contribution of NK-cells and Treg cells, both of which are also be sequestered in the panstromal compartment in human PDAC. Of note, it has been suggested that this intra-stromal cross-talk (tumor immuno-suppressive network) can further impede CD8+ T-cell trafficking and immuno-editing.35 The relative contribution of CXCR4/CXCL12 and other cytokines/chemokines/adhesion molecules such as IL-8, fibronectin amongst others will need to be precisely defined to refine therapeutic strategies.
Taken together, these data suggest that the complex tumor microenvironment, in particular, the increasingly recognized PSCs11, 20, 26 regulate the tumor immune response. We demonstrate that PDAC-associated aPSC orchestrate many such interactions by sequestration of CD8+, CD4+ T-cells, NK-cells and Tregs in the panstromal compartment. Our data provides the basis for further studies to explore this clinically significant, yet unrecognized, stromal-immune cell cross-talk in PDAC. Successful targeting of desmoplastic and immune stroma cells may provide an interesting approach in tackling human PDAC in an attempt to improve survival in this incurable disease.
Supplementary Material
Acknowledgements
We thank Dr Christine Feig (Cambridge Research Institute, UK) and Prof David A Tuveson (Cold Spring Harbor Laboratory, NY, USA) for helpful comments regarding murine experiments. We are very grateful to members of our laboratories for helpful discussions and suggestions. We also thank Dr Lisa Mears (Department of Pathology, Barts and the London) and Dr Moffadal Moonim (Department of Pathology, St Thomas’ Hospital) with human PDAC samples. We thank Prof Federica Marelli-Berg for her critical insight.
Grant Support: AEO is supported by a PhD studentship from Cross-River University of Technology, Nigeria. JGG acknowledges funding from National Institutes of Health, USA and Cancer Research UK. AJC, JW and AGR acknowledge support of Barts and the London Charity. AGR acknowledges funding from the European Hematology Association. HMK acknowledges support from National Institute of Health Research, UK.
Abbreviations
- AC
Ampullary carcinoma
- aPSC
Activated Pancreatic Stellate Cells
- ATRA
All-Trans Retinoic Acid
- CC
Cholangiocarcinoma
- CCL2
Chemokine (C-C motif) Ligand 2
- CM
Conditioned Media
- CP
Chronic Pancreatitis
- CXCL12
Chemokine (C-X-C Motif) Ligand 12
- CXCR4
Chemokine (C-X-C Motif) Receptor 4
- FBS
Fetal Bovine Serum
- IL8
Interleukin 8
- KPC
LSL-KrasG12D/+; LSL-Trp53R172H/+; Pdx-1-Cre;
- MCN
Mucinous cystic neoplasm
- MCP1
Monocyte Chemo-attractant Protein 1
- MDSC
Myeloid Derived Suppressor Cells
- PDAC
Pancreatic Ductal Adenocarcinoma
- PSC
Pancreatic Stellate Cells
- qPSC
Quiescent Pancreatic Stellate Cells
- pPSC
Primary Pancreatic Stellate Cells
- SDF1α
Stromal cell Derived Factor 1 alpha
- TAMs
Tumor Associated Macrophages
- TMA
Tissue Micro-Array
Footnotes
Publisher's Disclaimer: This is a PDF file of an unedited manuscript that has been accepted for publication. As a service to our customers we are providing this early version of the manuscript. The manuscript will undergo copyediting, typesetting, and review of the resulting proof before it is published in its final citable form. Please note that during the production process errors may be discovered which could affect the content, and all legal disclaimers that apply to the journal pertain.
Disclosures: All authors have nothing to disclose.
Author contributions: Study concept and design: HMK, JFM, CC, JGG, AGR, AEO; acquisition of data: AEO, AJC, JeW, JuW, RF, JCR, JAC, HMK; analysis and interpretation of data: all authors; drafting of the manuscript: HMK, AGR, AEO; critical revision of the manuscript for important intellectual content: all authors; statistical analysis: AEO, JuW, CC, HMK; obtained funding: AEO, HMK, JGG, AGR; technical, or material support: HMK, AJC, AGR, JGG; study supervision: HMK.
*Author names in bold designate shared co-first authorship.
REFERENCES
- 1.Perez-Mancera PA, Guerra C, Barbacid M, et al. What We Have Learned About Pancreatic Cancer from Mouse Models. Gastroenterology. 2012 doi: 10.1053/j.gastro.2012.03.002. [DOI] [PubMed] [Google Scholar]
- 2.Schreiber RD, Old LJ, Smyth MJ. Cancer immunoediting: integrating immunity’s roles in cancer suppression and promotion. Science. 2011;331:1565–70. doi: 10.1126/science.1203486. [DOI] [PubMed] [Google Scholar]
- 3.Vesely MD, Kershaw MH, Schreiber RD, et al. Natural innate and adaptive immunity to cancer. Annu Rev Immunol. 2011;29:235–71. doi: 10.1146/annurev-immunol-031210-101324. [DOI] [PubMed] [Google Scholar]
- 4.Restifo NP, Dudley ME, Rosenberg SA. Adoptive immunotherapy for cancer: harnessing the T cell response. Nat Rev Immunol. 2012;12:269–81. doi: 10.1038/nri3191. [DOI] [PMC free article] [PubMed] [Google Scholar]
- 5.Matsushita H, Vesely MD, Koboldt DC, et al. Cancer exome analysis reveals a T-cell-dependent mechanism of cancer immunoediting. Nature. 2011;482:400–4. doi: 10.1038/nature10755. [DOI] [PMC free article] [PubMed] [Google Scholar]
- 6.Zhang L, Conejo-Garcia JR, Katsaros D, et al. Intratumoral T Cells, Recurrence, and Survival in Epithelial Ovarian Cancer. New England Journal of Medicine. 2003;348:203–213. doi: 10.1056/NEJMoa020177. [DOI] [PubMed] [Google Scholar]
- 7.Galon J, Costes A, Sanchez-Cabo F, et al. Type, density, and location of immune cells within human colorectal tumors predict clinical outcome. Science. 2006;313:1960–4. doi: 10.1126/science.1129139. [DOI] [PubMed] [Google Scholar]
- 8.Clark CE, Hingorani SR, Mick R, et al. Dynamics of the immune reaction to pancreatic cancer from inception to invasion. Cancer Res. 2007;67:9518–27. doi: 10.1158/0008-5472.CAN-07-0175. [DOI] [PubMed] [Google Scholar]
- 9.Nummer D, Suri-Payer E, Schmitz-Winnenthal H, et al. Role of tumor endothelium in CD4+ CD25+ regulatory T cell infiltration of human pancreatic carcinoma. J Natl Cancer Inst. 2007;99:1188–99. doi: 10.1093/jnci/djm064. [DOI] [PubMed] [Google Scholar]
- 10.Neesse A, Michl P, Frese KK, et al. Stromal biology and therapy in pancreatic cancer. Gut. 2011;60:861–8. doi: 10.1136/gut.2010.226092. [DOI] [PubMed] [Google Scholar]
- 11.Froeling FE, Feig C, Chelala C, et al. Retinoic Acid-Induced Pancreatic Stellate Cell Quiescence Reduces Paracrine Wnt-beta-Catenin Signaling to Slow Tumor Progression. Gastroenterology. 2011;141:1486–97. doi: 10.1053/j.gastro.2011.06.047. [DOI] [PubMed] [Google Scholar]
- 12.Iacobuzio-Donahue CA, Ryu B, Hruban RH, et al. Exploring the host desmoplastic response to pancreatic carcinoma: gene expression of stromal and neoplastic cells at the site of primary invasion. Am J Pathol. 2002;160:91–9. doi: 10.1016/S0002-9440(10)64353-2. [DOI] [PMC free article] [PubMed] [Google Scholar]
- 13.Ricci F, Kern SE, Hruban RH, et al. Stromal responses to carcinomas of the pancreas: juxtatumoral gene expression conforms to the infiltrating pattern and not the biologic subtype. Cancer Biol Ther. 2005;4:302–7. doi: 10.4161/cbt.4.3.1501. [DOI] [PubMed] [Google Scholar]
- 14.Froeling FE, Mirza TA, Feakins RM, et al. Organotypic culture model of pancreatic cancer demonstrates that stromal cells modulate E-cadherin, beta-catenin, and Ezrin expression in tumor cells. Am J Pathol. 2009;175:636–48. doi: 10.2353/ajpath.2009.090131. [DOI] [PMC free article] [PubMed] [Google Scholar]
- 15.Lee AM, Clear AJ, Calaminici M, et al. Number of CD4+ cells and location of forkhead box protein P3-positive cells in diagnostic follicular lymphoma tissue microarrays correlates with outcome. J Clin Oncol. 2006;24:5052–9. doi: 10.1200/JCO.2006.06.4642. [DOI] [PubMed] [Google Scholar]
- 16.Yale_University; 2004. X-tile. [Google Scholar]
- 17.Camp RL, Dolled-Filhart M, Rimm DL. X-Tile. Clinical Cancer Research. 2004;10:7252–7259. doi: 10.1158/1078-0432.CCR-04-0713. [DOI] [PubMed] [Google Scholar]
- 18.Altman DG, Lausen B, Sauerbrei W, et al. Dangers of Using “Optimal” Cutpoints in the Evaluation of Prognostic Factors. Journal of the National Cancer Institute. 1994;86:829–835. doi: 10.1093/jnci/86.11.829. [DOI] [PubMed] [Google Scholar]
- 19.Huang da W, Sherman BT, Lempicki RA. Systematic and integrative analysis of large gene lists using DAVID bioinformatics resources. Nat Protoc. 2009;4:44–57. doi: 10.1038/nprot.2008.211. [DOI] [PubMed] [Google Scholar]
- 20.Kadaba R, Birke H, Wang J, et al. Imbalance of desmoplastic stromal cell numbers drives aggressive cancer processes. J Pathol. 2013;230:107–17. doi: 10.1002/path.4172. [DOI] [PMC free article] [PubMed] [Google Scholar]
- 21.Coupland VH, Kocher HM, Berry DP, et al. Incidence and survival for hepatic, pancreatic and biliary cancers in England between 1998 and 2007. Cancer Epidemiol. 2012 doi: 10.1016/j.canep.2012.03.010. [DOI] [PubMed] [Google Scholar]
- 22.Pylayeva-Gupta Y, Lee Kyoung E, Hajdu Cristina H, et al. Oncogenic Kras-Induced GM-CSF Production Promotes the Development of Pancreatic Neoplasia. Cancer Cell. 2012;21:836–847. doi: 10.1016/j.ccr.2012.04.024. [DOI] [PMC free article] [PubMed] [Google Scholar]
- 23.Bayne Lauren J, Beatty Gregory L, Jhala N, et al. Tumor-Derived Granulocyte-Macrophage Colony-Stimulating Factor Regulates Myeloid Inflammation and T Cell Immunity in Pancreatic Cancer. Cancer Cell. 2012;21:822–835. doi: 10.1016/j.ccr.2012.04.025. [DOI] [PMC free article] [PubMed] [Google Scholar]
- 24.Olive KP, Jacobetz MA, Davidson CJ, et al. Inhibition of Hedgehog Signaling Enhances Delivery of Chemotherapy in a Mouse Model of Pancreatic Cancer. Science. 2009;324:1457–61. doi: 10.1126/science.1171362. [DOI] [PMC free article] [PubMed] [Google Scholar]
- 25.Wu X, Zou Y, He X, et al. Tumor-Infiltrating Mast Cells in Colorectal Cancer as a Poor Prognostic Factor. International Journal of Surgical Pathology. 2012 doi: 10.1177/1066896912448836. [DOI] [PubMed] [Google Scholar]
- 26.Apte MV, Wilson JS, Lugea A, et al. A starring role for stellate cells in the pancreatic cancer microenvironment. Gastroenterology. 2013;144:1210–9. doi: 10.1053/j.gastro.2012.11.037. [DOI] [PMC free article] [PubMed] [Google Scholar]
- 27.Bleul CC, Fuhlbrigge RC, Casasnovas JM, et al. A highly efficacious lymphocyte chemoattractant, stromal cell-derived factor 1 (SDF-1) The Journal of Experimental Medicine. 1996;184:1101–1109. doi: 10.1084/jem.184.3.1101. [DOI] [PMC free article] [PubMed] [Google Scholar]
- 28.Lee B, Sharron M, Montaner LJ, et al. Quantification of CD4, CCR5, and CXCR4 levels on lymphocyte subsets, dendritic cells, and differentially conditioned monocyte-derived macrophages. Proc Natl Acad Sci U S A. 1999;96:5215–20. doi: 10.1073/pnas.96.9.5215. [DOI] [PMC free article] [PubMed] [Google Scholar]
- 29.Riches JC, Davies JK, McClanahan F, et al. T cells from CLL patients exhibit features of T-cell exhaustion but retain capacity for cytokine production. Blood. 2013;121:1612–21. doi: 10.1182/blood-2012-09-457531. [DOI] [PMC free article] [PubMed] [Google Scholar]
- 30.Iacobuzio-Donahue CA, Maitra A, Shen-Ong GL, et al. Discovery of novel tumor markers of pancreatic cancer using global gene expression technology. Am J Pathol. 2002;160:1239–49. doi: 10.1016/S0002-9440(10)62551-5. [DOI] [PMC free article] [PubMed] [Google Scholar]
- 31.Poschke I, Kiessling R. On the armament and appearances of human myeloid-derived suppressor cells. Clin Immunol. 2012;144:250–68. doi: 10.1016/j.clim.2012.06.003. [DOI] [PubMed] [Google Scholar]
- 32.Mace TA, Ameen Z, Collins A, et al. Pancreatic Cancer-Associated Stellate Cells Promote Differentiation of Myeloid-Derived Suppressor Cells in a STAT3-Dependent Manner. Cancer Res. 2013;73:3007–18. doi: 10.1158/0008-5472.CAN-12-4601. [DOI] [PMC free article] [PubMed] [Google Scholar]
- 33.Kraman M, Bambrough PJ, Arnold JN, et al. Suppression of antitumor immunity by stromal cells expressing fibroblast activation protein-alpha. Science. 2010;330:827–30. doi: 10.1126/science.1195300. [DOI] [PubMed] [Google Scholar]
- 34.Beatty GL, Chiorean EG, Fishman MP, et al. CD40 agonists alter tumor stroma and show efficacy against pancreatic carcinoma in mice and humans. Science. 2011;331:1612–6. doi: 10.1126/science.1198443. [DOI] [PMC free article] [PubMed] [Google Scholar]
- 35.Lindau D, Gielen P, Kroesen M, et al. The immunosuppressive tumour network: myeloid-derived suppressor cells, regulatory T cells and natural killer T cells. Immunology. 2013;138:105–15. doi: 10.1111/imm.12036. [DOI] [PMC free article] [PubMed] [Google Scholar]
- 36.Campbell DJ, Koch MA. Phenotypical and functional specialization of FOXP3+ regulatory T cells. Nature Reviews Immunology. 2011;11:119–130. doi: 10.1038/nri2916. [DOI] [PMC free article] [PubMed] [Google Scholar]
- 37.Singh AP, Arora S, Bhardwaj A, et al. CXCL12/CXCR4 signaling axis induces SHH expression in pancreatic cancer cells via ERK- and Akt-mediated activation of NF-kappaB: implications for bidirectional tumor-stromal interactions. J Biol Chem. 2012 doi: 10.1074/jbc.M112.409581. [DOI] [PMC free article] [PubMed] [Google Scholar]
- 38.Lonardo E, Frias-Aldeguer J, Hermann PC, et al. Pancreatic stellate cells form a niche for cancer stem cells and promote their self-renewal and invasiveness. Cell Cycle. 2012;11:1282–90. doi: 10.4161/cc.19679. [DOI] [PubMed] [Google Scholar]
Associated Data
This section collects any data citations, data availability statements, or supplementary materials included in this article.


