

Abstract
Ongoing/spontaneous pain behavior is associated with ongoing/spontaneous firing (SF) in adult DRG C-fiber nociceptors (Djouhri et al., 2006). Causes of this SF are not understood. We show here that conducting (sometimes called uninjured) C-nociceptors in neuropathic pain models with more hyperpolarized resting membrane potentials (Ems) have lower SF rates. Understanding the control of their Ems may therefore be important for limiting pathological pain. We report that TREK2, a leak K+ channel, is selectively expressed in IB4 binding rat C-nociceptors. These IB4+ C-neurons are ∼10 mV more hyperpolarized than IB4− C-neurons in vivo (Fang et al., 2006). TREK2 knockdown by siRNA in these neurons in culture depolarized them by ∼10 mV, suggesting that TREK2 is responsible for this ∼10 mV difference. In vivo, more hyperpolarized C-nociceptor Ems were associated with higher cytoplasmic edge-TREK2 expression (edge-TREK2). Edge-TREK2 decreased in C-neurons 7 d after axotomy, and their Ems depolarized by ∼10 mV. This again supports a contribution of TREK2 to their Ems. These relationships between (1) Em and TREK2, (2) SF rate and Em, and (3) spontaneous pain behavior and C-nociceptor SF rate suggested that TREK2 knockdown might increase spontaneous pain. After CFA-induced inflammation, spontaneous foot lifting (a measure of spontaneous pain) was (1) greater in rats with naturally lower TREK2 in ipsilateral small DRG neurons and (2) increased by siRNA-induced TREK2 knockdown in vivo. We conclude that TREK2 hyperpolarizes IB4 binding C-nociceptors and limits pathological spontaneous pain. Similar TREK2 distributions in small DRG neurons of several species suggest that these role(s) of TREK2 may be widespread.
Keywords: nociceptors, DRG, spontaneous firing, K2P, spontaneous pain, TREK2
Introduction
Spontaneous pain (ongoing pain without obvious cause or trigger) is rated as the worst aspect of many chronic pathological pain types (Backonja, 2003). Firing in C-fiber nociceptors causes unpleasant burning-type pain (Baron, 2009). There is growing evidence that spontaneous/ongoing firing in C-nociceptors is responsible for spontaneous pathological pain (Djouhri et al., 2006, 2012; Kleggetveit et al., 2012). The amount of spontaneous foot lifting (SFL), a behavioral measure of spontaneous pain, was strongly correlated with the rate of spontaneous firing (SFrate) in those C-nociceptors with conducting (“uninjured”) fibers in neuropathic and inflammatory pain models, and SFL was unrelated to the percentage of conducting C-nociceptors with SF (Djouhri et al., 2006). The cause(s) of this firing remain(s) unknown, but neuronal excitability, which is strongly influenced by resting membrane potential (Em), is probably key. It is therefore important to determine how Em is controlled or modulated in C-nociceptors.
We study a K+ two-pore domain leak-channel (K2P) called TREK2 (TWIK-related K+ channel-2), also known as K2P10.1 and encoded by the KCNK10 gene. K2Ps are constitutively open (Noel et al., 2011) and are the main contributors to Em in DRG and other neurons (Enyedi and Czirják, 2010; Plant, 2012). Cl− channels and voltage-sensitive K+ channels (e.g., M-current and/or KATP) may contribute to their Ems (Kawano et al., 2009; Rose et al., 2011). However, Kang and Kim (2006) showed that at 37°C TREK2 contributed ∼69% of the K+ standing current (responsible for the majority of Em) in a third of small-sized cultured neonatal rat DRG neurons; TRESK, expressed in all sizes of DRG neurons (Dobler et al., 2007), contributed 16% and TREK1 12%. The relatively high TREK2 mRNA in rat DRGs (Marsh et al., 2012) supports TREK2 contributing substantially to Em in adult DRG neurons. However, properties of TREK2-expressing adult DRG neurons remained unexplored.
We initially observed selective colocalization of TREK2 in IB4 binding (IB4+) small DRG neurons. IB4+ DRG neurons are ∼70% of rat C-nociceptors; most lumbar DRG C-neurons are IB4+, IB4+/trkA+, or trkA+, with each group contributing ∼30% (Fang et al., 2005a, 2006). IB4+ neurons innervate skin (where they penetrate the epidermis and express Mrgprd) (Zylka et al., 2005), and viscera. They project to dorsal horn lamina IIi (Kitchener et al., 1993) and are thought to activate central pathways to regions, including the amygdala and hypothalamus, that contribute to the emotional/affective impact of pain (Braz et al., 2005). They comprise 95% of rat P2X3+ DRG neurons (Vulchanova et al., 1998). IB4+ rat C-neurons have more hyperpolarized Ems than IB4− C-neurons (Fang et al., 2006; Choi et al., 2007), suggesting some hyperpolarizing influence.
We therefore examined: the chemical phenotype (IB4 binding, trkA expression, Nav1.9 expression) and sensory properties of TREK2+ DRG neurons in vivo, how their Ems relate to their TREK2 expression, whether knocking down TREK2 affects their Ems, and whether TREK2 expression is altered after axotomy, when they are depolarized. Finally, based on our results, we hypothesized that TREK2 would reduce the likelihood of C-nociceptor SF, limiting spontaneous pain behavior, and we tested this in an inflammatory pain model.
Materials and Methods
All procedures in this study were conducted in accordance with the regulations of the United Kingdom Animal Scientific Procedures Act 1986, Home Office, United Kingdom. Female Wistar rats of 150–180 g were used throughout. All experiments were terminated under deep terminal anesthesia (pentobarbital 60–80 mg/Kg i.p.).
Removal and preparation of tissues
For immunocytochemistry, rats under terminal anesthesia were perfused through the heart with 0.9% saline followed by Zamboni's fixative. DRGs and dorsal roots were removed, after fixed for 20 min and stored overnight at 4°C in 30% sucrose in PBS; 7 μm cryostat sections were taken the next day. For studies of immunocytochemistry alone (not after electrophysiology), series of 7 μm transverse sections at 400 μm intervals throughout the DRG were collected. For the siRNA in vivo study, longitudinal 5 μm cryostat sections were cut of the proximal segment (below the knee) of the sciatic nerve branch innervating the skin of the lower leg. For intracellularly recorded dye-injected neurons (see below), serial transverse 7 μm cryostat sections were cut throughout the DRG. For all studies, sections were placed on gelatin-coated slides and stored at −20°C, for subsequent immunocytochemistry.
Immunocytochemistry
All solutions were in PBS. Double or triple immunofluorescence was as previously published (Acosta and Davies, 2008; Acosta et al., 2012). Double or triple immunofluorescence was as previously published (Acosta and Davies, 2008; Acosta et al., 2012). Briefly, sections or cultures were permeabilized with 0.2% v/v Triton X-100 and blocked for 1 h at room temperature with 5% BSA + 10% FCS. Tissue was incubated sequentially in the first primary antibody overnight at 4°C and then in fluorescence secondary antibody appropriate for that primary antibody for 1 h at room temperature. This complete cycle was repeated for each primary antibody. For IB4 binding, tissue was incubated in IB4 conjugated with Alexa-488 for 3 h at room temperature. Slides were mounted with Fluorsave (Calbiochem). Primary antibodies or IB4 were applied in the order indicated in the title of the merged image in each case.
Avidin biotin complex (ABC) immunocytochemistry.
ABC immunocytochemistry was performed as described previously (Fang et al., 2005a; Fang et al., 2006; Acosta et al., 2012). ABC was preceded by blocking of endogenous peroxidase and then of biotin-like activity followed by preincubation with 10% normal goat serum. Sections were next incubated in primary antibody in 0.05% Triton X-100 with 1% normal goat serum overnight at 4°C, and then in secondary antibody for 30 min at room temperature. Finally, DAB formed the colored reaction product. ABC kits (Vector Laboratories) were used.
For quantitative comparisons of immunostaining between treated and normal rats, all sections were incubated simultaneously and treated identically, including image capture, at all stages.
Primary antibodies and IB4.
IB4 was conjugated with Alexa (1:500, Vector Laboratories). Primary antibodies were as follows. Rabbit anti-TREK2 (1:500, Alomone Labs) characterized by Alomone Labs by Lin et al. (2004) and in this paper (see Fig. 1A); mouse anti-NF200 (RT97, 1:4000, gift from J.N. Wood, University College London, London, UK) (Lawson et al., 1984), goat anti-trkA (1:2000, R&D Systems) (Saygili et al., 2010), mouse anti-Nav1.8 (1:2000, NeuroMab, University of California at Davis, Davis, CA) fully characterized by (Black et al., 2008), rabbit anti-Nav1.7 (1:200) (Toledo-Aral et al., 1997), and rabbit anti-Nav1.9 (1:100) (O'Brien et al., 2008); both the last two were gifts from S.R. Levinson (University of Colorado School of Medicine, Aurora, CO).
Figure 1.

A, TREK2 antibody characterization. Top, GFP fluorescence or interference contrast (IC) shows HEK cells, transfected with plasmids for six rat K2P channels: TREK2, TWIK1, TREK1, TASK3, THIK2, and THIK1 (all subcloned in pCMV-SPORT vector). Bottom, Same fields show immunostaining for TREK2 that was intrinsically very low (GFP alone), increased substantially after transfection with the chimeric TREK2-GFP and with TREK2, but remained very low after transfection with all non-TREK2 K2P channels tested. This antibody therefore selectively recognizes TREK2 and not the other K2P channel tested, including TREK1, structurally the closest related to TREK2. Scale bar, 40 μm. B–D, TREK2 in DRG neurons is selectively expressed in IB4+ neurons. B, Triple fluorescence immunocytochemistry shows TREK2 (blue) to be highly colocalized with IB4 binding (red). RT97 (green) is a marker for neurofilament (against a highly phosphorylated epitope on NF200) that selectively stains DRG somata with A-fibers (i.e., myelinated). TREK2 was only visible in neurofilament-poor (NF-poor, thus C-fiber) neurons, as shown by lack of (green) NF staining in TREK2+ neurons. TREK2 staining is thus in IB4+ DRG neurons with C-fibers. Scale bar, 20 μm. C, D, %intensities refers to cytoplasmic immunointensities expressed as a percentage of maximum staining above background for that marker (see Materials and Methods); gray band(s) show(s) negative staining for TREK2 (<25% %intensity) and IB4 (<20% %intensity). C, TREK2+ neuronal profiles with nuclei were <400 μm2 in cross-sectional area, and mostly <300 μm2. D, TREK2 and IB4 %intensities were positively correlated in small neurons. (Spearman's correlation coefficient, rs, shown) and had a highly significant linear regression (r2 = 0.54, p < 0.0001). There was no significant correlation in medium to large neurons; these were negative for both (data not shown). E, F, TREK2 in DRG neurons of other species. Rat images included for comparison. E, Lumbar DRG cryostat sections, from adult rat and cat (L4) and 2 week female guinea pig (L6), immunostained by ABC against TREK2. As in rat, both cat and guinea pig showed small DRG neurons positively stained for TREK2. TREK2+ neurons in cat (although larger than rat) are consistent with them being small NF-poor neurons. Small NF-poor neurons in adult cat lumbar DRGs have a mean diameter ∼40 μm; maximum ∼50 μm (Perry and Lawson, 1993); in rats, mean diameter ∼18 μm, maximum ∼25 μm. Thus, in three species, a subpopulation of small neurons shows clear TREK2 immunostaining. Scale bar, 40 μm. F, Guinea pig DRG (as above) double-labeled for TREK2 immunocytochemistry and IB4 binding. As with rat, in guinea pig strong TREK2 staining (blue) is present in a subpopulation of small DRG neurons with clear IB4 binding; red dashed lines indicate outlines of large TREK2− neurons for comparison with small TREK2+. Scale bar, 20 μm. G, H, TREK2 and trkA are poorly coexpressed in rat DRG neurons. G, TREK2 (blue) and trkA (red) (double-immunofluorescence, pseudocolored) were not visibly colocalized. White dashed lines indicate outlines of large TREK2− neurons. Scale bar, 20 μm. H, Many neurons were negative for both trkA (<20% %intensity) and TREK2 (see below); others were TREK2+ or trkA+, and few were positive for both. %intensities of neurons of all sizes were weakly but negatively correlated (Spearman's). I, J, TREK2 and Nav1.9 are colocalized in small DRG neurons. Adjacent ABC-immunostained sections were examined because both primary antibodies are from the same species. I, TREK2 and Nav1.9 were strongly colocalized. Scale bar, 25 μm. J, Strong correlation (Spearman's) between their %intensities in all sizes of neuron.
TREK2 antibody characterization.
We used a polyclonal anti-TREK2 antibody (Alomone Labs, APC-055) throughout. It was raised in rabbit against a C-terminal epitope of rat K2P10.1 (aa 475–494), which has 19/20aa homology with the human sequence. Western blots suggested this antibody is selective for TREK2 (Alomone Labs) (Lin et al. (2004)). We examined its selectivity for TREK2, versus other K2P channels, because that had not been tested previously. All these K2P channels were heterologously expressed in HEK cells (see Fig. 1A). HEK293 cells were grown on 12 mm coverslips in MEM containing 10% FBS until they reached 60–80% confluence. They were then transfected with rat cDNAs encoding for different K2P channels using Fugene 6 (Roche). These cells were chosen because their native expression of most K2P channels is undetectable or very low. The K2P channels used were as follows: TWIK1, TREK1, TASK3, THIK1, THIK2, and TREK2, all subcloned in pCMV-SPORT. A chimeric TREK2-GFP construct containing an Ala-Pro–enriched poly-linker was also used. We subcloned rat TREK2 cDNA upstream of pAc-GFPN1 from Clontech Technologies. All plasmids were sequenced to confirm the correct reading frame. We found that TREK2-GFP expression peaked 48–72 h after transfection, and we assumed that a similar time frame applied to the other K2P channels.
Secondary antibodies.
For immunofluorescence, we used anti-rabbit Alexa-488 or Alexa-594 (1:400), anti-rabbit Pacific blue (1:100), anti-mouse Alexa-488 or Alexa-594 (1:400), and anti-goat Alexa-488 or Alexa-594 (1:400), all from Invitrogen. For ABC immunocytochemistry, we used biotinylated anti-rabbit (1:100) and anti-mouse antibodies (1:100); for Western blot, anti-mouse peroxidase (1:4000) and anti-rabbit peroxidase (1:4000), all from Vector Laboratories.
Three days after transfection, the HEK cell cultures expressing the different K2P channels were washed with PBS, fixed with 4% paraformaldehyde in 4.2% sucrose (in PBS, pH 7.2) for 10 min at room temperature, rinsed with PBS, and processed for TREK2 immunocytochemistry with the rabbit anti-TREK2 antibody from Alomone Labs as described above. This antibody proved highly selective for TREK2 versus the other transfected K2Ps (see Fig. 1A). In our Western blots (see Figs. 3A and 7A), this antibody detected one (in DRG tissue) or two (in skin) bands of molecular weight (MW) appropriate for TREK2 (55 and 60 kDa) as previously shown (Simkin et al., 2008).
Figure 3.

siRNA knockdown of TREK2 in vitro caused depolarization of IB4+ DRG neurons. A, B, Western blots to show extent of TREK2 knockdown with siRNA in cultured DRG neurons. Western blots were of neuron-enriched cultures after 2 DIV. They were of adult rat DRG neurons (with NGF and GDNF) that had been transfected 6 h after plating with either 5 nm scrambled (scr) siRNA or with one of three siRNAs (A–C) from Ambion (see Materials and Methods) against rat TREK2. Naked siRNA was added 1 d after plating. Treatments and doses indicated below lanes in A. A, Top row, Single TREK2 band of ∼55 kDa. Bottom row, β-Tubulin III as loading control. B, Quantification of the three repeats of the experiment in A with tissue from three different rats relative to their loading controls. TREK2 protein levels were unaffected by scr; and compared with scr, the greatest TREK2 knockdown was with TREK2 siRNA C (Silencer Select preDesigned from Ambion) at either 5 or 10 nm (downward arrows); siRNA C at 10 nm was therefore chosen for later use in this study. C, D, TREK2 knockdown by siRNA C resulted in depolarization of IB4+ DRG neurons. C, Selection of cultured DRG neurons for Em measurement after transfection with scr-FAM (5 nm) or siRNA C (10 nm) plus scr-FAM (5 nm). Neurons selected had to show both FAM (green) fluorescence indicating likelihood of transfection plus IB4 binding (red; IB4+). White arrows indicate 2 neurons fulfilling both criteria. Scale bar, 20 μm. D, In small IB4+ FAM+ cultured DRG neurons (2 DIV), TREK2 knockdown by TREK2 siRNA C (plus scr-FAM) resulted in a highly significant median Em depolarization by ∼10 mV, compared with only scr-FAM treatment. *p < 0.05. **p < 0.01. ***p < 0.001. ****p < 0.0001. Blue dashed arrows indicate theoretical Ems calculated with the GHK equation, for normal DRG neurons and for those with no TREK2, using the percentage (69%) of Em K+ standing current that was due to TREK2 in TREK2-expressing small neonatal DRG neurons (Kang and Kim, 2006).
Figure 7.

TREK2 knockdown in vivo decreased SFL 1 d after CFA. Ipsilateral SFL in rats 1 d after an intradermal plantar CFA injection in one hind foot in the same region as an intradermal plantar injection of either TREK2 siRNA or scrambled siRNA given 3 d earlier. Numbers in B and C (superscripts) and D and E (beside data points) relate to rats from which tissue in the lanes of A was obtained; these numbers are included to enable comparison of TREK2 protein expression with other data from the same rats. A, TREK2 Western blot of skin tissue, at the site of scr (1, 2) or siRNA (3, 4) injection 4 d previously, and 1 d after either saline (1, 3) or CFA injection (2, 4) at the same site. Top, The lower TREK2 band (MW ∼50 kDa, the band that we and others find in DRG tissues) was almost eliminated by siRNA, not scr, treatment, regardless of whether rats were injected with CFA or saline. The upper band was not reduced after siRNA. The MWs of these bands are consistent with them being two of the three known rat TREK2 isoforms (see Results and Discussion). Bottom, α-Tubulin loading controls. B, TREK2 knockdown by TREK2 siRNA in nerve fibers and epidermis (Ep) in plantar skin. Left, after scr siRNA injection. Right, after TREK2 siRNA injection. Both treatments were followed by CFA injection. Tissue was taken 4 d after scr/siRNA treatment (1 d after CFA). Triple fluorescence staining for β-tubulin III (blue, to stain nerve fibers), IB4 binding (green), and TREK2 (red). White dashed lines indicate junctions between epidermis (above) and dermis (below). In the merged images, colocalization of all three markers shows as white or very pale (bottom left image). After siRNA, red TREK2 staining in epidermis and in groups of nerve fibers (shown as blue and/or green) was reduced, showing substantial knockdown in vivo of TREK2 near the siRNA injection site. Scale bar, 25 μm. C, TREK2 knockdown by local TREK2 siRNA in the nerve innervating plantar skin. This knockdown, seen 5–10 mm from the siRNA injection site, occurred whether rats were subsequently treated with saline or CFA. There was decreased fiber TREK2 immunostaining (red) in TREK2 siRNA, not scr siRNA, treated rats, so that IB4+ fibers (green) showed little/no TREK2 (red). Scale bar, 50 μm. D, E, SFL after CFA increased after TREK2 siRNA compared with scr control. Ipsilateral SFLd (D) or SFLn (E) after siRNA C compared with scr treatment did not increase before saline injection (day 3, columns 1 and 2) or after saline injection (day 4, columns 3 and 4), or before CFA injection (day 3, columns 5 and 6). However, after CFA, it caused increased SFLd (D) and SFLn (E) in both scr (p < 0.01, columns 7 vs 5) and TREK2 siRNA (p < 0.001, column 8 vs 6) rats. This increase was ∼2-fold greater (for both SFLd and SFLn) after siRNA than after scr treatment (p < 0.05, column 8 vs 7). Statistics refer to both duration and events throughout. That is, the effect on SFL (duration and number of footlifts) of TREK2 knockdown was evident only after CFA treatment, when it doubled the CFA-induced SFL. *p < 0.05.
Western blots
Western blots were performed as previously described (Acosta and Davies, 2008; Acosta et al., 2012). Using Laemmli buffer supplemented with a protease inhibitor mixture (CompleteSTOP) and a phosphatase inhibitor mixture (PhosphoSTOP), both from Roche, total protein was extracted from the following: whole L4–L5 DRGs, plantar skin, and 2 d cultures of DRG neurons. Protein concentration was estimated using the method of Bradford. Samples of ∼20 μg of total protein were run in 8–10% PAGE gels (Bio-Rad) and transferred to a PVDF membrane (GE Healthcare) before blotting. Membranes were probed with 1:500 rabbit anti-TREK2 antibody (Alomone Labs) and then with 1:200 mouse anti-β-tubulin III (clone SDL.3D10, Sigma) or 1:2000 mouse anti-α-tubulin (clone AA13, Sigma) as a loading control. Membranes were developed using ECL-plus (GE Healthcare).
Cultures
DRGs from all rostrocaudal levels were dissected out (Acosta et al., 2012). They were enzymatically digested at 37°C in 0.25% trypsin with 0.5% collagenase in PBS, mechanically dissociated, plated onto round coverslips (Bellco) coated with 10 ng/mm2 poly-d-lysine plus 1 ng/mm2 laminin and kept in DMEM supplemented with N2 medium at 37°C in a 5% CO2 incubator until used. Neuron density at plating was ∼1 × 10⁵ neurons/ml. A single dose of 10 μm β-d-ARAC controlled non-neural cell proliferation.
The dissociation and culture process is equivalent to an extreme form of acute axotomy, causing deprivation of normally available target-derived and nerve-derived, trophic factors. Trophic factor supplements are therefore required to maintain a relatively normal phenotype in vitro. Cultures received mouse NGF 7S (10 ng/ml) and rat recombinant GDNF (20 ng/ml) (Preprotech). Both were dissolved in 0.1% BSA and were added daily with fresh N2 medium.
In vitro use and validation of small interfering RNA (siRNA)
siRNAs, all from Ambion (Invitrogen), were reconstituted in siRNA dilution buffer and stored at −20°C until use. Six hours after plating, DRG neurons were transfected with 5 nm scrambled (scr) siRNA conjugated to 5′-carboxylfluorescein (FAM), or with 5 or 10 nm siRNA directed against rat TREK2 (KCNK10, locus ID 65272) plus 5 nm scr-FAM (to allow identification of likely transfected cells, see below). Transfection was with Gene Silencer siRNA transfection reagent (Genlantis) following the manufacturer's protocol. This transfection system works well in cultured DRG neurons (Wu et al., 2006). Subsequent daily medium changes included 10 nm naked TREK2 siRNA.
The ability of the three different TREK2 siRNAs (A–C), to knock down TREK2 expression after 48 h in culture, was examined by Western blot (see Fig. 3). siRNA A (ID 192322: sense, 5′-GCUGCGAGUUUUCAAAtt-3; antisense, 3′-UUUGGAUAAAACUCGCAGCCca-5′) and B (ID 52706: sense, 5′-GGAGGAAUCUUUUGUAtt-3′; antisense, 3′-UACAAAAGAUUUUGCCUCCtt-5′) were both Silencer predesigned; siRNA C (ID s134824: sense, 5′-GCAGUCAGAAGAACACAAUtt-3′; antisense, 3′-AUUGUGUUCCUUCUGACUGCtc-5′) was Silencer Select predesigned. Silencer Select siRNAs are designed by Ambion using a highly demanding and successful algorithm and tested against multiple databases, including many thousands of targets, substantially eliminating those with off-target effects. siRNA C proved the most effective in knocking down TREK2. It exhibited similar potency at 5 and 10 nm. siRNA C, at a dose of 10 nm, was therefore used in all subsequent experiments. We conducted a BLAST search for the siRNA C sequence that covered all species and all known sequences. This search showed a 100% coverage of the rat KCNK10 gene. This is with an e-value of 4 × 10⁻⁴ (the smaller this value, the higher the selectivity of the primer or siRNA for a given target sequence). The next two possible targets (excluding whole fragments of cloned chromosomes not attributed to any specific gene) correspond to two proteins: Picalm (gene ID: 8301) and Skp1 (gene ID: 6500). Neither protein showed any known interactions with ion channels, let alone K2P channels (www.ncbi.nlm.nih.gov/gene/8301 and www.ncbi.nlm.nih.gov/gene/6500). Furthermore, in both cases, the overlap between this siRNA C and the gene sequence for these two proteins is <60% and is, importantly, located in noncodifying regions. Their e-values are 5.9, which means that the binding of siRNA C to these mRNAs is orders of magnitude less effective than for KCNK10.
Fluorescence microscopy showed which neurons were transfected with the nontargeting FAM-labeled scr siRNA (see Fig. 3C), indicating that these neurons were probably also successfully transfected with TREK2 siRNA.
Electrophysiology
Intracellular recording in vivo.
Female Wistar rats were deeply anesthetized with Na+ pentobarbitone, initially with 60 mg/kg intraperitoneally, and then regularly supplemented with further doses of 10 mg/kg intravenously. After an L2–L6 laminectomy, the left L4 and L5 DRGs and their dorsal roots were exposed, and bone was removed from beneath the DRGs. A pool for liquid paraffin was made with skin flaps and dental impression material. This paraffin was maintained at ∼30°C (28.5–32°C), whereas core temperature was 34–35°C. The temperature at the neurons, somewhat warmed by circulating blood, would thus be between these values, and certainly lower than 37°C. Blood pressure was monitored. Drugs were delivered through an intravenous cannula. Before recording, a fine platinum platform lifted the DRG slightly away from the bone to minimize transmission of movement or vibration to the DRG. Then the dorsal root was cut near the spinal cord, lifted into the liquid paraffin, and placed over platinum bipolar stimulating electrodes. Finally, just before recording, muscle relaxant (pancuronium, 1 mg/kg i.v.) and a top-up anesthetic dose of 10 mg/kg intravenously were delivered. These doses of both drugs were given approximately every hour. The rat was artificially respired. For further details, see Lawson et al. (1997) and Djouhri et al. (2012). Intracellular recording was with borosilicate microelectrodes filled with fluorescent dye: Lucifer yellow, 5 mg/ml in 0.1 m LiCl, ethidium bromide, 6 mg/ml in 1 m KCl, or cascade blue, 30 mg/ml in 0.1 m LiCl. Electrodes were advanced until a resting membrane potential (Em) was obtained. The dorsal root was stimulated. When a somatic action potential was evoked by this, its latency from the stimulus (including utilization time) was used to calculate conduction velocity (CV). CV groups were C (≤1 m/s), Aδ (1.5–6.4 m/s), or Aα/β (≥6.5 m/s) based on compound action potentials recorded under similar conditions (Fang et al., 2002). Em was recorded as the first stable value after penetration.
SF was recorded for >1 min after neuron penetration, but before sensory testing. Injury discharge was excluded, see published details (Djouhri et al., 2006).
Sensory receptive field identification.
Hand-held mechanical stimulators were used to define neuronal sensory receptive properties as previously described (Lawson et al., 1997; Djouhri et al., 2012). Neurons were classified according to intracellularly recorded firing evoked by stimulation of their hindlimb sensory receptive fields by a variety of stimuli. Low threshold mechanoreceptors (LTMs) responded to brush, gentle stretch or very gentle pressure, whereas nociceptors responded only to high intensity stimuli, such as strong pressure, pinch, needle pressure, or squeezing of the tissues. Subdivisions of Aα/β-fiber LTMs included muscle spindle afferents that responded to light pressure, stretch, and vibration over the muscle and were not cutaneous (i.e., the receptive field did not move with movement of the overlying skin); or as cutaneous: (1) G hair or field (G/F) receptors, both of which responded to gentle movement across the skin, (2) as rapidly adapting glabrous receptors, or (3) slowly adapting stretch receptors.
C-fiber neurons recorded in these DRGs were mostly nociceptive, responding to noxious mechanical and/or noxious heat stimuli. Some were unresponsive but had action potential characteristics typical of nociceptors (Fang et al., 2005b) and were included with nociceptors as “nociceptor-type” neurons. A few neurons were cooling sensitive (responding to brief localized ethyl chloride spray) or were C LTMs. For more details, see Lawson et al. (1997) and Djouhri et al. (2012).
In vivo dye injection.
After CV and sensory properties were identified, neurons were injected with fluorescent dye (Lawson et al., 1997), with 500 ms square wave pulses (±1.3 nA) at 1 Hz for up to 10 min for A-fiber neurons and up to 5 min for C-fiber neurons. After perfusion fixation and after fixation of DRGs (see Removal and preparation of tissues), serial 7 μm cryostat sections were placed sequentially on 20 slides, and sections were examined under fluorescence microscopy to find the dye-injected neuron(s). For further details about dye injection and identification of dye-injected neurons, including controls plus associated problems and how to overcome these, see Lawson et al. (1997), Fang et al. (2002), and Djouhri and Lawson (2004). ABC TREK2 immunocytochemistry was on a section of each dye-injected neuron.
In vitro electrophysiology.
Before recording, coverslips with adult DRG neurons cultured for 2 d and treated as above with scr-FAM or siRNA C (10 nm) plus scr-FAM, were incubated for 15 min at 37°C, 5% CO2 with IB4-Alexa-594 (1:500 in PBS), then washed and kept in PBS with 10 mm HEPES buffer. Coverslips were placed in external solution containing the following (in mm): 135 NaCl, 5 KCl, 4 CaCl2, 2 MgCl2, 10 d-glucose, and 10 HEPES, pH 7.2, in a 500 μl recording chamber at 35–37°C. The patch pipettes (Corning 8161; Harvard Apparatus) were pulled with a vertical Narishige puller, fire polished with a microforge (M-83; Narishige), and filled with a solution containing the following (in mm): 135 KCl, 5 MgCl2, 10 EGTA, 10 HEPES, 4 Na2ATP, 0.1 Li2GTP, and 0.1 leupeptin, pH 7.2. These ion concentrations were used in our Goldman-Hodgkin-Katz (GHK) calculations (http://www.physiologyweb.com/calculators/ghk_equation_calculator.html). However, the intracellular Cl− concentration measured under similar recording conditions in DRG neurons was shown to be 31 mm due to intracellular buffering and cotransport effects (Alvarez-Leefmans et al., 1988; Costa et al., 1989); therefore, this is the value we used in the GHK equation. Tip resistances were 2–3 mΩ. Recordings were made only from neurons that were identified, under very brief fluorescence illumination, as both IB4+ and FAM+ (see Fig. 3C); they were all small neurons. The series resistance was compensated to 70–95%. No corrections for liquid junction potentials were made. Neurons were accepted for analysis if they had (1) stable gigaOhm seals with no measurable leak, (2) Ems stable for >5 min, and (3) good visible integrity during recording. Ems were recorded with an HEKA EPC-10 amplifier (HEKA Elektronik), in the current-clamp mode of the whole-cell configuration. Data were acquired using analog-to-digital converter software (Scientific Solutions), low-pass filtered at 2 kHz, sampled at 20 kHz, saved, and analyzed offline.
Image analysis
All analyses were on images captured in black and white with a CCD camera (Hamamatsu) on a Leica DMRB microscope with 40× objective. Fluorescence images were captured using filter blocks customized for Alexa-488, Alexa-594, and Pacific Blue (Glen Spectra). Images were analyzed before any processing. For presentation, some were processed off-line to create pseudocolor images for figures; those in any one figure were all processed the same.
Image analysis of in vivo-recorded dye-injected neurons.
This was on bright field images, as captured. Scores and measures were by observers who were blinded to the neuron's sensory properties.
Subjective scoring.
Cytoplasmic staining of the dye-injected neuron was scored subjectively, as follows: 0 = negative; 1 = just visible above background; 5 = the most intense neuronal cytoplasmic staining in that section.
Objective analysis.
Conversion of pixel densities to relative percentage intensities (abbreviated to %intensities throughout): The TREK2 ABC staining of each dye-injected neuron was determined as a percentage of maximum staining as follows. First, cytoplasmic mean pixel density (c) of the dye-injected neuron was measured. Then, all in the same section as the dye-injected neuron, the mean pixel densities of the three most lightly stained neurons (a, 0%, minimum = background) and of the three most darkly stained neurons (b, 100%, maximum) were also measured. The percentage relative intensity of cytoplasmic staining in the dye-injected neuron was (100 × ((c − a)/(b − a))%. At the same time, TREK2 mean pixel densities at the edge of the cytoplasm up to the membrane (edge) and in the mid or inner cytoplasmic regions (see Fig. 2B, inset) were measured within a carefully placed small (∼2 μm2) circle. These are also presented as percentages relative to the above minimum (background) and maximum total mean cytoplasmic values (a and b).
Figure 2.

In vivo, TREK2 is in small C-fiber nociceptors; their Ems relate to TREK2 levels. A–G, DRG neurons injected in vivo with fluorescent dye after Em recording and sensory receptor property identification (see Materials and Methods). A, Examples (arrows) of fluorescent dye-labeled neurons before (top) and after (bottom) TREK2 ABC immunocytochemistry. TREK2%intensities (see Materials and Methods) were determined at edge-, mid-, and inner- (perinuclear) cytoplasm (B, inset). The two C-fiber nociceptors (C-Nocis) have (left) a −52 mV Em and strong cytoplasmic, including edge, TREK2 intensity; then (mid-left) a −42 mV Em, with weak edge- but stronger mid- and inner-TREK2. The Aδ nociceptor (mid-right) and Aα/β LTM (far right) were TREK2− (see Materials and Methods and below). Scale bar, 20 μm. B–G, Cytoplasmic edge- and mid-TREK2%intensities of ≥25% (of maximum cytoplasmic staining; see Materials and Methods) were deemed positive. The negative staining (<25%) is shown as gray bands. B, C, Most C-nociceptors, not A-fiber neurons, were TREK2+. This was the case for edge-TREK2 (B), mid-TREK2 (C), and inner-TREK2 (data not shown). Only C-nociceptors and a C-cooling unit were edge-TREK2+; all A-fiber neurons were edge-TREK2−. Most were also mid-TREK2−; only a single Aδ-LTM and an Aβ nociceptor were weakly mid-TREK2+. Median edge- and mid-TREK2 were highly significantly greater (p < 0.0001) in C-nociceptors than in all A-neurons (Mann–Whitney). No differences between edge- or mid-TREK2 in A-neuron subtypes were seen (Kruskall–Wallis tests). Similar patterns to mid-TREK2 were also seen for inner-TREK2 (data not shown). D, Em magnitude in C-nociceptors was inversely related to edge-TREK2 (linear regression) but not to mid-TREK2 (E) or inner-TREK2 (data not shown), although weak trends are seen (arrows indicate C-neurons illustrated in A). F, G, Em magnitude in A-fiber neurons was unrelated to edge- or mid-TREK2 immunointensity in all, or any subgroup, of A-neurons examined. Edge-TREK2%intensities (F) and mid-TREK2%intensities (G) and inner-TREK2%intensities (data not shown) were all negative (<25%). ****p < 0.0001.
Image analysis for other studies.
Objective analysis was similar to the above, but the mean total cytoplasmic pixel densities of the 5 most intensely and the 5 least intensely stained neurons in the analyzed section(s) or culture(s) provided 100% and 0% values, respectively. Analysis was made of all DRG neuronal profiles with a visible nucleus within the mid (largest) transverse section of the DRG. Images for each study were all captured simultaneously with identical settings. For each neuron, the cross-sectional area and mean cytoplasmic pixel density were determined. Pixel densities were inverted as necessary so that more reaction product resulted in a higher number for both ABC and fluorescence. Where these were converted to percentage values, this was as described above. Neurons were subdivided according to profile size as previously described: lumbar DRG neuron sizes (cross-sectional areas) in this age and gender of rats are related to fiber CV as follows: small (up to 400 μm2) mostly have C-fibers, medium-sized neurons (400–800 μm2) mostly have Aδ-fibers and large neurons (>800 μm2, including only the upper part of the large neuron distribution) have Aα/β fibers (Fang et al., 2005b).
To determine the effect of axotomy on Nav1.8 expression, only subjective scoring was performed. This was of whole cytoplasmic intensities as follows: 0 = negative; 1 = just clearly visible above background; 7 = the most intense neuronal cytoplasmic staining in that section.
Thus, “%intensities” throughout mean objectively determined relative intensities, above background, as a percentage of maximum intensity as described above.
Neurons classed as positive.
Percent intensities (see above) were defined as positive/negative (+/−) for immunostaining, or IB4 binding, as follows. For TREK2, the subjective and objective scores for whole cytoplasmic staining for all dye-injected C-fiber neurons were highly linearly correlated (data not shown; r2 = 0.9, p < 0.0001). On this plot, a subjective score of 1 (just clearly visible immunostaining above background) corresponded to TREK2 %intensities that were approximately 25%. This level was therefore classed as TREK2+ and <25% as TREK2−. This 25% level was also defined as TREK2+ for edge-, mid-, and inner-TREK2 %intensities. Thus, if edge-TREK2 was lower than cytoplasmic TREK2, a neuron with TREK2+ cytoplasm (%intensity of >25%) would be classed as edge-TREK2− (%intensity <25%).
The same method was used for other antibodies/markers, as previously published (e.g., Fang et al., 2005a, 2006), with the difference that, for these, the neurons that were subjectively scored as 1 (i.e., detected as visibly labeled) corresponded to lower %intensities (≥20%), probably because of their higher signal-to-noise ratios. Finally, neurons were called neurofilament rich (NF-rich) if their RT97 fluorescence staining was visible, regardless of intensity, whereas NF-poor neurons had no visible staining (Lawson et al., 1984; Lawson and Waddell, 1991).
Selection of neurons in DRG sections for analysis in each non–dye-injection study.
In all these other studies: (1) only neuronal profiles with a visible nucleus were measured; (2) unless stated otherwise, 4 female rats were used per treatment; (3) for analysis of immunocytochemistry, 8–10 regions of 3.66 × 10⁻² mm2 were captured from a transverse mid-section of one L5 DRG (normal and ipsilateral) and regions with greater neuron:fiber densities were selected; and (4) ∼100 neurons per DRG mid-section (i.e., per rat per treatment: 100 for normal and 100 for ipsilateral DRGs), totalling ∼400 (range 363–588) per treatment.
Partial nerve injury and inflammation pain models
These models were as previously described (Djouhri et al., 2006, 2012). Brief details are given below.
L5 spinal nerve axotomy (SNA).
In rats under isofluorane anesthesia, the left transverse process of the L6 vertebra was removed. Then the L5 spinal nerve was isolated, tightly ligated (6-0 silk suture), and transected (preventing fiber regeneration) just distal to the suture. The incision was closed in layers and allowed to heal.
Modified spinal nerve axotomy (mSNA).
The procedure was as above for SNA, with the added modification of a chromic gut loose ligature around the L4 spinal nerve, which causes added inflammation and extra damage to the L4 spinal nerve.
In these partial nerve injury models, the L4 DRG contains both damaged (axotomized, nonconducting) and conducting (i.e., “uninjured”) neurons with fibers that conduct from their receptive fields through the partially damaged nerve. Compared with SNA, the mSNA model results in more L4 neurons having axotomized and thus nonconducting fibers. mSNA also results in more SF in conducting L4 DRG neurons, plus greater SFL than SNA (Djouhri et al., 2006).
CFA-induced cutaneous inflammation.
In all studies, a 100 μl injection of Complete Freund's Adjuvant (CFA) (Sigma) was made intradermally under isoflurane anesthesia into the mid-plantar surface of the left hindpaw. Another identical injection was also made lateral to the left knee (Djouhri et al., 2006), in all studies except the in vivo siRNA study.
SFL, both duration (SFLd) and number (SFLn).
SFLd is a useful measure of spontaneous/ongoing pain in CFA and in these L5 spinal nerve axotomy models of pathological pain (Djouhri et al., 2006). SFL was measured by an operator blind to which rats received which treatment(s). To measure SFLd, the rat was placed in a plain perspex box with a glass floor; SFL was not measured until the rat had finished exploring, repositioning itself, or grooming. Once it ceased exploring and became stationary, the cumulative amount of time the ipsilateral hindpaw was lifted (SFLd) was measured over 10 min (two 5 min periods separated by ≥5 min). Lifts or flicks of the foot/leg that were too short to measure accurately were recorded as 0.5 s duration. The number of spontaneous footlifts (SFLn) was simultaneously recorded during the same durations. No SFL was observed contralaterally in normal rats or in rats injected with saline. This SFL was not due to static or dynamic allodynia (Djouhri et al., 2006) nor was it influenced by the high thermal capacity of the glass because SFL did not differ in the same rats whether it was measured on a glass or perspex (lower thermal capacity) floor (this study, data not shown).
In vivo siRNA knockdown of TREK2
For in vivo behavioral studies, the siRNA knockdown approach has the following advantages over the use of global TREK2 knock-out transgenic mice: (1) the lack of long-term compensatory mechanisms; and (2) the siRNA knockdown was local, highly selective, and short-term and was therefore much less likely than transgenic global knock-out mice, to have effects on other systems that could influence behavioral responses.
Validation of the effectiveness of TREK2 knockdown by in vivo siRNA treatment.
The efficacy of the in vivo TREK2 knockdown by siRNA was evaluated after SFL measurement (i.e., 4 d after siRNA/scr and 1 d after CFA). To test and optimize the transfection conditions, we first conducted a limited pilot experiment involving 4 rats (2 treated with siRNA and 2 with scr). In a second stage, the efficacy of the knockdown was examined by Western blot and immunocytochemistry in another 9 rats (representative examples of these are shown in Fig. 7). For the evaluation, rats were deeply terminally anesthetized (Na+ pentobarbitone 80 mg/kg). Skin tissue was harvested for protein extraction and Western blotting, within 2 h of completing the behavioral tests. These rats were then immediately perfused with fixative, for removal of tissues. Immunocytochemistry was then performed on frozen sections of skin and sciatic nerve.
Influence in vivo of siRNA treatment on SFL.
TREK2 was knocked down in vivo as follows. At day 0, a single 2 μg dose of rat TREK2-specific siRNA (siRNA C, see above and Fig. 3) or scr siRNA, with the cationic polymer transfection reagent in vivo-jetPEI (Polyplus-transfection SA), was injected intradermally into the left hindpaw of 21 female Wistar rats. Neither these injections nor this transfection reagent caused any detectable inflammatory response in our experiments in agreement with other studies using the same reagent (Bonnet et al., 2008). This intradermal route of siRNA delivery was previously successful (Murase et al., 2009). Three days later, rats were injected at random with either saline (8 rats) or CFA (13 rats); SFLd and SFLn were examined 24 h later. Although local biosynthesis in afferent C-fibers/terminals occurs for some molecules (e.g., Asante et al., 2009), it is not known whether TREK2 synthesis occurs only in C-neuron somata or also in their fibers. The timing that we used (see below) allowed transport time for any knockdown in the soma to influence fiber TREK2 levels, and this timing would thus also allow knockdown of any TREK2 expression that may occur within the fiber. The total of 4 d after siRNA/scr injection should have allowed enough time for transport of siRNA to the DRG (2 d) and for TREK2 expressed in transfected DRG neuronal somata to be transported to the foot. We predicted that downregulation of TREK2 after TREK2 siRNA in fibers innervating the injected region would occur by 4 d after siRNA injection (i.e., 1 d after the CFA injection).
Statistics
Nonparametric tests were used except where all variables were normally distributed when parametric tests were used, see figure legends. All tests were with GraphPad Prism, version 5.
Results
TREK2 antibody characterization
The polyclonal TREK2 antibody that we used throughout was APC-055 (Alomone Labs) (see Materials and Methods). Figure 1A shows that this antibody recognizes heterologously expressed TREK2 and TREK2-GFP but not the structurally closely related TREK1 or any of the other K2P channels tested (TWIK1, TASK3, THIK2, THIK1), indicating very high selectivity for TREK2. We also confirmed the specificity of this antibody by Western blot of DRG tissue, where it recognized a band of the expected molecular weight (see Fig. 3A).
TREK2 expression in small IB4+ DRG neurons across species
Rat
Figure 1B shows that strong neural TREK2 immunostaining (blue) was limited to small IB4+ (red) DRG neurons; all clearly TREK2 (TREK2+) neurons therefore show as purple/mauve in the merged image. The TREK2+ neurons were neurofilament (NF)-poor (lack of green NF200 staining; Fig. 1B). This suggests that clear TREK2 is limited to C-fiber neurons because NF-poor DRG neurons have C-fibers in rat (Lawson and Waddell, 1991). TREK2 staining above background was not visible in the cytoplasm of large NF-rich neurons (i.e., with myelinated A-fibers), although occasional weak TREK2 staining of myelinated fibers with ABC immunocytochemistry (data not shown) means that we cannot exclude the possibility of low TREK2 expression in some A-fiber neurons. DRG neurons with cytoplasmic %intensities (i.e., relative percentages of maximum) of TREK2 ≥ 25% were classed as TREK2+, and those with <25% (gray band on graphs) as TREK2− (see Materials and Methods). Most TREK2+ neurons were very small (<300 μm2; Fig. 1C).
The colocalization between TREK2+ and IB4+ (≥20% maximum IB4 staining; see Materials and Methods) staining was almost complete (4 rats): 95.7% of 508 TREK2+ neurons were IB4+, and conversely 98.6% of 493 IB4+ neurons were TREK2+. Furthermore, cytoplasmic %intensities of TREK2 and IB4 were strongly correlated (Fig. 1D). IB4+ DRG small neurons were previously shown to be C-fiber nociceptors in rat, whereas a few weakly IB4+ medium-sized (>400 μm2) neurons were D hair units (Fang et al., 2006). Thus, the TREK2+ DRG neurons in rat, being small and IB4+, are probably all IB4+ C-fiber nociceptors.
Other species
As in rat, TREK2 was also expressed in a subpopulation of small DRG neurons in both adult cat and guinea pig lumbar DRGs (Fig. 1E). The sizes of the TREK2+ neurons in cat are consistent with them being small NF-poor neurons (see Fig. 1 legend). Double-fluorescence studies in guinea pig showed that clear TREK2 is also (as in rat) present in IB4+ small DRG neurons (Fig. 1F), but sensory properties of IB4+ neurons may not exactly equate between species. Subsequent studies below are all on rat DRG neurons.
trkA is poorly colocalized with TREK2 in rat DRG neurons
TREK2 showed little coexpression with trkA, the high-affinity NGF receptor; neurons were stained for either TREK2 (blue) or trkA (red), but rarely both (Fig. 1G). There was only a negative (weak) correlation between these (Fig. 1H). Most (72%) TREK2+ neurons were trkA− (<20% relative intensity), and most (75%) trkA+ neurons were TREK2−. Only 6% of all neurons were positive for both; these are the few neurons outside both gray bands. Thus, TREK2 is only expressed in a subpopulation (25%) of trkA+ neurons with no positive relationship between their staining intensities.
Nav1.9 is strongly colocalized with TREK2 in rat DRG neurons
ABC immunocytochemistry of adjacent sections (Fig. 1I) showed Nav1.9 and TREK2 to be highly colocalized: 96% of TREK2+ neurons were Nav1.9+ (≥20% maximum intensity), and 74% of Nav1.9+ neurons were TREK2+. There was a highly significant positive correlation between their immunointensities in all sizes of neurons (Fig. 1J). These findings are consistent with Nav1.9 being highly and preferentially expressed in IB4+ neurons (Fang et al., 2006).
Because activation of Nav1.9 causes a persistent (depolarizing) inward current (Cummins et al., 1999), it was surprising that IB4+ C-neurons (i.e., with high Nav1.9) were more hyperpolarized than IB4− C-neurons (Fang et al., 2006; Choi et al., 2007), and so we hypothesized that other molecule(s) may be responsible for this hyperpolarization. From its histochemical distribution, TREK2 emerged as a good candidate. We therefore examined whether Ems were related to TREK2 levels in functionally characterized individual DRG neurons in vivo.
TREK2 in identified rat C-fiber neurons in vivo
Neurons with identified sensory properties (Fig. 2A, examples) were dye-injected (upper row) and later stained for TREK2 (lower row). Of two C-nociceptors shown, the one with a high TREK2 %intensity had an Em of −52 mV, whereas the one with lower %intensity, especially low at the cytoplasmic edge, had an Em of only −42 mV. The two A-fiber neurons shown illustrate the typical lack of detectable TREK2 staining above background in A-fiber neurons. For all neurons examined, %intensities of edge- and mid-TREK2 at the neuron periphery (Fig. 2B, inset) are plotted. Mid- and inner-TREK2 reflect intracellular localization; K2P channels are synthesized via RER-Golgi, packed into vesicles, and then sorted to the plasma membrane and they are usually detected in those intracellular compartments (Mathie et al., 2010).
TREK2 is in somata of C-fiber nociceptors in rat
Edge-TREK2 (Fig. 2B), mid-TREK2 (Fig. 2C), and inner-TREK2 (data not shown) showed clear staining above background (>25%) in C-nociceptors, contrasting with TREK2− (<25%) A-fiber neurons. The edge-, mid-, and inner-TREK2 median %intensities for C-nociceptors were highly significantly greater (p < 0.0001) than for all A-fiber neurons and than those A-neuron subgroups with ≥3 neurons; there were no significant differences (Kruskall–Wallis test) between A-neuron subgroups (Fig. 2B,C). A high percentage of these identified C-nociceptors were TREK2+: 9 of 14 (64%) were edge-TREK2+, and 12 of 14 (86%) were mid-TREK2+. Thus, 3 of 14 (21%) were mid-TREK2+ and edge-TREK2−. These high percentages suggest that TREK2 may potentially influence a high proportion of C-nociceptors.
Given the high TREK2/IB4 colocalization, the above numbers are consistent with the previous finding that 72% of C-nociceptor-type neurons were IB4+ and that strongly IB4+ neurons were all nociceptor-type neurons (Fang et al., 2006). The only Aδ LTM was weakly mid-TREK2+ but edge-TREK2−, again consistent with the previous report that some Aδ LTMs (D hair neurons, medium-sized neurons) were weakly IB4+.
Membrane potential (Em) in rat C-nociceptors in vivo is related to edge-TREK2
C-neurons with greater edge- and mid-TREK2 were more hyperpolarized. Their Ems were significantly correlated with their edge-TREK2 %intensities (Fig. 2D), both for C-nociceptors alone (p < 0.01, r2 = 0.47, n = 14, regression line shown) and for nociceptor-type neurons (these 14 C-nociceptors plus two unresponsive neurons) (r2 = 0.51, p < 0.01, n = 16, regression line not shown). The two arrows in Figure 2D indicate the C-neurons illustrated in Figure 2A. %intensities for mid-TREK2 (Fig. 2E) and inner-TREK2 (data not shown) plotted against Em, display similar trends but without significant correlations. Ems of A-fiber neurons were not correlated with their edge-, mid-, and inner-TREK2 %intensities (Fig. 2F,G, inner not shown). This study strongly suggests that Ems of C-nociceptors are influenced by levels of TREK2 at the cytoplasmic edge. Because TREK2 channels are mostly open at physiological temperature (Kang et al., 2005), we can deduce from our data that functional TREK2 levels in the soma membrane are associated with edge-TREK2 levels. From this point onwards, we therefore focus mainly on edge-TREK2 levels.
In vitro TREK2 knockdown depolarizes Em in rat IB4+ DRG neurons
To test further the dependence of Em on TREK2 levels, we next examined whether knocking down TREK2 would affect the Ems of IB4+ small DRG neurons in culture. This approach has advantages over using a global TREK2 knock-out because compensation is much less likely during a short-term (few days) depletion induced by TREK2 siRNA than during a long-term knock-out.
Of the three different siRNAs against rat TREK2 that were examined for their ability to knock down TREK2 protein expression in cultured adult rat DRG neurons, siRNA C (Fig. 3A,B, arrows) was the most effective (median TREK2 expression decreased by 54% compared with scr). siRNA C was therefore subsequently used throughout. This siRNA was highly selective (see Materials and Methods).
Neurons were chosen for patch clamp if they (1) showed detectable levels of scr-FAM (green) because these were deemed likely to be successfully transfected with siRNA, and (2) were also IB4+ (red). Examples are indicated by arrows in Figure 3C.
Median Ems in small IB4+ (thus presumably C-nociceptor) DRG neurons in culture were significantly more depolarized, by ∼10 mV, after knockdown of TREK2 with siRNA C (plus scr-FAM) than after treatment with only scr siRNA (Fig. 3D). This depolarization after TREK2 knockdown suggests that (1) TREK2 normally causes more hyperpolarized Ems in these IB4+ neurons and (2) the high TREK2 expression in IB4+ neurons may be the cause of the more hyperpolarized Ems of IB4+ than IB4− C-neurons (see earlier).
Goldman-Hodgkin-Katz calculation of theoretical TREK2 contribution to Em
The above section shows that TREK2 contributed ∼10 mV of normal Em in small (C-fiber) cultured IB4+ DRG neurons at 37°C. At first sight, this seems a much lower percentage of Em than suggested by the 69% of K+ standing current (that is largely responsible for Em) contributed by TREK2 (Kang and Kim, 2006) in neonatal rat DRG small neurons. We therefore used the GHK equation theoretically to predict the effect on Em of decreasing the K+ permeability by the 69% of Kang and Kim (2006). For this GHK calculation, we assumed the following relative permeabilities (P) of K+, Na+, and Cl− at resting Em: PK = 1; PNa = 0.05; PCl = 0.45. We chose the ion concentrations used in our in vitro recordings with a [Cl−]i = 31 mm (see Materials and Methods). In these conditions and at 37°C (310.14K), the GHK predicted resting Em is −54.6 mV, very close to the median resting Em (−54 mV) in our IB4+ cultured neurons without TREK2 knockdown (i.e., treated only with scr-FAM) (Fig. 3D, GHK predictions in dotted blue arrow). We then examined the effect of decreasing PK by the TREK2 contribution to the overall K+ leak current estimated by Kang and Kim (2006) (69%). That is, we recalculated Em assuming that PK, initially 1, decreased to 0.31. If other values were unchanged, the resulting Em from the GHK equation was −41.7 mV. This is slightly (3.3 mV) more depolarized than the median Em of −45 mV in cultured IB4+ small neurons after TREK2 knockdown by siRNA C (Fig. 3C, blue arrow by siRNA, D). The GHK predicted depolarization if TREK2 was removed was thus 13 mV, whereas that measured in vitro at ∼37°C after TREK2 knockdown (incomplete) was ∼10 mV. This GHK prediction is thus consistent with TREK2 contributing a substantial proportion of the standing current that causes the Em in adult rat DRG IB4+ neurons (this paper) as it does in TREK2+ rat neonatal neurons (Kang and Kim, 2006). In this case, solving the GHK equation using the Em value we recorded after TREK2 knockdown suggests that this treatment caused a 56% decrease in Pk. This should mean that TREK2 contributed ∼56% of the K+ standing current. However, our measured Em probably results from incomplete knockdown (also see Discussion). Our results (1) are therefore consistent with the suggested 69% contribution of TREK2 to Em standing current at 37°C Kang and Kim (2006) and (2) support our proposal that the ∼10 mV depolarization we observed in vitro is TREK2-dependent and is likely an underestimate of the full effect of TREK2.
Axotomized rat C-fiber neurons have depolarized Ems and decreased edge-TREK2
After L5 spinal nerve axotomy 7 d earlier, we made the unexpected observation that ipsilateral axotomized L5 C-fiber neurons in vivo were ∼10 mV depolarized compared with normal (nonaxotomized) C-fiber neurons (Fig. 4A). Interestingly, the edge-TREK2 in small neurons of ipsilateral axotomized L5 DRGs was reduced (highly significant; Fig. 4B–E), whereas that in the inner cytoplasm was significantly increased compared with normal. Figure 4D, E shows the pale regions (white double-headed arrows) at the cytoplasmic edge, with darker staining inner, perinuclear cytoplasm. This suggests a loss of edge-TREK2 compared with normal (Fig. 4C), with accumulation of TREK2 deeper in the cytoplasm. This seems likely to result in a loss of membrane-related TREK2. This is therefore a further example of depolarization in C-fiber neurons being associated with decreased edge-TREK2 and supports the view that edge-TREK2 levels probably reflect levels of functional TREK2 in the membrane.
Figure 4.

In small DRG neurons, peripheral axotomy decreased edge-TREK2 and depolarized Ems. A, Seven days after L5 spinal nerve axotomy, Ems of ipsilateral L5 C-fiber neurons in vivo were ∼10 mV more depolarized than normal (unpaired t test with Welch's correction, p = 0.034). *p < 0.05. B, Edge, mid, and inner (Fig. 2B, inset) cytoplasmic TREK2%intensities in normal (N) versus axotomized ipsilateral (Ax) L5 small (cross-sectional area <400 μm2) DRG neurons. Medians plus interquartile ranges are shown. For each region (edge, mid, inner), medians for N and Ax groups were compared (Mann–Whitney tests). After axotomy, compared with normal, edge-TREK2 decreased (p < 0.001) ipsilaterally and mid-TREK2 showed a small decrease ipsilaterally. In contrast, inner TREK2 increased ipsilaterally. *p < 0.05. ***p < 0.001. C, Edge-TREK2 is normally high. D, Ipsilaterally, edge-TREK2 was reduced substantially 7 d after axotomy. E, Higher-power (100× objective) enlargement of regions in white rectangles in D. Arrows indicate pale edge-TREK2 staining. Scale bars, 20 μm.
Why do axotomized rat C-neurons not show spontaneous firing (SF)?
Despite being depolarized (above), axotomized L5 C-fiber DRG neurons do not show SF after 6–7 d (Michaelis et al., 2000; Djouhri et al., 2012), unless fiber regeneration is possible, as previously discussed (Djouhri et al., 2012). The Na+ channels Nav1.8 and Nav1.7 together constitute the main excitatory machinery in these nociceptors (see Discussion). Interestingly, after axotomy, small DRG neurons show decreased Nav1.8 (mRNA and protein) and TTX-resistant Na+ current (Cummins and Waxman, 1997; Dib-Hajj et al., 1998; Sleeper et al., 2000; Decosterd et al., 2002) and decreased Nav1.7 mRNA (Kim et al., 2002). We therefore examined whether 7 d after axotomy these channels were downregulated in small TREK2+ neurons because this could account for the lack of C-fiber neuron SF.
There was substantially reduced immunoreactivity for both Nav1.8 (Fig. 5A,B) and Nav1.7 (Fig. 5C) ipsilaterally in small TREK2+ L5 neurons 7 d after L5 spinal nerve axotomy, which all (as in Fig. 4) show very low TREK2 at their cytoplasmic edges.
Figure 5.

Axotomy 7 d earlier decreased Nav1.8 and Nav1.7 as well as TREK2 expression. A, Blinded subjective scoring (0 = no visible staining; 7 = maximum staining intensity) of whole cytoplasmic Nav1.8 immunointensities in L5 DRG sections from 4 normal (N) and 4 axotomized rats ipsilaterally (Ax). Medians plus interquartile ranges are shown. The median decreased significantly after axotomy (Mann–Whitney test). **p < 0.01. B, Nav1.8 (red) in TREK2+ neurons (blue): double immunofluorescence of L5 DRG sections. Left, Normal untreated. Right, After L5 spinal nerve axotomy 7 d earlier. Images are illustrative of results in the 4 rats per group. In merged images (bottom), coexpression shows as purple/mauve. Nav1.8 and TREK2 are normally colocalized, but Nav1.8 was markedly decreased in TREK2+ neurons as well as medium- and large-size neurons after axotomy. White dashed lines indicate neuronal outlines after axotomy because these are hard to detect due to decreased edge-TREK2 and decreased Nav1.8 in TREK2+ neurons. Scale bar, 20 μm. C, Nav1.7 (red) in TREK2+ (blue) neurons. Images are illustrative of similar results from 4 normal and 4 axotomized rats. Left, Normal untreated. Right, One week after ipsilateral L5 spinal nerve axotomy. Both antibodies were raised in rabbit. Immunostainings for TREK2 and Nav1.7 were thus in adjacent sections. Both sections were double-labeled with IB4 (green), and numbers are to aid alignment of neurons between sections. Normally, Nav1.7 expression was high in TREK2+ neurons (e.g., 1, 2, and 4) but was not limited to these neurons (e.g., 3). After axotomy, compared with normal, Nav1.7 immunostaining was substantially reduced in small TREK2+ neurons (4–6); TREK2 is retracted from the neuron edge; 1 is a large neuron, negative for all these stains. As in B, neuronal outlines are indicated with white dashed lines. Scale bar, 20 μm.
On the basis of all the above findings, we next hypothesized that TREK2 in conducting C-nociceptors would, by keeping their Ems hyperpolarized, limit the SF during inflammation or after partial nerve injury (Djouhri et al., 2006).
Role of TREK2 in spontaneous pain behavior
SF and Em in neuropathic pain models
To test this hypothesis, we first examined whether C-neuron SF rate is related to Em in some pathological pain models that give rise to C-neuron SF. We used two related rat models of neuropathic pain: the SNA and mSNA models (see Materials and Methods). We chose these models because the conducting L4 C-nociceptors exhibited a wider range of SF rates than C-nociceptors conducting from CFA-inflamed skin (Djouhri et al., 2006; Djouhri et al., 2012), and this wider range should increase the likelihood of detecting any relation between SF firing rates and Em.
In the conducting L4, C-nociceptors in SNA and mSNA rats that showed SF, the firing rates were negatively and linearly related to their Ems (Fig. 6A). That is, higher rates of SF occurred in neurons with more depolarized Ems. However, in both models, those conducting C-nociceptors with no SF (firing rate equals 0, blue symbols) showed a wide range of Ems. Approximately 30% of the neurons in SNA and mSNA showed SF as previously described (Djouhri et al., 2006, 2012). Thus, regardless of Em, many C-nociceptors do not show SF, but in the group with SF the firing rate was correlated with Em.
Figure 6.
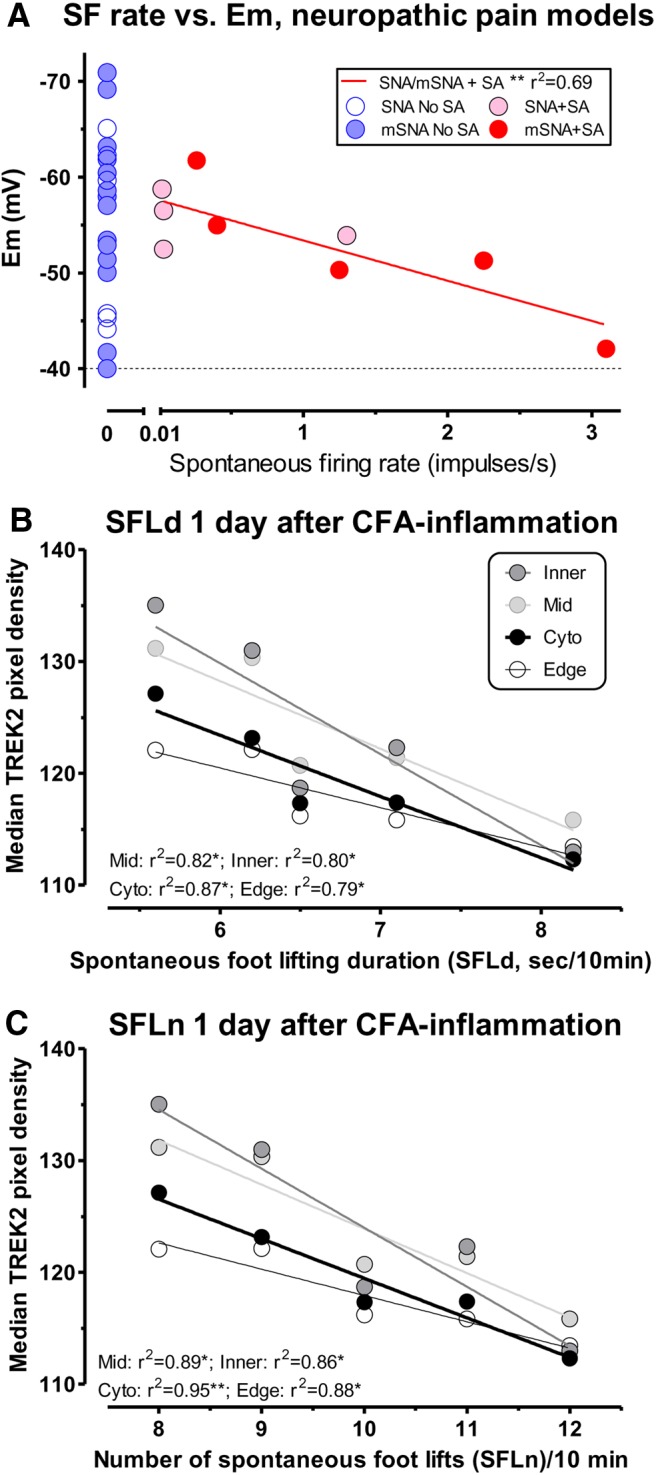
A, SF rate was related to Em in C-neurons in neuropathic pain models. SF rate in intact L4 C-nociceptors was significantly linearly correlated with Em 7 d after SNA and mSNA surgery (see Materials and Methods and Results). B, C, SFL 1 d after CFA was related to ipsilateral TREK2 levels. In ipsilateral L5 DRG small neurons in 5 rats 1 d after CFA-induced cutaneous inflammation, there were significant linear correlations of (B) SFLd and (C) number of SFLn with median ipsilateral L5 small DRG neuron TREK2 pixel densities for each rat, whether in entire cytoplasm, or edge, mid, or inner cytoplasmic regions. Thus, SFL after CFA in individual rats was related to ipsilateral TREK2 levels in small DRG neurons.
Spontaneous pain behavior and TREK2 after CFA-induced skin inflammation
The next question we addressed was whether the extent of the spontaneous pain behavior (spontaneous foot lifting, SFL) was related to ipsilateral DRG neuron TREK2 levels (immunoreactivity) in a pain model.
SFL during inflammation is related to TREK2 expression
We used the CFA model for the following reasons. Although C-nociceptors with SF in SNA, mSNA, and CFA models are “inflamed” (i.e., subject to inflammatory influences) (Wu et al., 2001; Watkins and Maier, 2002; Djouhri et al., 2006, 2012), the CFA model is simpler to study immunocytochemically because most or all L5 neurons are “inflamed.” In contrast, in the nerve injury models, although ipsilateral L4 DRG neurons mostly have intact/conducting fibers subject to neuroinflammation, ∼20–40% have axotomized/damaged fibers (Djouhri et al., 2006). Histological studies of their ipsilateral L4 DRG neurons are thus hard to interpret because phenotypic changes in axotomized and “inflamed” neurons differ markedly, often going in opposite directions (Djouhri et al., 2012).
CFA-induced SFL: effect of natural variation in TREK2 levels
Interestingly, 1 d after CFA, the rats with greater ipsilateral SFL had lower TREK2 immunostaining. Both the SFLd (Fig. 6B) and the SFLn (Fig. 6C) were significantly linearly, but inversely, correlated with the median TREK2 pixel densities of small neurons of the ipsilateral L5 DRGs. This was the case for measures of whole cytoplasmic, and of edge-, mid-, or inner-TREK2 pixel densities.
All the above findings together suggest that, by maintaining a hyperpolarized Em, and limiting spontaneous C-nociceptor firing, TREK2 may limit spontaneous pain. We therefore hypothesized that reducing the expression of TREK2 in vivo should result in increased spontaneous pain behavior.
CFA-induced SFL: effect of in vivo TREK2 knockdown
Because there are no selective pharmacological agents for TREK2, we used siRNA to knock down TREK2 in vivo to test this hypothesis directly. We used the highly selective siRNA C, as earlier (see Materials and Methods).
The siRNA treatment knocked TREK2 down effectively as shown by the following: (1) a consistent reduction in the lower band (MW ∼55 kDa) in Western blots of skin tissue (examined in 9 rats; 4 rats shown, see Materials and Methods) (Fig. 7A) after siRNA treatment (Rats 3 and 4), not after scr (Rats 1 and 2). This lower band is of similar MW to the one we found from purified cultures of DRG neurons. The upper band may correspond to a TREK2 isoform expressed by non-neuronal cells (Simkin et al., 2008; Mirkovic and Wickman, 2011); it was not reduced by the siRNA treatment. (2) Decreased TREK2 immunostaining in IB4+ cutaneous nerve fibers and in epidermal keratinocytes after TREK2 siRNA, not scr treatment (Fig. 7B). (3) Decreased TREK2 (red) in IB4+ (green) nerve fibers after TREK2 siRNA in the proximal portion of the nerve branch innervating ipsilateral plantar skin (5–10 mm from the injection site). In contrast, after scr treatment only, IB4+ (green) fibers clearly express TREK2 (red). This decrease after siRNA occurred regardless of whether they had saline or CFA treatment (Fig. 7C). Thus, importantly, regardless of the site of expression for TREK2 (neuronal somata and/or fibers), at this time, the immunocytochemical levels of TREK2 in the nerve fibers innervating the injected region were demonstrably reduced. This also proves that siRNA was transported along the fibers, something we confirmed using scr-FAM (data not shown).
TREK2 knockdown increased CFA-induced SFL
CFA injection caused increased SFLd (Fig. 7D) and SFLn (Fig. 7E), whether preceded by scr siRNA (p < 0.01) or by TREK2 siRNA C injection (p < 0.001). After TREK2 siRNA knockdown, this CFA-induced SFL was significantly greater than after scr treatment, by more than twofold.
The knockdown seen in the epidermal keratinocytes (and any knockdown that occurs in other non-neuronal cells local to the injection site) could potentially have contributed to the increased SFL in response to CFA if something released from these local cells triggers firing in fibers of IB4+ C-neurons. However, taken with the observations that (1) naturally occurring lower TREK2 levels in these C-neurons were associated with higher SFL (Fig. 6B,C) and that (2) TREK2 immunoreactivity after siRNA was substantially decreased in the nerve fibers (Fig. 7C), the logic points to an important contribution to the increase in SFL being from lower TREK2 in the sensory neurons, whether occurring naturally or due to knockdown.
Discussion
We provide evidence that (1) TREK2 has a hyperpolarizing influence on Ems of C-nociceptors of ≥10 mV, (2) C-nociceptor SFrates are limited by hyperpolarization, and (3) TREK2 limits inflammation-induced spontaneous pain behavior.
TREK2 expression across species
The highly conserved K2P channel sequences from Drosophila melanogaster (Goldstein et al., 1996), Aplysia californica (Jezzini and Moroz, 2004), and zebrafish (Gierten et al., 2012) to mammals (Bayliss and Barrett, 2008) suggests widely conserved function. TREK2 presence in small DRG neurons in rat, guinea pig and cat, suggests that TREK2 may perform key functions in C-nociceptors in diverse species.
The high percentage of rat C-nociceptors expressing TREK2 (64–86%) suggests widespread TREK2 influence on these neurons. It is consistent with >70% being IB4+ (Fang et al., 2006) given the high TREK2/IB4 colocalization (seen also in guinea pig). Although control mechanism(s) of TREK2 expression are unknown, the correlation between IB4 and TREK2 %intensities implicates similar influences (e.g., trophic factors) on both.
Relation of Em to edge-TREK2
The correlation of neuronal soma Em with edge-TREK2 (but not mid-TREK2) and the depolarization of C-fiber neuronal somata with decreased edge-TREK2 after axotomy together suggest that Em depends on functional membrane-related TREK2 levels and that this functional TREK2 is related to edge-TREK2.
Extent of Em dependence on TREK2
Several experiments suggest that the TREK2-dependent component of Em in DRG C-neurons is at least 10 mV. These include the following: (1) comparison of Ems of IB4+ (i.e., TREK2+) with IB4− (i.e.TREK2−) C-nociceptors both in vitro at room temperature (Choi et al., 2007) and in vivo at >30°C (Fang et al., 2006); (2) depolarization of C-neurons in vivo (>30°C) associated with decreased edge-TREK2 after axotomy; (3) correlation of Em in C-nociceptors with edge-TREK2 %intensities; and (4) depolarization of IB4+ neurons in vitro at 30°C by incomplete TREK2 knockdown. These may all underestimate the extent of the TREK2-dependent Em due to either (1) temperature: TREK2 is more active at 37°C than at lower temperatures (Kang et al., 2005); or (2) TREK2 being incompletely lost, e.g., after axotomy or with incomplete siRNA knockdown or both (1) and (2). We conclude that TREK2 is responsible for at least a 10 mV hyperpolarization in IB4+ C-nociceptors, probably more at 37°C.
If TREK2 siRNA had off-target effects on other ion channels, they could either result in an underestimation or overestimation of the TREK2 dependence of Em. However, such off-target effects are unlikely because of the extremely high selectivity of the siRNA we used, and our conclusion rests on a variety of results (see above) not solely on siRNA knockdown.
Simple GHK modeling of effects of partial TREK2 knockdown on Em suggests that ∼56% of the Em-related K+ permeability in IB4+ DRG neurons in vitro was TREK2-dependent. Although this value is likely underestimated (incomplete knockdown and temperature), it is very close to the 69% described by Kang and Kim (2006) for neonatal DRG neurons.
If at least 10 mV of Em is TREK2-dependent, what ion channels might contribute to the residual ∼40 mV? This is speculative because expression/activity of other potential Em-contributing channels in IB4+ neurons is unknown. The first is TREK2, which may well contribute >10 mV (above). Other candidates are other K2Ps (TRESK is in all sizes of DRG neurons) (Dobler et al., 2007; Yoo et al., 2009), Cl− channels (Mayer, 1985), and voltage-dependent K+ currents (such as Kv7.2/7.5 or KATP). The last group were reported to contribute very little (<1.3%) normally to the resting K+-standing current at 37°C (Kang and Kim, 2006), although their contribution would increase with greater depolarization.
Published studies, including ours, exclude DRG neurons with Ems of −40 mV or more positive, to avoid values influenced by electrode-penetration damage. However, the correlation of stable Em with edge-TREK2 over the Em range of −30 to −55 mV suggests that some C-neurons may normally be more depolarized than −40 mV because of low edge-TREK2 levels.
Likely effects of TREK2 on DRG neuronal membrane properties
The K+ permeability resulting from open TREK2 channels (Noel et al., 2011) causes hyperpolarization and decreased membrane resistance., which should stabilize the membrane against depolarizing influences. This could explain why IB4+ (thus TREK2+) compared with IB4− C-neurons are significantly more hyperpolarized (Fang et al., 2006; Choi et al., 2007) and also have greater current thresholds for activation (Choi et al., 2007). TREK2 may therefore contribute to the high thresholds of IB4+ C-nociceptors and thus be central to their nociceptive phenotype.
The TTX-resistant Nav1.8 channel is not inactivated by persistent depolarization (unlike the TTX-sensitive Navs); in contrast, it can be activated when threshold is reached (∼−35 mV) and supports repetitive firing at depolarized Ems (Akopian et al., 1996). Nav1.8 is highly expressed in most C-nociceptors in rat DRGs (Djouhri et al., 2003) and carries the majority of their action potential inward current (Renganathan et al., 2001; Blair and Bean, 2002). Active TREK2 is thus likely to be very important in C-nociceptors, because by keeping Em ≥10 mV further from the Nav1.8 threshold, it would decrease the likelihood of firing and the consequent pain.
Lack of spontaneous firing after axotomy
Although depolarization normally increases the likelihood of C-nociceptor firing (see above), depolarization after axotomy is not associated with SF if regeneration has been prevented (see Materials and Methods). This can be explained as follows: Nav1.7 is important for impulse generation (Herzog et al., 2003), and Nav1.8 for the action potential inward current (see above); thus, they are the major excitatory machinery in C-nociceptors. The substantially decreased Nav1.8/Nav1.7 immunoreactivities in small TREK2+ neurons could therefore account for the absence of SF in axotomized C-neurons, despite their decreased TREK2 and depolarization.
Significance of decreased edge-TREK2 after axotomy
The decreased edge-TREK2 in small (nociceptive) DRG neurons after axotomy probably results in decreased membrane TREK2, decreased K+ leakage, and thus reduced energy consumption by the Na+K+-ATPase. This would be energetically efficient in a membrane that is unlikely to fire, even though it is depolarized.
After axotomy, the reduced edge-TREK2 and increased inner-TREK2 indicate altered TREK2 trafficking; this may relate to decreased peripherally derived trophic factor(s).
TREK2 and pathological SFrate in C-fiber nociceptors
Although we published the correlation between the extent of spontaneous pain behavior and SFrate in conducting L4 C-nociceptors in SNA, mSNA, and CFA models in 2006 (Djouhri et al., 2006), subsequent progress in understanding influences on SFrate has been slow. This is because of technical difficulties of recording intracellularly in C-nociceptors in vivo for long enough to determine SFrates. However, our present findings that in neuropathic pain models their SFrates are influenced by Em, which in turn is controlled by TREK2, contribute substantially to this understanding. Furthermore, the greater SFL in rats with lower TREK2 (whether lower in small DRG neurons by chance, or after TREK2 knockdown by siRNA) suggests that spontaneous pain is limited by endogenous TREK2 levels/activity. All the above point to an intrinsic protective role of TREK2 against ongoing, spontaneous, pain. Because of the close correlation between SFL and SF (above), this increased SFL is indirect evidence, consistent with our other evidence, that TREK2 limits pathological SFrate in C-nociceptors. Because TREK2 is activated by thermal and mechanical stimulation (Kang et al., 2005, 2007), it may limit responses of IB4+ neurons to these stimuli (Pan et al., 2003; Alvarez et al., 2012; Ye et al., 2012). Interestingly, visceral inflammation decreases TREK2/TREK1 mRNA expression in DRG neurons, which may contribute to their increased mechanosensitivity (La and Gebhart, 2011; La et al., 2011).
Increased synaptic strength leading to central sensitization could result from increased activity in afferent C-fibers, probably because of their increased excitability and/or depolarization arising from “multiple causes” (Sandkühler and Gruber-Schoffnegger, 2012). It would be interesting to determine whether TREK2-induced hyperpolarization and limitation of SFrate in C-nociceptors may limit central sensitization and, if so, whether this may also limit evoked pain.
Soma versus fiber
Our finding that pathological C-nociceptor SFrates are related to soma Em, despite the SF being initiated in the fibers (Djouhri et al., 2012), suggests that Ems in fiber and soma are related. It s not known whether their values are the same because Ems in C-fibers and their nerve endings have not been determined.
In conclusion, this is the first demonstration of a role for TREK2 (or any K2P channel) in contributing to Em in a functionally identified subset of DRG sensory neurons. This subset includes most C-fiber nociceptors, including most IB4+ neurons. Their Em relates to edge-TREK2 levels (probably indicative of membrane-related TREK2). At least 10 mV of their soma Em is TREK2-dependent. After peripheral axotomy, C-neuron edge-TREK2 expression decreases, with associated depolarization, but no associated SF, probably due to massive downregulation of Nav1.8 and Nav1.7, making these fibers hypoexcitable. In neuropathic pain models, SFrate in conducting C-nociceptors is faster in more depolarized neurons. TREK2 knockdown (1) depolarizes IB4+ neuron Ems in vitro and (2) increases spontaneous pain behavior in vivo. Both (1) and (2) are supported by other data not involving TREK2 knockdown. Finally, the innate protection against ongoing spontaneous pain provided by endogenous TREK2 expression in C-nociceptors may offer a novel therapeutic approach for pathological pain treatment, by enhancing TREK2 expression/activity. In addition, novel pathological pain therapies should preserve this important endogenous protective mechanism.
Footnotes
This work was supported by The Wellcome Trust United Kingdom (to S.N.L.). We thank T.J. Biscoe and E.R. Perl for useful discussions.
The authors declare no competing financial interests.
This is an Open Access article distributed under the terms of the Creative Commons Attribution License (http://creativecommons.org/licenses/by/3.0), which permits unrestricted use, distribution and reproduction in any medium provided that the original work is properly attributed.
References
- Acosta C, Davies A. Bacterial lipopolysaccharide regulates nociceptin expression in sensory neurons. J Neurosci Res. 2008;86:1077–1086. doi: 10.1002/jnr.21565. [DOI] [PubMed] [Google Scholar]
- Acosta C, McMullan S, Djouhri L, Gao L, Watkins R, Berry C, Dempsey K, Lawson SN. HCN1 and HCN2 in rat DRG neurons: levels in nociceptors and non nociceptors, NT3 dependence and influence of CFA-induced skin inflammation on HCN2 and NT3 expression. PLoS One. 2012;7:e50442. doi: 10.1371/journal.pone.0050442. [DOI] [PMC free article] [PubMed] [Google Scholar]
- Akopian AN, Sivilotti L, Wood JN. A tetrodotoxin-resistant voltage-gated sodium channel expressed by sensory neurons. Nature. 1996;379:257–262. doi: 10.1038/379257a0. [DOI] [PubMed] [Google Scholar]
- Alvarez P, Gear RW, Green PG, Levine JD. IB4-saporin attenuates acute and eliminates chronic muscle pain in the rat. Exp Neurol. 2012;233:859–865. doi: 10.1016/j.expneurol.2011.12.019. [DOI] [PMC free article] [PubMed] [Google Scholar]
- Alvarez-Leefmans FJ, Gamiño SM, Giraldez F, Noguerón I. Intracellular chloride regulation in amphibian dorsal root ganglion neurones studied with ion-selective microelectrodes. J Physiol. 1988;406:225–246. doi: 10.1113/jphysiol.1988.sp017378. [DOI] [PMC free article] [PubMed] [Google Scholar]
- Asante CO, Wallace VC, Dickenson AH. Formalin-induced behavioural hypersensitivity and neuronal hyperexcitability are mediated by rapid protein synthesis at the spinal level. Mol Pain. 2009;5:27. doi: 10.1186/1744-8069-5-27. [DOI] [PMC free article] [PubMed] [Google Scholar]
- Backonja MM. Defining neuropathic pain. Anesth Analg. 2003;97:785–790. doi: 10.1213/01.ANE.0000062826.70846.8D. [DOI] [PubMed] [Google Scholar]
- Baron R. Neuropathic pain: a clinical perspective. Handb Exp Pharmacol. 2009:3–30. doi: 10.1007/978-3-540-79090-7_1. [DOI] [PubMed] [Google Scholar]
- Bayliss DA, Barrett PQ. Emerging roles for two-pore-domain potassium channels and their potential therapeutic impact. Trends Pharmacol Sci. 2008;29:566–575. doi: 10.1016/j.tips.2008.07.013. [DOI] [PMC free article] [PubMed] [Google Scholar]
- Black JA, Nikolajsen L, Kroner K, Jensen TS, Waxman SG. Multiple sodium channel isoforms and mitogen-activated protein kinases are present in painful human neuromas. Ann Neurol. 2008;64:644–653. doi: 10.1002/ana.21527. [DOI] [PubMed] [Google Scholar]
- Blair NT, Bean BP. Roles of tetrodotoxin (TTX)-sensitive Na+ current, TTX-resistant Na+ current, and Ca2+ current in the action potentials of nociceptive sensory neurons. J Neurosci. 2002;22:10277–10290. doi: 10.1523/JNEUROSCI.22-23-10277.2002. [DOI] [PMC free article] [PubMed] [Google Scholar]
- Bonnet ME, Erbacher P, Bolcato-Bellemin AL. Systemic delivery of DNA or siRNA mediated by linear polyethylenimine (L-PEI) does not induce an inflammatory response. Pharm Res. 2008;25:2972–2982. doi: 10.1007/s11095-008-9693-1. [DOI] [PubMed] [Google Scholar]
- Braz JM, Nassar MA, Wood JN, Basbaum AI. Parallel “pain” pathways arise from subpopulations of primary afferent nociceptor. Neuron. 2005;47:787–793. doi: 10.1016/j.neuron.2005.08.015. [DOI] [PubMed] [Google Scholar]
- Choi JS, Dib-Hajj SD, Waxman SG. Differential slow inactivation and use-dependent inhibition of Nav1.8 channels contribute to distinct firing properties in IB4+ and IB4− DRG neurons. J Neurophysiol. 2007;97:1258–1265. doi: 10.1152/jn.01033.2006. [DOI] [PubMed] [Google Scholar]
- Costa PF, Emilio MG, Fernandes PL, Ferreira HG, Ferreira KG. Determination of ionic permeability coefficients of the plasma membrane of Xenopus laevis oocytes under voltage clamp. J Physiol. 1989;413:199–211. doi: 10.1113/jphysiol.1989.sp017649. [DOI] [PMC free article] [PubMed] [Google Scholar]
- Cummins TR, Waxman SG. Downregulation of tetrodotoxin-resistant sodium currents and upregulation of a rapidly repriming tetrodotoxin-sensitive sodium current in small spinal sensory neurons after nerve injury. J Neurosci. 1997;17:3503–3514. doi: 10.1523/JNEUROSCI.17-10-03503.1997. [DOI] [PMC free article] [PubMed] [Google Scholar]
- Cummins TR, Dib-Hajj SD, Black JA, Akopian AN, Wood JN, Waxman SG. A novel persistent tetrodotoxin-resistant sodium current in SNS-null and wild-type small primary sensory neurons. J Neurosci. 1999;19:RC43. doi: 10.1523/JNEUROSCI.19-24-j0001.1999. [DOI] [PMC free article] [PubMed] [Google Scholar]
- Decosterd I, Ji RR, Abdi S, Tate S, Woolf CJ. The pattern of expression of the voltage-gated sodium channels Na(v)1.8 and Na(v)1.9 does not change in uninjured primary sensory neurons in experimental neuropathic pain models. Pain. 2002;96:269–277. doi: 10.1016/S0304-3959(01)00456-0. [DOI] [PubMed] [Google Scholar]
- Dib-Hajj SD, Black JA, Cummins TR, Kenney AM, Kocsis JD, Waxman SG. Rescue of alpha-SNS sodium channel expression in small dorsal root ganglion neurons after axotomy by nerve growth factor in vivo. J Neurophysiol. 1998;79:2668–2676. doi: 10.1152/jn.1998.79.5.2668. [DOI] [PubMed] [Google Scholar]
- Djouhri L, Lawson SN. Abeta-fiber nociceptive primary afferent neurons: a review of incidence and properties in relation to other afferent A-fiber neurons in mammals. Brain Res Brain Res Rev. 2004;46:131–145. doi: 10.1016/j.brainresrev.2004.07.015. [DOI] [PubMed] [Google Scholar]
- Djouhri L, Fang X, Okuse K, Wood JN, Berry CM, Lawson SN. The TTX-resistant sodium channel Nav1.8 (SNS/PN3): expression and correlation with membrane properties in rat nociceptive primary afferent neurons. J Physiol. 2003;550:739–752. doi: 10.1113/jphysiol.2003.042127. [DOI] [PMC free article] [PubMed] [Google Scholar]
- Djouhri L, Koutsikou S, Fang X, McMullan S, Lawson SN. Spontaneous pain, both neuropathic and inflammatory, is related to frequency of spontaneous firing in intact C-fiber nociceptors. J Neurosci. 2006;26:1281–1292. doi: 10.1523/JNEUROSCI.3388-05.2006. [DOI] [PMC free article] [PubMed] [Google Scholar]
- Djouhri L, Fang X, Koutsikou S, Lawson SN. Partial nerve injury induces electrophysiological changes in conducting (uninjured) nociceptive and nonnociceptive DRG neurons: possible relationships to aspects of peripheral neuropathic pain and paresthesias. Pain. 2012;153:1824–1836. doi: 10.1016/j.pain.2012.04.019. [DOI] [PMC free article] [PubMed] [Google Scholar]
- Dobler T, Springauf A, Tovornik S, Weber M, Schmitt A, Sedlmeier R, Wischmeyer E, Döring F. TRESK two-pore-domain K+ channels constitute a significant component of background potassium currents in murine dorsal root ganglion neurones. J Physiol. 2007;585:867–879. doi: 10.1113/jphysiol.2007.145649. [DOI] [PMC free article] [PubMed] [Google Scholar]
- Enyedi P, Czirják G. Molecular background of leak K+ currents: two-pore domain potassium channels. Physiol Rev. 2010;90:559–605. doi: 10.1152/physrev.00029.2009. [DOI] [PubMed] [Google Scholar]
- Fang X, Djouhri L, Black JA, Dib-Hajj SD, Waxman SG, Lawson SN. The presence and role of the tetrodotoxin-resistant sodium channel Na(v)1.9 (NaN) in nociceptive primary afferent neurons. J Neurosci. 2002;22:7425–7433. doi: 10.1523/JNEUROSCI.22-17-07425.2002. [DOI] [PMC free article] [PubMed] [Google Scholar]
- Fang X, Djouhri L, McMullan S, Berry C, Okuse K, Waxman SG, Lawson SN. trkA is expressed in nociceptive neurons and influences electrophysiological properties via Nav1.8 expression in rapidly conducting nociceptors. J Neurosci. 2005a;25:4868–4878. doi: 10.1523/JNEUROSCI.0249-05.2005. [DOI] [PMC free article] [PubMed] [Google Scholar]
- Fang X, McMullan S, Lawson SN, Djouhri L. Electrophysiological differences between nociceptive and non-nociceptive dorsal root ganglion neurones in the rat in vivo. J Physiol. 2005b;565:927–943. doi: 10.1113/jphysiol.2005.086199. [DOI] [PMC free article] [PubMed] [Google Scholar]
- Fang X, Djouhri L, McMullan S, Berry C, Waxman SG, Okuse K, Lawson SN. Intense isolectin-B4 binding in rat dorsal root ganglion neurons distinguishes C-fiber nociceptors with broad action potentials and high Nav1.9 expression. J Neurosci. 2006;26:7281–7292. doi: 10.1523/JNEUROSCI.1072-06.2006. [DOI] [PMC free article] [PubMed] [Google Scholar]
- Gierten J, Hassel D, Schweizer PA, Becker R, Katus HA, Thomas D. Identification and functional characterization of zebrafish K(2P)10.1 (TREK2) two-pore-domain K(+) channels. Biochim Biophys Acta. 2012;1818:33–41. doi: 10.1016/j.bbamem.2011.09.015. [DOI] [PubMed] [Google Scholar]
- Goldstein SA, Price LA, Rosenthal DN, Pausch MH. ORK1, a potassium-selective leak channel with two pore domains cloned from Drosophila melanogaster by expression in Saccharomyces cerevisiae. Proc Natl Acad Sci U S A. 1996;93:13256–13261. doi: 10.1073/pnas.93.23.13256. [DOI] [PMC free article] [PubMed] [Google Scholar]
- Herzog RI, Cummins TR, Ghassemi F, Dib-Hajj SD, Waxman SG. Distinct repriming and closed-state inactivation kinetics of Nav1.6 and Nav1.7 sodium channels in mouse spinal sensory neurons. J Physiol. 2003;551:741–750. doi: 10.1113/jphysiol.2003.047357. [DOI] [PMC free article] [PubMed] [Google Scholar]
- Jezzini SH, Moroz LL. Identification and distribution of a two-pore domain potassium channel in the CNS of Aplysia californica. Brain Res Mol Brain Res. 2004;127:27–38. doi: 10.1016/j.molbrainres.2004.05.007. [DOI] [PubMed] [Google Scholar]
- Kang D, Kim D. TREK-2 (K2P10.1) and TRESK (K2P18.1) are major background K+ channels in dorsal root ganglion neurons. Am J Physiol Cell Physiol. 2006;291:C138–C146. doi: 10.1152/ajpcell.00629.2005. [DOI] [PubMed] [Google Scholar]
- Kang D, Choe C, Kim D. Thermosensitivity of the two-pore domain K+ channels TREK-2 and TRAAK. J Physiol. 2005;564:103–116. doi: 10.1113/jphysiol.2004.081059. [DOI] [PMC free article] [PubMed] [Google Scholar]
- Kang D, Choe C, Cavanaugh E, Kim D. Properties of single two-pore domain TREK-2 channels expressed in mammalian cells. J Physiol. 2007;583:57–69. doi: 10.1113/jphysiol.2007.136150. [DOI] [PMC free article] [PubMed] [Google Scholar]
- Kawano T, Zoga V, McCallum JB, Wu HE, Gemes G, Liang MY, Abram S, Kwok WM, Hogan QH, Sarantopoulos CD. ATP-sensitive potassium currents in rat primary afferent neurons: biophysical, pharmacological properties, and alterations by painful nerve injury. Neuroscience. 2009;162:431–443. doi: 10.1016/j.neuroscience.2009.04.076. [DOI] [PubMed] [Google Scholar]
- Kim CH, Oh Y, Chung JM, Chung K. Changes in three subtypes of tetrodotoxin sensitive sodium channel expression in the axotomized dorsal root ganglion in the rat. Neurosci Lett. 2002;323:125–128. doi: 10.1016/S0304-3940(02)00127-1. [DOI] [PubMed] [Google Scholar]
- Kitchener PD, Wilson P, Snow PJ. Selective labelling of primary sensory afferent terminals in lamina II of the dorsal horn by injection of Bandeiraea simplicifolia isolectin B4 into peripheral nerves. Neuroscience. 1993;54:545–551. doi: 10.1016/0306-4522(93)90274-J. [DOI] [PubMed] [Google Scholar]
- Kleggetveit IP, Namer B, Schmidt R, Helås T, Rückel M, Ørstavik K, Schmelz M, Jørum E. High spontaneous activity of C nociceptors in painful polyneuropathy. Pain. 2012;153:2040–2047. doi: 10.1016/j.pain.2012.05.017. [DOI] [PubMed] [Google Scholar]
- La JH, Gebhart GF. Colitis decreases mechanosensitive K2P channel expression and function in mouse colon sensory neurons. Am J Physiol Gastrointest Liver Physiol. 2011;301:G165–G174. doi: 10.1152/ajpgi.00417.2010. [DOI] [PMC free article] [PubMed] [Google Scholar]
- La JH, Schwartz ES, Gebhart GF. Differences in the expression of transient receptor potential channel V1, transient receptor potential channel A1 and mechanosensitive two pore-domain K+ channels between the lumbar splanchnic and pelvic nerve innervations of mouse urinary bladder and colon. Neuroscience. 2011;186:179–187. doi: 10.1016/j.neuroscience.2011.04.049. [DOI] [PMC free article] [PubMed] [Google Scholar]
- Lawson SN, Waddell PJ. Soma neurofilament immunoreactivity is related to cell size and fibre conduction velocity in rat primary sensory neurons. J Physiol. 1991;435:41–63. doi: 10.1113/jphysiol.1991.sp018497. [DOI] [PMC free article] [PubMed] [Google Scholar]
- Lawson SN, Harper AA, Harper EI, Garson JA, Anderton BH. A monoclonal antibody against neurofilament protein specifically labels a subpopulation of rat sensory neurones. J Comp Neurol. 1984;228:263–272. doi: 10.1002/cne.902280211. [DOI] [PubMed] [Google Scholar]
- Lawson SN, Crepps BA, Perl ER. Relationship of substance P to afferent characteristics of dorsal root ganglion neurones in guinea-pig. J Physiol. 1997;505:177–191. doi: 10.1111/j.1469-7793.1997.00177.x. [DOI] [PMC free article] [PubMed] [Google Scholar]
- Lin W, Burks CA, Hansen DR, Kinnamon SC, Gilbertson TA. Taste receptor cells express pH-sensitive leak K+ channels. J Neurophysiol. 2004;92:2909–2919. doi: 10.1152/jn.01198.2003. [DOI] [PubMed] [Google Scholar]
- Marsh B, Acosta C, Djouhri L, Lawson SN. Leak K(+) channel mRNAs in dorsal root ganglia: relation to inflammation and spontaneous pain behaviour. Mol Cell Neurosci. 2012;49:375–386. doi: 10.1016/j.mcn.2012.01.002. [DOI] [PMC free article] [PubMed] [Google Scholar]
- Mathie A, Rees KA, El Hachmane MF, Veale EL. Trafficking of neuronal two pore domain potassium channels. Curr Neuropharmacol. 2010;8:276–286. doi: 10.2174/157015910792246146. [DOI] [PMC free article] [PubMed] [Google Scholar]
- Mayer ML. A calcium-activated chloride current generates the after-depolarization of rat sensory neurones in culture. J Physiol. 1985;364:217–239. doi: 10.1113/jphysiol.1985.sp015740. [DOI] [PMC free article] [PubMed] [Google Scholar]
- Michaelis M, Liu X, Jänig W. Axotomized and intact muscle afferents but no skin afferents develop ongoing discharges of dorsal root ganglion origin after peripheral nerve lesion. J Neurosci. 2000;20:2742–2748. doi: 10.1523/JNEUROSCI.20-07-02742.2000. [DOI] [PMC free article] [PubMed] [Google Scholar]
- Mirkovic K, Wickman K. Identification and characterization of alternative splice variants of the mouse Trek2/Kcnk10 gene. Neuroscience. 2011;194:11–18. doi: 10.1016/j.neuroscience.2011.07.064. [DOI] [PMC free article] [PubMed] [Google Scholar]
- Murase D, Hachiya A, Amano Y, Ohuchi A, Kitahara T, Takema Y. The essential role of p53 in hyperpigmentation of the skin via regulation of paracrine melanogenic cytokine receptor signaling. J Biol Chem. 2009;284:4343–4353. doi: 10.1074/jbc.M805570200. [DOI] [PubMed] [Google Scholar]
- Noel J, Sandoz G, Lesage F. Molecular regulations governing TREK and TRAAK channel functions. Channels (Austin) 2011;5:402–409. doi: 10.4161/chan.5.5.16469. [DOI] [PMC free article] [PubMed] [Google Scholar]
- O'Brien BJ, Caldwell JH, Ehring GR, Bumsted O'Brien KM, Luo S, Levinson SR. Tetrodotoxin-resistant voltage-gated sodium channels Na(v)1.8 and Na(v)1.9 are expressed in the retina. J Comp Neurol. 2008;508:940–951. doi: 10.1002/cne.21701. [DOI] [PubMed] [Google Scholar]
- Pan HL, Khan GM, Alloway KD, Chen SR. Resiniferatoxin induces paradoxical changes in thermal and mechanical sensitivities in rats: mechanism of action. J Neurosci. 2003;23:2911–2919. doi: 10.1523/JNEUROSCI.23-07-02911.2003. [DOI] [PMC free article] [PubMed] [Google Scholar]
- Perry MJ, Lawson SN. Neurofilaments in rat and cat spinal cord: a comparative immunocytochemical study of phosphorylated and non-phosphorylated subunits. Cell Tissue Res. 1993;272:249–256. doi: 10.1007/BF00302730. [DOI] [PubMed] [Google Scholar]
- Plant LD. A role for K2P channels in the operation of somatosensory nociceptors. Front Mol Neurosci. 2012;5:21. doi: 10.3389/fnmol.2012.00021. [DOI] [PMC free article] [PubMed] [Google Scholar]
- Renganathan M, Cummins TR, Waxman SG. Contribution of Na(v)1.8 sodium channels to action potential electrogenesis in DRG neurons. J Neurophysiol. 2001;86:629–640. doi: 10.1152/jn.2001.86.2.629. [DOI] [PubMed] [Google Scholar]
- Rose K, Ooi L, Dalle C, Robertson B, Wood IC, Gamper N. Transcriptional repression of the M channel subunit Kv7.2 in chronic nerve injury. Pain. 2011;152:742–754. doi: 10.1016/j.pain.2010.12.028. [DOI] [PMC free article] [PubMed] [Google Scholar]
- Sandkühler J, Gruber-Schoffnegger D. Hyperalgesia by synaptic long-term potentiation (LTP): an update. Curr Opin Pharmacol. 2012;12:18–27. doi: 10.1016/j.coph.2011.10.018. [DOI] [PMC free article] [PubMed] [Google Scholar]
- Saygili E, Schauerte P, Küppers F, Heck L, Weis J, Weber C, Schwinger RH, Hoffmann R, Schröder JW, Marx N, Rana OR. Electrical stimulation of sympathetic neurons induces autocrine/paracrine effects of NGF mediated by TrkA. J Mol Cell Cardiol. 2010;49:79–87. doi: 10.1016/j.yjmcc.2010.01.019. [DOI] [PubMed] [Google Scholar]
- Simkin D, Cavanaugh EJ, Kim D. Control of the single channel conductance of K2P10.1 (TREK-2) by the amino-terminus: role of alternative translation initiation. J Physiol. 2008;586:5651–5663. doi: 10.1113/jphysiol.2008.161927. [DOI] [PMC free article] [PubMed] [Google Scholar]
- Sleeper AA, Cummins TR, Dib-Hajj SD, Hormuzdiar W, Tyrrell L, Waxman SG, Black JA. Changes in expression of two tetrodotoxin-resistant sodium channels and their currents in dorsal root ganglion neurons after sciatic nerve injury but not rhizotomy. J Neurosci. 2000;20:7279–7289. doi: 10.1523/JNEUROSCI.20-19-07279.2000. [DOI] [PMC free article] [PubMed] [Google Scholar]
- Toledo-Aral JJ, Moss BL, He ZJ, Koszowski AG, Whisenand T, Levinson SR, Wolf JJ, Silos-Santiago I, Halegoua S, Mandel G. Identification of PN1, a predominant voltage-dependent sodium channel expressed principally in peripheral neurons. Proc Natl Acad Sci U S A. 1997;94:1527–1532. doi: 10.1073/pnas.94.4.1527. [DOI] [PMC free article] [PubMed] [Google Scholar]
- Vulchanova L, Riedl MS, Shuster SJ, Stone LS, Hargreaves KM, Buell G, Surprenant A, North RA, Elde R. P2X3 is expressed by DRG neurons that terminate in inner lamina II. Eur J Neurosci. 1998;10:3470–3478. doi: 10.1046/j.1460-9568.1998.00355.x. [DOI] [PubMed] [Google Scholar]
- Watkins LR, Maier SF. Beyond neurons: evidence that immune and glial cells contribute to pathological pain states. Physiol Rev. 2002;82:981–1011. doi: 10.1152/physrev.00011.2002. [DOI] [PubMed] [Google Scholar]
- Wu G, Ringkamp M, Hartke TV, Murinson BB, Campbell JN, Griffin JW, Meyer RA. Early onset of spontaneous activity in uninjured C-fiber nociceptors after injury to neighboring nerve fibers. J Neurosci. 2001;21:RC140. doi: 10.1523/JNEUROSCI.21-08-j0002.2001. [DOI] [PMC free article] [PubMed] [Google Scholar]
- Wu KY, Zippin JH, Huron DR, Kamenetsky M, Hengst U, Buck J, Levin LR, Jaffrey SR. Soluble adenylyl cyclase is required for netrin-1 signaling in nerve growth cones. Nat Neurosci. 2006;9:1257–1264. doi: 10.1038/nn1767. [DOI] [PMC free article] [PubMed] [Google Scholar]
- Ye Y, Dang D, Viet CT, Dolan JC, Schmidt BL. Analgesia targeting IB4-positive neurons in cancer-induced mechanical hypersensitivity. J Pain. 2012;13:524–531. doi: 10.1016/j.jpain.2012.01.006. [DOI] [PMC free article] [PubMed] [Google Scholar]
- Yoo S, Liu J, Sabbadini M, Au P, Xie GX, Yost CS. Regional expression of the anesthetic-activated potassium channel TRESK in the rat nervous system. Neurosci Lett. 2009;465:79–84. doi: 10.1016/j.neulet.2009.08.062. [DOI] [PMC free article] [PubMed] [Google Scholar]
- Zylka MJ, Rice FL, Anderson DJ. Topographically distinct epidermal nociceptive circuits revealed by axonal tracers targeted to Mrgprd. Neuron. 2005;45:17–25. doi: 10.1016/j.neuron.2004.12.015. [DOI] [PubMed] [Google Scholar]