

Abstract
The polyadenylation of mRNA in eukaryotes is an important biological process. In recent years, significant progress has been made in the field of mRNA polyadenylation owing to the advent of the next generation DNA sequencing technologies. The high-throughput sequencing capabilities have resulted in the direct experimental determinations of large numbers of polyadenylation sites, analysis of which has revealed a vast potential for the regulation of gene expression in eukaryotes. These collections have been generated using specialized sequencing methods that are targeted to the junction of 3’-UTR and the poly(A) tail. Here we present three variations of such a protocol that has been used for the analysis of alternative polyadenylation in plants. While all these methods use oligo(dT) as an anchor to the 3’-end, they differ in the means of generating an anchor for the 5’-end in order to produce PCR products suitable for effective Illumina sequencing; the use of different methods to append 5’ adapters expands the possible utility of these approaches. These methods are versatile, reproducible, and may be used for gene expression analysis as well as global determinations of poly(A) site choice.
Keywords: alternative polyadenylation, high throughput sequencing, gene expression
Introduction
The introduction of the second generation sequencing technology has greatly facilitated the study of mRNA polyadenylation. This is indicated by numerous studies of high through-put studies of poly(A) sites [1–3]. The results provide detailed cellular transcript poly(A) profiles in different developmental stages, cell types, or disease states. From this growing body of literature, the extent of alternative polyadenylation and its relevance to gene expression has been revealed.
Among next generation sequencing platforms, RNA-seq using Illumina sequencing-by-synthesis technology was designed to efficiently characterize transcriptomes. However, regular RNA-seq protocols can only collect a small proportion of poly(A) sites due to the randomness of RNA fragmentation. To enhance the recovery of poly(A) sites, a number of poly(A) tag sequencing (PAT-seq) protocols have been developed that target only the junctions of the 3’-UTR and poly(A) tails. Systematic characterization of almost all transcripts in a sample is made possible by such technologies, the impact of which can be easily seen by comparing how many poly(A) sites were available before [4–6] and after the advent of PAT-seq methodologies (e.g., [3, 7, 8]). High-throughput determinations of poly(A) site usage has in turn led to a growing appreciation for the role of alternative polyadenylation (APA) in numerous processes including oncogene regulation [9, 10], development [11–14], and cellular differentiation [15, 16].
In plants, APA has been shown to contribute to the regulation of flowering time [17–21], oxidative stress responses [22, 23], and the expression of genes involved in RNA processing [24]. However, additional biological processes that involve APA are awaiting discovery. With the sequences of many plant genomes now available, the application of PAT-seq technologies to global transcriptome analysis of numerous crop plants and other species is now possible. We have developed a set of PAT-seq protocols that takes the advantage of several properties of Illumina sequencing, namely short (75–100 nts) and massive amounts of reads (10–100 million/lane). In this report the performance and reproducibility of these methods are discussed.
Methods
Biological sample preparation and RNA isolation
Arabidopsis leaf and seed RNA was isolated from young plants as described previously [8]. For RNA from imbibed seeds, approximately 0.10g of wild type Arabidopsis thaliana (Col.) seeds were placed on top of two layers of Whatman No.1 filter paper, wetted with distilled water, in a BD Falcon Bacteriological Petri dish (standard style dish, 100 x 15 mm). The seeds were incubated at 4°C for 3 days to alleviate dormancy and then transferred to 25°C under a light intensity of ~ 130 μmole•m−2•sec−1. After 48hr, RNA was isolated for further manipulation.
Three related strategies for PAT preparation are described in the following. These strategies share a common first step, the isolation of RNA from an appropriate source. For the studies described in this report, RNA was isolated from Arabidopsis thaliana seed or from young A. thaliana leaf tissue. These isolation procedures follow those described previously [25–28]. Briefly, leaf RNA was isolated using the Trizol reagent (Life Technologies, Carlsbad, CA) for extraction and subsequent precipitation using ethanol [25–27]. Seed RNA was isolated using a hot borate extraction [28]. Subsequently, total RNA (between 2 and 10 μg, in a total volume of 50 μl) was treated with 2 U of RNase-free DNase I (Thermo Scientific, # EN0521) following the manufacture’s protocol. DNAse I-treated RNA was purified using the RNeasy Plant Mini Kit (Qiagen, Valencia, CA, USA; # 74904). RNA samples were quantified using a Nanodrop instrument (Biotek, Winooski, VT, USA; Model: Synergy™ HT), and were occasionally assessed using a Bioanalyzer (Agilent Technologies, Santa Clara, CA, USA; Model 2100).
Preparation of Poly(A) Tags (PATs)
Three related procedures are described in the following. These procedures are termed as Method A, Method B1, and Method B2, respectively (Fig. 1). Methods B1 and B2 share a common set of steps up to a point, after which they diverge. The rationales for the different variations are discussed in the Results and Discussion.
Figure 1.

Illustration of the three methods of PAT-Seq that are described in this report.
Method A – Preparation of PATs using restriction enzymes
The overall goal for PAT-Seq is to generate short cDNA tags that query the mRNA-poly(A) junction. One approach to this end is to anchor a sequencing tag to the 5’ end of a cDNA (corresponding to the polyadenylated 3’ end of the mRNA), then digest full-length cDNAs with restriction enzymes that recognize four base pair sequences, and subsequently append linkers to the ends left by the respective restriction enzymes. The truncated and adapted cDNA tags are then amplified submitted for sequencing. This approach is illustrated in Fig. 1; the details have been published elsewhere [8] and are only summarized here.
Briefly, the DNase I-treated RNA (2–10 μg) is poly(A)-enriched using oligo-dT magnetic beads. The poly(A) RNA is used as a template to produce cDNA. For this, one of the RT-PE1 or RT-PE2 series of primers (Table 1) is used, along with the SWITCH1.1 primer (Table 1). The cDNA is purified using a QIAquick PCR Purification Kit (Qiagen, # 28106). This purified cDNA is converted to double-stranded form by PCR or the Klenow fragment of DNA polymerase I. For PCR.the first strand cDNA is used as a template for PCR using the PE-RTbio and SWITCH1.2 primers (Table 1). Two 25 μl reactions using 1 μl (each) of the first strand cDNA are set up. Second strands are synthesized using 12–18 cycles of PCR (each cycle consisting of 95°C melting for 15 sec, 60°C annealing for 30 sec; 2 min extension at 72 °C, with the cycling preceded by a dissociation step of 95°C for 30 sec, and followed by an extension step of 72°C for 10 min). For Klenow reactions, all of the first strand cDNA is added to a 50 μl reaction containing 100 pmol of the second strand primer (SWITCH1.2), 1X NEB restriction enzyme buffer 2, 1 mM dNTPs, and 5 units of Klenow DNA polymerase (NEB). These reactions are incubated for 2 hr at 37°C. In both cases, double-stranded cDNA is purified using a QIAquick kit and eluted into 50 μL.
Table 1.
Primers and sample keys (bar codes are underlined). NlaIII sites in SWITCH primers are boxed while TaiI sites are double underlined.
| List of oligonucleotides used for PAT preparation | ||
|---|---|---|
| Designation | Sequence (5’ -> 3’) | Use |
| Primers used for Method 1 | ||
| RT-PE1 series | 5’-biotin–TCCTGCTGAACCGCTCTTCCGATCTNNNXXTTTTTTTTTTTTTTTTTTVN | Reverse transcription primer |
| RT-PE2 series | TCCTGCTGAACCGCTCTTCCGATCTNNNXXTTTTTTTTTTTTTTTTTTVN | Reverse transcription primer |
| PE-RTbio | 5’-biotin TCCTGCTGAACCGCTCTTCCGATCT | Second strand synthesis |
| SWITCH1.1 |
|
Strand switching |
| SWITCH1.2 |
|
Second strand synthesis |
| PE-ADN1A |
|
Ligation of 5’ Illumina adapter |
| PE-ADT1A |
|
Ligation of 5’ Illumina adapter |
| PE-AD2A | AGATCGGAAGAGCGTCGTGTAGTCTGTCGAGAC | Ligation of 5’ Illumina adapter |
| PE-ADN1B |
|
Ligation of 5’ Illumina adapter |
| PE-ADT1B |
|
Ligation of 5’ Illumina adapter |
| PE-AD2B | TCAGATCGGAAGAGCGTCGTGTAGTCTGTCGAGAC | Ligation of 5’ Illumina adapter |
| PE-ADN1C |
|
Ligation of 5’ Illumina adapter |
| PE-ADT1C |
|
Ligation of 5’ Illumina adapter |
| PE-AD2C | AGAGATCGGAAGAGCGTCGTGTAGTCTGTCGAGAC | Ligation of 5’ Illumina adapter |
| PE-ADN1D |
|
Ligation of 5’ Illumina adapter |
| PE-ADT1D |
|
Ligation of 5’ Illumina adapter |
| PE-AD2D | GGAGATCGGAAGAGCGTCGTGTAGTCTGTCGAGAC | Ligation of 5’ Illumina adapter |
| Primers used for Methods 2A and 2B | ||
| RT-PE3 series | ACACTCTTTCCCTACACGACGCTCTTCCGATCTNNXXXTTTTTTTTTTTTTTTTTTVN | Reverse transcription primer |
| SWITCH2 | CGGTCTCGGCATTCCTGCTGAACCGCTCTTCCGATCTGGG | Strand switching |
| Primers used to amplify tags | ||
| PE-PCR1 | AATGATACGGCGACCACCGAGATCTACACTCTTTCCCTACACGACGCTCTTCCGATCT | Tag amplification |
| PE-PCR2 | CAAGCAGAAGACGGCATACGAGATCGGTCTCGGCATTCCTGCTGAACCGCTCTTCCGATCT | Tag amplification |
“N” – random base
“V” – A, C, or G, randomized in the primer population
“XX”, “XXX” – positions of bar codes used to distinguish samples for multiplex sequencing.
The purified cDNA is then digested with one of two restriction enzymes – Nla III or Tai I (Fermentas). The digested cDNA is ligated to one of two Y-adapters that consisted of primers with partial sequence complementarity and deliberate mismatching at the appropriate ends (these are the PE-AD series in Table 1; their use is illustrated in Fig. 1); the appropriate set of primers are annealed prior to the ligation reaction. After purification using Qiagen columns, the processed cDNA tags are amplified using 0.5U Phire Hot Start II DNA polymerase in a 25 μL reaction system (Thermo Scientific, # F-122L) following the manufacturer’s recommendation; for this, the primers RT-PCR1 and RT-PCR2 (Table 1) are used, and each reaction cycle consisted of 15 sec at 98°C, 15 sec at 55°C, and 60 sec at 72°C. PCR amplification was conducted for between 12 and 20 cycles, with the lowest number of cycles to yield a heterogeneous smear being determined empirically. PCR products are purified using the QIAquick PCR Purification kit and eluted into between 30 and 50 μL. These DNA fragments are submitted for sequencing without further processing.
Methods B1 and B2 – Preparation of PATs using RNA fragmentation
An alternative to the use of restriction enzymes to truncate cDNAs prior to adapting and sequencing is to fragment purified RNA prior to reverse transcription. For this, between 2 and 10 μg of total RNA is diluted to 25μL with RNase-free water, and 2.8 μL of RNA fragmentation buffer (100mM ZnCl2 in 100mM Tris-HCl, pH 7.0) added. The sample is incubated for 5–15 min at 70°C; different times in this range have been used with equally good results. After this time, 3 μL of 0.5M EDTA, pH 8.0 is added, the sample incubated at room temperature for 5 min, and the RNA purified using QIAquick RNA isolation columns and reagents. RNA is eluted into a final volume of 30 μL.
The fragmented RNA is poly(A)-enriched using oligo-dT magnetic beads (New England Biolabs, #S1419S) following the manufacturer’s recommendations. Between 2 and 10 μg of fragmented RNA is used with 75 μg of beads, and the RNA eluted in a volume of 10 μL of 10 mM Tris-HCl, pH 7.5. Nine μL of poly(A)-enriched mRNA is mixed with 1μL of a 100μM stock of primers (SWITCH2 and one of the PE-RT3 series in Table 1). The solution is mixed, heated to 65°C for 5 min to disrupt the secondary structure, chilled on ice for 2 min, and this heating and chilling repeated. Following this, reverse transcription reagents are added in the following order (while the tubes are on ice): 5 μL SMARTScribe 5X 1st strand buffer (Clontech), 2.5 μL 10mM dNTPs, 1 μL 100mM DTT, and 20U RNase Inhibitor (New England Biolabs). The mixture is brought to 42°C in a thermocycler with a heated lid, 100U SMARTScribe Reverse Transcriptase (Clontech) is added, and the reaction incubated for 2 hr at 42°C. At the end of 2 hr, the mixture is heated to 70°C for 5 min to inactivate the enzymes. 5U of RNase H (New England Biolabs) is added and the reaction incubated at 37°C for 1 hr. The cDNA is purified using a QIAquick PCR Purification Kit following the manufacturer’s protocol, and the cDNA eluted into 50 μL of Elution Buffer.
PCR amplification, purification, and sequencing – Method B1
At this point, the first strand cDNA should consist of a large mixture of molecules, consistent at their 3’ ends and with variable 5’ ends. Included in this mixture should be molecules with the desired properties – suitable sequencing adapters at either end, between 200 and 400 nts in length. To recover these, the cDNA is subject to limited PCR amplification. Between 0.2 and 5 μL of cDNA (determined empirically) is used to perform a low cycle PCR (10–15 cycles) using 0.5U Phire Hot Start II DNA polymerase in a 25 μL reaction system (Thermo Scientific, # F-122L) following the manufacturer’s recommendations; for this, the PE-PCR1 and PE-PCR2 primers (Table 1) are used . PCR conditions consist of 98°C for 30 sec, 10–20 cycles (the optimum determined empirically, as explained above) of 98°C for 15 sec, 60°C for 15 sec, and 72°C for 30 sec, and a final incubation at 72°C for 10 min. PCR amplicons are purified and eluted into 50 μL using a QIAquick PCR Purification Kit. Purified PCR products are then submitted for high-throughput sequencing.
Method B2 – size-selection of first strand cDNA and subsequent clean-up and amplification
Because artifacts (primarily due to dimers formed from the RT and SMART primers during reverse transcription) could be persistent and irregular in their occurrence, additional steps may be needed to enrich for the desired PCR products. Thus, Agencourt® Ampure®XP beads (Beckman Coulter, Brea, CA, USA; # A63880) are added to the cDNA (an 1.8:1 v/v ratio of beads to cDNA), incubated at room temperature for 20 min, the beads recovered, and the supernatant discarded. The beads are washed twice with 70% ethanol and air-dried at room temperature for 15 min. The beads are resuspended in 25 μL water, incubated for 1 minute, and removed by magnetic separation, the supernatant being retained.
The size-selected tags are amplified using Hot Start II DNA polymerase; for this, one μL of the final AMPure supernatant is used along with the PE-PCR1 and PE-PCR2 primers in a 25 μl reaction, and amplification conducted as described for Method B1, but for 15 cycles. After PCR, the amplicons are purified with the QIAquick PCR Purification Kit. The PCR products are treated with S1 nuclease (Thermal Scientific, # EN0321) following the manufacturer’s recommendations. S1-treated tags are purified using QIAquick PCR Purification columns and separated on a 1.5% (w/v) agarose gel run at a very low voltage (between 25 and 50 V) for 3 hr; these conditions were determined empirically to promote optimal separation of short artifacts (such as those arising from the anneaing of the two primers during the RT reactions) from amplicons of the desired size range. The region of the gel containing amplicons within a size range of 250–400bp is excised and the PCR amplicons extracted using the QIAquick Gel Extraction Kit. A 1μL aliquot of the purified PCR products is used to perform another round of low-cycle-number PCR amplification as described for Method B1 and the amplicons size-selected on agarose gels and recovered from the gel. The purified PCR amplicons are delivered for high-throughput sequencing.
High throughput sequencing
For all three methods, samples are analyzed on agarose gels and on a Bioanalyzer at the Advanced Genetics Technology Center at the University of Kentucky; this determines final DNA concentration and the size distributions of DNA tags. In addition, in some instances, PCR products are subcloned into pGEM (Promega, # A137A) and individual clones sequenced using the ABI Big Dye terminator kit (Life Technologies, #4337455); this is done to evaluate the quality of the amplified tags, and to assure that samples are not largely or wholly artifacts such as adapter dimers and tags from ribosomal RNA contamination. Sanger sequencing also assures that the tags have identifiable and known poly(A) sites.
For all of the sequencing described here, the Illumina GAIIx sequencing platform was used; for this, facilities at the Ohio Agriculture Research and Development Center (OARDC, Ohio State University, Wooster, OH) and Ambry Genetics (Aliso Viejo, CA) were used. Sequencing reads generated by both single-end and pair-end sequencing with 72bp sequencing cycles were obtained from OARDC. Sequencing reads generated by pair-end sequencing with 75bp sequencing cycles were obtained from Ambry Genetics. Sequences obtained from these two facilities were similar with respect to the metrics (poly(A) site distribution and gene expression levels) discussed in the Results and Discussion.
Bioinformatics processing of PATs
PATs may be analyzed using any of a number of mapping and statistical software packages. For the results presented here, the CLC Genomics Workbench (CLC bio, Aarhus, Denmark) was used. The input of the data analysis pipeline was the “raw” DNA sequences in FASTQ format returned by the sequencing center. The FASTQ files were imported into the “.clc” file format, and individual sequencing samples resolved into separate files using bar codes that were incorporated into the reverse transcriptase primers; this process removes the bar code. Oligo-dT and the PE-PCR sequences were removed from the sequences and any tags that were shorter than 20 nts after these steps were removed. For some purposes, the reversed complements of sequences for these tags were generated using the Geneious v5.6 software package (Biomatters, Auckland, New Zealand). The results were collections of tags of between 20 and 61 nts in length, binned according to the respective bar codes.
PATs were mapped to the reference database using the read-mapping tool in CLC. The mapping was performed with the stringency options of “fraction” set at 0.9 (“fraction” refers to the minimum length fraction of a read that must match the reference sequence; setting a value at 0.9 means that at least 90% of the read needs to match the reference) and “similarity” set at 0.7 (a “similarity” value of 70% dictates that the reads must have at least 70% identity with the reference sequence in order to be included in the final mapping.). After mapping the tags to the whole genome reference database, mapping results were saved in the .clc and .sam file formats and also converted to genome browser tracks for easier display.
RNA-Seq analysis was performed using CLC Genomics Workbench. PATs were mapped to the annotated TAIR10 genome reference database; for this, the 3’ UTRs of genome reference genes were extended to the downstream 120 flanking residues as described in [8]. The entire tag mapping operation was performed using the stringency criteria of “fraction” at 0.9 and “similarity” at 0.7 with the strand specific alignment and expression based on unique reads. The RNA-seq data was used to measure and analyze expression levels. For this, read counts were normalized based on the total gene reads such that expression levels were represented as tags per million. Multi-group comparisons were performed based on these calculated expression values, and the degrees of correlation between different samples estimated with scatter plots and using principal component analysis.
To compare poly(A) site choice genome-wide, the computational method described in Thomas et al. [22] was used. Briefly, PATs were mapped to a 3’-UTR database in which annotated 3’-UTRs (obtained from the TAIR10 annotation) were extended by 500 bp; this was done to maximize the chances of recovering poly(A) sites that fell far downstream from annotated 3’ ends, perhaps due to unanticipated transcriptional read-through or the production of hitherto-undescribed alternative transcripts. The reverse complement of this database was used in the mapping, to facilitate subsequent steps. The results of the mapping were exported from the CLC environment as .sam files, that were then used to compare the relative fractions of PATs that mapped to individual poly(A) sites in two samples; for this, a Java program was developed and used [22]. The output of these calculations are gene-by-gene metrics that range between 0 and 1; a cumulative plot of this sum yields a curve that defines the sample-by-sample variability in poly(A) site choice in 3’-UTRs.
To compare the PAT results with microarray data, three microarray experiments were used. Two of these (GSE5700 and GSE30223) were used for array data for dry Arabidopsis seed; from GSE5700, two replicates (GSM13303 and GSM13304) were obtained, and from GSE30223, three replicates (GSM748469, GSM748470, and GSM748471) were used. Wild-type leaf microarray data were obtained from GSE5630; from this experiment, three replicates (GSM131501, GSM131502, and GSM131503) were used. The expression data were used without further manipulation to calculate different sets of seed/leaf expression ratios as shown in Fig. 5. To compare array results with those derived from PATs, gene sets were trimmed to remove all genes whose normalized PAT-based expression values in both seeds and leaves were less than 10 tags per million; in addition, all PAT-based expression values were augmented by 1 tpm, to prevent errors due to division by zero when calculating ratios. This allowed comparisons of 9661 genes. Expression ratios were calculated using the average values from the respective replicates (e.g., for array-based leaf expression, the values for each gene in each of the three datasets were averaged).
Figure 5.

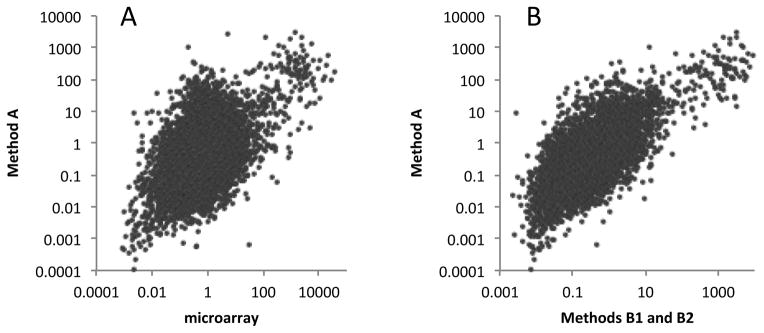
Comparison of seed/leaf gene expression ratios obtained using PATs and microarrays. A. Plot of values (displayed using a log10 scale) obtained using 8 microarray datasets (five seed and three leaf) and 13 PAT datasets (five seed and eight leaf); the PAT datasets were generated from tags prepared using Methods B1 and B2. The Pearson correlation coefficient for the linear relationship of the log-log plot was 0.73. B. Plot of values (displayed using a log10 scale) obtained using either the GSE30223 or GSE5700 array data as sources of seed gene expression (in both cases, GSE5630 was the source for leaf gene expression). The Pearson correlation coefficient for the linear relationship of the log-log plot was 0.89. C. Plot of values (displayed using a log10 scale) obtained using either the tt2 or wt seed PATs (prepared using Methods B2 and B1, respectively) as sources of seed gene expression (in both cases, all 8 leaf PAT preparations made using Methods B1 and B2 were the source for leaf gene expression). The Pearson correlation coefficient for the linear relationship of the log-log plot was 0.87. For all three plots, 9661 genes were analyzed (this was the number that had average expression values greater than 10 tpm in either the leaf or seed samples).
Results
Overview of the methodology
The approach for producing short cDNA tags that query the mRNA-poly(A) junction is summarized in Figure 1. The three variations illustrated have been used in our laboratories to study poly(A) site choice in various Arabidopsis tissues [8] as well as in a mutant deficient in the expression of a subunit of the polyadenylation complex [22]. The first step in the process involves the conversion of mRNA to cDNA using MuMV-derived reverse transcriptases. For this, a primer that consists of an oligo-dT tract and a two-nt anchor (VN), as well as 5’-situated sequences used to adapt the final products for the sequencing task, is used. Embedded within the 5’ sequences are unique two- or three- base sequences that serve as bar codes to distinguish samples, and thus allow multiple samples to be sequenced in a single lane or sample. The template for the reverse transcriptase reactions is mRNA that has been purified using immobilized oligo-dT. RT reactions include an additional primer that capitalizes on the ability of MuMV-derived reverse transcriptases to switch template strands, owing to the tendency of these enzymes to add short tracts of dC once the 5’ end of the template is reached [29]; if reactions have oligonucleotides with a 3’-situated GGG tract (termed in this report as the SWITCH adapter), then this oligonucleotide can anneal with the terminal CCC tract, thus presenting the enzyme with an opportunity to switch templates and add the complement to the new template to the very 3’-end of the cDNA. To achieve the goal of adding a dedicated adapter sequence to the 5’ end of a short cDNA tag, one of two strategies are used. These are detailed in the following subsections.
Method A – using restriction enzymes to add a 5’-adapter to the cDNA
For Method A, the SWITCH adapter (SWITCH 1.1) possesses a unique sequence that is not found in the Arabidopsis genome; this sequence is appended to the 3’ ends of first-strand cDNA and used to facilitate subsequent manipulations. Embedded within this sequence are NiaIII and TaiI recognition sites. Thus, the first-strand cDNA produced using poly(A)-enriched RNA is recovered and converted to double-stranded form using a primer (SWITCH1.2) that carries the SWITCH sequences but lacks the GGG residues. The double-stranded cDNA is then digested with either of these two restriction enzymes (NlaIII or TaiI); these enzymes recognize four bp sequences and leave four nucleotide overhangs. Recognition sites for these enzymes will occur fairly frequently in cDNAs, and the overhangs left after digestion are useful in promoting subsequent ligations. Those cDNAs that lack both sites are recovered because the SWITCH1.1 primer possesses both sites, and thus so should the full-length cDNAs. By using two enzymes, tags derived from cDNAs that lack one or the other restriction site, or possess a site that lies within 1–20 bp of the poly(A) site, may be recovered. The digested cDNA is then ligated with Y-shaped adapters so as to attach a sequencing-specific sequence at the site of digestion. After amplification, the tags are recovered using Qiagen columns and submitted for sequencing.
Method B1 – adding dedicated adapter sequences using RNA fragmentation
Because of a concern that some poly(A) sites would be “missed” using the restriction enzyme approach, an alternative strategy for adding sequencing-specific adapters to the 5’ ends of cDNA tags was adopted. This strategy is similar to that described by Shepard et al. [15]; thus, the template for cDNA synthesis is RNA that had been subjected to a limited fragmentation using Zn2+ and elevated temperatures and subsequently purified using immobilized oligo-dT. The adapter in these reactions (SWITCH2 in Table 1) possesses sequences that include those necessary for sequencing. cDNA so produced is amplified, the amplification products gel-purified, and the purified tags submitted for sequencing.
Method B2 – further purification of amplification products
Occasionally, and especially when producing tags from low starting quantities of RNA, sizable quantities of characteristic artifacts were produced; these artifacts often overwhelmed the authentic tags and reduced the overall yield of usable sequence. Since the source of these artifacts seemed to be inadvertent priming of DNA synthesis via annealing of the two oligonucleotides used in the RT reactions, the RT products are further purified using the AMPure reagent; the purification regimen was designed to recover cDNAs of between 200 and 400 bp in size. These cDNAs are subsequently subjected to a limited PCR amplification, purified, and submitted for sequencing. A representative gel showing the final sequencing products is shown in Fig. 2.
Figure 2.
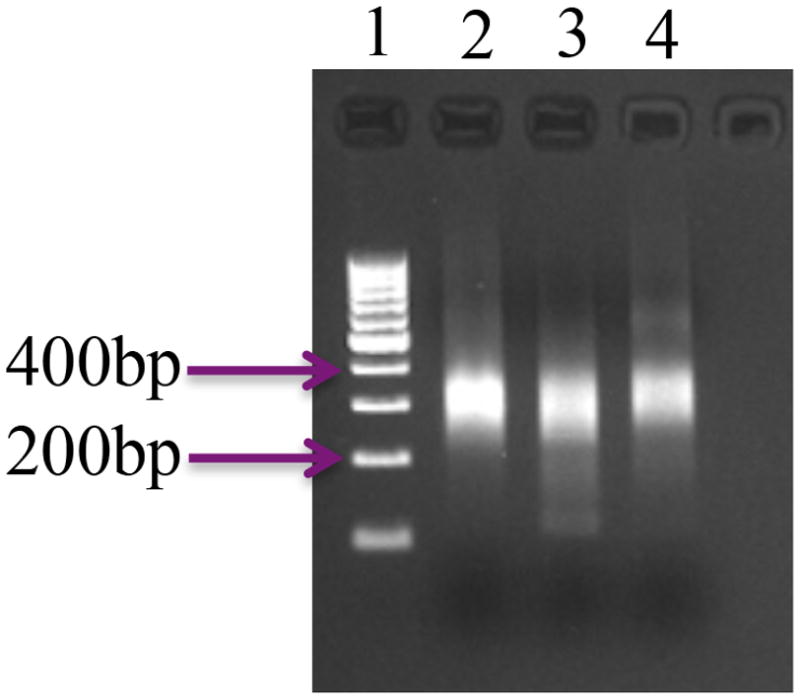
Representative example of PATs prepared using Method B2. For these samples, RNA isolated from dry tt2-5 seed was used. Three different replicates are shown, as are DNA size standards (lane 1).
Output – tag return and mapping results
Since 2009, the authors have prepared and analyzed more than 30 independent samples using one of the three methods described in Fig. 1. To compare the three approaches, 21 independent replicates representing eight different biological samples are discussed in the following. Two of the eight samples were derived from RNA isolated from dry seeds of wild type Arabidopsis, one from RNA isolated from dry seed of the tt2-5 mutant [30, 31], and one from wild type seed that had been imbibed in water for 48 hours. The three dry seed samples were prepared using Methods A, B1, and B2, respectively, and the 48 hr imbibed sample using Method B1. The other four samples were derived from Arabidopsis leaf material, harvested at four different times over the course of three years. Tags from two samples (represented by three replicates) were prepared using Method A, tags from one biological sample (six biological replicates) were prepared using Method B1, and tags from one biological sample (two replicates) prepared using Method B2. Most of the individual samples were pooled in sequencing lanes with other samples not described here; thus, tag yields and subsequent analyses represent just the recovery and properties of the appropriate bar-coded tags. (Five of these samples, prepared using Method A, have been described in detail elsewhere [8, 22].)
To assess the variability between different biological replicates and sample preparation methods, the various tag collections were mapped to the five Arabidopsis chromosomes, to a set of extended 3’-UTRs derived from the latest TAIR10 annotation, and to the Arabidopsis 45S rRNA precursor. The mappings to the five chromosomes and 3’-UTRs was done to estimate the “yield” of tags that define poly(A) sites in annotated, unidentified, and intergenic regions. The mapping to the rRNA precursor is a cursory measure of the quality of the RNA sample, and in particular to the effectiveness of the enrichment using immobilized oligo-dT. In all instances, sequences adjacent to genomic tracts of A/T longer than 6 nts were masked to reduce the possible contributions of internal priming by RT to the results. The results of these determinations are shown in Table 2. The “yield” of mapped PATs (defined by the percentage of total tags that map to the five Arabidopsis chromosomes) ranged from 21% to 69%. PATs that mapped to defined 3’-UTRs constituted between 6% and 53% of all tags in a given sample. There was a wide range of discrepancies between the yields of tags that mapped to the chromosomes and 3’-UTRs, ranging from 2% to more than 58% of all tags in a sample. These discrepancies were largely attributable to the presence of differing quantities of ribosomal RNA-related tags in the sample; once these were removed, the differences between the percentages of tags that mapped to 3’-UTRs and chromosomes ranged from 1% to 14%, with a median of 5.8% in all 21 samples (Table 2). Interestingly, this value was significantly greater in the tt2 dry seed (p-value of a Students t-test = 0.0017) than for wild type dry seed, or for the other samples evaluated in this study.
Table 2.
Sequence return and mapping outcomes for PAT samples.
| Sample | Method | Raw tag# | mapped to chromosomes | Percent mapped to chromosomes (P) | mapped to 3'UTRs | Percent mapped to 3'UTRs (Q) | Percent difference (P–Q) | mapped to rRNA | Percent mapped to rRNA |
|---|---|---|---|---|---|---|---|---|---|
| LAa | A | 5903191 | 1426870 | 24.2 | 1241190 | 21.0 | 3.2 | 55811 | 0.9 |
| LAb | A | 2240223 | 500853 | 22.4 | 40708 | 1.8 | 20.6 | 441263 | 19.7 |
| LAc | A | 4369955 | 2035046 | 46.6 | 1940928 | 44.4 | 2.2 | 40040 | 0.9 |
| LB1a | B1 | 3625226 | 1687692 | 46.6 | 1448073 | 39.9 | 6.7 | 100783 | 2.8 |
| LB1b | B1 | 2465522 | 524793 | 21.3 | 425417 | 17.3 | 4.0 | 7198 | 0.3 |
| LB1c | B1 | 4696988 | 1964073 | 41.8 | 931280 | 19.8 | 22.0 | 618325 | 13.2 |
| LB1d | B1 | 1253316 | 408552 | 32.6 | 324224 | 25.9 | 6.7 | 5557 | 0.4 |
| LB1e | B1 | 4690393 | 1550875 | 33.1 | 732746 | 15.6 | 17.5 | 450788 | 9.6 |
| LB1f | B1 | 4850319 | 1895655 | 39.1 | 811363 | 16.7 | 22.4 | 631594 | 13.0 |
| LB2a | B2 | 4087200 | 2166330 | 53.0 | 1876339 | 45.9 | 7.1 | 29626 | 0.7 |
| LB2b | B2 | 5403906 | 2939240 | 54.4 | 2588520 | 47.9 | 6.5 | 34489 | 0.6 |
| SAa | A | 2732659 | 771700 | 28.2 | 427450 | 15.6 | 12.6 | 213493 | 7.8 |
| SBb | A | 7278302 | 3288851 | 45.2 | 2822544 | 38.8 | 6.4 | 100341 | 1.4 |
| SB1a | B1 | 712815 | 432544 | 60.7 | 376695 | 52.8 | 7.9 | 3589 | 0.5 |
| SB1b | B1 | 2714976 | 1189015 | 43.8 | 995858 | 36.7 | 7.1 | 17144 | 0.6 |
| SB2a | B2 | 3843750 | 2456458 | 63.9 | 222117 | 5.8 | 58.1 | 1816784 | 47.3 |
| SB2b | B2 | 1868146 | 1101186 | 58.9 | 404871 | 21.7 | 37.2 | 450486 | 24.1 |
| SB2c | B2 | 965054 | 666876 | 69.1 | 352258 | 36.5 | 32.6 | 179290 | 18.6 |
| imB1a | B1 | 1069393 | 377199 | 35.3 | 281192 | 26.3 | 7.0 | 8646 | 0.8 |
| imB1b | B1 | 1814431 | 629821 | 34.7 | 523215 | 28.8 | 5.9 | 12947 | 0.7 |
| imB1c | B1 | 2003382 | 632961 | 31.6 | 495661 | 24.7 | 6.9 | 20252 | 1.0 |
Sample key: LA(a,b,c) – leaf PATs, prepared using Method A; LB1(a–f) – leaf PATs, prepared using Method B1; LB2(a,b) – leaf PATs prepared using Method B2; SA(a,b) – wild-type dry seed PATs, prepared using Method A; SB1(a,b) – wild type dry seed PATs, prepared using Method B1; SB2(a,b,c) – tt2-5 dry seed PATs, prepared using Method B2; imB1(a,b,c) – wild type seed imbibed for 48 hrs, prepared using Method B1
These results indicate a substantial degree of difference in outcomes in terms of tag and mapping yields, as well as the presence of interfering tags (such as those derived from ribosomal RNAs). To evaluate whether this variation affects the quality of mapping of poly(A) sites, the comparative tool described in Thomas et al. [22] was used. This tool measures the consistency in different samples of the relative usage of poly(A) sites on a gene-by-gene basis; the degree of variability of poly(A) site usage in genes with more than one poly(A) site (more than 70% of all Arabidopsis genes) is reflected in the relative poise of a curve that is calculated from a cumulative summation of genes possessing a particular distribution of poly(A) sites. Thus, curves shifted more to the left (the “wt-wt” plot in Fig. 3A) possess lower sample-to-sample variability than curves shifted to the right (the “wt-oxt6” plot in Fig. 3A; this curve is derived from data published in Thomas et al. [22], and represents a high degree of variability due to a mutation in a gene encoding a polyadenylation factor subunit).
Figure 3.

Reproducibility of the PAT-seq methods for assessing poly(A) site choice distribution on a genome-wide basis. A. Comparisons of biological replicates derived from the same developmental stage, prepared using the same method (A, B1, or B2). B. Comparisons of biological replicates prepared using different methods. C. Comparisons of replicates with vastly-different fractions of unmapped and/or rRNA-derived PATs.
As is seen in Fig. 3A, with one exception (the two wild type dry seed samples prepared using Method B1), curves derived from comparisons of replicates from the same biological sample (e.g., wild type leaf prepared with Method B1, etc.) that had similar quantities of PATs that mapped to rRNA were largely superimposable on the “wt-wt” plot described previously. (In this figure, a small sampling of the numerous plots that may be presented is given.) Comparisons of samples prepared with the different methods (Fig. 3B) also yielded results similar to those obtained when comparing replicates prepared using the same protocol (as in (19)). Therefore, the method used to attach sequencing adapters to the 5’ ends of the cDNA tags does not affect the relative distributions of tags, and thus the apparent relative usages of poly(A) sites in different genes.
The wide range of PATs that map to rRNAs in the various samples raises the possibility that samples with relatively high fractions of artifacts (such as PATs that map to rRNAs, or tags that arise due to unanticipated amplifications of heterodimers that consist solely of the primers used to amplify the final tags) may possess PAT populations that, when mapped and analyzed, do not represent the consensus of poly(A) sites in a sample. To test this, comparisons were made of replicates that had widely-differing quantities of tags that mapped to rRNA (Fig. 3C). The results showed that such replicates yield genome-wide poly(A) site choice plots that are indistinguishable from curves obtained with comparisons of more similar replicates.
Using PATs to estimate gene expression
In some senses, PATs are analogous to short cDNA tags that are used in so-called Serial Analysis of Gene Expression, or SAGE. In particular, PATs query target mRNAs at their 3’-ends. It therefore stands to reason that PATs may be useful for the estimation of gene expression levels. To explore this, gene expression was studied using the 21 individual PAT samples described in the preceding. For this, a simplified approach was used, such that expression levels were represented in terms of normalized abundance of tags that map to particular annotated 3’-UTRs. Tags were first mapped to a database consisting of annotated 3’ UTRs that had been extended by the addition of the 500 bp downstream from the annotated poly(A) site (these are the reference sequences used to derive the results shown in Fig. 3) and mapped sequences recovered. This step removes rRNA-derived tags from the sequence collection, a step that should serve to equalize the relative abundances of mRNA-derived tags in different samples. The recovered sequences were then used to assess gene expression using the RNASeq tool of the CLC Genomics Workbench; for this, a reference database consisting of annotated Arabidopsis 3’-UTRs that had been extended by 120 bp was used; this database, and not the one consisting of 3’-UTRs extended by 500 bp, was used to reduce complications arising from the mapping to nearby or overlapping transcription units. The results were compiled and analyzed using a number of approaches.
To collectively assess the reproducibility of the individual tag preparations, and to evaluate the reliability of these tags to reflect different biological states, a principal component analysis was conducted; the results of such a study are shown in Figure 4. The 21 samples sort themselves into two groups, widely-separated along the axis of the first principal component (that contributes more than 70% of all of the variability amongst the 21 samples). These groups correspond to samples derived from dry seed and from leaves, respectively. Three of the samples from dry seed and leaves (labeled as lA1, lA2, and sA1 in Fig. 4) are outliers; SA1 is prominent in this respect. The three samples from imbibed seeds show affinities for the leaf cluster of samples, consistent with a progression from a gene expression program in dry seeds to one in young seedlings growing in the light. With the exception of the sA1 outlier, these results show that the different individual samples are very reproducible in terms of gene expression levels, enough that they can identify different developmental stages as well as a characteristic developmental progression. (The lA1 and lA2 samples probably reflect differences in growth conditions; these samples were harvested more than a year apart and were not rigorously matched in terms of growth conditions, especially the timing during the day at which samples were harvested.)
Figure 4.

Principal component analysis of the 21 PAT samples described in this report. Expression levels were determined using the RNA-seq tool in CLC Genomics Workbench; in all cases, expression values were normalized such that values had the unit of tags per million. PCA analysis was performed and plotted as shown; in this case, the two principal components account for more than 90% of all of the variability amongst the different samples in this study.
To further evaluate the efficacy of PAT-based expression estimates, the ratios of expression of genes in seed and leaves were calculated for the PAT-based results summarized in Fig. 4 and for microarray-based determinations. For the latter, seed and leaf expression values were obtained from three experiments (accessions GSE5700, GSE30223, and GSE5630). Ratios obtained with these datasets were compared with ratios obtained by comparing PAT-derived expression levels using the leaf (the six LB1 and two LB2 samples), wt seed (SB1a and SB1b), and tt2 seed (SB2a, SB2b, and SB2c) datasets; these datasets were produced with PATs generated using Methods B1 and B2, both of which use RNA fragmentation to generate the 3’ ends of the corresponding cDNAs. (As shown in Fig. 4, these PAT samples had a better consistency than did PAT samples generated using Method A.) As shown in Fig. 5A, there was a good correspondence between ratios obtained in PAT- and microarray- based measurements. This correspondence was comparable (although somewhat lower) than that seen when different array-based seed experiments were compared with each other (Fig. 5B), and when the wt and tt2 PAT samples were compared (Fig. 5C). These results show that PAT-based expression determinations yield results comparable to those obtained using microarrays, and that the reproducibility of PAT-based expression measurements (Fig. 5C) is not much different from that of microarray-based measurements (Fig. 5B).
Similarly, seed/leaf gene expression ratios determined with PAT samples generated using Method A were compared with those derived from microarray studies. For this, the same microarray data described above and in Fig. 4 was used, as were the five leaf and seed PAT samples (LAa, LAb, SAa, SAb, and SAc in Table2) produced using Method A. As shown in Fig. 6A, there was a reasonable correlation between seed/leaf ratios obtained using the two methods, although this correlation was lower than that seen for the comparison in Fig. 5A. A similar correlation was seen when comparing PAT samples obtained using Method A with those produced using Methods B1 and B2 (Fig. 6B). These results indicate that Method A can be used to determine gene expression levels, but that the correspondence with other methods (microarray as well as PAT methods B1 and B2) is lower.
Figure 6.
Comparison of seed/leaf gene expression ratios obtained using PATs and microarrays. A. Plot of values (displayed using a log10 scale) obtained using 8 microarray datasets (five seed and three leaf) and 5 PAT datasets (2 seed and 3 leaf); the PAT datasets were generated from tags prepared using Method A. The Pearson correlation coefficient for the linear relationship of the log-log plot was 0.47. B. Plot of values (displayed using a log10 scale) obtained using PATs prepared using either Method A or Methods B1 and B2. The Pearson correlation coefficient for the linear relationship of the log-log plot was 0.69. For these plots, 8799 genes were analyzed (this was the number that had average expression values greater than 10 tpm in either the leaf or seed samples).
Discussion
The primary purpose for the production, sequencing, and analysis of PATs is to define poly(A) sites and to estimate variability in poly(A) site usage in response to developmental, physiological, or other changes. In this regard, the inherent variability of methods for the production and analysis of PATs, as well as the effects of artifacts and interfering factors on the outcomes of studies utilized PACs, is an important consideration. Two metrics described in this report indicate that the general approach utilized is effective in this regard. The results shown in Fig. 3 (as well as results described in Thomas et al. [22]) indicate that the relative usage of poly(A) sites in genes with multiple sites is consistently measured in different biological replicates. Interestingly, the consistency in these results is not affected by the method used to generate the 5’ ends of the PATs (Fig. 3B) or by the presence of artifacts (primarily derived from rRNAs, but also consisting of differing quantities of dimers and other amplicons that may have a reproductive advantage during amplification; Fig. 3C and unpublished observations). This means that the methods described in this report should be useful with RNA samples of varying quality, and with low quantities of RNA that would demand substantial amplification in order to generate material sufficient for sequencing. Importantly, Method A has been used to characterize genome-wide changes in poly(A) site choice in an Arabidopsis mutant deficient in the expression of a polyadenylation factor subunit [22], demonstrative of the utility of the method in assessing poly(A) site choice genome-wide as well as on a gene-by-gene basis.
One of the PAT samples analyzed in this study (SB1a in Table 1 and Fig. 3A) was noticeably different from its companion biological replicates (e.g., the SB1a-SB1b comparison in Fig. 3A). The reasons for this discrepancy are not known. Sample SB1a is not distinctive in terms of the overall yield of PATs, the yield of mapped PATs, or the quantities of rRNA-derived PATs (Table 1). While rare (one sample of more than 20 seems to be aberrant), this result serves as notice that quality control is needed to assure reliable results.
Each of the three methods has its benefits and shortcomings. Method B1 has the advantage of requiring the fewest experimental manipulations and PCR amplifications, and can be easily completed in a single day. However, with samples of poor RNA quality or low abundance, more extensive amplification may be needed; Method B2 reduces artifacts and interfering factors that are associated with amplification of low quantities of amplicons and thus is suited for a range of RNA samples. Method A suffers from the possibility that some poly(A) sites may lie too near or too far from the restriction enzyme sites used in the method, and thus that these sites may be under-represented or absent; this may be a primary reason for the poorer performance of these tags as proxies of gene expression levels (Figs 4 and 6). However, Method A is best-suited for the recovery of very short polyadenylated RNAs, that may be lost in the size-selections used in Methods B1 and B2. Such RNAs might include polyadenylated short microRNAs or extremely short promoter-associated transcripts [32].
The second metric that reflects on the reproducibility of PAT samples involves the use of PAT-seq as proxies for steady-state mRNA levels. PAT-seq would seem to be singularly useful as measures of steady-state mRNA levels. They are akin to Serial Analysis of Gene Expression (SAGE) tags in that they should provide a digital measure of mRNA abundance. They are superior to SAGE tags in that they may be generated in much larger quantities, allowing estimation of expression of genes expressed at relatively low levels. They focus on a limited part of the target mRNA, thereby obviating the need for Reads per Kilobase per Million Mapped Reads (RPKM)-based calculations (analyses that are necessary to account for sequence- and position- dependent differences in cDNA preparation and mapping efficiencies). As shown in Fig. 4, PATs prepared by the various methods are comparable in their performances as proxies of gene expression levels, insofar as they can reflect different developmental stages. Moreover, PATs generated using RNA fragmentation (Methods B1 and B2) provide a means for estimating gene expression levels that is comparable to microarrays (Fig. 5).
In the past 4 years, several variations have been adopted for the high throughput characterization of poly(A) sites in mammals, yeast, and plants. Many of these adhere to the general strategy outlined in this report – synthesis of cDNA using reverse transcriptase primers that contain adapter sequences suited for the sequencing platform of choice, coupled with methods that attach a suitable partner sequence to the 5’ end of the desired cDNA tags. However, in light of the possibility of internal priming at tracts of adenosine lying within RNAs, other approaches have been taken [9, 14, 33–35]; these utilize different strategies to restrict the sequencing to the very 3’ ends of RNAs or cDNAs. One of these, so-called Direct RNA Sequencing (DRS), has been used to characterize poly(A) site choice on a genome-wide basis in Arabidopsis [35]. There is a general agreement between the two approaches in terms of poly(A) site location, something reflected in the good agreement in putative poly(A) signals and nucleotide compositions that surround most sites defined by the two approaches [8, 22, 35]. In contrast, putative poly(A) sites that map to protein-coding regions are largely absent from the DRS-derived collection of Arabidopsis poly(A) sites [35], while they are reported in collections of sites recovered by the methods described here [8]. Sherstnev et al. [35] suggested that this discrepancy may be due to internal priming by reverse transcriptase at A+G-rich stretches, something that will not occur in the course of DRS. However, CDS-localized poly(A) sites are seen using DRS in yeast and humans (albeit at a lower frequency; [34]), and in some instances in yeast have been described and studied using RNA blot analysis [36, 37]. Moreover, a small subset of Arabidopsis CDS-localized poly(A) sites have been confirmed using oligo-dT-independent 3’-RACE analysis [8], thereby avoiding the problem of internal priming due to annealing of oligo-dT to A+G-rich sequences. The reasons for these discrepancies are not clear. Hoque et al. [33] point out that some polyadenylated RNAs that are generated by non-canonical poly(A) polymerases tend to have very short tracts of poly(A), with a minority of species being longer than 10 nts [38]. RNAs with short poly(A) tracts may not be recovered efficiently by DRS, thereby raising the possibility that some differences in global poly(A) site profiles as revealed by DRS and the methods described in this study may reflect the existence in Arabidopsis of a class of RNA with short poly(A) tracts. Regardless of this possibility, this discrepancy is one that deserves detailed additional study.
Conclusions
In summary, a versatile and facile set of methods for querying poly(A) site choice on a genome-wide basis has been developed and evaluated for consistency and reproducibility. These methods have been used to compare poly(A) site choice in leaves and seeds and in an Arabidopsis mutant that lacks a polyadenylation factor subunit, and should continue to provide a means to probe the occurrence and mechanisms of APA in plants and other organisms.
Highlights.
We have tested several high throughput methods for studying mRNA polyadenylation.
The described methods are highly reproducible in determining poly(A) site choice distribution.
The described methods are also suited for assessing levels of gene expression.
Acknowledgments
This work was supported by US National Science Foundation (IOS-0817818 to AGH and QQL), US National Institutes of Health (1R15GM094732-01 A1 to QQL), a grant from Ohio Plant Biotech Consortium to QQL, the University of Kentucky Executive Vice President for Research, and the Miami University Office for the Advancement of Research and Scholarship. Liuyin Ma was a recipient of a scholarship from the China Scholarship Council, and Dr. Pati was supported by a Fulbright-Nehru Senior Research Fellowship. The authors thank Ms. Carol Von Lanken for excellent technical assistance and Dr. Bruce Downie for helpful suggestions with the manuscript.
Footnotes
Publisher's Disclaimer: This is a PDF file of an unedited manuscript that has been accepted for publication. As a service to our customers we are providing this early version of the manuscript. The manuscript will undergo copyediting, typesetting, and review of the resulting proof before it is published in its final citable form. Please note that during the production process errors may be discovered which could affect the content, and all legal disclaimers that apply to the journal pertain.
References
- 1.Sun Y, Fu Y, Li Y, Xu A. Genome-wide alternative polyadenylation in animals: insights from high-throughput technologies. Journal of molecular cell biology. 2012;4(6):352–361. doi: 10.1093/jmcb/mjs041. [DOI] [PubMed] [Google Scholar]
- 2.Mueller AA, Cheung TH, Rando TA. All's well that ends well: alternative polyadenylation and its implications for stem cell biology. Current opinion in cell biology. 2013;25(2):222–232. doi: 10.1016/j.ceb.2012.12.008. [DOI] [PMC free article] [PubMed] [Google Scholar]
- 3.Shi Y. Alternative polyadenylation: new insights from global analyses. RNA. 2012;18(12):2105–2117. doi: 10.1261/rna.035899.112. [DOI] [PMC free article] [PubMed] [Google Scholar]
- 4.Lee JY, Yeh I, Park JY, Tian B. PolyA_DB 2: mRNA polyadenylation sites in vertebrate genes. Nucleic acids research. 2007;35(Database issue):D165–168. doi: 10.1093/nar/gkl870. [DOI] [PMC free article] [PubMed] [Google Scholar]
- 5.Loke JC, Stahlberg EA, Strenski DG, Haas BJ, Wood PC, Li QQ. Compilation of mRNA polyadenylation signals in Arabidopsis revealed a new signal element and potential secondary structures. Plant physiology. 2005;138(3):1457–1468. doi: 10.1104/pp.105.060541. [DOI] [PMC free article] [PubMed] [Google Scholar]
- 6.Shen Y, Ji G, Haas BJ, Wu X, Zheng J, Reese GJ, Li QQ. Genome level analysis of rice mRNA 3'-end processing signals and alternative polyadenylation. Nucleic acids research. 2008;36(9):3150–3161. doi: 10.1093/nar/gkn158. [DOI] [PMC free article] [PubMed] [Google Scholar]
- 7.Shen Y, Venu RC, Nobuta K, Wu X, Notibala V, Demirci C, Meyers BC, Wang GL, Ji G, Li QQ. Transcriptome dynamics through alternative polyadenylation in developmental and environmental responses in plants revealed by deep sequencing. Genome research. 2011;21(9):1478–1486. doi: 10.1101/gr.114744.110. [DOI] [PMC free article] [PubMed] [Google Scholar]
- 8.Wu X, Liu M, Downie B, Liang C, Ji G, Li QQ, Hunt AG. Genome-wide landscape of polyadenylation in Arabidopsis provides evidence for extensive alternative polyadenylation. Proceedings of the National Academy of Sciences of the United States of America. 2011;108(30):12533–12538. doi: 10.1073/pnas.1019732108. [DOI] [PMC free article] [PubMed] [Google Scholar]
- 9.Lin Y, Li Z, Ozsolak F, Kim SW, Arango-Argoty G, Liu TT, Tenenbaum SA, Bailey T, Monaghan AP, Milos PM, et al. An in-depth map of polyadenylation sites in cancer. Nucleic acids research. 2012;40(17):8460–8471. doi: 10.1093/nar/gks637. [DOI] [PMC free article] [PubMed] [Google Scholar]
- 10.Mayr C, Bartel DP. Widespread shortening of 3'UTRs by alternative cleavage and polyadenylation activates oncogenes in cancer cells. Cell. 2009;138(4):673–684. doi: 10.1016/j.cell.2009.06.016. [DOI] [PMC free article] [PubMed] [Google Scholar]
- 11.Li Y, Sun Y, Fu Y, Li M, Huang G, Zhang C, Liang J, Huang S, Shen G, Yuan S, et al. Dynamic landscape of tandem 3' UTRs during zebrafish development. Genome research. 2012;22(10):1899–1906. doi: 10.1101/gr.128488.111. [DOI] [PMC free article] [PubMed] [Google Scholar]
- 12.Smibert P, Miura P, Westholm JO, Shenker S, May G, Duff MO, Zhang D, Eads BD, Carlson J, Brown JB, et al. Global patterns of tissue-specific alternative polyadenylation in Drosophila. Cell reports. 2012;1(3):277–289. doi: 10.1016/j.celrep.2012.01.001. [DOI] [PMC free article] [PubMed] [Google Scholar]
- 13.Miura P, Shenker S, Andreu-Agullo C, Westholm JO, Lai EC. Widespread and extensive lengthening of 3' UTRs in the mammalian brain. Genome research. 2013 doi: 10.1101/gr.146886.112. [DOI] [PMC free article] [PubMed] [Google Scholar]
- 14.Jan CH, Friedman RC, Ruby JG, Bartel DP. Formation, regulation and evolution of Caenorhabditis elegans 3'UTRs. Nature. 2011;469(7328):97–101. doi: 10.1038/nature09616. [DOI] [PMC free article] [PubMed] [Google Scholar]
- 15.Shepard PJ, Choi EA, Lu J, Flanagan LA, Hertel KJ, Shi Y. Complex and dynamic landscape of RNA polyadenylation revealed by PAS-Seq. RNA. 2011;17(4):761–772. doi: 10.1261/rna.2581711. [DOI] [PMC free article] [PubMed] [Google Scholar]
- 16.Yoon OK, Hsu TY, Im JH, Brem RB. Genetics and regulatory impact of alternative polyadenylation in human B-lymphoblastoid cells. PLoS genetics. 2012;8(8):e1002882. doi: 10.1371/journal.pgen.1002882. [DOI] [PMC free article] [PubMed] [Google Scholar]
- 17.Hornyik C, Duc C, Rataj K, Terzi LC, Simpson GG. Alternative polyadenylation of antisense RNAs and flowering time control. Biochemical Society transactions. 2010;38(4):1077–1081. doi: 10.1042/BST0381077. [DOI] [PubMed] [Google Scholar]
- 18.Hornyik C, Terzi LC, Simpson GG. The spen family protein FPA controls alternative cleavage and polyadenylation of RNA. Developmental cell. 2010;18(2):203–213. doi: 10.1016/j.devcel.2009.12.009. [DOI] [PubMed] [Google Scholar]
- 19.Liu F, Marquardt S, Lister C, Swiezewski S, Dean C. Targeted 3' processing of antisense transcripts triggers Arabidopsis FLC chromatin silencing. Science. 2010;327(5961):94–97. doi: 10.1126/science.1180278. [DOI] [PubMed] [Google Scholar]
- 20.Simpson GG, Dijkwel PP, Quesada V, Henderson I, Dean C. FY is an RNA 3' end-processing factor that interacts with FCA to control the Arabidopsis floral transition. Cell. 2003;113(6):777–787. doi: 10.1016/s0092-8674(03)00425-2. [DOI] [PubMed] [Google Scholar]
- 21.Terzi LC, Simpson GG. Regulation of flowering time by RNA processing. Current topics in microbiology and immunology. 2008;326:201–218. doi: 10.1007/978-3-540-76776-3_11. [DOI] [PubMed] [Google Scholar]
- 22.Thomas PE, Wu X, Liu M, Gaffney B, Ji G, Li QQ, Hunt AG. Genome-wide control of polyadenylation site choice by CPSF30 in Arabidopsis. The Plant cell. 2012;24(11):4376–4388. doi: 10.1105/tpc.112.096107. [DOI] [PMC free article] [PubMed] [Google Scholar]
- 23.Zhang J, Addepalli B, Yun KY, Hunt AG, Xu R, Rao S, Li QQ, Falcone DL. A polyadenylation factor subunit implicated in regulating oxidative signaling in Arabidopsis thaliana. PloS one. 2008;3(6):e2410. doi: 10.1371/journal.pone.0002410. [DOI] [PMC free article] [PubMed] [Google Scholar]
- 24.Hunt AG, Xing D, Li QQ. Plant polyadenylation factors: conservation and variety in the polyadenylation complex in plants. BMC genomics. 2012;13:641. doi: 10.1186/1471-2164-13-641. [DOI] [PMC free article] [PubMed] [Google Scholar]
- 25.Addepalli B, Meeks LR, Forbes KP, Hunt AG. Novel alternative splicing of mRNAs encoding poly(A) polymerases in Arabidopsis. Biochimica et biophysica acta. 2004;1679(2):117–128. doi: 10.1016/j.bbaexp.2004.06.001. [DOI] [PubMed] [Google Scholar]
- 26.Addepalli B, Xu R, Dattaroy T, Li B, Bass WT, Li QQ, Hunt AG. Disease resistance in plants that carry a feedback-regulated yeast poly(A) binding protein gene. Plant molecular biology. 2006;61(3):383–397. doi: 10.1007/s11103-006-0019-6. [DOI] [PubMed] [Google Scholar]
- 27.Meeks LR, Addepalli B, Hunt AG. Characterization of genes encoding poly(A) polymerases in plants: evidence for duplication and functional specialization. PloS one. 2009;4(11):e8082. doi: 10.1371/journal.pone.0008082. [DOI] [PMC free article] [PubMed] [Google Scholar]
- 28.Wan CY, Wilkins TA. A modified hot borate method significantly enhances the yield of high-quality RNA from cotton (Gossypium hirsutum L.) Analytical biochemistry. 1994;223(1):7–12. doi: 10.1006/abio.1994.1538. [DOI] [PubMed] [Google Scholar]
- 29.Zhu YY, Machleder EM, Chenchik A, Li R, Siebert PD. Reverse transcriptase template switching: a SMART approach for full-length cDNA library construction. BioTechniques. 2001;30(4):892–897. doi: 10.2144/01304pf02. [DOI] [PubMed] [Google Scholar]
- 30.Nesi N, Jond C, Debeaujon I, Caboche M, Lepiniec L. The Arabidopsis TT2 gene encodes an R2R3 MYB domain protein that acts as a key determinant for proanthocyanidin accumulation in developing seed. The Plant cell. 2001;13(9):2099–2114. doi: 10.1105/TPC.010098. [DOI] [PMC free article] [PubMed] [Google Scholar]
- 31.Rajjou L, Gallardo K, Debeaujon I, Vandekerckhove J, Job C, Job D. The effect of alpha-amanitin on the Arabidopsis seed proteome highlights the distinct roles of stored and neosynthesized mRNAs during germination. Plant physiology. 2004;134(4):1598–1613. doi: 10.1104/pp.103.036293. [DOI] [PMC free article] [PubMed] [Google Scholar]
- 32.Ma L. PhD thesis. University of Kentucky; 2013. The role of polyadenylation in seed germination. [Google Scholar]
- 33.Hoque M, Ji Z, Zheng D, Luo W, Li W, You B, Park JY, Yehia G, Tian B. Analysis of alternative cleavage and polyadenylation by 3' region extraction and deep sequencing. Nature methods. 2013;10(2):133–139. doi: 10.1038/nmeth.2288. [DOI] [PMC free article] [PubMed] [Google Scholar]
- 34.Ozsolak F, Kapranov P, Foissac S, Kim SW, Fishilevich E, Monaghan AP, John B, Milos PM. Comprehensive polyadenylation site maps in yeast and human reveal pervasive alternative polyadenylation. Cell. 2010;143(6):1018–1029. doi: 10.1016/j.cell.2010.11.020. [DOI] [PMC free article] [PubMed] [Google Scholar]
- 35.Sherstnev A, Duc C, Cole C, Zacharaki V, Hornyik C, Ozsolak F, Milos PM, Barton GJ, Simpson GG. Direct sequencing of Arabidopsis thaliana RNA reveals patterns of cleavage and polyadenylation. Nature structural & molecular biology. 2012;19(8):845–852. doi: 10.1038/nsmb.2345. [DOI] [PMC free article] [PubMed] [Google Scholar]
- 36.Sparks KA, Dieckmann CL. Regulation of poly(A) site choice of several yeast mRNAs. Nucleic acids research. 1998;26(20):4676–4687. doi: 10.1093/nar/26.20.4676. [DOI] [PMC free article] [PubMed] [Google Scholar]
- 37.Sparks KA, Mayer SA, Dieckmann CL. Premature 3'-end formation of CBP1 mRNA results in the downregulation of cytochrome b mRNA during the induction of respiration in Saccharomyces cerevisiae. Molecular and cellular biology. 1997;17(8):4199–4207. doi: 10.1128/mcb.17.8.4199. [DOI] [PMC free article] [PubMed] [Google Scholar]
- 38.Wlotzka W, Kudla G, Granneman S, Tollervey D. The nuclear RNA polymerase II surveillance system targets polymerase III transcripts. The EMBO journal. 2011;30(9):1790–1803. doi: 10.1038/emboj.2011.97. [DOI] [PMC free article] [PubMed] [Google Scholar]