Abstract
Study Objectives:
Slow wave activity (SWA, 0.5-4.5 Hz) is a well-established marker for sleep pressure in adults. Recent studies have shown that increasing sleep pressure is reflected by an increased synchronized firing pattern of cortical neurons, which can be measured by the slope of sleep slow waves. Thus we aimed at investigating whether the slope of sleep slow waves might provide an alternative marker to study the homeostatic regulation of sleep during early human development.
Design:
All-night sleep electroencephalography (EEG) was recorded longitudinally at 2, 4, 6, and 9 months after birth.
Setting:
Home recording.
Patients or Participants:
11 healthy full-term infants (5 male, 6 female).
Interventions:
None
Measurements and Results:
The slope of sleep slow waves increased with age. At all ages the slope decreased from the first to the last hour of non rapid-eye-movement (NREM) sleep, even when controlling for amplitude differences (P < 0.002). The decrease of the slope was also present in the cycle-by-cycle time course across the night (P < 0.001) at the age of 6 months when the alternating pattern of low-delta activity (0.75-1.75 Hz) is most prominent. Moreover, we found distinct topographical differences exhibiting the steepest slope over the occipital cortex.
Conclusions:
The results suggest an age-dependent increase in synchronization of cortical activity during infancy, which might be due to increasing synaptogenesis. Previous studies have shown that during early postnatal development synaptogenesis is most pronounced over the occipital cortex, which could explain why the steepest slope was found in the occipital derivation. Our results provide evidence that the homeostatic regulation of sleep develops early in human infants.
Citation:
Fattinger S; Jenni OG; Schmitt B; Achermann P; Huber R. Overnight changes in the slope of sleep slow waves during infancy. SLEEP 2014;37(2):245-253.
Keywords: Sleep, slope of slow waves, homeostasis, infants, development
INTRODUCTION
Sleep shows substantial age-related changes during early human development.1–3 In the course of the first year after birth, the proportion of quiet sleep (QS) non rapid-eye-movement [NREM] sleep) increases1–2 and slow wave sleep (SWS, N3) becomes the predominant sleep stage in the first part of the night.3–6 Salzarulo and Fagioli proposed that the higher proportion of SWS at the beginning of a sleep period with a subsequent decrease in the course of a night may reflect the nocturnal dissipation of sleep propensity in young infants. They proposed that sleep regulatory mechanisms develop early in human life.7 In adults, these regulatory mechanisms of sleep have been intensively studied using slow wave activity (SWA, electroencephalogram [EEG] power in the delta frequency range, between 0.5-4.5 Hz) as a quantitative measure of slow waves. According to the two-process model of sleep regulation,8 the level of SWA reflects sleep pressure and is related to the homeostatic regulation of sleep. SWA increases as a function of prior wakefulness and progressively declines during sleep.9 Interestingly, in contrast to the decline of SWS across NREM/REM sleep cycles found in adults, the ultradian sleep cycle during early development is characterized by an alternating pattern of SWS occurring in every other sleep cycle. This salient feature of SWS has been shown in humans3 and animals10 and was supported by the study of Jenni and colleagues showing that low-delta activity (0.75-1.75 Hz) follows the same pattern in human infants.11 Specifically, NREM sleep episodes with high levels of low-delta activity alternate with NREM sleep episodes showing only minimal levels of low-delta activity across the night.11 The authors found that the alternating pattern was most prominent at the age of 6 months, where no decline in low-delta activity across the night was observed. They concluded from their study that low-delta activity may not be a suitable marker for the homeostatic regulation of sleep pressure during early human development.
Recently, we have gained important insights into the electrophysiological mechanisms underlying sleep regulation. On the neuronal level, slow waves are generated by a slow oscillation of neuronal activity between a depolarized on-state when neurons show sustained firing, and a hyperpolarized off-state when neurons are silent.12 During deep sleep, slow oscillations involve the majority of cortical neurons and become detectable as high amplitude spatially synchronized slow waves in the surface EEG. Using high density EEG recordings it has been demonstrated that slow waves travel across the cortex, originating in a particular location and propagating across the scalp involving more and more populations of cortical neurons.13 These slow oscillations were further investigated using multi-unit recordings in the rat, which have shown that changes in sleep pressure directly affect the alternating firing pattern of cortical neurons.14 With increasing duration of wakefulness, the slow oscillation among large populations of cortical neurons becomes more and more synchronized, presumably due to an increase in cortical connectivity.14,15 Such highly synchronized neuronal activity is reflected in high amplitude, steep scalp slow waves contributing to a high amount of SWA. During subsequent sleep, the synchronization of the neuronal firing pattern decreases, possibly due to a decrease in network connectivity, resulting in lower amplitude waves on the surface EEG, which in turn leads to a decrease in the level of SWA.14 These observations suggest that the level of synchronization among populations of cortical neurons represent a cellular counterpart of the homeostatic regulation of sleep. It has been proposed that the slope of slow waves, measured in the EEG, may represent a marker of this neuronal synchronization.16–18 Thus, the faster neuronal populations of a network are able to synchronize their activity, the steeper the slopes of the slow waves are. Consequently, the slope of slow waves at the beginning of the night when sleep pressure is high is much steeper compared to the slope of slow waves with the same amplitude towards the end of the sleep period when sleep pressure has dissipated.17 Moreover, Kurth et al. showed that the slope of slow waves decreases during adolescence, presumably reflecting the pruning of synapses during puberty.19
The early postnatal period of cortical development is characterized by a vast increase of cortical connectivity due to the formation of new synapses.20 The study by Jenni et al. has shown that low-delta activity reveals a similar age-dependent increase.11 Moreover, anatomical studies have shown that the increase in synapse density occurs first, during infancy and early childhood in the visual cortex, and spreads to more frontal regions during adolescence.21
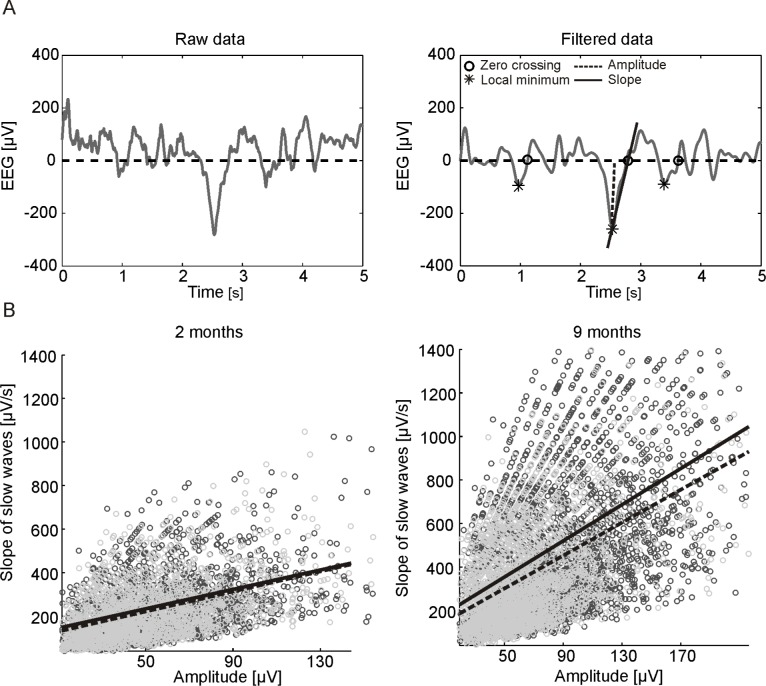
The aim of this study was to examine whether the considerable regional increase in cortical connectivity during infancy is also reflected by a change of the slope of sleep slow waves. Moreover, we aimed to investigate whether overnight changes in the slope of slow waves are already present during infancy, which would provide an indication for changes in the synchronization of cortical activity in the course of sleep. Therefore, we examined the characteristics of sleep slow waves (amplitude, slope, and incidence) in the EEG of the same infants published by Jenni and coworkers.11 Single slow waves were detected by applying an automatic detection algorithm (for further detail see17 and methods) and the amplitude (from zero level to the local minimum of the signal; μV), slope (amplitude of the negative half wave divided by the time between local minimum and the subsequent zero crossing; μV/s), and incidence (total number of detected slow waves per hour of NREM sleep) of slow waves were computed (see Figure 1A). It has been shown that slope and amplitude of slow waves are closely related.19,22 Thus, for an assessment of the slope, independent of amplitude changes, the slope of slow waves with a fixed amplitude (55 μV) were calculated.22 Finally, we were interested whether the increase in cortical connectivity during the first year of life would facilitate the propagation of slow waves across the cortex leading to an increase in the number of global slow waves. To address this question, the propagation properties of the detected slow waves were analyzed.
Figure 1.
(A) Schematic illustration of the slow wave detection method: 5 s of raw (left) and band-pass filtered (right) EEG signal of the C3-A2 derivation during NREM sleep. Right: Stars indicate detected slow waves. The slope was defined as the amplitude (local minimum of the signal, dotted line) divided by the time interval between the local minimum and the subsequent zero crossing (circles). (B) Example of detected slow waves for the derivation F3-A2: Scatter plots of all selected waves of the first (black) and last (gray) hour of NREM sleep of one subject at 2 (left) and 9 (right) months. For the first (continuous line) and last (dotted line) hour, a regression line was fitted to the data. Based on the regression parameters (slope and intercept), the slope at a fixed amplitude was determined.
METHODS
Subjects and Study Design
We analyzed previously published data from nocturnal polysomnographic sleep recordings carried out longitudinally in 11 healthy (5 boys and 6 girls) full-term infants.11 Subjects were recruited from the Department of Gynecology and Obstetrics at the University Hospital Zurich (Switzerland) and through private sources. All-night sleep polysomnography was recorded longitudinally at 2 weeks (17.9 ± 1.3 days) and at 2 (69.1 ± 22 days), 4 (133.8 ± 2.2 days), 6 (187.9 ± 2.5 days), and 9 (282.0 ± 2.9 days) months after birth at home in their habitual sleep environment following their usual bedtime routines. All infants had regular sleep-wake rhythm and were free of any infections or respiratory diseases at the time of the recording sessions.11
Written informed consent was obtained from all parents after detailed explanation of the study design and aim. The study protocol was approved by the ethical committee of the University Children's Hospital Zurich (Switzerland) and was performed according to the declaration of Helsinki.
Polysomnography
In each measuring night, EEG (bipolar derivations: F3-C3, F4-C4, C3-P3, C4-P4, P3-O1, P4-O2; referential derivation: C3-A2), electrooculogram (EOG), submental electromyogram (EMG), electrocardiogram (ECG), and respiratory movements were recorded at 512 Hz (analogue filter: high pass 0.16 Hz, low pass 70 Hz) with a portable polygraphic amplifier system (PS1; Institute of Pharmacology and Toxicology, University of Zurich, Switzerland). The EEG signal was stored after digital low-pass filtering at 30 Hz with a sampling rate of 128 Hz (for details see11). Before each recording session, the parents were contacted by phone to obtain information on the health status and sleep-wake rhythms during the preceding days. The electrodes were attached by the experimenter (Jenni; developmental pediatrician) in the early evening. The preprocessing of the EEG data and scoring of sleep stages is described in detail in the previous work of Jenni et al.11 In short: sleep stages were visually scored (referential derivation C3-A2) for consecutive 20-s epochs as quiet sleep (QS) or active sleep (AS, according to Anders and coworkers23) at 2 months of age; subsequent recordings at higher age were scored as NREM (stages 1-4) or REM sleep.24 The later scoring criteria resembles those used in adults.25 For reasons of simplification, only the terms NREM sleep (instead of QS) and REM sleep (instead of AS) are used throughout the manuscript.
Data Analysis
For the current analysis the EEG signals over the left frontal, central, parietal, and occipital cortices were re-referenced to the right mastoid (F3-A2, C3-A2, P3-A2, and O1-A2). Visual and semiautomatic artifact removal were performed based on 2 frequency bands (0.75 to 4.5 Hz and 20 to 30 Hz26).
For the detection of slow waves, an automatic detection algorithm similar the one described in the work of Riedner and colleagues17 was applied. After band-pass filtering (Chebyshev Type 2 Filter: pass-band 0.5 and 4.0 Hz, stop-band: < 0.16 and > 10 Hz) sleep slow waves during artifact-free NREM sleep epochs (i.e., QS at 2 months of age and stage 2, 3, and 4 of NREM sleep at higher age) were detected as negative deflection of the EEG signal between 2 consecutive zero-crossings. The negative deflection was chosen due to the higher stability of the signal. However, it has been shown that peak-to-peak analysis shows similar results.17 Only negative half-waves with a frequency between 0.5 and 2 Hz (of any amplitude) were considered for further analysis. From these detected half-waves, we determined the point in time of all zero-crossings and amplitudes (local minima of the signal). The ascending slope of slow waves was then defined as the amplitude divided by the time between the point in time of the local minimum and the subsequent zero-crossing (Figure 1A). From these detected waves, the mean amplitude and slope of slow waves were calculated across the entire night. The incidence of slow waves was expressed as number of slow waves detected per hour of NREM sleep.
Next, we were interested in overnight changes of the slope of slow waves. Therefore the amplitude differences need to be controlled for. To compare the slope of slow waves with the same amplitude, we chose a similar approach as Bölsterli et al.22 The amplitudes were plotted against the slopes of all detected slow waves separately of the first hour (first 60 min of artifact-free NREM sleep) and last hour (last 60 min of artifact-free NREM sleep) of NREM sleep. We considered only waves with amplitudes included in the overlapping amplitude range for the first and the last hour of NREM sleep. Next, a linear regression between the amplitude and the slope for the first and last hour of NREM sleep was calculated (Figure 1B). Based on the regression parameters (Slope(amplitude) = b + a(amplitude), b = intercept, a = slope), we calculated the slope at a fixed amplitude of 55 μV for the first and last hour. This procedure resulted in an approximate value for the slope of slow waves with amplitudes of 55 μV for the first and last hour of NREM sleep. We termed this slope “slope55.” An amplitude of 55 μV was chosen because all infants at all ages exhibited a large number of slow waves with this amplitude (see Figure 3). However, similar results (i.e., an age-dependent increase and an overnight decrease in the slope) were obtained when choosing higher amplitudes (i.e., 75 μV or 100 μV) to account for age dependent differences in slow wave amplitude.
Figure 3.
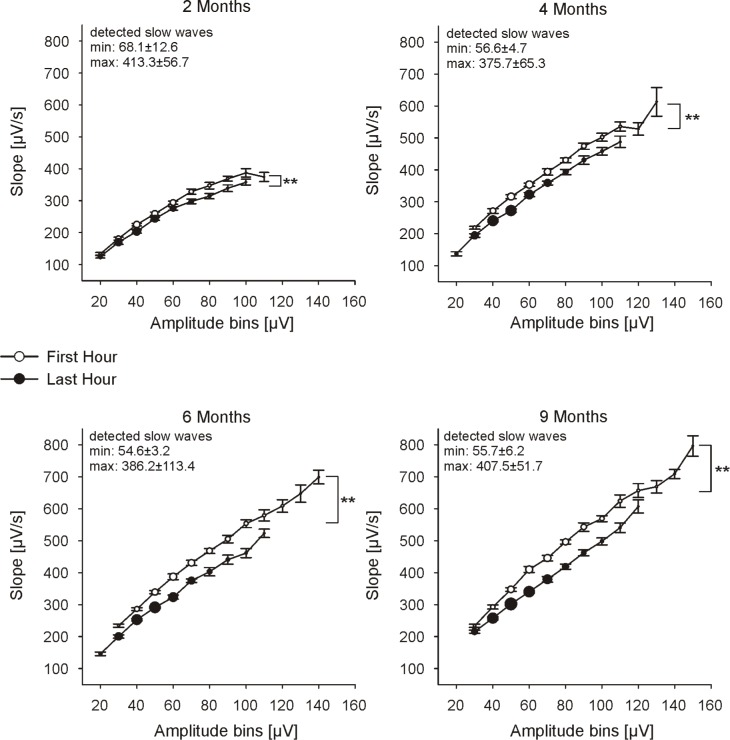
Slope of sleep slow waves for consecutive 10 μV amplitude bins (numbers represent the upper limit) of the first and last hour of NREM sleep (C3-A2): group mean ± SE for both time points are shown. Only amplitude bins with at least 50 detected waves per subject are considered. Circle size represents the number of detected slow waves for each amplitude bin. Numbers in the upper left corner of each plot show the maximal and minimal number of detected slow waves across all subjects (mean ± SE). ANOVA factor time (first hour vs. last hour): **P < 0.001, n ≥ 5.
In the previous study with the same dataset, it was shown that the alternating pattern of low-delta activity is most prominent at the age of 6 months.11 Thus, we investigated whether the alternating pattern is also seen in the slope55. Therefore the slope55 for the first 7 consecutive NREM episodes (for cycle criteria see11) in a subset of 6 infants at the age of 6 months were calculated. Only infants with a clear alternating pattern in low-delta activity during the first 7 consecutive NREM episodes were included in this analysis.
For an assessment of the propagation properties of slow waves we calculated the ratio between local and global slow waves during the first hour of NREM sleep. Because we were interested in global slow waves, all waves with high amplitudes (top 10%) were detected. Next, all waves occurring across all 4 channels within a time window of 100 ms were defined as global slow waves. It has been shown that slow waves need approximately 100 ms to sweep across the entire cortex.13 All other waves were defined as local waves. For this analysis one outlier (> > than 95 quantile of the group) in the 4-month-old age group had to be excluded, and one night of a 2-month-old subject because one of the 4 channels had too many artifacts.
Statistics
Changes of slow wave characteristics during the first 9 months were based on data of the conventional derivation C3-A2. Since the other derivations revealed similar results as C3-A2, only data from the latter are presented. For the analysis of topographical changes all channels from the left side (F3-A2, C3-A2, P3-A2, and O1-A2) were included. For the comparison of slow wave characteristics between different age groups, a linear mixed model ANOVA was calculated (random intercept: subject (to account for repeated measurements of the same person); main factor: age). For the analysis of overnight changes and regional differences, the additional fixed effects time (first and last hour of NREM sleep) or channel were added. In case of significance in the ANOVA, post hoc Student t-tests were used for pairwise comparisons within or between age groups. The significance level was set at 5%. All data are presented as mean ± standard errors (SE). All analyses were performed using the software package MATLAB (Math Works) or SPSS 16.0.
RESULTS
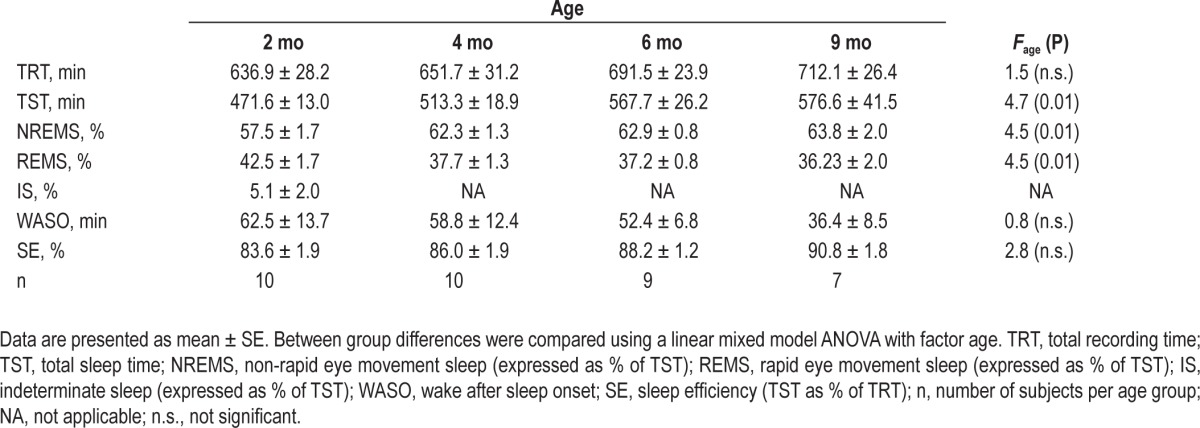
Because of electrocardiogram (ECG) artifacts in the reference channel A2, all recordings at 2 weeks after birth and all sessions of one subject (boy) were excluded from further analysis. Furthermore, at ages 6 and 9 months, 1 and 3 subjects, respectively, were excluded from analysis because sleep recordings were too short (total sleep time [TST] < 386 min). Thus, a total of 10 infants at 2 and 4 months, 9 at 6 months, and 7 subjects at 9 months (see Table 1) were analyzed.
Table 1.
Sleep variables
Sleep Architecture and General Changes in Characteristics of Sleep Slow Waves during Infancy
Minor differences in sleep architecture between this current and the previous analysis11 were due to the inclusion of a different number of subjects (all recordings with a minimal amount of 386 min TST were included in the current analysis). Total sleep time (TST) increased with age (∼ 22.3% from 2 months to 9 months). The amount of NREM sleep expressed as percentage of TST also showed an increase, whereas the amount of REM sleep decreased with age. Wake after sleep onset (WASO) and sleep efficiency (SE) did not differ across age groups (Table 1).
The main focus of this paper was the characterization of slow waves (i.e., negative half-waves) during NREM sleep in infants. In a first step, we calculated the average amplitude and slope of slow waves during NREM sleep for the entire night. Both, amplitude and slope increased with age from 50.9 ± 1.4 μV and 250.8 ± 8.3 μV/s at 2 months to 72.6 ± 2.9 μV and 425.9 ± 14.8 μV/s at 9 months, respectively (ANOVA Fage > 18, P < 0.001). The overall incidence of slow waves/h NREM sleep showed no age dependent changes during the first 9 months (i.e., 2150.7 ± 100.5 slow waves/h NREM sleep at 2 months, 2392.5 ± 64.4 slow waves/h NREM sleep at 9 months, ANOVA Fage = 1.00, P > 0.4).
Overnight Changes in Sleep Characteristics during Infancy
We were also examining whether slow wave characteristics change across the night, which may indicate homeostatic regulation. Thus, for each age group, the average amplitude, slope, and incidence of slow waves were calculated separately for the first and last hour of NREM sleep (Figure 2). For the amplitude and slope of slow waves we found a consistent decrease from the first to the last hour of NREM sleep (ANOVA FTime > 47, P < 0.001). In contrast, the number of detected slow waves/h NREM sleep increased slightly from the first to the last hour (ANOVA FTime = 6, P = 0.02).
Figure 2.
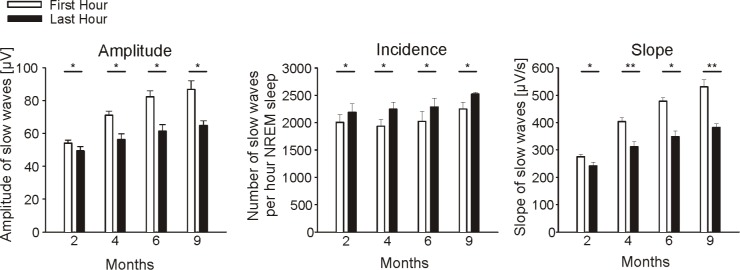
Characteristics (amplitude, incidence, and slope) of slow waves for the first and last hour of NREM sleep (C3-A2): Bars indicate group means ± SE. Paired t-test were used to test differences within age groups from the first to last hour of NREM sleep (*P < 0.05, **P < 0.001).
Next, we analyzed the slope of slow waves for the first and last hour of NREM sleep for all waves with any given amplitude to verify whether there are any amplitude specific changes. Therefore, we calculated the mean slope of slow waves of all waves within 10 μV amplitude bins (Figure 3). The decrease in the slope of slow waves from the first to the last hour of NREM sleep was observed for the entire amplitude range at each age (ANOVA FTime > 73, P < 0.001).
To control for amplitude differences (for an unbiased assessment of the level of synchronization among population of cortical neurons) the slope of slow waves was calculated at a fixed amplitude of 55 μV (slope55) separately for the first and last hour of NREM sleep (for details see Methods; the amplitude of 55 μV was chosen as a representative amplitude because all infants at each age exhibited large amounts of slow waves at this amplitude, Figure 3). The slope55 of the first hour of NREM sleep showed an overall increase with age (ANOVA Fage = 102.6, P < 0.001). When comparing the first to the last hour of sleep we found a consistent overnight decrease of the slope55 at each age (ANOVA FTime = 140.6, P < 0.001, Figure 4). These results were not affected by our approach to control for amplitude differences, as done with the slope55, since the same results were obtained when we calculated the average slope of all detected slow waves with amplitudes between 50 and 60 μV (data not shown). The extent of the overnight decrease of the slope55 increased with age (ANOVA Fage = 5.2, P = 0.005, Figure 4 insert). This finding was independent of the increase in TST with age, because a similar result was found when equal amounts of sleep (only the first 386 min of sleep) were included (ANOVA Fage = 4.2, P = 0.01). Moreover, the steeper the slope during the first hour of NREM sleep, the larger was the overnight decrease, independent of total sleep time (partial correlation, Rho = 0.7, P < 0.001).
Figure 4.
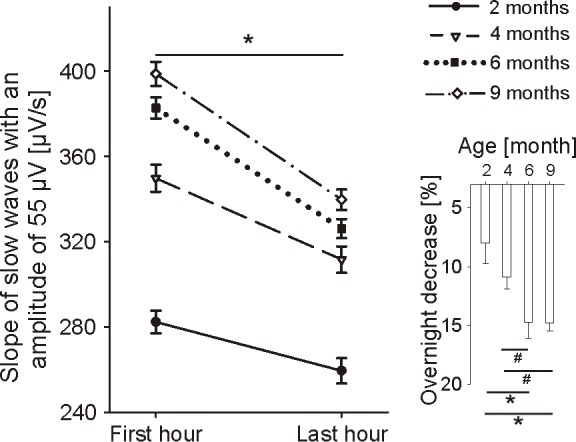
Slope of slow waves with an amplitude of 55 μV (slope55) of the first and the last hour of NREM sleep (C3-A2): group means ± SE for both time points are presented (Paired t-test First hour vs. Last hour: *P < 0.002). Insert: Overnight decrease in slope55 (in percentage of the first hour): Bars indicate group means ± SE (Paired t-test: *P < 0.05, #P < 0.06).
Time Course of the Slope55 and the Alternating Pattern at Age 6 Months
In a next step, we were interested whether the alternating pattern is also reflected in the slope55 at the age of 6 months when the alternating pattern was most prominent in low-delta activity. Interestingly, compared to low-delta activity we found a steady decrease of the slope55 across the first 7 consecutive NREM episodes in these infants (ANOVA Fepisode = 11.7, P < 0.001, Figure 5).
Figure 5.
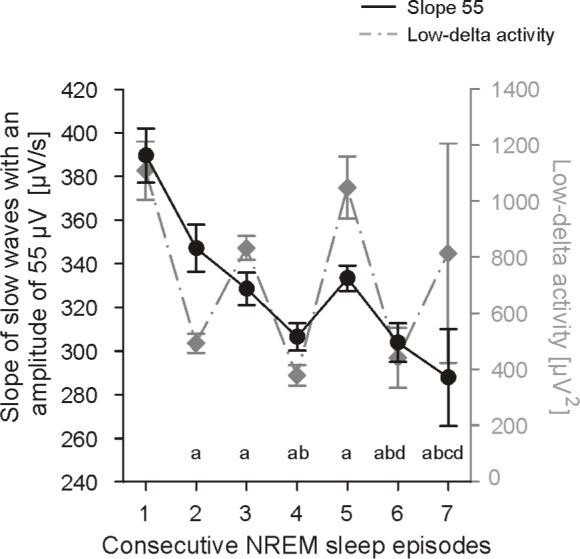
Slope of slow waves with an amplitude of 55 μV (slope55) of the first 7 NREM sleep episodes at the age of 6 months for 6 infants: Group mean values ± SE. (aP < 0.006 vs. 1st NREM episode, bP < 0.008 vs. 2 nd NREM episode, cP < 0.008 vs. 3rd NREM episode, and dP < 0.05 vs. 5 th NREM episode). Low-delta activity (for details of the calculation see Jenni et al.11) is shown in gray (right ordinate) to illustrate the different time course.
Topographical Differences in the Slope of Slow Waves during Infancy
For the assessment of topographical differences, we calculated the slope55 of the first hour of NREM sleep for each channel (Figure 6). In all derivations (frontal, central, parietal, and occipital), the slope55 increased with age (ANOVA Fage = 182.8, P < 0.001). Furthermore, the slope55 over the parietal, central, and frontal cortices were similar at each age, while the slope55 derived from the occipital derivation was much steeper than the slope55 of the other channels (ANOVA Fchannel = 69.4, P < 0.001). In a preliminary analysis, we also calculated the slope55 of 2 children at the age of 2 years. We found a further increase of the slope55 in frontal (+19.5%), central (+18.1%), and parietal (+7.3%) derivations, but no increase in the occipital derivation (-2.5%)
Figure 6.
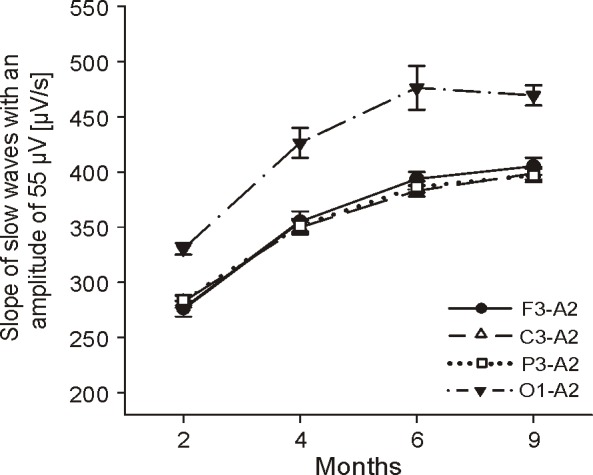
Topographical differences in the slope of slow waves with an amplitude of 55 μV (slope55) of the first hour of NREM sleep: Values represent group means ± SE for the frontal, central, parietal, and occipital derivation (referenced to the right mastoid). Significant group effects were found for factor age and channel (Fage = 182.84, P < 0.001; Fchan = 69.68, P < 0.001); 2 mo: n = 10 (except for channel F3-A2 n = 9), 4 mo: n = 10, 6 mo: n = 9, 9 mo: n = 7.
To assess the global nature of sleep slow waves as a marker for increased cortical connectivity the amount of global slow waves during the first hour of NREM sleep were calculated. We found that the majority of slow waves occurred locally (∼ 94%). However, the amount of global slow waves increased with age (ANOVA Fage = 8.24, P = 0.001) from 3.81% at 2 months to 8.57% at 9 months (P < 0.001).
DISCUSSION
We found a decrease in the amplitude and the slope of slow waves from the first to the last hour of NREM sleep in infants. When controlling for the amplitude difference we still observed an overnight decrease in the slope (slope55) at all ages. Our findings suggest that the level of synchronization among populations of cortical neurons, a cellular counterpart of the homeostatic regulation of sleep,14 decreases across the night in infants.
The electrophysiological origin of sleep slow waves is a changing pattern of neuronal silence (off-state) and neuronal activity (on-state) of cortical neurons.27 If this slow oscillation is highly synchronized among large populations of cortical neurons, they become detectable as large amplitude slow waves in the surface EEG.14 Measuring simultaneous multi-unit activity and local field potential in rats, Vyazovskiy et al. showed that the synchronization of the transition between on and off-states is reflected by the slope of slow waves in the surface EEG.14 Thus, the faster populations of cortical neurons can synchronize their neuronal activity, the steeper the slopes of slow waves are. Such changes in the synchronization of the neuronal firing pattern reflect a cellular counterpart of the homeostatic regulation of sleep. Increasing sleep pressure leads to a high synchronization between on- and off-states in large populations of cortical neurons, associated with steep slow waves in the surface EEG. When sleep pressure dissipates with progression of sleep, this synchronization declines, resulting in shallower waves. Therefore, we used the slope of slow waves as an electrophysiological marker for the homeostatic regulation of sleep. Comparing slow waves with the same amplitude our results show that the slope decreased from the first to the last hour of NREM sleep in infants at the age of 2 to 9 months. Thus, our findings provide evidence for a homeostatic regulation of cortical neuronal activity already at the age of 2 months.
We note that such changes of the slope of slow waves with fixed amplitude are accompanied by a shift in frequency. More specifically, if the amplitude of a slow wave is fixed, an increase in the slope goes along with an increase in the frequency of this wave. When calculating the frequency55 (frequency of all waves with an amplitude of 55 μV), the results were similar, i.e., frequency55 showed an overnight decrease and an age-dependent increase.
However, the question remains why the level of neuronal synchrony would increase with the duration of wakefulness and decrease during sleep. The synaptic homeostasis hypothesis claims that an increase in the strength of cortico-cortical connectivity during wakefulness is followed by a decrease (downscaling) during subsequent sleep.15 In fact, evidence is accumulating that net synaptic strength is tightly regulated over 24-h periods; it increases during wakefulness and decreases during sleep.28–30 Moreover, a computer model of the thalamocortical system provided evidence that an increase in synaptic strength would improve the synchronization of neuronal activity leading to steeper slow waves in the EEG.16 Kurth and coworkers showed that the reduction in synapse density during puberty is reflected in a decrease in the slope of slow waves.19 Further support for this notion is provided by our analysis of regional differences in the slope55. The slope55 of the first hour of NREM sleep increased in all derivations (frontal, central, parietal, and occipital). However, the slope55 over the occipital cortex was the steepest at all ages. This time course of the slope55 is related to the time course of synaptogenesis of the human cerebral cortex.20 Synapse density experiences a vast increase during the first postnatal months, reaching a peak at around 7 months in the occipital cortex and about 3 years later in the auditory and prefrontal cortices.21 In an explorative investigation, we also calculated the slope55 of 2 children at the age of 2 years. In this preliminary analysis, in line with the morphological data of Huttenlocher and Dabholkar21 we found a further increase of the slope55 in frontal, central, and parietal derivations, but no increase in the occipital derivation. Thus, the increase in synaptic strength, reflecting increased cortical connectivity during infancy could lead to an improved synchronization of neuronal activity, which would explain the observed rise of the slope55. Additional evidence for this hypothesis comes from the observation that the amount of global slow waves increases with age. Thus, a better connected network would facilitate the propagation of slow waves across the cortex and therefore lead to more global slow waves in the EEG. The extent of the overnight decrease of the slope55 also revealed an age-dependent increase. Thus, it seems that the increase in cortico-cortical connectivity goes along with increased downscaling across the night. In fact, the observation that the slope55 of the first hour of NREM sleep was positively correlated with the amount of the overnight decrease of the slope55, even when controlling for total sleep time supports this conclusion.
Previous studies concerning the development of a homeostatic regulation of sleep, relied either on the duration of slow wave sleep,3,5,31 or on the power in the delta frequency range (i.e., low-delta activity).11,31 However, it is still unknown when the homeostatic regulation of sleep develops in human life. For example, several studies reported that slow wave sleep becomes predominant in the first part of the night in infants starting at 2 months of age.3,5 On the other hand, low-delta activity seems to alternate between consecutive NREM/REM cycles in infants11 compared to the continuous decrease of SWA in adults.9 A previous study with the same dataset showed that the alternating pattern is most prominent at 6 months.11 At this age no decrease in low-delta activity in the course of the night was observed. Interestingly, when examining the slope55 (of waves within the low-delta frequency range), we found a decrease from the first to the last hour of NREM sleep. The time course of the slope55 across consecutive sleep cycles showed the same pattern (Figure 6). We used the same frequency range for the analysis of the characteristics of sleep slow waves as used in the previous studies (0.5-2 Hz17,19,22). Because the frequency range for the low-delta activity (0.75-1.75 Hz), for which the alternating pattern was described,11 slightly differs, we repeated our analysis considering only waves between 0.75 and 1.75 Hz. We found a similar decline of the slope of slow waves across the night (Slope55 of NREM sleep episodes 1: 378.3 ± 8.1 μV; 2: 351.2 ± 6 μV; 3: 334.7 ± 4.4 μV; 4: 319.4 ± 2.8 μV; 5: 338.8 ± 4.3 μV; 6: 317.2 ± 7.4 μV; 7: 299.0 ± 21.2 μV).
These results point to a certain level of independency between the slope of slow waves and low-delta activity. This observation is of special interest because SWA predominantly depends on the amplitude (and incidence) of slow waves. We found an overnight decrease in the amplitude, but an increase in the incidence of detected slow waves. Thus, it might be possible that the decrease in amplitude from the first to the last hour of NREM sleep is compensated for by the increase in the incidence of slow waves, resulting in equal levels of low-delta activity from the first to the last hour of NREM sleep. Support for this notion comes from a study by Bersagliere and Acher-mann,32 reporting that EEG power of waves oscillating below 1 Hz did not show the homeostatic increase after sleep deprivation at the beginning of recovery sleep in adults, even though the amplitude and slope increased.
In summary, we showed that the slope of slow waves (i.e., negative half-waves) decreases overnight in human infants starting at age 2 months. These results suggest an early development of the homeostatic regulation of sleep at the level of neuronal synchronization. In contrast, low-delta activity does not reveal a decrease in the course of the night at this age.11 A possible explanation for this discrepancy might be that power, as a function of slow waves amplitude and incidence, might not only reflect neuronal synchronization, but rather additional mechanisms, for example the duration of the underling off-state.14 Interestingly, Jenni and colleagues showed that theta activity instead of low-delta activity may reflect a marker of sleep homeostasis in infants. This observation is of interest in light of a recent multiunit recording study in awake rats showing evidence that the underlying cellular mechanism of theta activity and SWA are related.33 The question remains whether the level of neuronal synchronization is also reflected in the slope of theta waves. The low sampling rate of our dataset did not permit to address this question. Another important limitation that needs to be considered is that our recordings were limited to the nocturnal sleep period. Unfortunately, for practical reasons it was not possible to perform 24-h recordings including also daytime sleep. However, it has been reported that already after the first 6 weeks of life, consolidated nocturnal sleep episodes occur.34 Moreover, mean TST was 471.6 ± 13.0 min in our youngest age group, which points to consolidated nocturnal sleep.
In conclusion, our analysis of the slope of sleep slow waves provides evidence for age dependent changes in the generation and regulation of sleep slow waves during early human development. Thus, the slope of sleep slow waves might serve as a useful tool to study aberrant levels of neuronal synchronization (e.g., epilepsy). In general, such a tool may also be used as an electrophysiological marker of cortical maturation during infancy.
DISCLOSURE STATEMENT
Financial support was provided by the Swiss National Science Foundation grants 3100-05300.97, 3100A0-100567, 320030-130766 and PP00A-114923, the Human Frontiers Science Program Grant RG 0131/2000-BR102 and a research grant from the University Research Priority Program of the University of Zurich. The authors have indicated no financial conflicts of interest.
ABBREVIATIONS
- SWA
slow wave activity
- EEG
electroencephalography
- NREM
non rapid-eye-movement-sleep
- QS
quiet sleep
- SWS
slow wave sleep
- ECG
electrocardiogram
- TST
total sleep time
- EOG
electrooculogram
- EMG
electromyogram
- AS
active sleep
- slope55
slope of slow waves with an amplitude of 55 μV
- TRT
total recording time
- IS
indeterminate sleep
- WASO
wake after sleep onset
- SE
sleep efficiency
REFERENCES
- 1.Navelet Y, Benoit O, Bouard G. Nocturnal sleep organization during the first months of life. Electroencephalogr Clin Neurophysiol. 1982;54:71–8. doi: 10.1016/0013-4694(82)90233-4. [DOI] [PubMed] [Google Scholar]
- 2.Louis J, Cannard C, Bastuji H, Challamel MJ. Sleep ontogenesis revisited: a longitudinal 24-hour home polygraphic study on 15 normal infants during the first two years of life. Sleep. 1997;20:323–33. doi: 10.1093/sleep/20.5.323. [DOI] [PubMed] [Google Scholar]
- 3.Bes F, Schulz H, Navelet Y, Salzarulo P. The distribution of slow-wave sleep across the night: a comparison for infants, children, and adults. Sleep. 1991;14:5–12. doi: 10.1093/sleep/14.1.5. [DOI] [PubMed] [Google Scholar]
- 4.Anders TF, Keener M. Developmental course of nighttime sleep-wake patterns in full-term and premature infants during the first year of life. I. Sleep. 1985;8:173–92. doi: 10.1093/sleep/8.3.173. [DOI] [PubMed] [Google Scholar]
- 5.Coons S, Guilleminault C. Development of sleep-wake patterns and non-rapid eye movement sleep stages during the first six months of life in normal infants. Pediatrics. 1982;69:793–8. [PubMed] [Google Scholar]
- 6.Fagioli I, Salzarulo P. Sleep states development in the first year of life assessed through 24-h recordings. Early Hum Dev. 1982;6:215–28. doi: 10.1016/0378-3782(82)90109-8. [DOI] [PubMed] [Google Scholar]
- 7.Salzarulo P, Fagioli I. Post-natal development of sleep organization in man: speculations on the emergence of the ‘S process’. Neurophysiol Clin. 1992;22:107–15. doi: 10.1016/s0987-7053(05)80748-8. [DOI] [PubMed] [Google Scholar]
- 8.Borbély AA. A two process model of sleep regulation. Hum Neurobiol. 1982;1:195–204. [PubMed] [Google Scholar]
- 9.Achermann P, Borbély AA. Mathematical models of sleep regulation. Front Biosci. 2003;8:s683–93. doi: 10.2741/1064. [DOI] [PubMed] [Google Scholar]
- 10.Alfoldi P, Tobler I, Borbély AA. Sleep regulation in rats during early development. Am J Physiol. 1990;258:R634–44. doi: 10.1152/ajpregu.1990.258.3.R634. [DOI] [PubMed] [Google Scholar]
- 11.Jenni OG, Borbély AA, Achermann P. Development of the nocturnal sleep electroencephalogram in human infants. Am J Physiol Regul Integr Comp Physiol. 2004;286(3):R528–38. doi: 10.1152/ajpregu.00503.2003. [DOI] [PubMed] [Google Scholar]
- 12.Steriade M, Nunez A, Amzica F. A novel slow (< 1 Hz) oscillation of neocortical neurons in vivo: depolarizing and hyperpolarizing components. J Neurosci. 1993;13:3252–65. doi: 10.1523/JNEUROSCI.13-08-03252.1993. [DOI] [PMC free article] [PubMed] [Google Scholar]
- 13.Massimini M, Huber R, Ferrarelli F, Hill S, Tononi G. The sleep slow oscillation as a traveling wave. J Neurosci. 2004;24:6862–70. doi: 10.1523/JNEUROSCI.1318-04.2004. [DOI] [PMC free article] [PubMed] [Google Scholar]
- 14.Vyazovskiy VV, Olcese U, Lazimy YM, et al. Cortical firing and sleep homeostasis. Neuron. 2009;63:865–78. doi: 10.1016/j.neuron.2009.08.024. [DOI] [PMC free article] [PubMed] [Google Scholar]
- 15.Tononi G, Cirelli C. Sleep function and synaptic homeostasis. Sleep Med Rev. 2006;10:49–62. doi: 10.1016/j.smrv.2005.05.002. [DOI] [PubMed] [Google Scholar]
- 16.Esser SK, Hill SL, Tononi G. Sleep homeostasis and cortical synchronization: I. Modeling the effects of synaptic strength on sleep slow waves. Sleep. 2007;30:1617–30. doi: 10.1093/sleep/30.12.1617. [DOI] [PMC free article] [PubMed] [Google Scholar]
- 17.Riedner BA, Vyazovskiy VV, Huber R, et al. Sleep homeostasis and cortical synchronization: III. A high-density EEG study of sleep slow waves in humans. Sleep. 2007;30:1643–57. doi: 10.1093/sleep/30.12.1643. [DOI] [PMC free article] [PubMed] [Google Scholar]
- 18.Vyazovskiy VV, Riedner BA, Cirelli C, Tononi G. Sleep homeostasis and cortical synchronization: II. A local field potential study of sleep slow waves in the rat. Sleep. 2007;30:1631–42. doi: 10.1093/sleep/30.12.1631. [DOI] [PMC free article] [PubMed] [Google Scholar]
- 19.Kurth S, Jenni OG, Riedner BA, Tononi G, Carskadon MA, Huber R. Characteristics of sleep slow waves in children and adolescents. Sleep. 2010;33:475–80. doi: 10.1093/sleep/33.4.475. [DOI] [PMC free article] [PubMed] [Google Scholar]
- 20.Huttenlocher PR. Morphometric study of human cerebral cortex development. Neuropsychologia. 1990;28:517–27. doi: 10.1016/0028-3932(90)90031-i. [DOI] [PubMed] [Google Scholar]
- 21.Huttenlocher PR, Dabholkar AS. Regional differences in synaptogenesis in human cerebral cortex. J Comp Neurol. 1997;387:167–78. doi: 10.1002/(sici)1096-9861(19971020)387:2<167::aid-cne1>3.0.co;2-z. [DOI] [PubMed] [Google Scholar]
- 22.Bolsterli BK, Schmitt B, Bast T, et al. Impaired slow wave sleep downscaling in encephalopathy with status epilepticus during sleep (ESES) Clin Neurophysiol. 2011;122:1779–87. doi: 10.1016/j.clinph.2011.01.053. [DOI] [PubMed] [Google Scholar]
- 23.Anders T, Emde R, Parmelee A. A manual of standardized terminology, techniques and criteria for scoring of states of sleep and wakefulness in newborn infants. Los Angesles, CA: UCLA Brain Information Service/ Brain Research Institute; 1971. [Google Scholar]
- 24.Guilleminault C, Soquet M. Sleep states and related pathology. New York: SP Medical; 1978. [Google Scholar]
- 25.Rechtschaffen A, Kales A. A manual of standardized terminology, techniques and scoring system for sleep stages of human subjects. Washington DC: US Public Health Service, US Government Printing Office; 1968. [Google Scholar]
- 26.Huber R, Graf T, Cote KA, et al. Exposure to pulsed high-frequency electromagnetic field during waking affects human sleep EEG. Neuroreport. 2000;11:3321–5. doi: 10.1097/00001756-200010200-00012. [DOI] [PubMed] [Google Scholar]
- 27.Steriade M, Timofeev I, Grenier F. Natural waking and sleep states: a view from inside neocortical neurons. J Neurophysiol. 2001;85:1969–85. doi: 10.1152/jn.2001.85.5.1969. [DOI] [PubMed] [Google Scholar]
- 28.Bushey D, Tononi G, Cirelli C. Sleep and synaptic homeostasis: structural evidence in Drosophila. Science. 2011;332:1576–81. doi: 10.1126/science.1202839. [DOI] [PMC free article] [PubMed] [Google Scholar]
- 29.Gilestro GF, Tononi G, Cirelli C. Widespread changes in synaptic markers as a function of sleep and wakefulness in Drosophila. Science. 2009;324:109–12. doi: 10.1126/science.1166673. [DOI] [PMC free article] [PubMed] [Google Scholar]
- 30.Vyazovskiy VV, Cirelli C, Pfister-Genskow M, Faraguna U, Tononi G. Molecular and electrophysiological evidence for net synaptic potentiation in wake and depression in sleep. Nat Neurosci. 2008;11:200–8. doi: 10.1038/nn2035. [DOI] [PubMed] [Google Scholar]
- 31.Sterman MB, Harper RM, Havens B, Hoppenbrouwers T, McGinty DJ, Hodgman JE. Quantitative analysis of infant EEG development during quiet sleep. Electroencephalogr Clin Neurophysiol. 1977;43:371–85. doi: 10.1016/0013-4694(77)90260-7. [DOI] [PubMed] [Google Scholar]
- 32.Bersagliere A, Achermann P. Slow oscillations in human non-rapid eye movement sleep electroencephalogram: effects of increased sleep pressure. J Sleep Res. 2010;19:228–37. doi: 10.1111/j.1365-2869.2009.00775.x. [DOI] [PubMed] [Google Scholar]
- 33.Vyazovskiy VV, Olcese U, Hanlon EC, Nir Y, Cirelli C, Tononi G. Local sleep in awake rats. Nature. 2011;472:443–7. doi: 10.1038/nature10009. [DOI] [PMC free article] [PubMed] [Google Scholar]
- 34.Jenni OG, Deboer T, Achermann P. Development of the 24-h rest-activity pattern in human infants. Infant Behav Dev. 2006;29:143–52. doi: 10.1016/j.infbeh.2005.11.001. [DOI] [PubMed] [Google Scholar]


