Abstract

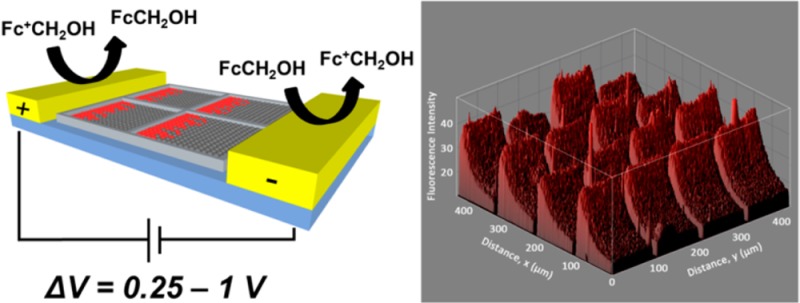
A micro supported lipid bilayer (SLB) electrophoresis method was developed, which functions at low potentials and appreciable operating times. To this end, (hydroxymethyl)-ferrocene (FcCH2OH) was employed to provide an electrochemical reaction at the anode and cathode at low applied potential to avoid electrolysis of water. The addition of FcCH2OH did not alter the SLB characteristics or affect biomolecule function, and pH and temperature variations and bubble formation were eliminated. Applying potentials of 0.25–1.2 V during flow gave homogeneous electrical fields and a fast, reversible, and strong build-up of a charged dye-modified lipid in the direction of the oppositely charged electrode. Moreover, streptavidin mobility could be modulated. This method paves the way for further development of analytical devices.
Supported lipid bilayers (SLBs) are a rewarding mimetic system for cell membranes.1,2 Employing such SLBs promotes investigations of membrane associated processes in cells by e.g. membrane proteins because they can be reconstituted in SLBs in analogy to their native membranous environment.1−6 When external electric fields are applied in SLBs, membrane proteins can be manipulated along the SLB.7,8 Using DC fields, charged membrane components could be separated by either electrophoretic or electro-osmotic motion of the charged analytes, which could be confined into small regions or near barriers.9−13 While these experiments confirm the versatility of SLBs to serve as biomimetic systems, performing membrane electrophoresis with fields of commonly 10–20 V/cm requires sending DC currents for a prolonged time which typically causes electrolysis of water. This leads to changes in pH and causes bubble formation, while concomitant changes in temperature can irreversibly affect SLB integrity and protein structure.14
To eliminate those effects in electrophoresis set-ups, low ionic strength solutions, reduction of the aqueous volume above the SLB, and high flow speeds over the SLB have been employed.15 In addition, membrane traps have been reported that utilize AC electric fields and asymmetric surface patterns to confine charged species over large distances and to retard diffusive recovery while reducing the applied potential.16 In a recent example Evans et al. report the use of AC electric fields and embedded electrodes to further minimize the applied potential from 200 to 13 V by reducing the interelectrode spacing.17
Here, a method is presented that prevents water electrolysis at the anode and cathode through the addition of an electro-active species. This allows use of unprecedented low applied potentials of a few hundreds of millivolts to achieve appreciable electric fields of up to 16 V/cm while obtaining equal DC build-up times as in other cases (∼20 min).12,17 The method was proven to be compatible with biomolecules. This achievement is crucially important for the further development of bioanalytical devices.18 Hydroxymethylferrocene (FcCH2OH) was selected as a water-soluble electroactive but electroneutral species, showing limited effect on the conductivity of the solution and no effect on the SLB characteristics (see Supporting Figure S1). The diffusion constant of the SLBs was determined using Fluorescence Recovery After Photobleaching (FRAP) to be 2.1 ± 0.6 and 2.4 ± 0.5 μm2/s with or without FcCH2OH, respectively, while the mobile fraction approached 100% in both cases.
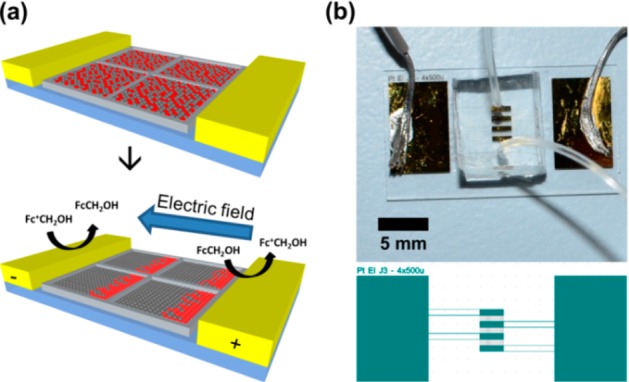
Our μSLB electrophoresis chip is depicted in Figure 1. The chip has interdigitated electrodes (spaced 500 μm) and Cr corrals (spaced 100 μm) to enable parallel analysis. After fabrication (see Supporting Information for details), the chips were bonded to PDMS blocks equipped with flow channels allowing the formation of an SLB of DOPC doped with negatively charged TR-DHPE on the chips (see Supporting Figures S2 and S3). Electrophoretic migration was monitored using epi-fluorescence microscopy.
Figure 1.

(a) Schematic representation of the experimental setup. (b) Photograph of the experimental setup, with (inset) the electrode design, containing four interdigitated electrodes.
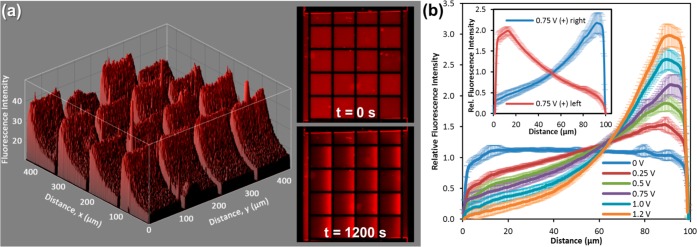
Representative 3D and corresponding 2D fluorescence micrographs are shown in Figure 2a, the latter showing prior to and after applying a 1 V potential difference in the presence of 0.5 mM FcCH2OH. Upon applying a potential, negatively charged TR-DHPE accumulates at the Cr barriers in the direction of the positive electrode to reach a steady state within 20 min (t1/2 is ca. 5 min; see Supporting Figure S4). When no FcCH2OH was added, no electrophoretic migration was observed at these low applied potentials. Interestingly, upon close inspection of the fluorescence images, uniform exponential intensity profiles were observed irrespective of the corral–electrode distance. This observation suggests the presence of a homogeneous electric field in the solution. The extent of electrophoretic build-up was tuned by varying the applied potential from 0.25 to 1.2 V (Figure 2b), all well below the potential of electrolysis of water. Furthermore, the direction of electrophoretic migration was easily switched by reversing the polarity of the electrodes (inset Figure 2b) while the flow direction was kept constant in this experiment. The concentration profiles were mirror images of each other depending on the direction of migration. When a chip consisting of only two electrodes was used, electrophoretic mobility was observed only opposite to the direction of the flow. A single junction arrangement requires the first encountered electrode to be the anode since there is no oxidized FcCH2OH present, thus fixing the electrode polarity and migration direction. In contrast, an interdigitated array provides both oxidized and reduced forms of FcCH2OH to flow over the SLB irrespective of electrode polarity, thus enabling AC applications.
Figure 2.

(a) 3D fluorescence microscopy image of electrophoretic build-up of a TR-DHPE containing lipid membrane after applying 1 V for 20 min, in the presence of 0.5 mM FcCH2OH. Corresponding 2D fluorescence microscopy images are shown at time points 0 and 20 min. (b) Graph showing the relative TR-DHPE fluorescence intensity for different potentials. Inset shows reversal of the direction of electrophoretic migration by reversing the polarity of the electrodes. Data are presented as mean ± SD.
To evaluate the electrical parameters during the build-up of the uniform fluorescence profiles, Ohmic behavior was assumed in between the electrodes as well as constant solution composition and conductivity. By applying Ohm’s law, the electric field between two electrodes can be calculated as
| 1 |
where E is the electric field in V/cm, I is the current in A, σ is the electrical conductivity in S/cm (4 μS/cm), w is the active electrode width (500 μm), h is the height of the solution (50 μm), and the factor 3 arises from three junctions in parallel exposed to the solution when the flow channel is bonded to the chip, as shown in Figure 1b.19 Equation 1 evidently specifies two parameters that require attention, i.e. the current and the conductivity of the solution. Increasing the concentration of FcCH2OH up to the solubility limit of 0.5 mM gave a huge increase in current at low applied potentials below the electrolysis potential of water, while the conductivity of the solution only increased slightly up to 4 μS/cm (see Supporting Figure S5 for a CV of FcCH2OH). Employing buffered solutions of suitable electroactive species is possible if the increase in solution conductivity is canceled by higher Faradaic currents thereby permitting sufficiently large E-fields to be generated. The addition of flow over the chip increased currents by a factor of ca. 3, while the current and thus the electric field were stabilized. As shown in Figure 3a, the current could be tuned by varying the applied potential and flow speed. There was no influence found of the flow speed on SLB characteristics up to a flow speed of 0.3 mL/min.
Figure 3.
(a) Modulation of the current at different applied potentials and varying flow speeds in the presence of 0.5 mM FcCH2OH. (b) Example of deducing the electric field by a theoretical fit of the exponential fluorescence intensity profile (1 V, 20 min); see text for details. (c) Comparing the applied electric field at 100 μL/min deduced from the current data in (a) (solid line), exponential fit from (b) (squares), and the geometrical approximation only (dashed line).
Alternatively, the electric field can be deduced from the fluorescence profile at steady state using a method given by Boxer et al. who described the steady-state concentration gradients to result from a competition between random diffusion and electric-field-induced drift.7
By least-squares fitting of the experimental steady-state concentration gradients to eq 2, the electric field was obtained. In
| 2 |
I(x) is the normalized fluorescence intensity at position x (a.u.), A is the maximum normalized fluorescence intensity (a.u.), D is the diffusion constant (cm2/s), and μ is the electrophoretic mobility (cm2/(V*s), with the α-parameter of 0.6 included16) and z as the charge of the probe.
A representative fit to determine the electric field is shown in Figure 3b. The two aforementioned methods for deducing the electric field, by using eq 1 or by fitting eq 2, are compared in Figure 3c. The two methods favorably agree (r2 = 0.97). Values of the calculated and fitted E-fields are given in Supporting Table S1.
The dashed line in Figure 3c represents an electric field estimated by electrode distance only, which is often the method of choice in literature.7,12,14
As shown in Figure 3c when utilizing the latter method, for example in our case at 1 V, the electric fields can be overestimated by more than 50%. This can be explained by the potential drops at both electrodes due to the reaction and concentration overpotential. As a result of the reduced distance between both electrodes, the contributions of these overpotentials at each electrode will be relatively large.24 Joule heating is negligible in our system, as the total power dissipation of 2.6 × 10⁻⁵ W/cm2 corresponds to an increase in temperature of only 0.13 mK/s without taking flow conditions into consideration. Moreover, the chip could be used for at least 7 cycles and stored for later use. Apart from photobleaching, we have no reason to assume more cycles would be hampered by our choice of method.
To demonstrate that our technique is compatible with biomolecules and their function, streptavidin (SAv) binding to a biotinylated SLB was studied in situ, a commonly used model system. To this end, the SLB was doped with 1 mol % of biotinyl-PE to allow for binding of fluorescently labeled SAv.
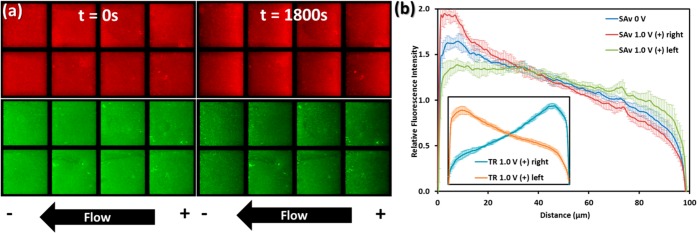
As an internal control 0.2 mol % of TR-DHPE was included as well. The formation of the biotinylated SLB and fluidity on the chip were confirmed with FRAP (see Supporting Figure S6). Subsequently, Alexa488-labeled SAv was flown through the device and allowed to interact with the biotin groups present on the SLB. Due to the increased hydrodynamic volume of SAv compared to TR-DHPE we observed migration of the SAv due to shear stress from bulk flow of 0.5 mM FcCH2OH, an effect not observed for TR-DHPE (see Supporting Figure S7). This phenomenon has recently been utilized for separation of SLB-bound SAv under flow conditions.20 As a consequence, lower flow speeds were adopted to minimize this effect while applying a potential, e.g. 10 μL/min instead of 100 μL/min. The fluorescent micrographs before and after applying 1 V for 30 min with corresponding profile plots are presented in Figure 4a and 4b, respectively. As can be observed from Figure 4a, the continuous flowing of 0.5 mM FcCH2OH and redox cycling do not affect the binding of SAv to the SLB as illustrated by the continuous presence of the protein. The observation that ferrocene is not hampering the function of proteins is in agreement with literature where e.g. ferrocene moieties have been conjugated to proteins that remained functional irrespective of redox cycling.21,22 In addition, electrophoretic migration and switching of TR-DHPE was observed during the experiment, Figure 4b inset. The build-up of TR-DHPE is slower in comparison to the profiles in Figure 3b. Presumably, the association of biotinyl lipids to SAv slows down the SLB diffusion kinetics and as a result shifts the steady state of the system. Based on literature findings and the dye substitution (1.6 dyes/molecule) of the SAv molecule, limited mobility toward the cathode can be expected.11,23 Figure 4b illustrates that SAv build-up could be tuned by applying a potential of 1 V and altering the polarity of the electrodes even though the effect of flow was present.
Figure 4.

(a) Fluorescent micrographs of TR-DHPE (red) and SAv Alexa488 (green) before and after applying 1.0 V for 30 min under a continuous flow of 0.5 mM FcCH2OH. (b) Graph showing the relative SAv Alexa488 fluorescence intensity, before and after 1.0 V for 30 min and upon reversing the polarity of the electrodes. Inset shows the relative TR-DHPE fluorescence intensity as an internal control during the experiments. Data are presented as mean ± SD.
In summary, a novel method has been demonstrated that prevents electrolysis of water through the addition of an electroactive species. This is an important achievement because this allows for the use of unprecedented low potentials in μSLB electrophoresis. Additionally, simple approximations accurately describe the processes at play during electrophoresis in the SLB. Since the direction of electrophoretic motion can be modulated, this technique is suitable not only for DC applications but also for AC surface ratchet applications.16,17 Our method is not limited to the use of FcCH2OH. Any water-soluble electroactive species with similar voltammetric characteristics can potentially be used when inert to the SLB and analyte. Most noteworthy, the achieved results show no water electrolysis, negligible joule heating, and no bubble formation; require only low flow speeds; and show compatibility with biomolecules. These characteristics permit further downscaling of analytical devices. Therefore, we believe our method will be beneficial to further the field of SLB electrophoresis for biosensing, diagnostics, and membrane protein studies, which require sorting and concentration of charged membrane components.
Acknowledgments
J.v.W., M.K., and P.J. thank NanoNextNL (program 6C11). S.K. and J.H. thank the Council for Chemical Sciences of The Netherlands Organization for Scientific Research (Vici Grant 700.58.443). P.J. also acknowledges the European Research Council for Starters Grant Sumoman 259183.
Supporting Information Available
Experimental procedures, chip fabrication, SLB formation, and data analysis. This material is available free of charge via the Internet at http://pubs.acs.org.
Author Contributions
∥ These authors contributed equally.
The authors declare no competing financial interest.
Supplementary Material
References
- Schiller S. M. In Handbook of Biofunctional Surfaces; Knoll W., Ed.; Pan Stanford Publishing Pte. Ltd.: Singapore, 2013; Chapter 18. [Google Scholar]
- Malinova V.; Nallani M.; Meier W. P.; Sinner E. K. FEBS Lett. 2012, 586, 2146. [DOI] [PubMed] [Google Scholar]
- Tamm L. K.; Mcconnell H. M. Biophys. J. 1985, 47, 105. [DOI] [PMC free article] [PubMed] [Google Scholar]
- Sackmann E. Science 1996, 271, 43. [DOI] [PubMed] [Google Scholar]
- Salaita K.; Nair P. M.; Petit R. S.; Neve R. M.; Das D.; Gray J. W.; Groves J. T. Science 2010, 327, 1380. [DOI] [PMC free article] [PubMed] [Google Scholar]
- Nair P. M.; Salaita K.; Petit R. S.; Groves J. T. Nat. Protoc. 2011, 6, 523. [DOI] [PMC free article] [PubMed] [Google Scholar]
- Groves J. T.; Boxer S. G. Biophys. J. 1995, 69, 1972. [DOI] [PMC free article] [PubMed] [Google Scholar]
- Groves J. T.; Boxer S. G.; McConnel H. M. Proc. Natl. Acad. Sci. U.S.A. 1997, 94, 13390. [DOI] [PMC free article] [PubMed] [Google Scholar]
- Groves J. T.; Ulman N.; Boxer S. G. Science 1997, 275, 651. [DOI] [PubMed] [Google Scholar]
- Grogan M. J.; Kaizuka Y.; Conrad R. M.; Groves J. T.; Bertozzi C. R. J. Am. Chem. Soc. 2005, 127, 14383. [DOI] [PubMed] [Google Scholar]
- Han X.; Cheetham M. R.; Sheikh K.; Olmsted P. D.; Bushby R. J.; Evans S. D. Integr. Biol. 2009, 1, 205. [DOI] [PubMed] [Google Scholar]
- Lee Y. K.; Nam J. M. Small 2012, 8, 832. [DOI] [PubMed] [Google Scholar]
- Pace H. P.; Sherrod S. D.; Monson C. F.; Russell D. H.; Cremer P. S. Anal. Chem. 2013, 85, 6047. [DOI] [PMC free article] [PubMed] [Google Scholar]
- Ammam M.; Fransaer J. Electroanalysis 2011, 23, 755. [Google Scholar]
- Monson C. F.; Pace H. P.; Liu C.; Cremer P. S. Anal. Chem. 2011, 83, 2090. [DOI] [PMC free article] [PubMed] [Google Scholar]
- Cheetham M. R.; Bramble J. P.; McMillan D. G. G.; Krzeminski L.; Han X.; Johnson B. R. G.; Bushby R. J.; Olmsted P. D.; Jeuken L. J. C.; Marritt S. J.; Butt J. N.; Evans S. D. J. Am. Chem. Soc. 2011, 133, 6521. [DOI] [PubMed] [Google Scholar]
- Bao P.; Cheetham M. R.; Roth J. S.; Blakeston A. C.; Bushby R. J.; Evans S. D. Anal. Chem. 2012, 84, 10702. [DOI] [PubMed] [Google Scholar]
- Daniel S.; Diaz A. J.; Martinez K. M.; Bench B. J.; Albertorio F.; Cremer P. S. J. Am. Chem. Soc. 2007, 129, 8072. [DOI] [PMC free article] [PubMed] [Google Scholar]
- Bockris J. O. M.; Reddy A. K. N.. Modern Electrochemistry 1 – Ionics, 2nd ed.; Kluwer Academic Publishers: New York, 2002; Vol. 1. [Google Scholar]
- The geometric approximation does not apply when scaling down the system or in absence of electrolysis because it neglects the influence of the concentration of the electro-active species.
- Hu S.-K.; Hsiao S.-W.; Mao H.-Y.; Chen Y.-M.; Chang Y.; Chao L. Sci. Technol. Adv. Mater. 2013, 14, 044408. [DOI] [PMC free article] [PubMed] [Google Scholar]
- Yang L.; Gomez-Casado A.; Young J. F.; Nguyen H. D.; Cabanas-Danés J.; Huskens J.; Brunsveld L.; Jonkheijm P. J. Am. Chem. Soc. 2012, 134, 19199. [DOI] [PubMed] [Google Scholar]
- Wasserberg D.; Uhlenheuer D.; Neirynck P.; Cabanas-Danés J.; Schenkel J.; Ravoo B.; An Q.; Huskens J.; Milroy L.-G.; Brunsveld L.; Jonkheijm P. Int. J. Mol. Sci. 2013, 14, 4066. [DOI] [PMC free article] [PubMed] [Google Scholar]
- Monson C. F.; Pace H. P.; Liu C.; Cremer P. S. Anal. Chem. 2011, 83, 2090. [DOI] [PMC free article] [PubMed] [Google Scholar]
Associated Data
This section collects any data citations, data availability statements, or supplementary materials included in this article.


