Abstract
Voltage sensors (VSs) initiate the pore opening and closure in voltage-gated ion channels. Here, we propose a technique for estimation of the equilibrium constant of the up- and downward VS movements and rate constants of pore transitions from macroscopic current kinetics. Bell-shaped voltage dependence of the activation/deactivation time constants and Bolzmann distributions of CaV1.2 activation were analyzed in terms of a circular four-state (rest, activated, open, deactivated) channel model: both dependencies uniquely constrain the model parameters. Neutralization of gating charges in IS4 or IIS4 only slightly affects the equilibrium constant of VS transition while affecting simultaneously the rate constants of pore opening and closure. The application of our technique revealed that pore mutations on IS6–IVS6 segments induce pronounced shifts of the VS equilibrium between the resting (down) and activated (up) position. Analyzing a channelopathy mutation highlighted that the leftward shift of the activation curve induced by I781T on IIS6 is only partially (35 %) caused by a destabilization of the channel pore but predominantly (65 %) by a shifted VS equilibrium towards activation. The algorithm proposed for CaV1.2 may be applicable for calculating rate constants from macroscopic current kinetics in other voltage-gated ion channels.
Electronic supplementary material
The online version of this article (doi:10.1007/s00424-013-1319-8) contains supplementary material, which is available to authorized users.
Keywords: Calcium channel, Kinetic model, Channel pore, Voltage sensor, Gating mechanism
Introduction
Hodgkin and Huxley [17] hypothesized that changes in the membrane voltages move charged particles (gating particles), leading to channel opening. This charge movement was later directly measured as gating current in several ion channels [1, 7]. Structure–function studies of pore-forming subunits of NaV, CaV, and KV have led to the identification of their principal functional domains. In CaV1.2, the pore-forming α1-subunit is composed of four homologous domains (I–IV). Each domain consists of six transmembrane α helices (S1 through S6). The S1–S4 segments form the voltage-sensing domain, and transmembrane segments S5 and S6 form the channel pore and the selectivity filter [8, 21]. Voltage sensors in CaV1.2 contain four to six basic amino acids (arginines or lysines). In analogy to other voltage-gated channels, it is assumed that the movement of charge-carrying S4 segments initiates the opening and closure of the activation gates, which are formed by the intracellular thirds of the S6 segments [11, 19]. A fundamental and still unanswered question is how these movements of charged residues are mechanically coupled to opening and closure of the channel pore.
We have recently reported that in CaV1.2, a highly conserved structure motif on S6 segments (“GAGA ring”: G432 in IS6, A780 in IIS6, G1193 in IIIS6, and A1503 in IVS6) is energetically coupled to the voltage sensor IIS4 [3].
Here, we propose a hybrid stochastic–deterministic algorithm for quantification of molecular interactions between pore domains and voltage sensors. Rate constants of the pore opening and closure and the voltage sensor (VS) distribution between the resting and activated states were estimated from bell-shaped dependences of the activation time constants and the steady state activation curves. That way, our approach ensures model identifiability and differs from more common parameter estimation approaches for ion gating models which attempt to identify rate constants directly from microscopic or macroscopic gating currents [2, 5, 6, 9, 14].
Our analysis revealed that mutations in the channel pore (e.g., the GAGA ring or mutation I781T that is homologous to a channelopathy mutation in CaV1.4, I745T) shift the VS distribution from rest (down) to the activated (up) state. Partial or complete neutralization of the IS4 and IIS4 charges had only minor effects on current kinetics and correspondingly small effects on the rate constants of channel state transitions.
Materials and methods
Experimental procedures
Mutagenesis
The CaV1.2 α1-subunit coding sequence (GenBankTM X15539) in-frame 3′ to the coding region of a modified green fluorescent protein (GFP) was kindly donated by Dr. M. Grabner [13]. For electrophysiological studies, we used the plasmid lacking the GFP tag. Substitutions in segment IS4 and IIS4 of the CaV1.2 α1-subunit were introduced using the QuikChange® Lightning site-directed mutagenesis kit (Stratagene) with mutagenic primers. Mutations were introduced in segment IS4 (K264Q/R267Q/R270Q/R273Q) and in helix IIS4 (R650Q, R653Q, R656Q, K659Q, R662Q). All constructs were checked by restriction site mapping and sequencing.
Cell culture and transient transfection
Human embryonic kidney tsA-201 cells were grown at 5 % CO2 and 37 °C to 80 % confluence in Dulbecco's modified Eagle's/F-12 medium supplemented with 10 % (v/v) fetal calf serum and 100 units/ml penicillin/streptomycin. Cells were split using trypsin/EDTA and plated on 35-mm petri dishes (Falcon) at 30–50 % confluence ~16 h before transfection. Subsequently, tsA-201 cells were co-transfected with cDNAs encoding wild-type or mutant CaV1.2 α1-subunits with auxiliary β1a as well as α2-δ1-subunits. Transfection of tsA-201 cells was done using the FUGENE6 Transfection Reagent (Roche) following standard protocols.
Ionic current recordings and data acquisition
Barium currents (I Ba) through voltage-gated Ca2+ channels were recorded at 22–25 ° C using the patch clamp technique [15] with an Axopatch 200A patch clamp amplifier (Axon Instruments, Foster City, CA, USA) 36–48 h after transfection. The extracellular bath solution contained 5 mM BaCl2, 1 mM MgCl2, 10 mM HEPES, and 140 mM choline Cl, titrated to pH 7.4 with methanesulfonic acid. Patch pipettes with resistances of 1 to 4 MΩ were made from borosilicate glass (Clark Electromedical Instruments, UK) and filled with pipette solution containing 145 mM CsCl, 3 mM MgCl2, 10 mM HEPES, and 10 mM EGTA, titrated to pH 7.25 with CsOH. All data were digitized using a DIGIDATA 1200 interface (Axon Instruments, Foster City, CA, USA), smoothed by means of a four-pole Bessel filter, and stored on a computer hard disc. Current traces of 100 ms were sampled at 10 kHz and filtered at 5 kHz. For the steady state inactivation protocol, currents were sampled at 1 kHz and filtered at 0.5 kHz; tail currents were sampled at 50 kHz and filtered at 10 kHz. Leak currents were subtracted digitally using average values of scaled leakage currents elicited by a 10-mV hyperpolarizing pulse, or electronically by means of an Axopatch 200 amplifier (Axon Instruments, Foster City, CA, USA). Capacity currents were not subtracted. When the pipettes were filled with pipette solution, their input resistance ranged between 1 and 4 MΩ. The mean cell capacity was 30 ± 5 pF (n = 14). The mean series resistance was 4.8 ± 2.2 MΩ. It was compensated (60–85 % compensation) by the following procedure: the depth of the positive feedback was gradually increased until oscillations (small overcompensation) appeared. Even in large cells, the time constant of the capacity current (τcapacity) did not exceed ≈0.25 ms (4 MΩ × 60 pF = 240 μs). The early current phase was excluded from data processing (at least 3 × τcapacity ≈ 0.75 ms); hyperpolarizing voltages < -100 mV were not applied.
Data processing
The pClamp software package (version 7.0, Axon Instruments, Foster City, CA, USA) was used for data acquisition and preliminary analysis. The time course of current activation was fitted to a mono-exponential function: , where I(t) is the current at time t, a o is the amplitude coefficient, τ is the time constant, and C is the constant. Data are given as mean ± SE. Voltage dependences of the steady state activation and time constants of activation and deactivation were then used for the identification of the parameters of a four-state model.
Simulation of current traces
Currents were simulated with the four-state model making use of the estimated rate constants and a reversal potential of 48 mV.
Results
Four-state model
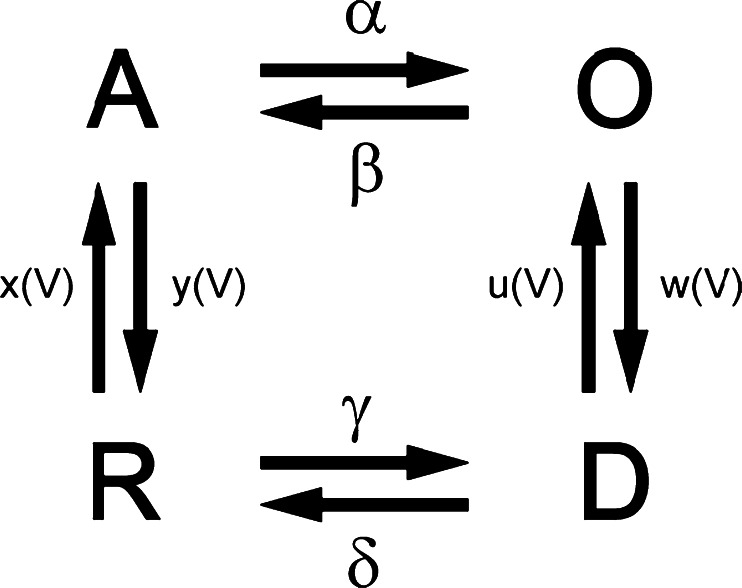
In Beyl et al. [4], we introduced a circular four-state gating model that features different pathways for activation and deactivation in CaV1.2 (Scheme 1). According to this model, activation gating is determined by two functionally separate processes: a voltage-sensing mechanism and the conducting pore. Each functional unit can dwell in two states: the voltage sensor in the resting (down) and activated (up) states, and the pore in the open or closed states. The entire molecule therefore dwells in 2 × 2 = 4 states: the pore is closed and the voltage-sensing mechanism locks the pore (R); the voltage-sensing mechanism is activated and releases the pore (A), which, however, remains closed; the pore is open (O); and the deactivated voltage-sensing mechanism is in the down position while the pore is still open (D). The state transitions are described by the law of mass action, with voltage-dependent rates for the voltage-sensing mechanism (transitions between resting-closed (R) and activated-closed (A) states and transitions between open (O) and deactivated-open (D)) and voltage-independent rates for pore opening and closure (transitions A–O and D–R).
Scheme 1.
The four-state gating model. Transitions of the voltage sensing machinery (R–A and O–D) are voltage dependent, whereas transitions of the pore opening and closure (A–O and R–D) are voltage independent
This description of the calcium current activation is a simplification. Activation (R ↔ A) of the voltage sensor comprising four charge-carrying S4 segments is not a single step but can be imagined as a multiexponential process. During activation, each of the four VSs can dwell in either the resting (down) or activated (up) state, resulting in 16 individual combinations (IS4-up/IIS4-down/IIIS4-down/IVS4-down, IS4-up/IIS4-up/IIIS4-down/IVS4-down, etc.). The activation of CaV1.2 is, however, predominantly mono-exponential, suggesting that the concerted pore opening (A–O) is a rate-limiting stage. We have therefore lumped together the potential transitions between intermediate states.
In our first attempt to estimate all eight rate constants for an individual channel construct, the experimental data did not allow us to find a unique solution [4]. Several parameter combinations were able to explain the observed steady state activation and activation/deactivation time constants equally well. Therefore, parameter estimations for Scheme 1 in Beyl et al. [4] were performed for 16 channel constructs simultaneously.
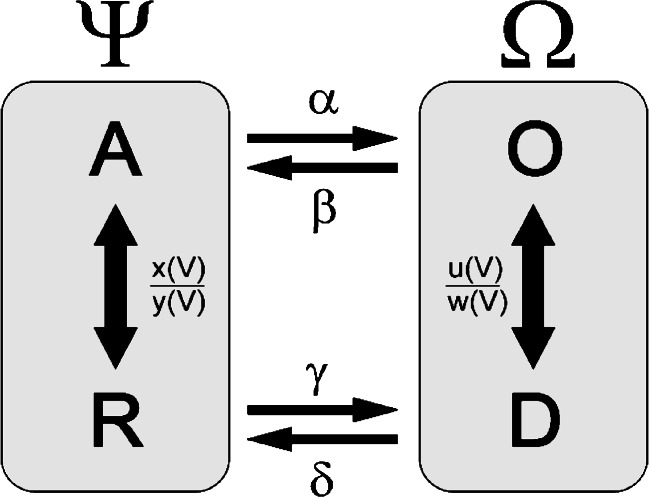
Here, we estimate the rate constants of individual constructs by reducing the complexity of the model, assuming a quasi-equilibrium in both voltage-dependent state transitions (Scheme 2) .
Scheme 2.
Simplified four-state gating model. Psi represents the closed (activated and deactivated) states and Omega the open (activated and deactivated) states. Transitions A–R and O–D are quasi-equilibrated
We denote the fraction of closed channels Ψ = A + R and the fraction of open channels Ω = O + D.
Under these asumptions, the fraction of open channels (Ω = O + D) is
Inverse problem approach for identification of model parameters
Given a set of candidate parameters q = (k s,K VS,α,β,γ,δ), the reduced model predicts the (normalized) steady state activation m ∞ at test voltages V 1 ∞,…, V k ∞ and the time constants of activation and deactivation for the test voltages V 1 τ,…, V n τ by evaluation of the nonlinear parameter-to-output map
A comparison of the model prediction F(q) with the data m ∞,1,…, m ∞,k, τ 1,…,τ n is then obtained by the weighted least squares expression
| 1 |
For the estimation of the model parameters (Scheme 2), we applied a hybrid stochastic–deterministic optimization approach in which we combined an evolutionary search strategy with a local gradient-based minimization routine (see [12] for a general introduction to nonlinear inverse problems). Using a genetic algorithm with a population size of 100, we created dozens of generations and after initial guess for a local sequential quadratic programming algorithm, finally producing a candidate solution q. To avoid detecting a merely local minimizer, we repeated this procedure a thousand times and obtained the candidate set Q C = {q 1, …,q 1,000}.
Out of this set, we first picked the best individual q*, i.e., .
Next, we collected all candidates that fitted the data with comparable quality and built the solution set Q S = {q ∈ Q C : ‖data − F(q)‖ ≤ 1.1 ⋅ ‖data − F(q *)‖}.
Finally, we calculated the mean parameter vector along with the standard error of the mean (to be understood in the component-wise sense). This procedure was applied for the individual data sets of the wild type and mutants (Table 1). In all cases, the number |Q s| of elements in the solution set was more than 100. The small standard errors obtained gave confidence in the unambiguity of the inferred parameters and made additional measures for the avoidance of overfitting unnecessary. All computations were done using MATLAB optimization toolboxes. The gradient information for the local search algorithm was provided by analytically building the Jacobian matrix F′(q) of F in order to avoid error-prone and computationally costly finite differencing.
Table 1.
Midpoints (V 0.5) of the activation curves and rate constants of four-state model
| V 0.5 (mV) | α | β | γ | δ | K VS (x 0/y 0) | |
|---|---|---|---|---|---|---|
| Construct | ||||||
| WT | −18.8 ± 0.9 (n = 9) | 0.472 ± 0.002 | 0.263 ± 0.001 | 0.020 ± 10−4 | 1.358 ± 10−4 | 4.57 ± 0.02 |
| R650Q | −22.9 ± 0.8 (9) | 0.219 ± 0.003 | 0.124 ± 0.002 | 0.026 ± 0.001 | 0.550 ± 0.001 | 9.42 ± 0.17 |
| R653Q | −18.5 ± 0.8 (9) | 0.747 ± 10−4 | 0.235 ± 10−4 | 0.027 ± 10−4 | 0.732 ± 10−4 | 1.82 ± 10−3 |
| R656Q | −21.1 ± 0.8 (6) | 0.953 ± 10−4 | 0.106 ± 10−4 | 0.041 ± 10−4 | 0.865 ± 10−4 | 1.48 ± 10−3 |
| K659Q | −17.7 ± 0.8 (6) | 0.364 ± 0.005 | 0.164 ± 0.002 | 0.025 ± 10−4 | 2.230 ± 0.002 | 1.65 ± 0.03 |
| R662Q | −8.4 ± 1.3 (6) | 0.637 ± 10−4 | 0.247 ± 10−4 | 0.020 ± 10−4 | 0.968 ± 10−4 | 1.07 ± 10−3 |
| IIS4N | −17.5 ± 0.8 (11) | 0.629 ± 10−4 | 0.241 ± 10−4 | 0.043 ± 10−4 | 1.176 ± 10−4 | 1.80 ± 10−3 |
| IS4N-1 | −24.4 ± 0.7 (5) | 0.267 ± 0.001 | 0.164 ± 10−4 | 0.009 ± 10−4 | 0.453 ±2 × 10⁻⁴ | 5.46 ± 0.03 |
| Pore mutations a | ||||||
| G432W | −33.7 ± 0.6 (8) | 0.298 ± 10−4 | 0.046 ± 10−4 | 0.0003 ± 10−5 | 0.431 ± 10−4 | 30.35 ± 0.04 |
| V433C | −8.2 ± 0.8 (5) | 0.483 ± 10−4 | 0.051 ± 10−4 | 0.024 ± 10−4 | 1.001 ± 10−4 | 0.29 ± 10−3 |
| A780T | −44.0 ± 0.6 (5) | 0.254 ± 10−4 | 0.036 ± 10−4 | 0.004 ± 10−4 | 0.329 ± 10−4 | 67.33 ± 0.15 |
| I781T | −47.1 ± 0.9 (5) | 0.389 ± 10−4 | 0.046 ± 10−4 | 0.005 ± 10−4 | 0.687 ± 10−4 | 23.24 ± 10−3 |
| G1193T | −49.8 ± 1.0 (7) | 0.479 ± 0.001 | 0.060 ± 10−4 | 0.002 ± 10−4 | 0.581 ± 0.005 | 199.79 ± 3.12 |
| F1194C | −6.8 ± 0.9 (5) | 1.254 ± 10−4 | 0.067 ± 10−4 | 0.110 ± 10−4 | 0.550 ± 10−4 | 0.11 ± 10−3 |
| A1503G | −41.4 ± 0.8 (5) | 0.452 ± 10−4 | 0.039 ± 10−4 | 0.015 ± 10−4 | 0.451 ± 10−4 | 27.51 ± 0.07 |
| V1504T | −11.6 ± 0.7 (7) | 0.803 ± 10−4 | 0.063 ± 10−4 | 0.138 ± 10−4 | 0.562 ± 10−4 | 0.57 ± 10−3 |
| Pore mutations/IIS4N a | ||||||
| G432W/IIS4N | −19.3 ± 0.7 (8) | 0.425 ± 10−4 | 0.119 ± 10−4 | 0.017 ± 10−4 | 0.608 ± 10−4 | 2.52 ± 10−3 |
| V433C/IIS4N | −12.4 ± 0.7 (7) | 0.801 ± 10−4 | 0.100 ± 10−4 | 0.030 ± 10−4 | 0.757 ± 10−4 | 0.38 ± 10−3 |
| A780T/IIS4N | −32.0 ± 0.7 (10) | 0.497 ± 10−4 | 0.028 ± 10−4 | 0.003 ± 10−4 | 0.288 ± 10−4 | 6.70 ± 10−3 |
| I781T/IIS4N | −54.8 ± 0.6 (9) | 0.299 ± 10−4 | 0.052 ± 10−4 | 0.006 ± 10−4 | 0.198 ± 10−4 | 200 |
| G1193T/IIS4N | −20.8 ± 0.7 (5) | 0.465 ± 0.004 | 0.122 ± 0.001 | 0.004 ± 10−4 | 0.804 ± 0.001 | 2.03 ± 0.03 |
| F1194C/IIS4N | −5.7 ± 0.9 (5) | 0.713 ± 10−4 | 0.100 ± 10−4 | 0.130 ± 10−4 | 0.728 ± 10−4 | 0.24 ± 10−3 |
| A1503G/IIS4N | −19.8 ± 0.7 (6) | 0.357 ± 0.002 | 0.173 ± 0.001 | 0.003 ± 10−4 | 0.648 ± 10−4 | 2.76 ± 0.02 |
| V1504T/IIS4N | −14.0 ± 0.9 (5) | 0.531 ± 10−4 | 0.094 ± 10−4 | 0.030 ± 10−4 | 0.537 ± 10−4 | 1.08 ± 10−3 |
Numbers of experiments are indicated in parentheses
a V 0.5 data from Beyl et al. [3]
Estimation of gating parameters of CaV1.2 with neutralized IIS4
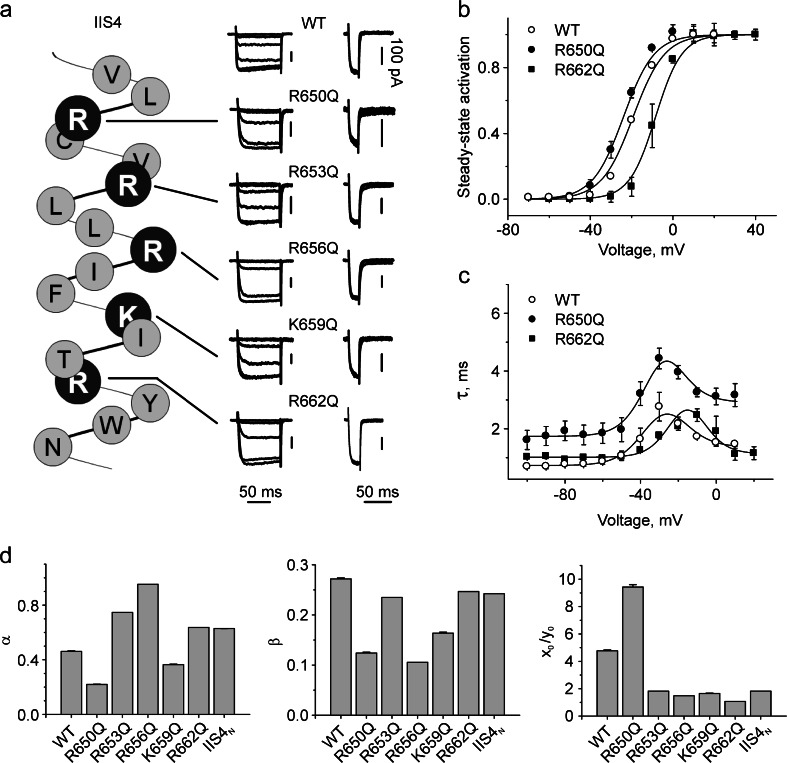
The location of the individual arginines and lysine in segment IIS4 (R650, R653, R656, K659, R662, which we refer to as R1–R5) is illustrated in Fig. 1. Neutralization of either single charges (R1Q, R2Q, R3Q, R4Q, or R5Q) or even all IIS4 charges induces surprisingly small changes in CaV1.2 currents (Fig. 1, Table 1; see also Beyl et al. [3]). The activation curves were shifted in hyperpolarizing or depolarizing directions. The largest leftward (ΔV = − 4.1 ± 1.2 mV) and rightward (ΔV = + 10.3 ± 1.6 mV) shifts were observed for R650Q and R662Q mutations, while other constructs produced negligible changes in channel gating (see Table 1). The corresponding bell-shaped dependencies of the activation/deactivation time constants on the membrane potential are shown in Fig. 1.
Fig. 1.
Effects of charge-neutralizing mutations in segments IIS4 on CaV1.2 gating. a The left panel shows an α-helical representation of the amino acid sequence of segment IIS4 of the α1-1.2 subunit. Substituted (positively charged) residues are shown in black. The middle panel shows representative families of I Ba through wild-type and mutant channels starting from threshold potential (−50 mV). Barium currents were evoked during depolarizing test pulses from a holding potential of −100 mV (increments, 10 mV). The right panel shows representative tail currents of wild-type and mutant channels. Currents were activated during a 20-ms conditioning repolarization to 0 mV. Deactivation was recorded during subsequent repolarizations with 10-mV increments, starting from −100 mV. Vertical scale bars represent 100 pA. b, c Voltage dependences of steady state activation of mutations R650Q and R662Q inducing the largest leftward ΔV 0.5(R650Q) = − 4.1 ± 1.2 mV or rightward ΔV 0.5(R662Q) = 10.3 ± 1.6 mV shifts compared to wild type (B) and time constants of activation/deactivation (C) of the indicated channel construct. Solid lines represent model simulations based on the identified model parameters (see Table 1). d Rate constants of channel opening and closure (alpha, beta, x 0/y 0) for WT and single charge neutralizations in segment IIS4
Making use of the parameter estimation technique described above, the experimental data (steady state and kinetics) were fitted by Scheme 2 (see Fig. 1 and Table 1 for mean values and square errors). R650Q, which induced the largest shift of the activation curve to the left and the strongest deceleration of current kinetics, is characterized by a twofold increase of K VS (K VS = x 0/y 0, voltage sensor equilibrium towards the activated state), while R662Q, which induced the largest shift to the right (Fig. 1b) decreased K VS about fourfold, which suggests a shift of the voltage sensor distribution towards the resting position. The changes in α and β result in an open probability close to the wild type (p 0 = α/(α + β) = 0.64) with p 0 = 0.64 for R650Q and 0.72 for R662Q. The simultaneous decrease of α and β for R650Q and increase for mutant R662Q would explain the acceleration and deceleration in the current kinetics (Fig. 1c).
Effects of charge neutralization in segment IS4
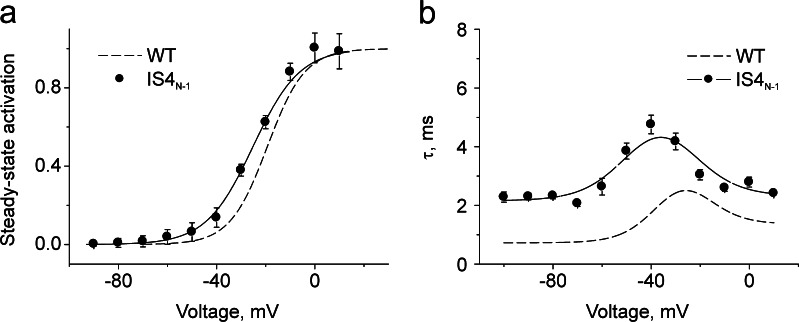
We have previously reported that the complete neutralization of the charges in segment IS4 either suppresses CaV1.2 expression or leads to a non-conducting channel construct [3]. In order to analyze the impact of the charges of IS4 on CaV1.2 gating, we designed construct IS4N-1 where charge (R276) at the inner end of IS4 was preserved. Construct IS4N-1 was functional (see Fig. 2) and displayed mean voltages of half activation close to the wild type and increased activation/deactivation time constants by about 1–2 ms (Fig. 2). The rate constants of pore gating α, β, γ, δ, and K VS are given in Table 1.
Fig. 2.
Neutralization of charges in segments IS4. Voltage dependences of steady state activation of construct IS4N-1 (K264Q/R267Q/R270Q/R273Q) inducing the leftward ΔV 0.5 = − 5.6 ± 1.1 mV shift compared to wild type (a) and time constants of activation/deactivation (b) of the indicated channel construct. Solid lines represent model simulations based on the identified model parameters (see Table 1)
Application of parameter estimation technique to mutations in the channel pore
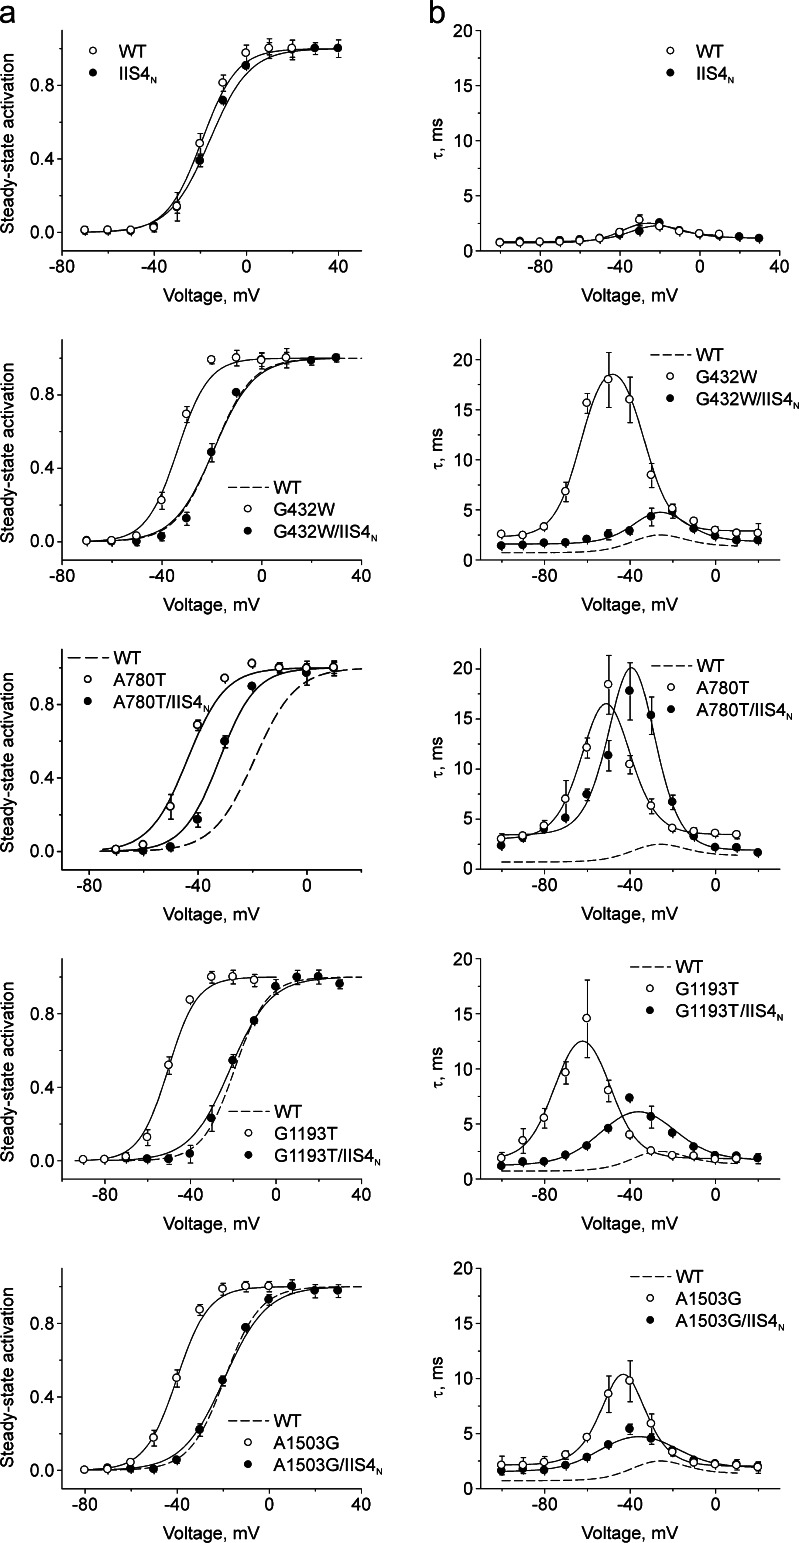
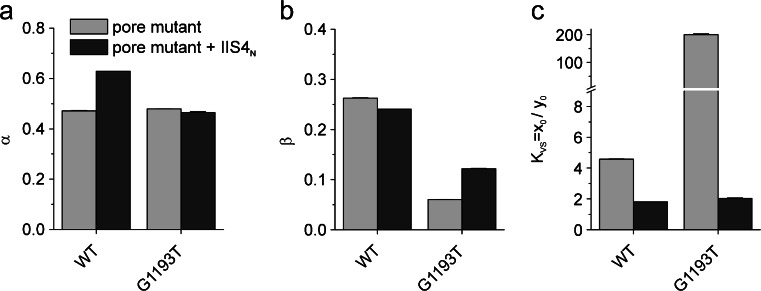
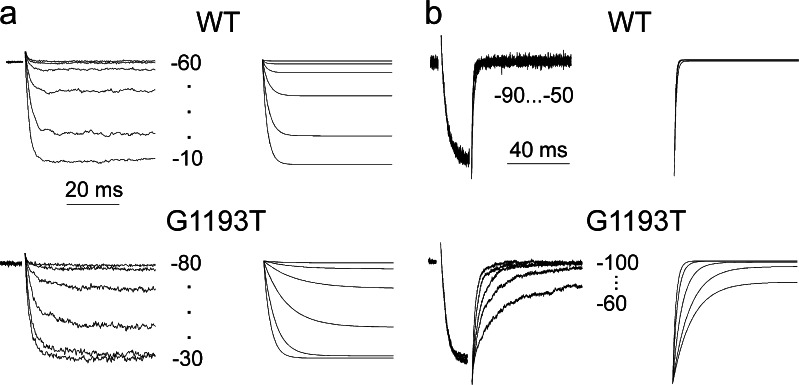
Our previous studies highlight an essential role of conserved S6 residues (GAGA ring: G432W in IS6, A780T in IIS6, G1193T in IIIS6, and A1503G in IVS6) in the opening and closure mechanism of CaV1.2 [3, 10]. Mutations of these residues in all four S6 segments induce strong leftward shifts of activation curves and decelerate channel deactivation (Fig. 3). Application of the algorithm for parameter identification revealed a common major gating disturbance induced by all four GAGA mutations: a more than tenfold increase in the equilibrium constant K VS (Fig. 5c). In frame of Scheme 2, this may reflect either a reduction of the downward VS movement, a facilitation of the upward movement, or both. Current simulations, based on estimated rate constants (Table 1), for wild type (WT) and the GAGA mutation with the largest gating disturbance (G1193T) are illustrated in Fig. 4.
Fig. 3.
Pore and voltage sensor mutations: experimental data and model fit. a Voltage dependences of steady state activation. b Time constants of activation and deactivation of the indicated channel constructs. Solid lines represent model simulations based on the identified model parameters (see Table 1)
Fig. 5.
Effects of complete IIS4 neutralization on model parameters. Rate constants of channel opening and closure (a alpha, b beta, and c K VS = x 0/y 0) for WT/mutant pore (light gray) and their combination with complete charge neutralization in segment IIS4 (dark gray)
Fig. 4.
Recorded and simulated currents. a I Ba through wild-type and G1193T channels (left column) during depolarization from −100 mV to the indicated voltages and corresponding current simulations (right column). b Representative tail currents of wild-type and G1193T channels (left column) and corresponding simulations (right column). The simulated currents were calculated from the full four-state model (Scheme 2) making use of the estimated rate constants (Table 1) and a reversal potential of 48 mV
We have previously shown that neutralization of the IIS4 charges in CaV1.2 rescues gating distortions caused by positional specific pore mutations (GAGAmut/IIS4N [3]). A quantification of these interactions for mutation G1193T in frame of the four-state model revealed that the combination of G1193T (domain III) with IIS4N decreases K VS about 100-fold (moving the VS distribution towards wild type, Fig. 5c, Table 1).
The “channelopathy mutation” I781T on IIS6 affects voltage sensor transitions
Gating disturbances resulting from mutations one position downstream of the GAGA ring in domains I (V433C), III (F1194C), and IV (V1504T) caused significant downward shifts of the VS transitions (decrease in KVS = x 0/y 0 compared to WT, Table 1).
An exception is mutation I781T (homologous to the channelopathy mutation I745T in CaV1.4 [16]), which induced an increase in K VS (from 4.57 in WT to 23.24 in I781T, Table 1). The increase in K VS indicates that this amino acid substitution in segment IIS6 affects not only pore gating (pore gating rates α and β, Table 1) but additionally shifts the VS transitions (K VS, Table 1) towards the activated position.
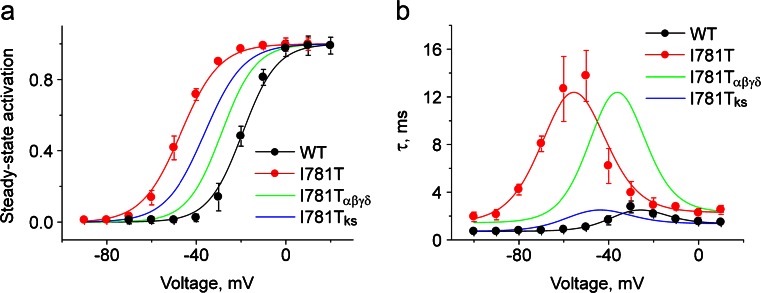
A simulation reveals that ~10 mV of the 28-mV shift of the steady state activation (35 %) curve is caused by changes in pore stability (αwt(0.47 ms−1) → αI781T(0.39 ms−1) and β wt(0.26 ms−1) → β I781T(0.046 ms−1)). Most of the left shift (about 18 mV or 65 %) can be attributed to the fivefold increase in the voltage sensor equilibrium constant (K VS(WT) = 4.57 → K VS(I781T) = 23.24). This is shown in Fig. 6 displaying the simulated steady state activation curves and activation/deactivation kinetics by means of Eqs. 1 and 2 (see Online Resource 1).
Fig. 6.
Simulation of the impact of I781T on pore stability and voltage sensor movements. Voltage dependences of steady state activation (a), time constants of activation and deactivation (b) of the WT (black) and I781T (red) channel construct. Black and red solid lines represent model simulations based on the identified model parameters (see Table 1). The green line (I781Tαβγδ) represents model simulation based on α, β, γ, and δ estimated for I781T mutation and k s and K VS rate constants estimated for WT. The blue line (I781Tks) represents the model simulation based on k s and K VS estimated for the I781T mutation and α, β, γ, and δ rate constants estimated for WT. The simulation reveals that the leftward shift of the activation curve is only partially caused by a destabilization of the channel pore (≈35 %, green line) but predominantly by a shift of the VS equilibrium (≈65 %, blue line)
Discussion
In a preceding study, we developed a four-state circular gating model of CaV1.2 channel activation and deactivation. In this first attempt to estimate all eight rate constants (Scheme 1) the experimental data did not allow us to find a unique solution for individual channel constructs [4]. Here, we reduced the number of model parameters to six (Scheme 2) by assuming a quasi steady state of the VS distribution between their activated and resting positions.
A hybrid stochastic–deterministic technique (see Online Resource 1) was applied to calculate the gating parameters of the channel. The principal finding of our study is that the bell-shaped dependence of the time constants of channel activation/deactivation and the steady state activation curves can uniquely constrain the six parameters. This is reflected in the small parameter errors listed in Table 1 and also supported by the level set plots (Fig. 2 in Online Resource 1) for the objective function J (see Eq. 1). Closed curves of constant model behavior both for wild type and mutant around the computed minimizer indicate a parameter landscape with well-pronounced curvature and hence (at least local) parameter identifiability. This is also backed by the full rank of the Hessian matrices of J evaluated at the respective minimizers.
Effects of charge neutralization in voltage-sensing IS4 and IIS4 on rate constants
We have previously reported that CaV1.2 can have an almost normal gating with only three out of four VSs [3]. It was therefore interesting to analyze the sensitivity of K VS to changes in the number of S4 charges. Model parameters were estimated for (1) partial neutralization of IS4 (IS4N-1), complete neutralization of IIS4 changes and (2) individually neutralized IIS4 charges (Figs. 2 and 3). Neutralization of individual IIS4 charges shifted the activation curve either to the left (R650Q, Fig. 1b) and increased K VS (4.57 → 9.42) or to the right (R662Q, Fig. 1b) accompanied by a fourfold decrease in K VS (4.57 → 1.07, Fig. 1d). Such diverse effects of individual charge replacements in IIS4 indicate that the VSs apparently interact in a highly specific manner with surrounding residues. Thus, neutralization of charges in various positions might either contribute to stabilization or destabilization of the VSs in intermediate states (see [7] for review).
Rate constants and KVS provide insights into the gating machinery of CaV1.2
The drastic change in K VS caused by mutations in the GAGA ring (Table 1) exemplified for G1193T (Fig. 5) was a surprising observation. This increase in K VS from K VS(WT) = 4.57 to K VS(G1193T) = 199.79 may reflect at least four scenarios: (1) an acceleration of the upward movement of the S4 segments (increase in x 0), (2) a deceleration of the downward movement (decrease in y 0), (3) a retention of the VS in an upward position, and (4) a repulsion of the sensors from their down position caused by pore mutations. Acceleration and deceleration of the VS appear unlikely, as neither the net charge of S4 segments nor apparent interactions with the S4 surrounding segments were directly affected by the S6 mutations. A retention of VS in the up position would require long-range allosteric interactions between the inner channel mouth and distantly located S4 surrounding segments which also seems to be not likely. We hypothesize that these pore mutations disturb the return of the S4 segments into their resting (down) position (scenario 4).
Residues neighboring to GAGA do not interact with voltage sensor
As evident from Table 1, mutations in positions neighboring to the GAGA ring (V1504T, F1194C, V433C; see [3] for detailed description of these mutations) induce rather small shifts of activation curves with the exception of I781T (see below). None of these mutations induced a many-fold increase in K VS (as typical for GAGA ring mutations): The small changes in K VS suggest no or only minor interactions of these residues with the VS.
Interpreting a channelopathy mutation in terms of rate constants
Similar to mutations in the GAGA ring, mutation of the neighboring I781 in IIS6 causes a substantial shift in the VS transition towards the activated state (about fivefold increase of K VS, Table 1). Analyzing gating distortions in terms of rate constants enabled the interpretation of a channelopathy mutation I781T in CaV1.2 (homologous to I745T in CaV1.4, causing severe visual disorders including night blindness [16]). I781T in IIS6 causes a substantial shift in the VS transition towards the activated state (about fivefold increase of K VS, Table 1). Shifts of the activation curve (e.g., −35 mV by I781T, Fig. 6a) are traditionally interpreted as destabilization of the closed state and/or stabilization of the open channel state. The estimated gating parameters of I781T revealed, however, that only 10 mV (35 %) of the shift may be attributed to changes of the pore stability, while 18 mV (65 %) is apparently induced by changes in VS movement. The deceleration of the activation/deactivation is apparently determined by changes in pore stability (e.g., βWT = 0.263 → βI781T = 0.046; see also Fig. 6b).
In contrast to GAGA ring mutations, neutralization of IIS4 (construct I781T/IIS4N) did not reverse the shift of the activation curve but instead enhanced it. At first glance, these data suggest independent (additive) impacts of charge neutralization and pore mutations. The calculated upward shift of the VS distribution (see further increase in K VS, Table 1) reveals, however, that I781T affects the VSs in a fundamentally different manner than observed for GAGA ring mutations (exemplified in Fig. 5 for G1193T).
Conclusions and outlook
The characterization of gating disturbances in terms such as activation/deactivation time constants and steady state activation [17] does not provide sufficiently detailed insights into the underlying molecular events. Indeed, a shift of the steady state activation curve may reflect changes in opening and/or closure mechanisms, and the time constant of channel activation/deactivation depends on both the rate constants of channel opening and closure as well as on the rate constants of VS movements. Our analysis of CaV1.2 activation gating is based on both thermodynamic (steady state activation curve) and kinetic (activation/deactivation time constants) data.
Our model and inverse problem approach were developed for the quantification of voltage sensor movements and subsequent pore openings. The estimated gating parameters provide deeper insights into the gating machinery than qualitative descriptions in Hodgkin–Huxley terms such as steady state activation curves and time constants. We believe that this approach is applicable to study the gating in other channels.
Extending the model for adequate pathways of channel inactivation is a challenge for future studies. Hence, structure–activity studies in CaV1.2 have shown that pore mutations may either shift activation and inactivation in parallel [18, 20] or, alternatively, disrupt the link between both processes [10].
Electronic supplementary material
Below is the link to the electronic supplementary material.
(PDF 847 kb)
Acknowledgments
The research was funded by the Austrian Science Fund (FWF) grants P22600-B12 and P19614. Katrin Depil is a fellow of the graduate school program MolTag (Austrian Science Fund FWF-W1232).
Footnotes
S Beyl and P Kügler contributed equally to this work.
References
- 1.Armstrong CM, Bezanilla F. Currents related to movement of the gating particles of the sodium channels. Nature. 1973;242:459–461. doi: 10.1038/242459a0. [DOI] [PubMed] [Google Scholar]
- 2.Ball FG, Cai Y, Kadane JB, O'Hagan A. Bayesian inference for ion-channel gating mechanisms directly from single-channel recordings, using Markov chain Monte Carlo. Proc R Soc Lond A. 1999;455:2879–2932. doi: 10.1098/rspa.1999.0432. [DOI] [Google Scholar]
- 3.Beyl S, Depil K, Hohaus A, et al. Neutralisation of a single voltage sensor affects gating determinants in all four pore-forming S6 segments of CaV1.2: a cooperative gating model. Pflugers Arch - Eur J Physiol. 2012;464:391–401. doi: 10.1007/s00424-012-1144-5. [DOI] [PMC free article] [PubMed] [Google Scholar]
- 4.Beyl S, Kügler P, Kudrnac M, et al. Different pathways for activation and deactivation in CaV1.2: a minimal gating model. J Gen Physiol. 2009;134(231–241):S1–S2. doi: 10.1085/jgp.200910272. [DOI] [PMC free article] [PubMed] [Google Scholar]
- 5.Burger M. Inverse problems in ion channel modelling. Inverse Problems. 2011;27:083001. doi: 10.1088/0266-5611/27/8/083001. [DOI] [Google Scholar]
- 6.Cannon RC, D'Alessandro G. The ion channel inverse problem: neuroinformatics meets biophysics. PLoS Comput Biol. 2006;2:e91. doi: 10.1371/journal.pcbi.0020091. [DOI] [PMC free article] [PubMed] [Google Scholar]
- 7.Catterall WA. Ion channel voltage sensors: structure, function, and pathophysiology. Neuron. 2010;67:915–928. doi: 10.1016/j.neuron.2010.08.021. [DOI] [PMC free article] [PubMed] [Google Scholar]
- 8.Catterall WA, Perez-Reyes E, Snutch TP, Striessnig J. International Union of Pharmacology. XLVIII. Nomenclature and structure–function relationships of voltage-gated calcium channels. Pharmacol Rev. 2005;57:411–425. doi: 10.1124/pr.57.4.5. [DOI] [PubMed] [Google Scholar]
- 9.Celentano JJ, Hawkes AG. Use of the covariance matrix in directly fitting kinetic parameters: application to GABAA receptors. Biophys J. 2004;87:276–294. doi: 10.1529/biophysj.103.036632. [DOI] [PMC free article] [PubMed] [Google Scholar]
- 10.Depil K, Beyl S, Stary-Weinzinger A, et al. Timothy mutation disrupts the link between activation and inactivation in Ca(V)1.2 protein. J Biol Chem. 2011;286:31557–31564. doi: 10.1074/jbc.M111.255273. [DOI] [PMC free article] [PubMed] [Google Scholar]
- 11.Doyle DA, Cabral JM, Pfuetzner RA, et al. The structure of the potassium channel: molecular basis of K+ conduction and selectivity. Science. 1998;280:69–77. doi: 10.1126/science.280.5360.69. [DOI] [PubMed] [Google Scholar]
- 12.Engl HW, Hanke M, Neubauer A. Regularization of inverse problems. New York: Springer; 2000. [Google Scholar]
- 13.Grabner M, Dirksen RT, Beam KG. Tagging with green fluorescent protein reveals a distinct subcellular distribution of L-type and non-L-type Ca2+ channels expressed in dysgenic myotubes. Proc Natl Acad Sci USA. 1998;95:1903–1908. doi: 10.1073/pnas.95.4.1903. [DOI] [PMC free article] [PubMed] [Google Scholar]
- 14.Gurkiewicz M, Korngreen A. A numerical approach to ion channel modelling using whole-cell voltage-clamp recordings and a genetic algorithm. PLoS Comput Biol. 2007 doi: 10.1371/journal.pcbi.0030169. [DOI] [PMC free article] [PubMed] [Google Scholar]
- 15.Hamill OP, Marty A, Neher E, et al. Improved patch-clamp techniques for high-resolution current recording from cells and cell-free membrane patches. Pflugers Arch. 1981;391:85–100. doi: 10.1007/BF00656997. [DOI] [PubMed] [Google Scholar]
- 16.Hemara-Wahanui A, Berjukow S, Hope CI, et al. A CACNA1F mutation identified in an X-linked retinal disorder shifts the voltage dependence of Cav1.4 channel activation. Proc Natl Acad Sci USA. 2005;102:7553–7558. doi: 10.1073/pnas.0501907102. [DOI] [PMC free article] [PubMed] [Google Scholar]
- 17.Hodgkin AL, Huxley AF. A quantitative description of membrane current and its application to conduction and excitation in nerve. J Physiol (Lond) 1952;117:500–544. doi: 10.1113/jphysiol.1952.sp004764. [DOI] [PMC free article] [PubMed] [Google Scholar]
- 18.Hohaus A, Beyl S, Kudrnac M, et al. Structural determinants of L-type channel activation in segment IIS6 revealed by a retinal disorder. J Biol Chem. 2005;280:38471–38477. doi: 10.1074/jbc.M507013200. [DOI] [PMC free article] [PubMed] [Google Scholar]
- 19.Long SB, Tao X, Campbell EB, MacKinnon R. Atomic structure of a voltage-dependent K+ channel in a lipid membrane-like environment. Nature. 2007;450:376. doi: 10.1038/nature06265. [DOI] [PubMed] [Google Scholar]
- 20.Talavera K, Nilius B. Evidence for common structural determinants of activation and inactivation in T-type Ca2+ channels. Pflugers Arch. 2006;453:189–201. doi: 10.1007/s00424-006-0129-7. [DOI] [PubMed] [Google Scholar]
- 21.Yu FH, Yarov-Yarovoy V, Gutman GA, Catterall WA. Overview of molecular relationships in the voltage-gated ion channel superfamily. Pharmacol Rev. 2005;57:387–395. doi: 10.1124/pr.57.4.13. [DOI] [PubMed] [Google Scholar]
Associated Data
This section collects any data citations, data availability statements, or supplementary materials included in this article.
Supplementary Materials
(PDF 847 kb)


