

Introduction
Geometry and spatial organization are critical components in many biological systems. The cytoskeleton, its organization, and the physical cues that it can transmit, result in dramatic effects on cell fate [1]. This is seen within the immune system in a variety of ways including during the interaction of a T cell with an antigen presenting cell (APC), which is a critical determinant of T cell fate and effector function. With activation, APC such as dendritic cells have major changes in their cell morphology resulting in significant increases in their overall cell surface area facilitating interaction with naïve T cells to direct T cell fate. Once an initial contact has been made by a T cell and an APC or some other target cell, T cell activation is further modulated by the formation of the immune synapse, a large surface area of close membrane apposition between the DC and T cell membrane, with concomitant cytoskeletal rearrangement and clustering of surface proteins [2-6]. Materials science approaches have helped to elucidate how the spatial organization and clustering of ligands that make up this synapse are important [7]. Thus, taking into account the geometry and spatial organization at cell-cell interfaces is important in studying biological responses.
Reductionist systems have facilitated the study of effective immune responses. One such system is the acellular artificial antigen presenting cell (aAPC). aAPCs have been made by coupling proteins required for T cell activation to particles. Minimally, T cell activation requires two sets of receptor-receptor interactions. One interaction, Signal 1, is the binding of major histocompatibility complexes (MHC) or a surrogate, such as anti-CD3, to bind the T cell receptor (TCR). A second interaction, Signal 2, is the binding of co-stimulatory receptors on the APC, such as B7.1, to ligands on the T cell, such as CD28. aAPC have been generated by coupling proteins that deliver Signal 1 and 2 to the surface of particles (Fig. 1A) made from a range of materials, including magnetic microparticles [8, 9], polystyrene particles [10], and PLGA microparticles [11-13]. Such systems have been broadly applied to tumor immunotherapy, vaccination, and immunosuppression, and are amenable to in vivo or ex vivo T cell stimulation and offer possible novel translational approaches to immunotherapy [9, 14-19].
Figure 1.

(A) Schematic of an aAPC. (B-D) Schematic of the interaction between a T cell, modeled as a sphere, interacting with (B) a sphere; (C) an ellipsoid (AR 2.83; stretch ratio 2). (D) Characterization by SEM (2000× magnification) of spherical and ellipsoidal aAPCs. Scale bar corresponds to 10 μm. (E) Size distribution of aAPCs. (G) Comparison of degree of stretch imposed on the film (STR) with the aspect ratio (AR) of the generated ellipsoidal aAPCs. Predicted AR = STR3/2 (F) Coupling efficiency for protein during synthesis of aAPC from spherical and ellipsoidal microparticles (n=2). (G) Protein release from the surface of aAPC at 37°C in PBS (pH 7.4) over the course of 1 week.
While useful, the Signal 1 and 2 paradigms alone do not capture aspects of spatial organization or the geometry of interactions. Previous work developing aAPCs have not attempted to re-capitulate these aspects of APC behavior. As a result, all aAPCs tested thus far have used spherical particles for their aAPC platforms, which unlike DCs minimize surface area for a given volume (Fig. 1B).
Further aAPC development may require incorporation of additional biomimetic cues beyond the presentation of signal 1 and signal 2 such as biomimicry of the surface density, dynamic protein spatial organization, and the geometry of the interface between the aAPC and the target. These cues could potentially be incorporated into next-generation aAPCs by nanoengineering approaches including presentation of cues on fluid membranes or in a patterned manner and by utilizing non-spherical particle shapes [18, 19].
Particle shape has only recently become a design parameter of interest in the field of material design for drug delivery. Shape can play a role in tuning the rate and mechanism of cellular uptake [20], can dramatically reduce internalization by phagocytic cells such as macrophages [21, 22], can change the biodistribution of the drug delivery vehicle [23, 24], and has been posited as potentially modulating the ability of a particle to bind a cell in part by increasing the surface area for interaction [23, 25]. In fact, a recent study by Barua et al. showed that antibody coated polystyrene nanorods had higher specific and reduced non-specific cellular uptake than spherical counterparts, demonstrating a significant relationship between particle shape and cell binding/unbinding [26].
A key consideration in cancer immunotherapy remains the efficient stimulation of antigen (Ag)-specific CTLs. In vivo, a criticial interaction for generation of activated, effector CD8+ T cells is the interaction between antigen presenting cells, such as dendritic cells or macrophages, with CD8+ T cells. In the development of acellular systems for T cell stimulation, previous literature has focused predominantly on the proteins involved in the interaction between APCs and T cells [8, 9, 13, 27-29], and recent studies extended this to release of cytokines [12, 30]. However, the biological interaction between T cells and their targets is distinctly not an interaction most appropriately represented by two interacting spheres. We hypothesized that non-spherical aAPCs would offer improved activation of CD8+ T cells. To test this hypothesis, we adapted a film-stretching method for controlling the shape of microparticles made from poly (lactic-co-glycolic) acid (PLGA) [31] to generate ellipsoidal aAPCs with varying long axis lengths and aspect ratios (ARs) To explore how particle shape might interact with particle dose and surface antigen density, we synthesized spherical and ellipsoidal aAPCs at different antigen densities, and then varied the particle dose, antigen density, and aAPC shape used to activate the T cells in vitro. To investigate the mechanism behind these effects, we performed confocal imaging to analyze aAPC:T cell conjugate formation. Finally, we compared the ability of spherical and ellipsoidal aAPCs in an in vivo melanoma tumor prevention model.
Materials and Methods
Film formation and particle stretching
Lyophilized PLGA microparticles that were synthesized by single emulsion (see supplemental methods) were added to a solution containing 10% PVA and 2% glycerol by weight at 5 mg/ml (particles/ml solution). The solution was poured on a flat surface and allowed to dry overnight. After drying, strips of the resulting film were cut out and placed on an aluminum-stretching device consisting of two aluminum blocks that can be separated by sliding on aluminum rods. The film and custom-made stretcher were placed in a 90°C oven for 10 minutes and then the film was slowly stretched inside of the oven to the desired stretch ratio by separating the two blocks. After allowing the film to cool down to room temperature, the film was removed and dissolved in 10 ml of deionized water, then the particles were centrifuged (4000 rpm for 5 min) and washed 3×, and finally resuspended in deionized water, frozen, and lyophilized. Spherical particles in all experiments were also prepared similarly; they were heated along side of the ellipsoidal particles but simply not stretched.
aAPC synthesis
Soluble MHC-Ig dimers were prepared and loaded with peptide as described (see supplemental methods) [32]. Spherical and ellipsoidal microparticles were resuspended in coupling buffer (0.1M MES pH 6.0), and activated with EDC (1-Ethyl-3-(3-dimethylaminopropyl)carbodiimide, Sigma-Aldrich) and sulfo-NHS (N-hydroxysulfosuccinimide). As an example, 5 mg of microparticles were resuspended in 1 ml of coupling buffer and activated with 10 mg of EDC and 13 mg of sulfo-NHS for 15 min at 1000 rpm on a multitube vortexer (VWR). Activated microparticles were then centrifuged, the supernatant was removed, and the activated particles were resuspended in 1 ml PBS (pH 7.4) and transferred to a 5 mL glass scintillation vial for coupling. As an example, 8 μg of MHC-dimer and 10 μg of anti-CD28 antibody (always in this ratio) were added to 2 μg of activated PLGA microparticles, and then the reaction was allowed to proceed in the cold room (4°C) for 4 hours. After 4 hours, the aAPCs (here, 2 mg of aAPCs) were centrifuged and washed 2× with PBS, then centrifuged, re-suspended in 200 μl of 0.2 mm-filtered sterilized 100 mg/ml endotoxin-free sucrose solution, frozen, and lyophilized overnight.
In vitro CTL induction and CFSE dilution
pMEL TCR/Thy1a Rag−/− transgenic mice were a gift from Nicholas Restifo (National Institutes of Health, Bethesda, MD) and maintained as homozygotes. C57BL/6j were purchased from Jackson Laboratories (Bar Harbor, ME). All mice were maintained according to Johns Hopkins University’s Institutional Review Board. The pMEL T cells used were obtained from homogenized pMEL mouse spleens after depletion of RBC by hypotonic lysis. CD8+ T cells were isolated using a CD8-negative isolation kit and magnetic enrichment column from Miltenyi Biotec (Cologne, Germany) and labeled with carboxyfluorescein succinimidyl ester (CFSE) for 15 minutes at 37°C, then washed extensively. Cells and aAPCs at the indicated amounts and dosages were mixed and cultured for 4-7 days in complete RPMI media supplemented with T cell factor, a cytokine cocktail harvested from human plasma [33]. Cell proliferation was quantified by manual cell counting, and final T cell count was divided by the initial T cell count for fold-change data.
aAPC-T cell conjugate formation evaluation
For confocal imaging, PLGA microparticles with encapsulated 5(6)-carboxy-tetramethylrhodamine dye (TAMRA, Nova Biochem, San Diego, CA) were synthesized (see supplemental methods). These labeled particles were then cast into a film, and the film stretching and subsequent sythesis of aAPC from spherical and ellipsoidal TAMRA-loaded particles were done as before. 1×10⁶ CFSE-labeled CD8+ T cells were incubated with 1 mg spherical or ellipsoidal aAPC for 60 minutes at 37°C in a No. 1.5 glass bottom dish (MatTek, Ashland, MA). Images were acquired on a Zeiss LSM 510 META (Zeiss, Oberkochen, Germany) laser scanning confocal at 40× magnification at the Johns Hopkins School of Medicine Microscopy Facility. aAPC/T cell areas of contact were quantitated by image analysis on ImageJ.
In vivo activity of aAPCs
We performed a subcutaneous B16 melanoma tumor prevention mouse model (Fig 6a). The animals were preinjected intravenously (i.v.) with naïve pMEL CD8+ T cells (day −1, 2×10⁶ cells/animal), subcutaneously (s.c.) in the flank with aAPCs (day 0, 2 mg aAPCs/animal), then injected with 2×10⁵ tumor cells in the hindlimb (day 3). Responses were boosted with subsequent s.c. injection of a second aAPC batch (day 6, 2 mg aAPCs/animal), and tumor growth over the course of the experiment was followed by measurement with external calipers. Once the tumor size reached 200 cm2, the mice were sacrificed. Treatment groups consisted of ellipsoidal and spherical cognate aAPC (n=8), and control groups consisted of ellipsoidal non-cognate (n=8) and CD8+ T cell alone groups (n=5).
Statistics
All statistics were performed in GraphPad Prism. For analysis of surface protein quantification, we performed pairwise t-tests. For analysis of specific CD8+ T cell proliferation in response to specified aAPC dose, protein density, and shape of aAPC, we performed two-tailed t-tests with a Bonferroni correction for multiple comparisons. For analysis of quantification of cognate formation and area of contact between aAPCs and CD8+ T cells, we performed pairwise t-tests. For analysis of tumor size, we performed a 1-way ANOVA with Tukey post-test. For in vivo survival analysis, we used the Log-rank (Mantel-Cox) test. Data in text are presented as mean ± SEM.
Supplemental methods
For description of microparticle fabrication, preparation of MHC-Ig Dimers, measuring size and aspect ratio by SEM, surface protein quantification and release, and intracellular cytokine staining, see supplemental methods.
Results and Discussion
Ellipsoidal aAPC synthesis and characterization
Ellipsoidal, biodegradable aAPCs were synthesized by first fabricating PLGA microparticles which were then stretched into ellipsoids using a film stretching method [31]. This method offers the advantage of allowing a direct comparison of particle shape and surface area, while retaining equivalent volumes.
The single emulsion PLGA (50:50 LA/GA, MW 38,000-54,000) microparticle synthesis resulted in spherical microparticles (Fig. 1D, spheres) with a number-weighted average diameter of 4.3 μm and a volume-weighted diameter of 6.7 μm (Fig. 1E). We were able to control the aspect ratio (AR) of ellipsoidal microparticles with a high degree of accuracy by imposing different degrees of stretch (STR) onto the film (Fig. 1D). This technique exhibits a high correlation between predicted AR and empirically measured AR (by SEM) for a fixed volume ellipsoid that has been elongated in one direction (AR = STR1.5) (Fig. 1F). This indicates that particle stretching is a feasible, controllable process that allows for flexibility in specifying the shape of the resulting particles. Ellipsoidal and spherical microparticles were then made into aAPCs by EDC/sulfo-NHS mediated covalent coupling of a dimeric MHC-Ig fusion protein [32] and an antibody against CD28 to free carboxyl groups on the particle surface.
Key parameters to evaluate these aAPCs include characterizing the total protein on the surface, the protein density, the dimer/anti-CD28 antibody ratio and the surface distribution on the spherical and ellipsoidal aAPCs. To characterize the conjugation efficiency with different amounts of protein added, we synthesized spherical and ellipsoidal (STR 2/AR 2.8) aAPC with fluorescently labeled MHC-Ig dimer and unlabeled anti-CD28 antibody, and characterized the particles by fluorimetry (Fig. 1G). By increasing the amount of MHC-Ig used during synthesis, we achieved protein coupling of up to 0.75 μg MHC-Ig/mg PLGA (Fig. 1G). Coupling efficiency was 15-20% over the entire range of protein analyzed, and there were no statistically significant differences between spherical and ellipsoidal aAPC in terms of their total protein content or protein density (p > 0.35 for all comparisons) (Fig. 1G). PLGA microparticles showed only minor auto-fluorescence and did not interfere with dye emission (Fig. S1). Of note, while total surface area increases modestly with stretching, with a modest increase of only 16% for AR 2.8 particles and maximum increase in net surface area of the aAPCs of 50% for AR 6.6 aAPCs (Table 1C), stretching the aAPCs dramatically increases surface flatness along the long axis of the aAPCs, with the radius of curvature increasing 23-fold over the same range (Table 1E).
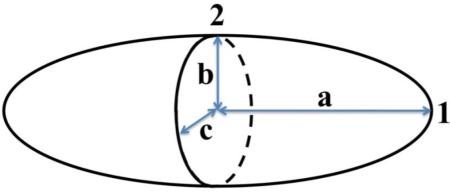
Table 1.
Key physical parameters altered by stretching of particles. A prolate ellipsoid (a > b = c) with axes labeled and key points numbered. AR = Aspect ratio. Rel. SA = Surface area of ellipsoidal particles, relative to sphere. Rel. Density = Protein density on surface of aAPC with assumed equivalent total protein content relative to spheres. Ra, Rb, Rc = Radius of curvature, R, for the tip (point 1) of the ellipsoid (Ra), and for the flat face of the prolate spheroid (point 2) in either the ba plane (Rb) and the ca plane (Rc). For equations used and description of derivations, see Supplemental calculation.
| Stretch | AR | Rel. SA | Rel. Density | Ra | Rb | Rc |
|---|---|---|---|---|---|---|
| Sphere | 1 | 1 | 1 | 1 | 1 | 1 |
| 1.5 | 1.84 | 1.06 | 0.94 | 0.44 | 2.8 | 0.82 |
| 2 | 2.83 | 1.16 | 0.86 | 0.25 | 5.7 | 0.71 |
| 2.5 | 3.95 | 1.27 | 0.78 | 0.16 | 9.9 | 0.63 |
| 3 | 5.20 | 1.38 | 0.72 | 0.11 | 16 | 0.58 |
| 3.5 | 6.55 | 1.48 | 0.67 | 0.08 | 23 | 0.53 |
To evaluate whether spherical or ellipsoidal aAPCs might show differences in dimer/anti-CD28 antibody ratio or surface distribution of the two proteins, we synthesized spherical and ellipsoidal aAPCs with fluorescently labeled MHC-Ig dimer and labeled anti-CD28 antibody, and characterized the particles by fluorimetry and by confocal microscopy (Fig. S2). Spherical and ellipsoidal aAPC did not show significant differences in MHC-dimer amount or density, anti-CD28 amount or density, or MHC-dimer/anti-CD28 ratio (Fig. S2). Approximately 85-90% of the protein on the surface required the EDC/NHS pre-activation step and non-specific protein adsorption was low and equivalent between aAPC shapes (Fig. S2). The fluorescence signals from the two proteins were co-localized in both cases (quantified here by the Pearsons correlation), and the distribution pattern was equivalent between the two groups (Fig. S2). Taken together with the only modest increase in total surface area (16%) for 2-fold stretched particles (AR 2.8) as compared to spherical particles (Table 1), the protein surface characterization data indicate that the spherical and ellipsoidal particles are equivalent with respect to protein density, total protein amount, protein ratio, protein organization and co-localization, and surface release.
While bulk polymer degradation from PLGA microparticles has been well investigated in the drug delivery field [34-36], the effect of degradation on release of surface-coupled proteins is less well studied. For aAPCs, presentation of immobilized proteins are critical for cytotoxic T cell (CTL) activation and thus it is important to study release of these proteins [10]. To characterize surface degradation, aAPCs bearing fluorescently labeled MHC-Ig were incubated for varying amounts of time in PBS at 37°C. Supernatants were recovered through centrifugation of the aAPCs and released protein quantified by protein fluorescence. For both spherical aAPCs and ellipsoidal aAPCs, 60-70% of the protein that was conjugated to the surface was released over 7 days, with 30-40% of the protein released in the first 3 days. At 7 days, 30-40% of the protein remained on the surface of the aAPCs, as quantified by total fluorimetry from the particles (Fig. 1H). There was no significant difference in this release profile between ellipsoidal and spherical aAPCs.
We characterized the stability of the ellipsoidal aAPC shape by analyzing their relaxation rate to the more stable spherical shape. Previous studies have indicated that relaxation rates are dependent on surface characteristics, molecular weight, polymer composition, and temperature [31]. We observed very little shape relaxation for high aspect ratio ellipsoidal aAPC over 1 week at 37°C in PBS, indicating that the shape transition is slow for ellipsoidal aAPCs with the chosen lactide to glycolide ratio (Fig. S3). This agrees with published relaxation timescales for high aspect ratio PLGA with hydrophilic surfaces, such as those used here [31].
Effect of aAPC shape, dose, and antigen density on T cell activation
In order to assess the impact of particle elongation, we measured the ability of aAPC to induce antigen specific CD8+ T cell expansion of pMEL TCR transgenic CD8+ T cells. Spherical and 2-fold stretched (AR = 2.8) ellipsoidal aAPCs were synthesized at 3 different cognate MHC-peptide densities by adding 4, 1, and 0.5 μg of Db-Ig GP100/mg PLGA with corresponding amounts of anti-CD28 antibody, resulting in spherical and ellipsoidal aAPC with 0.75, 0.14, and 0.08 μg of MHC-dimer/mg PLGA (Fig. 1G). Spherical aAPCs bearing non-cognate Db-Ig ASN at the highest protein density were used as a negative control. The aAPCs were added to pMEL TCR transgenic CD8+ T cells at 3 aAPC to cell ratios (1, 0.1 and 0.01 mg aAPC/105 cells). Proliferation was assessed at day 4 by CFSE dilution (see methods for details) and on day 7 by cell counts. Day 4 CFSE dilution for a representative Db-Ig density (0.75 ug Db-Ig/mg PLGA) is shown at each aAPC:cell ratio (Fig. 2A), while day 7 fold proliferation data are shown for all three parameters of aAPC shape, aAPC:cell ratio, and Db-Ig density (Fig. 2B).
Figure 2.

Specific CD8+ T cell proliferation in response to specified aAPC dose, protein density, and shape of aAPC. (A) CFSE dilution data for ellipsoidal (red) and spherical aAPC (black) at the highest protein dose (0.75 μg dimer/mg PLGA) at 3 doses of aAPC (0.01 mg, 0.1mg, and 1mg/105 CD8+ pmel CD8+ T cells) compared to non-cognate. (B) CD8+ T cell proliferation (fold expansion/105 cells) 7 days after aAPC addition to T cells with indicated doses, shapes (ellipsoidal in red, spherical in white), and protein densities. (For comparison of ellipsoid vs. spherical, * p<0.05, **p<0.01, ***p<0.001; n=3). (C) CD8+ T cell proliferation (fold expansion/105 cells) versus total MHC-dimer dose (in μg) for ellipsoidal (red) and spherical (black) aAPCs. (D) CD8+ T cell proliferation (fold expansion/105 cells) versus MHC-dimer density (in MHC-Ig/μm2) for ellipsoidal (red) and spherical (black) aAPC at 3 doses of aAPC (0.01 mg, 0.1mg, and 1mg/105 CD8+ pmel CD8+ T cells).
At a subsaturating dose of aAPC, 0.01 mg/105 cells, ellipsoidal but not spherical aAPCs induced CD8+ T cell proliferation as measured by CFSE dilution (Fig. 2A 0.01mg). This was reflected in Day 7 cells counts, with only ellipsoidal aAPC bearing 0.75 or 0.14 μg Db-Ig/mg PLGA inducing CD8+ T cell expansion, of 22-fold and 11-fold expansion, respectively (Fig. 2B 0.01mg; p<0.001 and p<0.01 for 0.75 and 0.14 μg Db-Ig/mg, respectively). At an intermediate aAPC:cell ratio (0.1 mg/105 cells), ellipsoidal aAPC also induced higher levels of CFSE dilution (Fig. 2A 0.1mg) than spherical aAPC. Cell counts indicated ellipsoidal aAPC conferred an approximately 3-fold increase in total CD8+ T cell expansion by day 7 compared to spherical aAPCs (Fig. 2B 0.1mg; p<0.001 and p<0.01 for 0.75 and 0.14 μg Db-Ig/mg, respectively). At saturating high aAPC:cell ratios (1 mg/105 cells) and the highest Db-Ig density, differences between ellipsoidal and spherical aAPCs were substantially smaller but still statistically significant (p<0.05) (Fig. 2A/2B, 1mg). However, when Db-Ig density on aAPC was titered to 0.1 μg Db-Ig/mg PLGA, ellipsoidal aAPC regained their advantage, stimulating significantly more CD8+ T cell expansion than spherical aAPC (p<0.001). aAPC bearing non-cognate MHC-peptide did not induce CFSE dilution or CD8+ T cell proliferation (Fig. 2A left).
Two parameters that are important in T cell activation are total amount of antigen-MHC complex and antigen density [37-39]. We wanted to study the impact of shape independent of total antigen-MHC complex or antigen density. To separate the effect of shape from the effect of total antigen-MHC dose or antigen density, we replotted the expansion data from Fig. 2B versus total antigen-MHC dose (Fig. 2C) and antigen density (Fig. 2D). Increasing total dose results in increased CTL expansion, but at all total doses, ellipsoidal aAPC (in red) outperform their spherical counterparts (in black) (Fig. 2C). For example, at a total dose of MHC near 0.1 μg/105 cells, all 3 ellipsoidal formulations showed higher fold-expansion than the 3 spherical formulations. There is also a positive correlation between increased antigen density and CD8+ T cell proliferation at a given particle dose (Fig. 2D), but across the probed density ranges, ellipsoidal particles (in red) show higher fold-expansion than comparable spherical particles (in black). For example, in Fig. 2D 0.1mgs, ellipsoidal particles with an MHC density of 400±140 and 240±70 MHC-Ig dimer/μm2 displayed higher fold expansion (19.7±0.7 and 6.3±0.8 fold respectively) than spherical particles with a similar MHC density of 350±60 MHC-Ig dimer/μm2 (2.3±1 fold expansion). Thus, across a range of total antigen doses and protein densities, when controlling for dose and density, ellipsoidal aAPC were more efficient at inducing CD8+ T cell expansion than spherical aAPC.
To further study the importance of AR on CD8+ T cell stimulation, PLGA microparticles were synthesized, stretched varying amounts, and made into aAPCs. There was a striking correlation between increased AR and increased CD8+ T cell proliferation (Fig. 3). Interestingly, the greatest gain in CD8+ T cell numbers was seen by increasing the aspect ratio of the ellipsoidal aAPC by increasing the applied stretch from 1.5-fold to 2-fold, which resulted in approximately 2 fold CD8+ T cell expansion up to approximately 20 fold CD8+ T cell expansion at a 0.01 mg aAPC/105 cells dose (Fig. 3C). Analysis of the number of divisions from the CFSE dilution data (Fig. 3A) revealed that increasing AR further resulted in a larger percentage of cells going through a significantly greater number of divisions (Fig. 3B). The fraction of non-responders (generations 0-1) progressively decreases with increasing AR, eventually resulting in only 11% non-responders for the 3.5-fold stretched (AR 6.6) aAPCs. The number of cells undergoing 4-5 or 6-7 divisions also increases with every additional .5-fold increase in applied film stretch. This effect was also saturable with very high doses of aAPCs (Fig. S4). Therefore, increasing aspect ratio of the aAPCs resulted in increased CD8+ T cell expansion consistently up to 3.5 fold stretched aAPCs (AR 6.6), with the greatest improvement in overall CD8+ T cell expansion seen when going from 1.5-fold to 2-fold applied stretch, which corresponds to a change in AR from 1.8 to 2.8.
Figure 3. Response to differential stretching.

Specific CD8+ T cell proliferation in response to 0.01 mg particles/100,000 cell dose for ellipsoidal aAPCs with different applied stretch compared to spherical aAPCs. (A) CFSE dilution after aAPC addition to CD8+ T cells. (B) Fraction of cells which underwent 0-1, 2-3, 4-5, 6-7 rounds of proliferation after aAPC addition to CD8+ T cells. (C) CD8+ T cell proliferation (fold expansion/100,000 cells) 7 days after aAPC addition to CD8+ T cells.
Thus, increasing aspect ratio of ellipsoidal aAPC results in improved CD8+ T cell activation, and this enhanced proliferation that is mediated by ellipsoidal aAPC is primarily dependent on aAPC geometry rather than any differences in the density or amount of conjugated surface protein.
T cell quality, as reflected by the amount and diversity of cytokines and cytotoxic markers produced when T cells are re-challenged by antigen, is a critical parameter for assessing responses [40]. To determine the functional status of the expanded CD8+ T cell population, we re-challenged aAPC-activated CD8+ T cells with peptide-pulsed splenocytes and measured the production of a key cytokine, IFNγ, as well as measured the degranulation marker, CD107a in an intracellular cytokine staining (ICS) assay. Function tracked with proliferation; there was no significant difference in the quality of CD8+ T cells generated from spherical or ellipsoidal aAPCs as determined by IFNγ or CD107a expression (Fig. S5). There was no significant difference when comparing CD8+ T cell quality after equal doses of aAPCs (which resulted in higher proliferation with the ellipsoidal aAPC) or when comparing equal proliferation (from lower doses of ellipsoidal aAPC).
aAPC aspect ratio and T cell conjugate formation
Antigen recognition on APC is known to trigger coordinated cytoskeletal rearrangements in both T cells and APCs, leading to close apposition of their cellular membranes. The resulting interactions mediate T cell activation and, when visualized by imaging or flow cytometry, are termed cell-cell conjugates [41].
To evaluate the formation of T cell-aAPC conjugates, naïve CD8+ T cells were incubated at 37°C with spherical or ellipsoidal aAPCs. Cell-aAPC interactions were visualized after a one-hour incubation by confocal imaging. In the presence of ellipsoidal aAPCs bearing cognate MHC/peptide, T cell membranes could be observed in close apposition to the aAPC’s long but not short axis, creating a T cell “cap”, characteristic of conjugate formation (Fig. 4A).
Figure 4.

Confocal imaging of aAPC (green) conjugate formation to CD8+ T cells (red). (A) Conjugates appear as areas of close membrane apposition between aAPC and cells, with CD8+ T cell morphology rearrangement into a distinctive cap. (B) Spherical and (C) ellipsoidal aAPC form cell-bead conjugates, which are more frequently observed with ellipsoidal aAPC. (D-E) Conjugate formation is not observed with aAPC bearing non-cognate MHC-peptide. (F) 4.6 ± 0.9% of CD8+ T cells incubated with ellipsoidal aAPC (red) compared to 1.8 ± 0.4% with spherical aAPC (unfilled) were observed to have formed conjugates (p=0.01). (G) The length of contact between cells and aAPC was 1.9 ± 0.2 μm for spherical (unfilled) and 3.6 ± 0.6 μm for ellipsoidal (red) cognate aAPC (p = 0.01). (H) Time-lapse image of a single CD8+ T cell interacting with one ellipsoidal cognate aAPC; images acquired 2 s apart.
Conjugate formation was observed for CD8+ T cells incubated in the presence of either ellipsoidal (Fig. 4B) or spherical (Fig. 4C) aAPC. Importantly, conjugate formation was a process driven by recognition of cognate antigen, as neither spherical nor ellipsoidal aAPCs bearing non-cognate MHC/peptide induced cap formation (Fig. 4D, E). When quantitated, conjugate formation was approximately 2.5-fold more frequent with ellipsoidal aAPC, with 4.6 ± 0.9% of the CD8+ T cells forming conjugates with the ellipsoidal aAPC compared to 1.8 ± 0.4% with spherical aAPC (p = 0.01, Fig. 4F). In addition to being 2.5-fold more frequent, we observed a significant increase (p = 0.01, Fig. 4G) in the contact length between the CD8+ T cells and the ellipsoidal aAPC (3.6 ± 0.6 μm/interface) as compared to spherical aAPC (1.9 ± 0.2 μm/interface).
Time-lapsed imaging revealed a striking reorientation and rearrangement of the CD8+ T cell surface against the aAPC long axis. Initially, the CD8+ T cell appears to contact the aAPC along the short axis but with time migrates along the long axis rearranging its membrane against the long axis of the ellipsoidal aAPCs (Fig. 4H). Membrane reorientation and alignment against the long axis of ellipsoidal aAPC strongly suggests a preference for the flat surface presented by the long axis of ellipsoidal aAPC. We thus observe that ellipsoidal aAPCs generate increased biomimetic interactions with T cells compared to spherical aAPCs, and suggests that the improved T cell expansion seen in vitro is due to increased frequency and size of T cell-aAPC contact along the long axis of the ellipsoidal aAPCs.
Effect of aAPC shape in vivo
To test the activity of high aspect ratio aAPCs in vivo, we utilized a subcutaneous B16 melanoma tumor model. We injected a dose of aAPC subcutaneously 3 days before and a second dose 3 days after tumor injection into the hindlimb (see Fig. 5A). Treatment with either ellipsoidal (p = 0.0009 vs. non-cognate) or spherical (p = 0.02 vs. non-cognate) cognate aAPCs led to significant reductions in tumor size as compared to controls that received control non-cognate aAPCs or CD8+ T cells alone (Fig. 5B). By day 19, cognate ellipsoidal aAPC treated tumors had only reached a size of 42.5 ± 14.9 mm2, compared to 90.5 ± 33.8 mm2 for cognate spherical, 164.5 ± 28.6 mm2 for non-cognate ellipsoidal, and 154.4 ± 35.4 mm2 for CD8+ T cell alone treated mice. Area under the curve (AUC) of tumor growth over the course of the entire experiment showed a similar pattern, with tumors growing a total of 44.3 ± 15.6 mm2, compared to 105.3 ± 34.7 mm2 for cognate spherical, 251.0 ± 46.6 mm2 for non-cognate ellipsoidal, and 238.0 ± 46.6 mm2 for CD8+ T cell alone treated mice. Cognate ellipsoidal aAPCs thus reduced tumor size more than spherical aAPCs, but this effect did not achieve statistical significance (p = 0.13).
Figure 5.
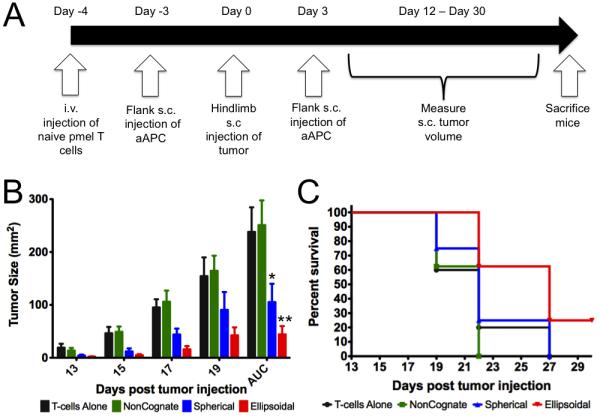
In vivo tumor-prevention model. (A) Experimental protocol and timeline. (B) Tumor size measurements for mice injected with cancer and CD8+ T cells alone or also injected with non-cognate ellipsoidal (NonCognate), cognate spherical (Spherical), and cognate ellipsoidal aAPC (Ellipsoidal). AUC = area under the curve. * p = 0.02 vs. non-cognate; ** p = 0.0009 vs. non-cognate. For comparison of ellipsoidal cognate and spherical cognate by AUC, p = 0.13. (C) Survival curve – mice were sacrificed and declared “dead” when tumor size reached 200 mm2. Subcutaneous injection of ellipsoidal aAPC resulted in increased survival vs. spherical non-cognate particles (p=0.05), ellipsoidal non-cognate particles (p=0.004), and CD8+ T cells alone (p=0.05).
Survival studies revealed statistically significant differences in survival between mice injected with ellipsoidal cognate aAPC over spherical cognate aAPC (Fig. 5C)(p=0.05), as well as ellipsoidal non-cognate control aAPCs (p=0.004). 25% of the animals in the cognate ellipsoidal aAPC group completely cleared tumor by day 19 and survived the course of the experiment, which did not occur in any other treatment or control groups. Furthermore, ellipsoidal aAPC treatment led to a significant delay in tumor growth, with no mice reaching substantial tumor burden until 22 days after tumor injection, compared to 19 days for the other three groups.
Critically, this research demonstrates that increased aspect ratio acellular aAPCs, which only differ in their shape (and have equivalent volume, antigen dose, antigen co-localization, and antigen density) as compared to spherical controls, not only engender enhanced antigen specific activation in vitro but in vivo as well, and this enhanced activation has functional consequences which lead to reduced tumor burden and enhanced survival.
Conclusions
Previous aAPC systems have utilized spherical particles, yet the biological interaction between T cells and APCs is dramatically dissimilar from two spheres interacting. In this study, we investigated how engineering the shape of an aAPC might enhance aAPC activity both in vitro and in vivo. When antigen dose, antigen density, protein ratio, protein co-localization, and particle volume were held equivalent between spherical and ellipsoidal aAPCs, high aspect ratio ellipsoidal aAPCs showed significantly enhanced activity over spherical aAPCs. Increasing the aspect ratio of ellipsoidal aAPCs led to enhanced activity up to AR 6.6. This enhanced activity was also observed in vivo, where ellipsoidal cognate aAPCs caused increased survival in mice compared to ellipsoidal non-cognate aAPCs (p=0.004) as well as cognate spherical aAPCs (p=0.05). Additionally, confocal imaging suggests that the observed improvement in CD8+ T cell activation is due to increased interaction along this flatter, long axis of the biomimetic, ellipsoidal aAPCs. These findings indicate that shape matters and that aAPC geometry is a critical design criterion to consider in the synthesis of biomimetic acellular aAPC systems. aAPCs that more closely mimic endogenous cell-cell interactions may provide a more complete understanding of the underlying biological processes, such as the role of close membrane apposition and a large surface area of contact in the APC/T cell interaction. aAPCs thus may not only be an enabling tool for antigen-specific immunotherapy, but also for studying basic aspects of T cell biology.
Supplementary Material
Acknowledgements
The authors thank the Johns Hopkins University Institute for Nanobiotechnology and the NIH (P01-AI072677, R01-EB016721, R01-AI44129 and R01-CA108835) for support of this research. We thank Jay Burns (Johns Hopkins Biomedical Engineering Machine Shop) for fabricating the particle stretcher. JCS and KP thank the MSTP program for support. KP is supported in part by a Cancer Research Institute Predoctoral Fellowship.
Footnotes
Contributions:
JCS, KP, JPS, and JJG conceived the project, analyzed results and wrote the manuscript. JPS and JJG coordinated the project. JCS synthesized and characterized the aAPCs. JCS and KP performed in vitro experiments. KP led the in vivo experiments and performed the confocal imaging.
Competing financial interests:
JPS and JJG are consultants to NexImmune which has licensed other aAPC technology from JHU. Conflicts of interest are managed by the Johns Hopkins Medical Institutions Committee on Outside Interests.
Publisher's Disclaimer: This is a PDF file of an unedited manuscript that has been accepted for publication. As a service to our customers we are providing this early version of the manuscript. The manuscript will undergo copyediting, typesetting, and review of the resulting proof before it is published in its final citable form. Please note that during the production process errors may be discovered which could affect the content, and all legal disclaimers that apply to the journal pertain.
References
- 1.Fletcher DA, Mullins RD. Cell mechanics and the cytoskeleton. Nature. 2010;463(7280):485–492. doi: 10.1038/nature08908. [DOI] [PMC free article] [PubMed] [Google Scholar]
- 2.Dustin ML. T-cell activation through immunological synapses and kinapses. Immunol Rev. 2008;221(221):77–89. doi: 10.1111/j.1600-065X.2008.00589.x. [DOI] [PubMed] [Google Scholar]
- 3.Dykstra M, Cherukuri A, Sohn HW, Tzeng SJ, Pierce SK. Location is everything: lipid rafts and immune cell signaling. Annu Rev Immunol. 2003;21:457–481. doi: 10.1146/annurev.immunol.21.120601.141021. [DOI] [PubMed] [Google Scholar]
- 4.Grakoui A, Bromley SK, Sumen C, Davis MM, Shaw AS, Allen PM, et al. The immunological synapse: a molecular machine controlling T cell activation. Science. 1999;285(5425):221–227. doi: 10.1126/science.285.5425.221. [DOI] [PubMed] [Google Scholar]
- 5.Lee KH, Holdorf AD, Dustin ML, Chan AC, Allen PM, Shaw AS. T cell receptor signaling precedes immunological synapse formation. Science. 2002;295(5559):1539–1542. doi: 10.1126/science.1067710. [DOI] [PubMed] [Google Scholar]
- 6.Monks CR, Freiberg BA, Kupfer H, Sciaky N, Kupfer A. Three-dimensional segregation of supramolecular activation clusters in T cells. Nature. 1998;395(6697):82–86. doi: 10.1038/25764. [DOI] [PubMed] [Google Scholar]
- 7.Doh J, Irvine DJ. Immunological synapse arrays: patterned protein surfaces that modulate immunological synapse structure formation in T cells. Proc Natl Acad Sci U S A. 2006;103(15):5700–5705. doi: 10.1073/pnas.0509404103. [DOI] [PMC free article] [PubMed] [Google Scholar]
- 8.Oelke M, Maus MV, Didiano D, June CH, Mackensen A, Schneck JP. Ex vivo induction and expansion of antigen-specific cytotoxic T cells by HLA-Ig-coated artificial antigen-presenting cells. Nat Med. 2003;9(5):619–625. doi: 10.1038/nm869. [DOI] [PubMed] [Google Scholar]
- 9.Ugel S, Zoso A, De Santo C, Li Y, Marigo I, Zanovello P, et al. In vivo administration of artificial antigen-presenting cells activates low-avidity T cells for treatment of cancer. Cancer Res. 2009;69(24):9376–9384. doi: 10.1158/0008-5472.CAN-09-0400. [DOI] [PMC free article] [PubMed] [Google Scholar]
- 10.Mescher MF. Surface contact requirements for activation of cytotoxic T lymphocytes. J Immunol. 1992;149(7):2402–2405. [PubMed] [Google Scholar]
- 11.Han H, Peng JR, Chen PC, Gong L, Qiao SS, Wang WZ, et al. A novel system of artificial antigen-presenting cells efficiently stimulates Flu peptide-specific cytotoxic T cells in vitro. Biochem Biophys Res Commun. 2011;411(3):530–535. doi: 10.1016/j.bbrc.2011.06.164. [DOI] [PubMed] [Google Scholar]
- 12.Steenblock ER, Fadel T, Labowsky M, Pober JS, Fahmy TM. An artificial antigen-presenting cell with paracrine delivery of IL-2 impacts the magnitude and direction of the T cell response. J Biol Chem. 2011;286(40):34883–34892. doi: 10.1074/jbc.M111.276329. [DOI] [PMC free article] [PubMed] [Google Scholar]
- 13.Steenblock ER, Fahmy TM. A comprehensive platform for ex vivo T-cell expansion based on biodegradable polymeric artificial antigen-presenting cells. Mol Ther. 2008;16(4):765–772. doi: 10.1038/mt.2008.11. [DOI] [PubMed] [Google Scholar]
- 14.Ndhlovu ZM, Oelke M, Schneck JP, Griffin DE. Dynamic regulation of functionally distinct virus-specific T cells. Proc Natl Acad Sci U S A. 2010;107(8):3669–3674. doi: 10.1073/pnas.0915168107. [DOI] [PMC free article] [PubMed] [Google Scholar]
- 15.Ito F, Carr A, Svensson H, Yu J, Chang AE, Li Q. Antitumor reactivity of anti-CD3/anti-CD28 bead-activated lymphoid cells: implications for cell therapy in a murine model. J Immunother. 2003;26(3):222–233. doi: 10.1097/00002371-200305000-00006. [DOI] [PubMed] [Google Scholar]
- 16.Lum LG, LeFever AV, Treisman JS, Garlie NK, Hanson JP., Jr. Immune modulation in cancer patients after adoptive transfer of anti-CD3/anti-CD28-costimulated T cells-phase I clinical trial. J Immunother. 2001;24(5):408–419. doi: 10.1097/00002371-200109000-00003. [DOI] [PubMed] [Google Scholar]
- 17.Taylor PA, Lees CJ, Blazar BR. The infusion of ex vivo activated and expanded CD4(+)CD25(+) immune regulatory cells inhibits graft-versus-host disease lethality. Blood. 2002;99(10):3493–3499. doi: 10.1182/blood.v99.10.3493. [DOI] [PubMed] [Google Scholar]
- 18.Sunshine JC, Green JJ. Nanoengineering approaches to the design of artificial antigen-presenting cells. Nanomedicine. 2013;8(7):1173–1189. doi: 10.2217/nnm.13.98. [DOI] [PMC free article] [PubMed] [Google Scholar]
- 19.Balmert SC, Little SR. Biomimetic delivery with micro- and nanoparticles. Adv Mater. 2012;24(28):3757–3778. doi: 10.1002/adma.201200224. [DOI] [PMC free article] [PubMed] [Google Scholar]
- 20.Wang J, Byrne JD, Napier ME, DeSimone JM. More effective nanomedicines through particle design. Small. 2011;7(14):1919–1931. doi: 10.1002/smll.201100442. [DOI] [PMC free article] [PubMed] [Google Scholar]
- 21.Champion JA, Mitragotri S. Role of target geometry in phagocytosis. Proc Natl Acad Sci U S A. 2006;103(13):4930–4934. doi: 10.1073/pnas.0600997103. [DOI] [PMC free article] [PubMed] [Google Scholar]
- 22.Sharma G, Valenta DT, Altman Y, Harvey S, Xie H, Mitragotri S, et al. Polymer particle shape independently influences binding and internalization by macrophages. J Control Release. 2010;147(3):408–412. doi: 10.1016/j.jconrel.2010.07.116. [DOI] [PMC free article] [PubMed] [Google Scholar]
- 23.Champion JA, Katare YK, Mitragotri S. Particle shape: a new design parameter for micro- and nanoscale drug delivery carriers. J Control Release. 2007;121(1-2):3–9. doi: 10.1016/j.jconrel.2007.03.022. [DOI] [PMC free article] [PubMed] [Google Scholar]
- 24.Devarajan PV, Jindal AB, Patil RR, Mulla F, Gaikwad RV, Samad A. Particle shape: a new design parameter for passive targeting in splenotropic drug delivery. J Pharm Sci. 2010;99(6):2576–2581. doi: 10.1002/jps.22052. [DOI] [PubMed] [Google Scholar]
- 25.Harris BJ, Dalhaimer P. Particle shape effects in vitro and in vivo. Front Biosci (Schol Ed) 2012;4:1344–1353. doi: 10.2741/s336. [DOI] [PubMed] [Google Scholar]
- 26.Barua S, Yoo JW, Kolhar P, Wakankar A, Gokarn YR, Mitragotri S. Particle shape enhances specificity of antibody-displaying nanoparticles. Proc Natl Acad Sci U S A. 2013;110(9):3270–3275. doi: 10.1073/pnas.1216893110. [DOI] [PMC free article] [PubMed] [Google Scholar]
- 27.Curtsinger J, Deeths MJ, Pease P, Mescher MF. Artificial cell surface constructs for studying receptor-ligand contributions to lymphocyte activation. J Immunol Methods. 1997;209(1):47–57. doi: 10.1016/s0022-1759(97)00146-4. [DOI] [PubMed] [Google Scholar]
- 28.Maus MV, Thomas AK, Leonard DG, Allman D, Addya K, Schlienger K, et al. Ex vivo expansion of polyclonal and antigen-specific cytotoxic T lymphocytes by artificial APCs expressing ligands for the T-cell receptor, CD28 and 4-1BB. Nat Biotechnol. 2002;20(2):143–148. doi: 10.1038/nbt0202-143. [DOI] [PubMed] [Google Scholar]
- 29.Steenblock ER, Wrzesinski SH, Flavell RA, Fahmy TM. Antigen presentation on artificial acellular substrates: modular systems for flexible, adaptable immunotherapy. Expert Opin Biol Ther. 2009;9(4):451–464. doi: 10.1517/14712590902849216. [DOI] [PubMed] [Google Scholar]
- 30.Suhoski MM, Golovina TN, Aqui NA, Tai VC, Varela-Rohena A, Milone MC, et al. Engineering artificial antigen-presenting cells to express a diverse array of co-stimulatory molecules. Mol Ther. 2007;15(5):981–988. doi: 10.1038/mt.sj.6300134. [DOI] [PMC free article] [PubMed] [Google Scholar]
- 31.Yoo JW, Mitragotri S. Polymer particles that switch shape in response to a stimulus. Proc Natl Acad Sci U S A. 2010;107(25):11205–11210. doi: 10.1073/pnas.1000346107. [DOI] [PMC free article] [PubMed] [Google Scholar]
- 32.Schneck JP, Slansky JE, O’Herrin SM, Greten TF. Monitoring antigen-specific T cells using MHC-Ig dimers. In: Coligan JE, editor. Current Protocols in Immunology. 2001. [DOI] [PubMed] [Google Scholar]
- 33.Durai M, Krueger C, Ye Z, Cheng L, Mackensen A, Oelke M, et al. In vivo functional efficacy of tumor-specific T cells expanded using HLA-Ig based artificial antigen presenting cells (aAPC) Cancer Immunol Immunother. 2009;58(2):209–220. doi: 10.1007/s00262-008-0542-1. [DOI] [PMC free article] [PubMed] [Google Scholar]
- 34.Rothstein SN, Federspiel WJ, Little SR. A unified mathematical model for the prediction of controlled release from surface and bulk eroding polymer matrices. Biomaterials. 2009;30(8):1657–1664. doi: 10.1016/j.biomaterials.2008.12.002. [DOI] [PMC free article] [PubMed] [Google Scholar]
- 35.Batycky RP, Hanes J, Langer R, Edwards DA. A theoretical model of erosion and macromolecular drug release from biodegrading microspheres. J Pharm Sci. 1997;86(12):1464–1477. doi: 10.1021/js9604117. [DOI] [PubMed] [Google Scholar]
- 36.von Burkersroda F, Schedl L, Gopferich A. Why degradable polymers undergo surface erosion or bulk erosion. Biomaterials. 2002;23(21):4221–4231. doi: 10.1016/s0142-9612(02)00170-9. [DOI] [PubMed] [Google Scholar]
- 37.Gottschalk RA, Hathorn MM, Beuneu H, Corse E, Dustin ML, Altan-Bonnet G, et al. Distinct influences of peptide-MHC quality and quantity on in vivo T-cell responses. Proc Natl Acad Sci U S A. 2012;109(3):881–886. doi: 10.1073/pnas.1119763109. [DOI] [PMC free article] [PubMed] [Google Scholar]
- 38.Arens R, Schoenberger SP. Plasticity in programming of effector and memory CD8 T-cell formation. Immunol Rev. 2010;235(1):190–205. doi: 10.1111/j.0105-2896.2010.00899.x. [DOI] [PMC free article] [PubMed] [Google Scholar]
- 39.Bullock TN, Mullins DW, Engelhard VH. Antigen density presented by dendritic cells in vivo differentially affects the number and avidity of primary, memory, and recall CD8+ T cells. J Immunol. 2003;170(4):1822–1829. doi: 10.4049/jimmunol.170.4.1822. [DOI] [PubMed] [Google Scholar]
- 40.Seder RA, Darrah PA, Roederer M. T-cell quality in memory and protection: implications for vaccine design. Nat Rev Immunol. 2008;8(4):247–258. doi: 10.1038/nri2274. [DOI] [PubMed] [Google Scholar]
- 41.Kroger CJ, Alexander-Miller MA. Cutting edge: CD8+ T cell clones possess the potential to differentiate into both high- and low-avidity effector cells. J Immunol. 2007;179(2):748–751. doi: 10.4049/jimmunol.179.2.748. [DOI] [PubMed] [Google Scholar]
Associated Data
This section collects any data citations, data availability statements, or supplementary materials included in this article.