Abstract
A simple model for the force-dependent unwinding and rewinding rates of the nucleosome inner turn is constructed and quantitatively compared to the results of recent measurements [A. H. Mack et al., J. Mol. Biol. 423, 687 (2012)]. First, a coarse-grained model for the histone-DNA free-energy landscape that incorporates both an elastic free-energy barrier and specific histone-DNA bonds is developed. Next, a theoretical expression for the rate of transitions across a piecewise linear free-energy landscape with multiple minima and maxima is presented. Then, the model free-energy landscape, approximated as a piecewise linear function, and the theoretical expression for the transition rates are combined to construct a model for the force-dependent unwinding and rewinding rates of the nucleosome inner turn. Least-mean-squares fitting of the model rates to the rates observed in recent experiments rates demonstrates that this model is able to well describe the force-dependent unwinding and rewinding rates of the nucleosome inner turn, observed in the recent experiments, except at the highest forces studied, where an additional ad hoc term is required to describe the data, which may be interpreted as an indication of an alternate high-force nucleosome disassembly pathway, that bypasses simple unwinding. The good agreement between the measurements and the model at lower forces demonstrates that both specific histone-DNA contacts and an elastic free-energy barrier play essential roles for nucleosome winding and unwinding, and quantifies their relative contributions.
I. INTRODUCTION
To fit into a nucleus, eukaryotic DNA is assembled by histones and other proteins into a hierarchy of chromatin structures, and ultimately chromosomes. The fundamental organizational unit of chromatin is the nucleosome in which 146 or 147 bp of DNA are wound around a protein complex comprised of two copies each of the core histones, H2A, H2B, H3 and H4. The core histones are highly conserved across Eukarya, and all have a similar general structure consisting of a central globular domain, an unstructured N-terminal tail, and an unstructured C-terminal tail. The structure of the canonical nucleosome is known in atomic detail as a result of x-ray crystallographic studies [1–3].
By blocking access to promotor DNA, nucleosomes generally repress gene expression in eukaryotes. For highly transcribed genes, the depletion of nucleosomes from the promoter DNA is a key feature and is believed to be a prerequisite for the recruitment of TATA-binding protein and RNA polymerase [4–6]. Nucleosome eviction from the promotor can be accomplished by a number of ATP-dependent chromatin “remodeling” enzymes [7], such as SWI-SNF, which exert force to displace the nucleosomes. It follows that the behavior of nucleosomes under tension, and their mechanical properties more generally, are highly relevant for eukaryotic gene expression. In addition, chromatin is subjected to significant forces during cell division.
Motivated by these considerations, several groups have sought to characterize and understand the forced unwinding of nucleosomes using optical or magnetic tweezers [8–21]. The accepted model for the nucleosome winding-unwinding pathway, first proposed by Brower-Toland et al. [10], is illustrated in Fig. 1. The model envisions four distinct nucleosome states, designated state 2, state 1, state 0, and unbound. State 2 is the canonical nucleosome, in which the histone octamer is wrapped by nearly two turns of DNA. For state 1, the inner turn remains wrapped, but the outer turn is unwrapped. For state 0, both the outer and inner turns are unwrapped, but the histone octamer remains bound to the DNA. Finally, for the unbound state, the histone octamer is dissociated from the DNA.
FIG. 1.
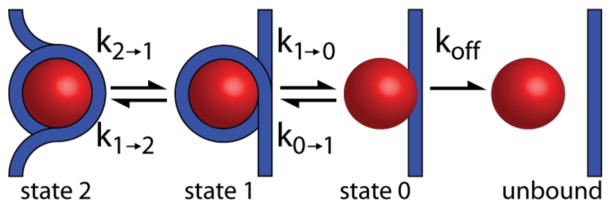
(Color online) Four microstates for nucleosome unwinding and rewinding proposed in Ref. [10]. The histone octamer is depicted as a circle. DNA is depicted as a line. For state 2, the nucleosome is fully wrapped by nearly two turns of DNA. For state 1, the outer turn is unwrapped, but the inner turn is wrapped. For state 0, both the outer and inner turns are unwrapped, but the histone octamer remains bound to the DNA. Finally, the histones may be unbound from the DNA.
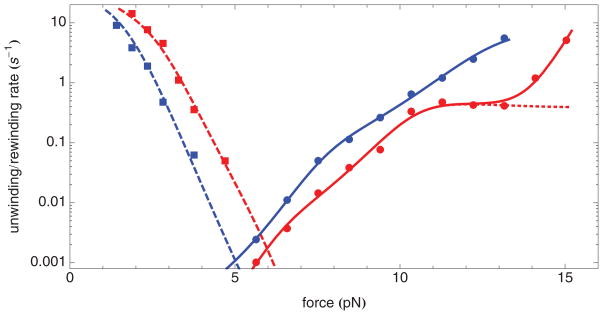
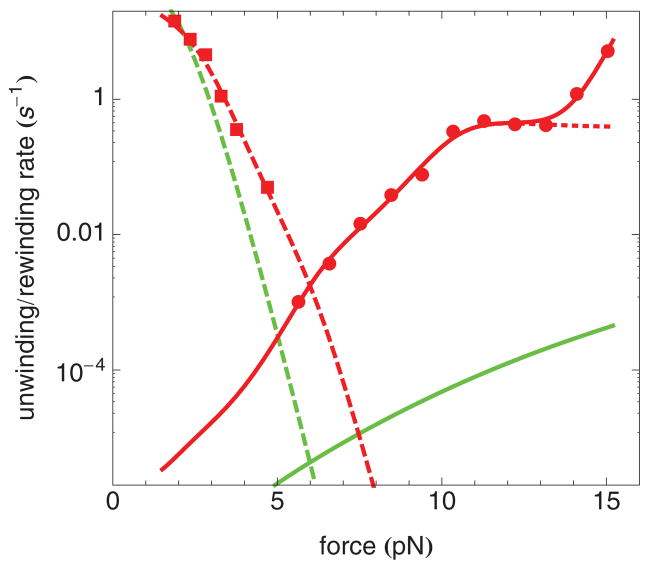
The purpose of this paper is to present a physics-based model for the force-dependent unwinding and rewinding rates of the nucleosome inner turn, that well describes recent experimentally measured unwinding and rewinding rates, shown in Fig. 2 [22]. To this end, we first develop a simple coarse-grained model for the histone-DNA free-energy landscape that incorporates both the elastic free-energy barrier described in Refs. [12,16,23] and specific histone-DNA bonds, as indicated in Ref. [19]. Secondly, we present a theoretical expression for the rate of transitions across a piecewise linear free-energy landscape with multiple minima and maxima. Thirdly, we combine our model free-energy landscape, approximated as a piecewise linear function, and our theoretical expression for the transition rates across a piecewise-linear landscape to construct a model for the force-dependent unwinding and rewinding rates of the nucleosome inner turn. Finally, we demonstrate by least-mean-squares fitting that this model provides a good description of the observed force-dependence of the unwinding and rewinding rates of the nucleosome inner turn, as shown as the solid and dashed lines in Fig. 2. At high forces, an additional ad hoc term is required to describe the data, which we interpret as an indication of an alternate high-force nucleosome disassembly pathway, that bypasses simple unwinding. Nevertheless, the good agreement between our measurements and our model at lower forces indicates that both specific histone-DNA contacts and an elastic free-energy barrier play essential roles for nucleosome winding and unwinding, and it quantifies their relative contributions.
FIG. 2.
(Color online) Comparison of the unwinding and rewinding rates of the nucleosome inner turn for nucleosomes containing H4 (red) or H4-R45H (blue) as a function of force. Circles correspond to the unwinding rate (k1→0). Squares correspond to the rewinding rate (k0→1). The solid and dashed lines are results of least-mean-squares fits to the model described in the text. The upper dashed line and squares correspond to H4. The lower dashed line and squares correspond to H4-R45H. The upper solid line and circles correspond to H4-R45H. The lower solid line and circles correspond to H4. The dotted line is the model, but omitting the ad hoc term, described in the text.
II. EXPERIMENTAL REVIEW
Using optical tweezers, Brower-Toland et al. [10] studied the forced unwinding of nucleosome arrays, assembled from natural avian histones on a sequence of DNA containing 17 tandem repeats of the 5S rRNA nucleosome positioning sequence. They found that under tension a length of DNA equivalent to about 75 bp per nucleosome unwinds apparently continuously at lower forces, corresponding to unwinding of the nucleosome outer turn of DNA. At higher forces, the force-versus-extension curve shows discrete jumps, each of about 75 bp, each of which corresponds to unwinding the inner turn of DNA. Brower-Toland et al. ascribed the observed gradual unwinding of the nucleosome outer turn to relatively weak outer-turn histone-DNA interactions, and the high-force unwinding of the nucleosome inner turn—the transition from state 1 to state 0—to the sudden disruption of strong histone-DNA interactions, located between 35 and 45 base pairs either side of the nucleosome dyad.
Kulic and Schiessel [12] proposed an alternative explanation for the sudden inner turn disruption events, observed by Brower-Toland et al.. They showed that the elasticity of a nucleosomal DNA superhelix under tension gives rise to a force-dependent free-energy barrier between states with different numbers of turns. This interpretation found support in subsequent experiments, which studied the behavior of avian mononucleosomes under tension, assembled on DNA containing a single 601 nucleosome positioning sequence [16,17,23]. Consistent with the predictions of Ref. [12], these experiments reveal that for tensions near 3 pN, the mononucleosome “hops” between states 1 and 2, indicating the existence of a significant free-energy barrier between these states too.
Recently, to further elucidate the energetics of histone-DNA binding, as well as to probe the forces experienced by a polymerase molecule proceeding through nucleosomal DNA during transcription, Hall et al. [19,24] implemented an approach using optical tweezers to unzip double-stranded DNA, wound around a nucleosome, into two single-stranded DNA strands. As the unzipping fork proceeds around the nucleosome, Hall et al. found that it dwells at discrete positions, spaced one from another by about 5 bp, indicating the existence of free-energy barriers to unzipping, spaced by about 5 bp. Because the dwell times observed were much larger than in the absence of the nucleosome, Hall et al. were able to infer that such barriers are the result of discrete histone-DNA binding sites, spaced by approximately 5 bp.
In addition to the 5 bp periodicity, Hall et al. also identified three broad regions within each of which the dwell time is especially long, indicating the existence of large free-energy barriers to unzipping in these regions. The largest barrier occurs near the nucleosome dyad (region 2), but there are two additional regions in which the barriers are high, displaced from the dyad by about ±45 bp (region 1 near −45 bp and region 3 near +45 bp). Barriers are largest in region 2, then comes region 1, with the smallest barriers in region 3. Hall et al.’s collected results convincingly demonstrate the existence of significant localized histone-DNA interactions, which should play an essential role in nucleosome unwinding and rewinding, because unwinding necessarily disrupts these bonds.
More recently still, several of us employed optical tweezers in a force-clamp mode to determine the unwinding and rewinding rates of the nucleosome inner turn at several fixed forces (F) [22]. We studied homogeneous nucleosomes containing recombinant wild-type H2A, H2B, H3, and either recombinant wild-type H4 (henceforth H4) or recombinant mutant H4 with arginine 45 mutated to histidine (henceforth H4-R45H), which is an example of a so-called SWI-SNF-independent (Sin) mutation [25–30]. Our motivation for measuring these rates was the observation that the upstream regulatory region (URS1) of the yeast HO promoter contains a strong nucleosome positioning sequence, which ordinarily requires SWI-SNF for transcription to occur, but that in the absence of SWI-SNF, Sin mutant histones restore transcription from the HO locus to wild-type levels. Thus quantification of the differences between wild-type nucleosomes and nucleosomes containing Sin mutant histones would represent a direct measurement of the minimal free-energy change required for an in vivo effect, with broad implications for the mechanisms by which histone modifications [31,32] and histone variations [33–35] affect gene expression. Nucleosomes assembled with H4-R45H also show significantly enhanced thermally driven nucleosome sliding compared to nucleosomes containing H4 [29].
Our measurements of the unwinding and rewinding rates of the nucleosome inner turn are reproduced in Fig. 2 with the rates displayed on a logarithmic axis, and the corresponding forces displayed on a linear axis. The measured unwinding rates span nearly four orders of magnitude, and the measured rewinding rates more than two orders of magnitude. At each force tested, nucleosomes containing H4-R45 unwind more rapidly and rewind more slowly than nucleosomes containing H4, indicating that the latter are the more stable. In fact, using the data of Fig. 2, we were able to determine the free energy of the nucleosome inner turn. In brief, there are two contributions to the force-dependent Gibbs free-energy difference between state 0 and state 1 (Gtotal), namely the free energy of the nucleosome inner turn (G0→1) and the difference in the Gibbs free energy of the DNA, not wound around the nucleosome [36]. At the force, F*, at which the unwinding rate and the rewinding rate are equal, state 1 and state 0 have the same Gibbs free energy, and ΔGtotal = 0. It follows that
| (1) |
where d is the difference in extension between state 0 and state 1. By extrapolation of the rates in Fig. 2, we find F* = 6.0 ± 0.3 pN for nucleosomes containing H4, and F* = 5.0 ± 0.3 pN for nucleosomes containing H4-R45H. It follows, using LP ≃ 42 nm, and d = 23.3 ± 0.5 nm at 5 pN and d = 23.6 ± 0.5 nm at 6 pN [22] that G0→1 = −142 ± 7 pNnm = −34.6 ± 1.7kB T = −20.8 ± 1.0 kcal/mol for nucleosomes containing H4, and G0→1 = −117 ± 7 pNnm = −28.5 ± 1.7kB T = −17.2 ± 1.0 kcal/mol for nucleosomes containing H4-R45H. The difference in the free energy of the nucleosome inner turn for nucleosomes with H4 and H4-R45H is therefore 6.1 ± 2.4kB T [22].
The usual model for how force affects reaction rates, introduced in Ref. [37], predicts an exponential variation of the rates with force, leading to linear curves, when plotted on semilogarithmic axes. By contrast, the measured unwinding and rewinding rates, presented in Fig. 2, show significant curvature. Most notable in this regard is that the unwinding rate of nucleosomes containing H4 shows a nearly force-independent rate for forces between about 10 and 13 pN. However, the other three curves also show changes in slope, albeit less dramatic. These deviations from the usual behavior motivate reconsideration of how to appropriately describe these data. (Recent elaborations of Ref. [37] predict curvature in semilogarithmic plots [38]. However, the predicted curvature is small, only becoming noticeable for rates extending over seven or eight orders of magnitude. The changes in slope, we observe, are much larger.)
III. MODEL FREE-ENERGY LANDSCAPE OF A NUCLEOSOME UNDER TENSION
A. Elastic free energy of a DNA superhelix under tension
In this section, we present a model for the force-dependent elastic free energy of nucleosomal DNA, treated as an elastic rod, following Ref. [12]. Our calculations are carried out for a single nucleosome, flanked by infinitely long DNA arms. In comparison, the experiments, that we seek to describe [22], are carried out on 12-nucleosome arrays, held at forces varying from F = 1.5 to 15 pN, in which the nucleosomes are in state 1 and are separated from each other by about 40 nm. The characteristic length for elastic deformations of the DNA is given by , where κ is the bending modulus of the DNA. Thus λ varies between 11 nm to 3.4 nm, depending on the force. Since λ is always many times less than the separation between nucleosomes, our treatment, based on isolated nucleosomes, seems reasonable. In addition, we assume torsionally unconstrained DNA, which also corresponds to the experimental situation that we are seeking to describe, because in optical tweezers experiments, the bead, and the DNA that it is attached to, are free to rotate. Because we treat DNA as an elastic rod, our calculation does not treat the role of different DNA sequences. Our calculations also assume that linker histone H1 is not present, also corresponding to the experimental situation [22].
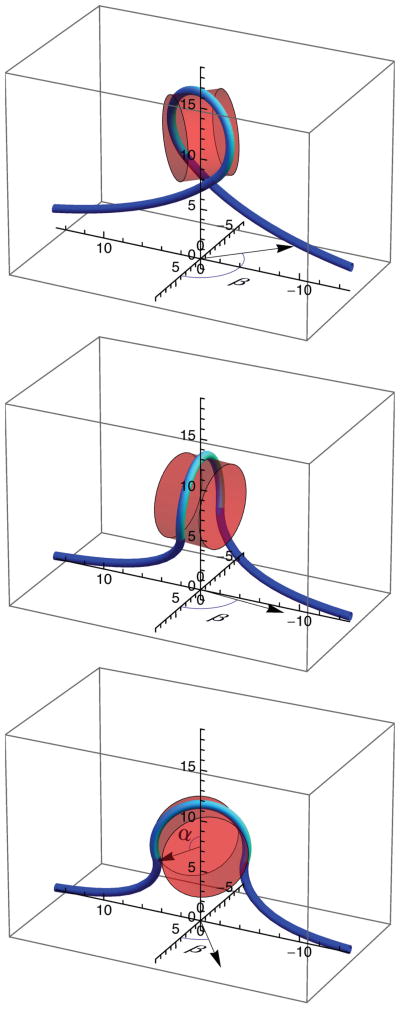
Illustrated in Fig. 3 are three model configurations of nucleosomal DNA. In each case, the DNA is shown as a rod, partially wound around a histone octamer, represented as a partially transparent cylinder. To model the DNA’s elastic energy, we start with the expression, adapted from Ref. [12], for the elastic Gibbs free energy (ΔGelastic) of DNA that is wound into a superhelix, attached to DNA “arms,” and subjected to a tension, F:
| (2) |
FIG. 3.
(Color online) Elastic-rod models of DNA, depicted as a line, partially wound around a cylindrical representation of the histone octamer, depicted as a partially transparent cylinder, at a force of 8 pN for three different winding (2α) and rotation (β) angles: 2α= 4.8 radians and β = 2.33 radians (top), 2α = 4.18 radians and β = 1.46 radians (middle), and 2α = 3.7 radians and β = 0.65 radians (bottom). DNA in contact with the nucleosome is shown lighter than the DNA not in contact with the nucleosome. The angle subtended by this DNA defines the winding angle 2α, as indicated in the bottom panel. The rotation angle (β) of the cylinder axis about the vertical axis is indicated in each panel. Axes are marked in nanometers.
In Eq. (2), κ is the bending modulus of DNA, LC is its total contour length, R is the superhelical radius, 2πH is the superhelical pitch, 2α is the winding angle of the DNA about the histone octamer, shown green in Fig. 3, and β is the nucleosome rotation angle. For a nucleosomal superhelix, we take R = 4.18 nm, 2πH = 2.39 nm (H = 0.38 nm) [1], and κ = 172 pN nm2, corresponding to a DNA persistence length of LP = κ/(kB T ) = 42 nm. We routinely find that a value of LP = 42 nm well describes the force versus extension of dsDNA at the solution conditions of our experiments.
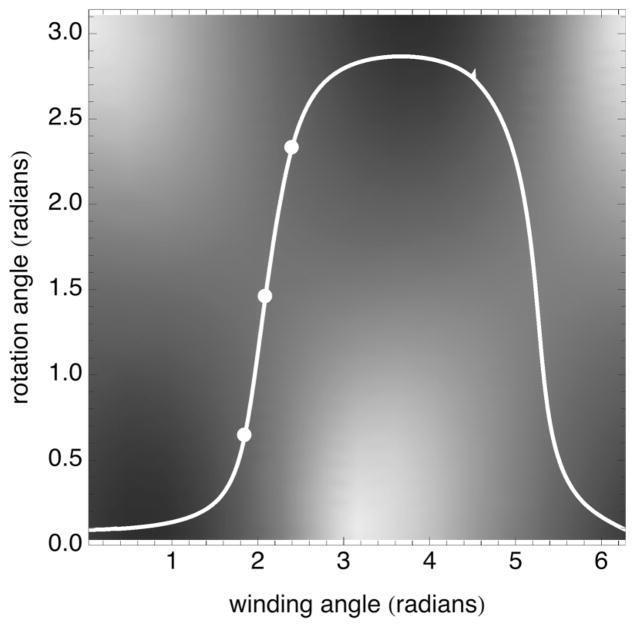
The periodic terms in Eq. (2) give rise to a force-dependent barrier between configurations with different numbers of turns [12,16,23]. This phenomenon is illustrated in Fig. 4, where the final two terms of Eq. (2) are represented using a gray scale, with white corresponding to the highest free energy and black the lowest. It is clear from this figure that the periodic terms in Eq. (2) yield low free energies for (α,β) near (2π,0), (π,π), and (0,0), corresponding to 2, 1, and zero turns, respectively, and that the path from one of these minima to the next must cross an elastic free-energy barrier, that involves rotating the nucleosome through values of β far from 0 or π.
FIG. 4.
Gray scale representation of the periodic parts of the elastic free energy at a fixed force of 8 pN, i.e., the final two terms in Eq. (2), for which white corresponds to the highest elastic energy and black the lowest. The white line shows the rotation angle, β, versus winding angle, α, for F = 8 pN, according to Eq. (3). The points correspond to the winding angles and rotation angles for the configurations shown in Fig. 3.
In a pulling experiment, the external torque applied to the nucleosome is necessarily zero. This condition implies a relationship among F, κ, α, and β [12], namely
| (3) |
It follows that for a given force, F, and winding angle, 2α, the rotation angle, β, is prescribed by Eq. (3). Although an algebraic solution for β is not possible, it is nevertheless straightforward to find the solutions for β from Eq. (3) numerically using Mathematica (Wolfram Research, Urbana, IL). The solution for β, satisfying Eq. (3), corresponding to the lowest free-energy path in the αβ plane is shown in Fig. 4.
Evaluating Eq. (2), using β given by Eq. (3), leads to a one-dimensional free-energy landscape, that is a function of the winding angle alone. According to Ref. [1], 126 base pairs (125 base pair spacings, henceforth 125 bp) constitute 1.65 superhelical turns. It follows that there are 75.8 bp per turn. In the remainder of this paper, we have chosen to measure the winding angle of the DNA about the nucleosome in units of base pairs, assuming there are 75.8 bp per superhelical turn. To convert from α in radians to the winding angle in base pairs, it is simply necessary to multiply by 75.8/π.
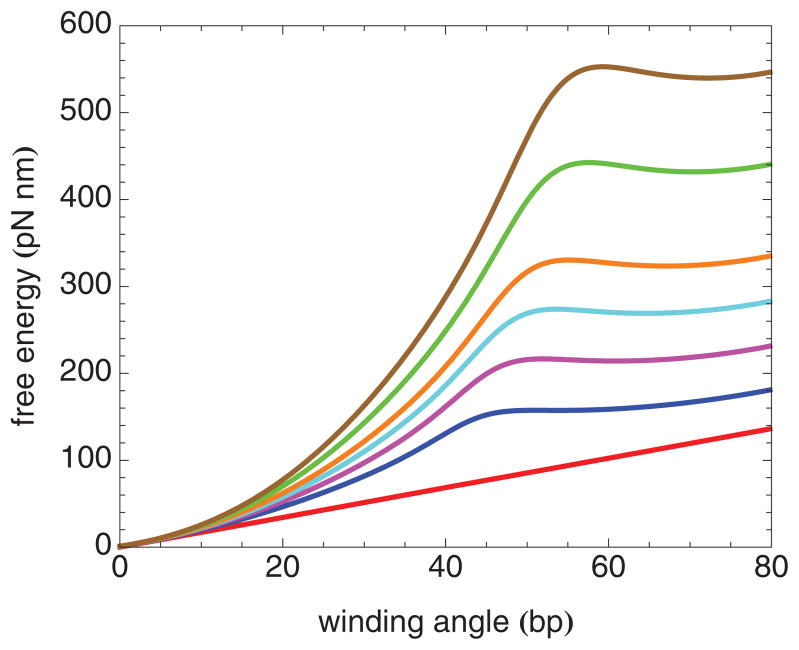
The one-dimensional elastic free-energy landscape for nucleosome winding and unwinding is plotted versus winding angle for several values of the force in Fig. 5. At each force, the free energy increases super-linearly with increasing winding angle until a local maximum is reached, corresponding to the elastic free-energy barrier. Both the value and the location of this maximum increase with force. Beyond the local maximum, the free energy varies only weakly with further increase in the winding angle up to and including values of the winding angle corresponding to state 1 (~ 75 bp). The existence of a free-energy barrier, even at large forces, implies that state 1 is mechanically trapped in the low-temperature limit.
FIG. 5.
(Color online) Elastic free-energy landscape for the nucleosome inner turn at several forces, from bottom to top: 0, 2, 4, 6, 8, 12, and 16 pN.
It is important to emphasize that the elastic energy represented by Eq. (2) is approximate. In particular, the x-ray crystallographically determined structure of the nucleosome shows significant kinking [1–3]. In addition, recent atomic force microscopy measurements indicate that the elastic energy of highly bent DNA, such as is realized in the nucleosome, is lower than expected on the basis of linear elasticity [39].
B. Specific histone-DNA binding
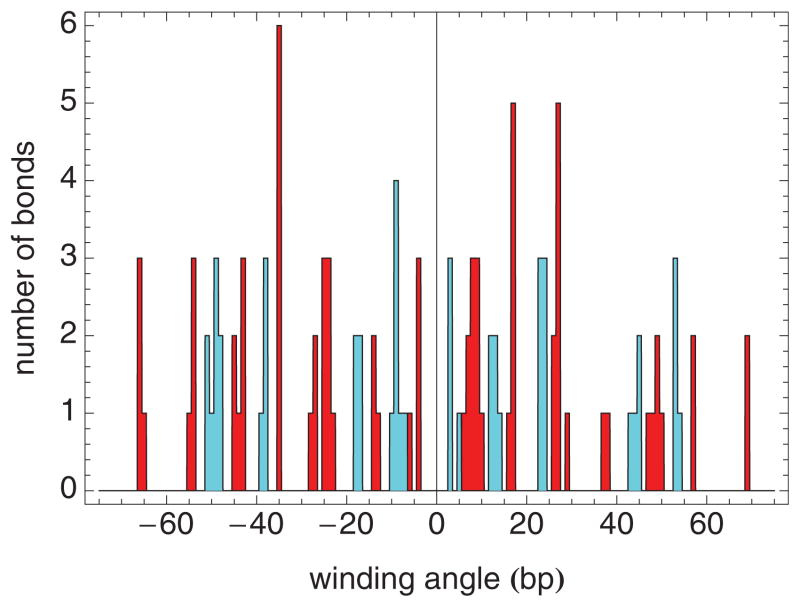
In addition to the elastic free energy specified in Eq. (2), we must also include histone-DNA binding, which stabilizes the nucleosome. As noted above, the measurements of Ref. [19] indicate that the histone-DNA interaction shows an approximate 5 bp periodicity, even though the pitch of the DNA double helix is about 10 bp. To explore histone-DNA interactions within the context of the crystallographically determined nucleosome structure, we have used the program NUCPLOT [40], which automatically identifies protein-DNA interactions, using as input the Protein Data Bank (PDB) file for the protein-DNA complex of interest, e.g., the nucleosome. Specifically, we used NUCPLOT, using the default criteria, to identify histone-DNA bonds within the structure of a nucleosome assembled with a modified, palindromic version of 601 DNA, whose structure was recently determined (PDB accession code 3UT9) [3]. A histogram of the number of bonds for each DNA strand is shown in Fig. 6. Bonds between histones and DNA in strands I and J are shown dark (red) and light (cyan), respectively. Within each strand, there is an approximate 10 bp periodicity, but the bonds from strand I and from strand J are staggered relative to each other, leading to an overall approximate 5 bp periodicity. Three regions of especially strong bonding, as suggested in Ref. [19], are not apparent from Fig. 6. However, Fig. 6 gives the number of bonds only, and does not factor in bond strength at all, which may be considerably different for different bonds. What Fig. 6 does make clear is that the approximate 5 bp periodicity suggested in Ref. [19] may be understood on the basis of the structure of the nucleosome.
FIG. 6.
(Color online) Histogram of the number of histone-DNA bonds versus winding angle, measured in base pairs from the dyad axis, recognized by NUCPLOT (using its default parameters) for a nucleosome assembled with a palindromic version of 601 DNA (PDB accession code 3UT9) [3]. Shown darker (red) and lighter (cyan) are the bonds between histones and DNA strand I and DNA strand J, respectively. It is important to emphasize that this is the only figure in this paper in which the winding angle is zero at the dyad. In every other figure, zero winding angle corresponds to the point at which no DNA is wound around the nucleosome.
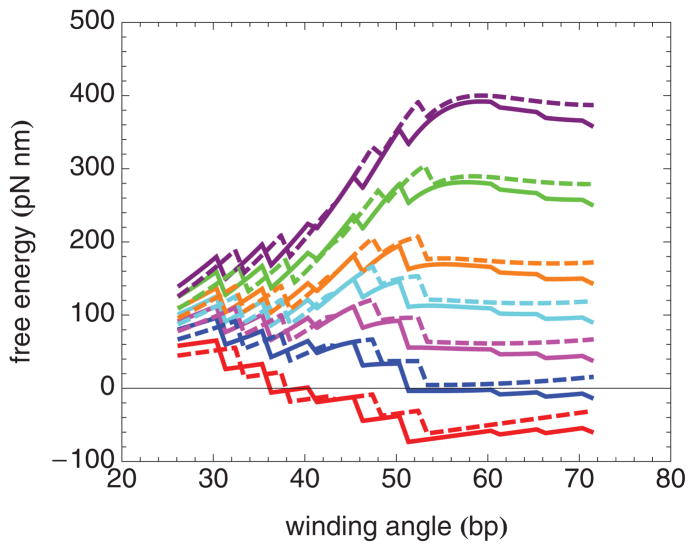
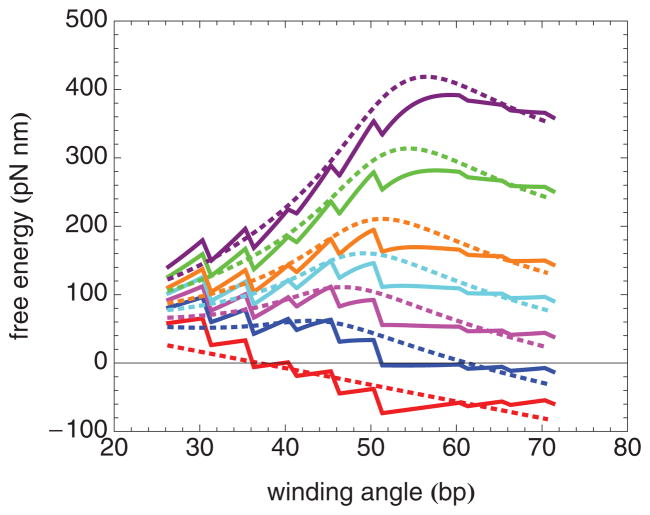
What then is the histone-DNA free-energy landscape in the presence of histone-DNA interactions? If there is a strong localized histone-DNA bond at a particular value of the winding angle, then the free energy will decrease in a stepwise fashion when the winding angle is increased beyond that value, corresponding to formation of the bond in question [24]. It follows that, if there are strong localized histone-DNA bonds spaced by 5 bp, the histone-DNA free-energy landscape as a function of winding angle will show a corresponding sequence of stepwise decreases, as the winding angle is increased, each step separated from its neighbors by 5 bp. Examples of such a simplified free-energy landscape at several forces, incorporating both the elastic free energy of the DNA superhelix under tension and the effect of histone-DNA binding in a simplified fashion, are illustrated in Fig. 7. As a result of the steps, the net free-energy landscape shows multiple minima and maxima as a function of winding angle. Importantly, which local free-energy maximum corresponds to the global free-energy maximum—i.e., to the transition state—changes as a function of force.
FIG. 7.
(Color online) Model free-energy landscapes for the nucleosome inner turn, including the elastic free energy and the free energy of localized histone-DNA binding at 5 bp intervals, at several forces. Each step down corresponds to the disruption of one set of histone-DNA bonds. The figure actually illustrates a binding free-energy change that occurs over a small range of winding angles (1 bp), corresponding to histone-DNA bonds distributed over this range. The solid curves correspond to the best fit parameters for nucleosomes containing H4 at forces, from bottom to top, of 0, 2, 4, 6, 8, 12, and 16 pN, respectively. The dashed curves correspond to the best-fit parameters for nucleosomes containing H4-R45H at forces, from bottom to top, of 0, 2, 4, 6, 8, 12, and 16 pN, respectively.
C. Transition rates across a piecewise linear free-energy landscape
To calculate the unwinding and rewinding rates across free-energy landscapes of the sort shown in Fig. 7, we use the “flux over population method” [41], which exploits the observation that the rate in question is equal to the normalized steady-state flux into the final state for an adsorbing boundary condition.
First, we consider a discrete model, in which each state along the reaction pathway is labeled by an integer m, with m = 0 corresponding to the final state, from which there are no transitions back. Then, the transition rate is equal to the normalized steady-state flux into state 0 for p0 = 0, namely
| (4) |
where p1 is the probability that the system is in state 1, and k1→0 is the rate of transitions from state 1 to state 0. The quantity, kn→0, is equal to the inverse of the mean first passage time (MFPT) from state n to state 0 [42]. The probabilities (p1, p2, etc.) are specified in terms of the transition rates between neighboring states, via the steady-state master equations:
| (5) |
| (6) |
etc. and are normalized: p1 + p2 + … + pn = 1.
It is then straightforward to derive a recursion relation for kn→0, namely
| (7) |
where we take 1/kn−2→0 = 0 for n = 2.
Equation (7) is useful when the individual transition rates are known. However, if the free-energy landscape is a function of the reaction coordinate (i.e., the winding angle, as in Fig. 7), it is preferable to employ a continuum description, which permits the transition rates to be determined in terms of parameters that describe the free-energy landscape. In the case of a piecewise linear free-energy landscape [43,44], it is possible to derive an analogous recursion formula to Eq. (7), as follows. First, we label the locations of the cusps between neighboring linear regions by an integer m, so that the locations of the cusps are Lm. The difference in free energy between location Lm+1 (final state) and location Lm (initial state), we designate as ΔGm→m+1 Then, similar to Eq. (4), the transition rate across a piecewise linear free-energy landscape from x = Ln to x = 0 is equal to the particle flux at x = 0 for adsorbing boundary conditions at x = 0, namely
| (8) |
where p(x) is the appropriately normalized probability density, that solves the steady-state Smoluchowski equation, subject to the boundary conditions that p(0) = 0 and that p(x) is continuous at the boundaries of each piecewise linear region. (We assume that the free energy is continuous.) In this case, we can show that
| (9) |
with
| (10) |
| (11) |
and
| (12) |
Ordinarily, the second term on the right-hand side of Eq. (9) is smaller than the first term. Therefore, it may often be a good approximation to neglect the second term with the result that
| (13) |
which is formally the same as Eq. (7), provided we identify Kn = kn−1→n/kn→n−1 and ρn = 1/kn→n−1. It is also possible to give an explicit expression for σn:
| (14) |
Inspection of Eq. (14) reveals that the MFPT for a landscape with multiple minima and maxima is dominated by the term corresponding to the largest free-energy barrier, as expected on the basis of the Arrhenius equation for the transition rate (k) across a free-energy barrier, ΔG†, namely
| (15) |
where k0 is the rate for zero barrier height (ΔG† = 0). However, the factors of ΔGp→p−1/(kB T ) in the denominator of the second term on the right-hand side of Eq. (9) and in the denominator of the right-hand side of Eq. (14) represent significant corrections to the Arrhenius form. Although Eq. (15) is widely used, it represents an even cruder approximation than Eq. (9).
D. Modeling the nucleosome unwinding and rewinding rates
Although derived for a piecewise linear free-energy landscape, Eq. (9) through Eq. (12) express the transition rates solely in terms of free-energy differences and reaction coordinate differences. Therefore, these equations may be readily applied to a general free-energy landscape. This approach is equivalent to approximating the landscape in question as a piecewise linear landscape, and is the approach we have taken to model the winding and unwinding rates for the nucleosome inner turn. Specifically, to create a minimal model free-energy landscape for the nucleosome inner turn at each force, we add together the elastic energy given by Eq. (2) and a set of linear steps, one for each histone-DNA binding location. For the step near base pair m, we take the free energy to decrease linearly from base pair m + δ − 1/2 to base pair m + δ + 1/2, where m is a positive integer and δ specifies the registration between the zero of the winding angle and the zero of the 5 bp periodicity.
Figure 7 shows examples of such a model landscape. In the following, it is convenient to denote the location of base pair m + δ − 1/2 as location m and the location of base pair m + δ + 1/2 as location m.5, and to denote the change in binding free energy from initial location m to final location m.5 as ΔGm. To apply Eq. (9) through Eq. (12), we identify successive locations appearing in these equations with locations 25.5, 30, 30.5, 35, 35.5, etc. Thus we calculate the unwinding and rewinding rates across the model free-energy landscape.
To fit the model rates so obtained to the data shown in Fig. 2, we are lead to introduce the following possible fitting parameters: δ, which specifies the registration between the zero of the winding angle and the 5 bp periodicity, D, which is an effective rotational diffusion coefficient, and a set of histone-DNA binding energies (ΔGm). To limit the number of fitting parameters to as few as possible, we held fixed the DNA persistence length (LP = 42 nm), the spacing between histone-DNA binding sites (5 bp), and the width of each histone-DNA binding site (1 bp).
In both state 1 and state 0, the number of base pairs of DNA in contact with the histone octamer is not precisely known. However, to numerically calculate the transition rates between state 1 to state 0, it is necessary to pick definite starting and ending winding angles. For the purposes of our calculation of the transition from state 1 (0) to state 0 (1), therefore, we assume a starting winding angle corresponding to base pair number 70 (25) and an ending winding angle corresponding to base pair number 25 (70), which correspond to the free energy landscapes shown in Fig. 7. In fact, Eqs. (9) through (14) show that the transition rate is a sum of terms, and that the rate is determined by the largest free-energy barrier encountered, i.e., the largest term in Eq. (14). It follows therefore that even if the starting and ending base pairs are actually larger and smaller, respectively, than 70 and 25, provided there is not a significant contribution to the free-energy barrier from base pairs between the actual starting and ending base pairs and base pairs 70 and 25, respectively, the calculated model rates will be essentially unchanged. Our assumption that locations 70.5 and 25.5 are reasonable end points may be justified a posteri on the basis of the success of the fits we achieve. The histone-DNA binding energies within the included region, which are therefore possible fitting parameters, are ΔG30, ΔG35, ΔG40, ΔG45, ΔG50, ΔG55, ΔG60, ΔG65, and ΔG70. We assume that each of these binding energies is negative, corresponding to binding.
Irrespective of the values of these fitting parameters, it is not possible to achieve satisfactory agreement between our model and the two experimental data points obtained at high forces (F > 14 pN) for nucleosomes containing H4. Therefore, we have added to our model rate an ad hoc term, D exp[(ΔG‡ + F x‡)/(kB T ) [37], which is negligible at low forces, but which is able to match these two data points. In principle, such a term describes a process that is an alternative to unwinding, and competes with unwinding. For example, we may speculate that a high-force alternative to unwinding is that the DNA may slide sideways off of the nucleosome.
Because the values of the rates span several decades, in order to achieve satisfactory agreement between the measured rates and our model over the full range, we carried out least-mean-squares fits of the logarithm of the model rates to the logarithm of the measured rates, using Mathematica’s NonLinearModelFit function. We sought to limit, as far as possible, the total number of fitting parameters, while still achieving a satisfactory description of our experimental data (Fig. 2). Therefore, we fitted all of our rate-constant data simultaneously, so that the unwinding and rewinding rates were both described by the same set of binding free energies. Furthermore, we used the same effective rotational diffusion constant for unwinding and rewinding and for nucleosomes containing H4 and nucleosomes containing H4-R45H. Because initial fitting revealed that the rates could be well described with ΔG55 = 0, this parameter was held fixed at zero for both types of nucleosome. Initial fitting also revealed that the rates depend only on the sum ΔG70 + ΔG65 + ΔG60. Therefore to further restrict the number of fitting parameters, we fixed ΔG70 = ΔG65 = ΔG60, corresponding to the maximum likelihood, when only the sum is determined. In the case of nucleosomes containing H4-R45H, the rates could be well described with ΔG70 = ΔG65 = ΔG60 = 0, and so these parameters were fixed equal to zero in this case. Finally, we fixed ΔG30 to be equal to ΔG35 and constrained these parameters to the values that ensure that the free energy of a nucleosome with H4 at F = F* = 6.0 pN is the same at locations 25.5 and 70.5, and that the free energy of a nucleosome containing H4-R45H at F = F* = 5.0 pN is the same at locations 25.5 and 70.5, consistent with the extrapolation of our experimental measurements. The resultant best fits are shown as the solid and dashed lines in Fig. 2, including the ad hoc term for the unwinding of nucleosomes containing H4. Evidently, the model rates provide a good description of our measurements. The corresponding best-fit parameters are shown Table I.
TABLE I.
Best-fit parameters that yield the model rates (lines) in Fig. 2.
| H4 | H4-R45H | |
|---|---|---|
| ΔG30 | −40.7 pN nm (−9.9kB T)* | −42.0 pN nm (−10.2 kB T)* |
| ΔG35 | −40.7 pN nm (−9.9 kB T)* | −42.0 pN nm (−10.2 kB T)* |
| ΔG40 | −21.5 ± 1.3 pN nm (−5.2 ± 0.3kB T) | −5.6 ± 2.0 pN nm (−1.4 ± 0. 5kB T) |
| ΔG45 | −34.1 ± 1.6 pN nm (−8.3 ± 0.4kB T) | −30.7 ± 1.1 pN nm (−7.5 ± 0.3kB T) |
| ΔG50 | −37.2 ± 2.6 pN nm (−9.1 ± 0.6kB T) | −32.6 ± 2.2 pN nm (−7.9 ± 0.5kB T) |
| ΔG55 | 0.0 pN nm** | 0.0 pN nm** |
| ΔG60 | −6.7 ± 0.5 pN nm (−1.6 ± 0.1kB T) | 0.0 pN nm** |
| ΔG65 | −6.7 pN nm (−1.6 kB T)*** | 0.0 pN nm** |
| ΔG70 | −6.7 pN nm (−1.6 kB T)*** | 0.0 pN nm** |
| δ | 0.82 ± 0.37 bp | 2.88 ± 0.33 bp |
| D | 5500 ± 990 bp2s−1**** | 5550 ± 990 bp2s−1**** |
| ΔG‡ | −128 ± 25 pN nm (32.9 ± 7.3kB T) | N.A. |
| x‡ | 8.3 ± 1.7 nm | N.A. |
Parameters constrained to ensure that the unwinding and rewinding rates are equal at F* and equal to each other.
Parameters fixed at zero.
Fixed equal to ΔG60.
Rates for nucleosomes containing H4 and nucleosomes containing H4-R45H were fit simultaneously using the same value of D for both data sets. The quoted errors correspond to the standard errors produced by Mathematica’s NonLinearModelFit via the ParameterErrors property.
IV. DISCUSSION
A. Mapping landscape to histone-DNA binding sites
It is important to realize that how to relate the binding locations across the free-energy landscape to specific positions within the nucleosome is not straightforward in the absence of additional information or assumptions. This is because each 5 bp of DNA between successive binding locations can detach from either side of the histone octamer, leading to the same reduction in the winding angle.
B. Mapping landscape to rates
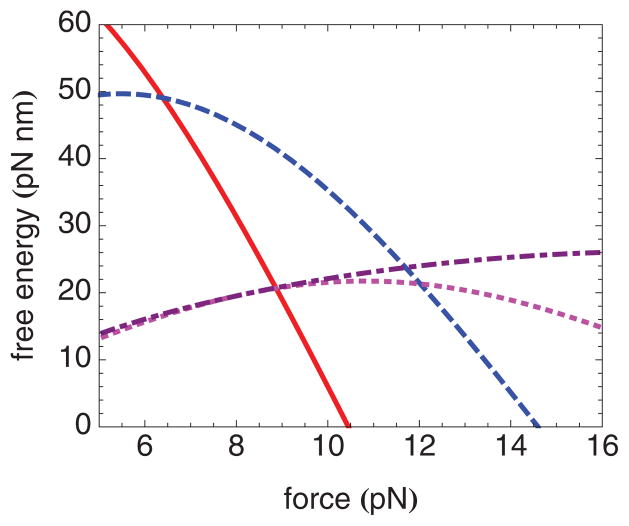
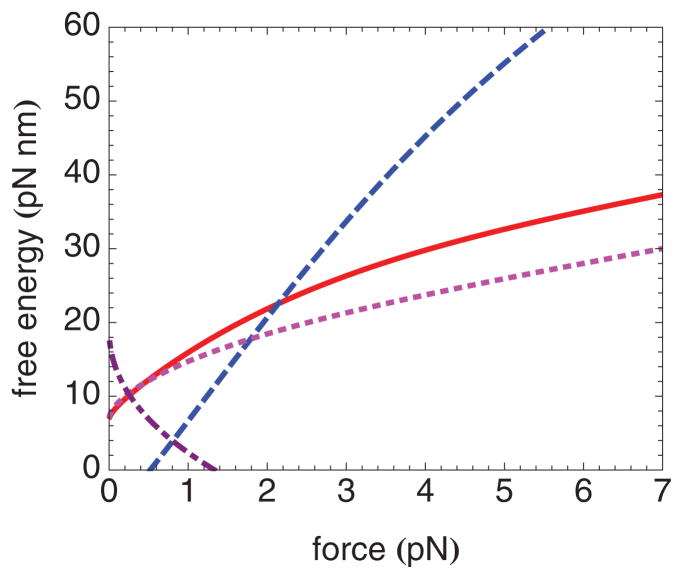
To understand which features of our model free-energy landscape determine the unwinding and rewinding rates and how well each of the fitting parameters is determined, it is instructive to plot the difference in free energy between the starting location (location 70.5 for unwinding and location 25.5 for rewinding) and various intermediate locations on the unwinding or the rewinding pathway. The largest of such free-energy differences are shown using the best-fit parameters for nucleosomes containing H4 in Fig. 8 (unwinding) and Fig. 9 (rewinding). Each of these curves represents a free-energy barrier to unwinding. We may expect the largest free-energy barrier to unwinding at a particular force to be rate limiting at that force. Clearly, for forces up to about 6.5 pN, the rate-limiting barrier to unwinding is at location 45; for forces between about 6.5 and 11.5 pN, the rate-limiting barrier to unwinding is at location 50; for forces above about 11.5 pN, the rate-limiting barrier to unwinding is at the location of the elastic free-energy maximum.
FIG. 8.
(Color online) Free-energy differences as a function of force, between location 70.5 and location 45 (solid line), location 70.5 and location 50 (dashed line), location 70.5 and location 55 (dotted line), and location 70.5 and the location of the elastic free-energy maximum (dot-dashed line), calculated using the best-fit parameters corresponding to nucleosomes containing H4. The largest of these free-energy differences at a given force is rate limiting at that force.
FIG. 9.
(Color online) Free-energy differences as a function of force between location 35.5 and location 40 (solid line), location 35.5 and location 45 (dashed line), location 30.5 and location 35 (dotted line), and location 50.5 and location 70 (dot-dashed line), calculated using the best-fit parameters corresponding to nucleosomes containing H4. The largest of these free-energy differences at a given force is rate limiting at that force.
In the context of our free-energy landscape model, the maximum barrier height for unwinding at the elastic free-energy maximum depends on ΔG70 + ΔG65 + ΔG60; at location 50, it depends additionally on ΔG50; and, at location 45, it depends additionally on ΔG45. Therefore, we may expect ΔG70 + ΔG65 + ΔG60, ΔG50, and ΔG45 to be well determined by fitting the unwinding rates. For a given value of their sum, maximum likelihood corresponds to ΔG70 = ΔG65 = ΔG60. Hence we fixed ΔG70 = ΔG65 = ΔG60 for fitting. Importantly, for forces above 11.5 pN, the barrier to unwinding actually increases slightly with increasing force. This feature of the model naturally accounts for the experimental observation that the unwinding rate is nearly force independent within the force range between 11.5 and 14 pN. Thus we assert that this feature of our data is especially convincing evidence that a correct description indeed involves the elastic free-energy barrier in an essential fashion. The corresponding plot for nucleosomes containing H4-R45H (not shown) reveals that within the range of forces studied experimentally the rate-limiting barrier is either at location 45 or at location 50.
This is a result of ΔG70 = ΔG65 = ΔG60 = 0 for nucleosomes containing H4-R45H.
For rewinding, Fig. 9 reveals that for forces between about 0.3 and 2 pN, the free-energy barrier to rewinding corresponds to the force-dependent elastic energy involved in rewinding from location 35.5 to location 40. The height of this barrier is independent of any of our binding energy parameters, except insofar as they partition the free-energy landscape so that this is the highest barrier. For forces between about 2 and 6 pN, the free-energy barrier for rewinding corresponds to the elastic energy involved in rewinding from location 35.5 to location 45, which depends on ΔG40, which we may therefore expect to be well determined by fits to the rewinding rate. The values of ΔG30 and ΔG35 are not well determined by fitting. Rather ΔG30 + ΔG35 is constrained by knowing that the free energy of states 0 and 1 are equal at F*. The ΔG30 = ΔG35 is the maximum likelihood result, given that only the sum is known.
C. Alternative models
We may inquire how well our rate measurements and model are able to discriminate against alternative models of histone-DNA binding. For example, a number of authors have postulated a constant histone-DNA binding free energy per bp [12,16,23,45], albeit often with different values for the inner and outer turns. Accordingly, we have calculated the force-dependent rates expected in the case of a constant histone-DNA binding free energy per base pair of 4.1 pNnm per bp, or equivalently 12 pN. We picked a value of 12 pN in order to ensure that the free energy for a winding angle of 25 bp is equal to the free energy for a winding angle of 70 bp at a force of 6 pN.
These calculations are compared with the experimental results for nucleosomes containing H4 and the results of our model in Fig. 10. The corresponding free-energy landscape is shown in Fig. 11. The constant-binding-energy-per-bp model predicts unwinding and rewinding rates with significantly different force dependences than observed experimentally and reproduced by our model. In addition, the unwinding rate is a factor of about 100-fold slower than observed. Thus our data and modeling rule out such a model. We also tested models that impose a 10 bp spacing between histone-DNA binding sites, but were unable to achieve satisfactory fits with such a model (not shown).
FIG. 10.
(Color online) Comparison between the unwinding and rewinding rates of the nucleosome inner turn, calculated according to the local interaction model of histone-DNA interactions, and calculated according to a model that posits a uniform binding free energy per unit length. The upper (red) solid and dashed lines correspond to the unwinding and rewinding rates, respectively, for the best-fit local interaction model for nucleosomes containing H4 The dotted line is the local interaction model, but omitting the ad hoc term, described in the text. Circles and squares correspond to the measured unwinding and rewinding rates, respectively, for nucleosomes containing H4. The lower solid and dashed curves correspond to the unwinding and rewinding rates, respectively, for a constant histone-DNA binding energy per bp, chosen so that at a force of 6 pN the free energies of 25 and 70 bp wound are equal.
FIG. 11.
(Color online) Model free-energy landscapes for the nucleosome inner turn at, from bottom to top, 0, 2, 4, 6, 8, 12, and 16 pN. The solid curves reproduce those shown in Fig. 7, for which each step down corresponds to the disruption of one set of histone-DNA bonds occurring over a small range of winding angles equivalent to 1 bp. The dotted curves correspond to a constant histone-DNA binding energy per bp (corresponding to 12 pN), chosen so that at a force of 6 pN the free energies of 25 and 70 bp wound are equal.
D. Effective rotational diffusion constant
According to our fitting results, the effective rotational diffusion coefficient of the nucleosome is 5500 bp2 s−1. In comparison, the rotational diffusion coefficient of a sphere of radius R = 4.2 nm is given by
| (16) |
where η = 0.001 Pas is the viscosity of the fluid in which the sphere rotates. Therefore, there is a factor 5 × 10⁴ discrepancy between our measured value of D and the value appropriate for free rotation of a sphere of nucleosomal radius. How then does our best-fit value for the effective diffusion coefficient compare to results in the literature? Via fluorescence experiments, Li et al. measured the rewinding rate for 27 bp of the nucleosome outer turn to lie between 20 and 90 s−1 at zero force [46]. Based on our measured rotational diffusion coefficient for the nucleosome inner turn, and assuming a flat coarse-grained free-energy landscape, we would predict a rate to rewrap 27 bp of 5500/272 = 8 s−1 close to the experimental result of Ref. [46]. In fact, for a free-energy landscape that is inclined downwards, as a result of histone-DNA binding, we may expect somewhat faster rewinding and even better agreement. Our results for D also seem consistent with the extrapolations to zero force of the nucleosome outer turn rewinding rates given in Refs. [16,17] of about 100 s−1 in both cases.
To explain the apparent discrepancy between our result for the rotational diffusion coefficient and Eq. (16), we turn to Refs. [47,48], which show theoretically that long-length-scale diffusion across a free-energy landscape with short-scale “roughness” may be described on the basis of a coarse-grained free-energy landscape with an effective diffusion coefficient that is renormalized by a factor that accounts for the short-scale roughness. References [47,48] are directly applicable here: the free-energy landscape shown in Fig. 7 is by construction a coarse-grained free energy, since the molecular details of the histone-DNA interaction are omitted. It follows that the diffusion coefficient that emerges from consideration of such a landscape is necessarily a renormalized diffusion coefficient. Because diffusion and friction are related via the Einstein relation, a renormalized diffusion coefficient may also be interpreted in terms of internal friction [49].
Our best-fit value of D = 5500 ± 990 bp2s−1 is the effective rotational diffusion coefficient, corresponding to the coarse-grained histone-DNA interaction free energy of Fig. 7. If we assume that the molecular-scale diffusion coefficient is D* = 5 × 10⁷ rads2s−1, then we have D/D* = 5 × 10⁻⁶. To facilitate comparisons with the results of Refs. [49] and [50], we estimate the roughness of the histone-DNA interaction at the scale of individual bonds via the expression for Gaussian landscape roughness, given in Ref. [47], namely . Thus we find ΔG ≃ 3.5kB T. In comparison, Ref. [50] determines a roughness of 5.7kB T for the forced unbinding of the GTPase Ran from the nuclear transport receptor importin-β, and Ref. [49] determines a roughness of 4kB T for stretching cellulose and dextran. Thus our results are in line with these studies, as well as with Ref. [46]. In fact, the reaction rates in single molecule experiments are generally orders of magnitude smaller than naive expectations. Presumably, this is because free-energy landscape roughness is ubiquitous.
E. Asymmetric unwinding model
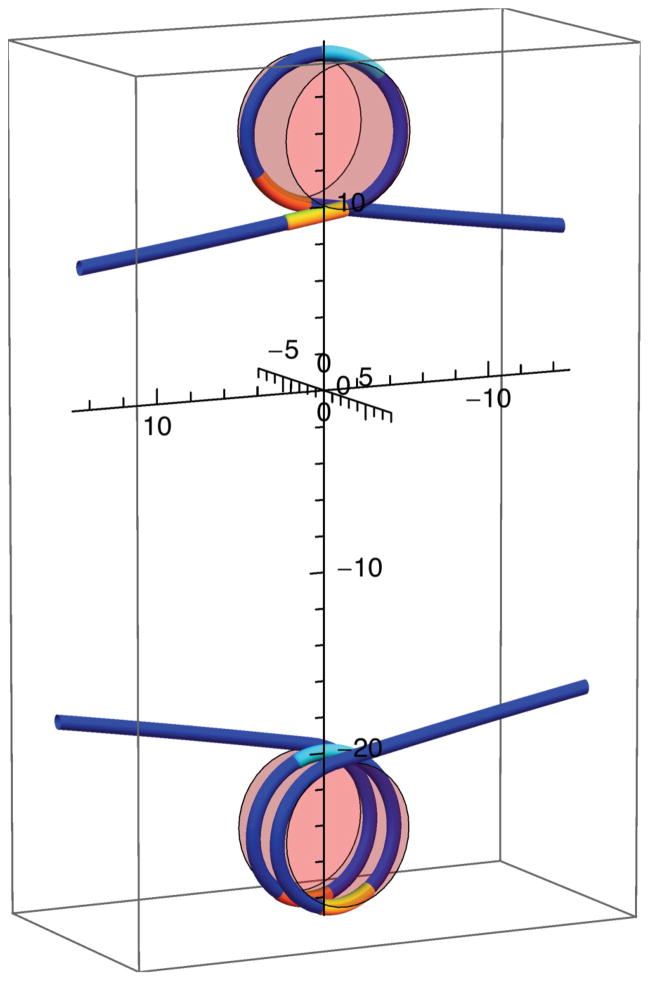
Why are the unwinding and rewinding rates of nucleosomes containing H4 different from those of nucleosomes containing H4-R45H? To answer this question, we return to the histone-DNA interaction map presented in Ref. [19]. In the context of the nucleosome inner turn, which contains a total of about 76 bp, inspection of the interaction map indicates that, if the nucleosome inner turn were to consist of DNA that is wound symmetrically ±38 bp from the dyad axis of the histone octamer, then the majority of both regions 1 and 3 would lie beyond the nucleosome inner turn. On the other hand, if the nucleosome inner turn is asymmetric with respect to the dyad axis and consists of base pair −55 to base 21, for example, relative to the dyad, then all or almost all of the binding energy from both region 1 and region 2 stabilizes the nucleosome inner turn. In this scenario, region 3 is involved solely in stabilizing the nucleosome outer turn. We therefore hypothesize, as shown schematically in Fig. 12, that the nucleosome under tension in state 1 realizes an asymmetric configuration, because of its lower free energy compared to the symmetric configuration. That an asymmetric partially unwound nucleosome configuration could be realized at zero force was suggested previously in Ref. [51].
FIG. 12.
(Color online) Elastic-rod models of nucleosomal DNA in state 1 at 8 pN, depicted as 75 bp (top), and in state 2 at 2 pN, depicted as 147 bp (bottom). The three regions of DNA that form strong histone-DNA bonds in the canonical nucleosome structure (state 2), according to Ref. [19], are shown lighter (orange, cyan, and yellow for region 1, the dyad region or region 2, and region 3, respectively). In the figure, in state 2, the DNA is depicted symmetrically arranged about the center of nucleosome dyad (cyan). However, in state 1, in which about 75 base pairs of DNA are wound around the histone octamer, because regions 1 and 3 are separated by more than about 75 base pairs (see Fig. 1 of Ref. [19]), histone-DNA bonds in only two of the three regions of strong histone-DNA binding—either regions 1 and 2 or regions 2 and 3—can be simultaneously satisfied. This is indicated in the figure by the region-3 DNA (yellow), that was bound to the histone octamer in state 2, being not in contact with the histone octamer, and therefore not bound, in state 1. According to this hypothesis, symmetry about the nucleosome dyad is not preserved in state 1, as illustrated in the figure. The axes are marked in nanometers.
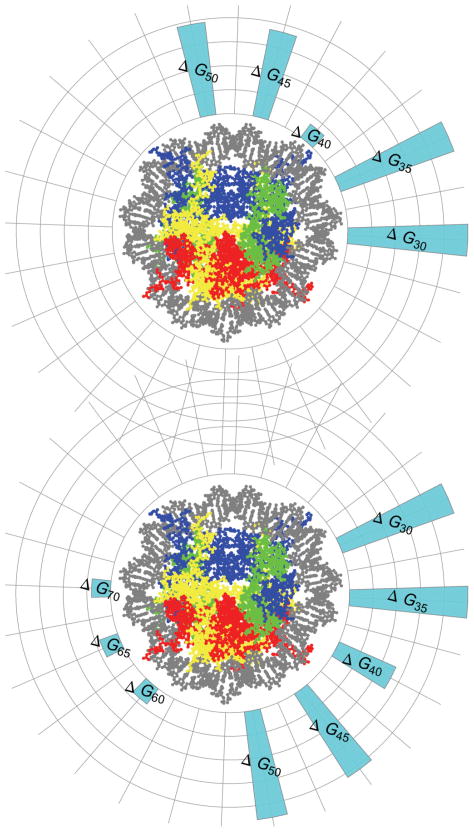
According to this hypothesis, in order to unwind the nucleosome inner turn, it is necessary to break the strong histone-DNA bonds in either region 1 or region 2. If the binding in region 1 is weaker than in region 2 [19,24], we may expect unwinding to occur via breaking region 1 bonds. We hypothesize that this is the situation in the case of nucleosomes containing H4. Assuming a linear relationship between binding location and position within the nucleosome, we may expect that the strong bonding near the dyad spans winding angles from 0 to about 25 bp, and the landscape described by our fitting parameters for nucleosomes containing H4 corresponds to region 1. This hypothetical situation is illustrated in the bottom panel of Fig. 13. By contrast, for nucleosomes containing H4-R45H, we suppose that the binding energy in region 2 is reduced, so that it is now smaller than the binding energy in region 1. As a result, in this scenario, unwinding occurs by breaking region 2 bonds, and the landscape described by our fitting parameters in the case of nucleosomes with H4-R45H corresponds to region 2. This hypothetical situation is illustrated in the top panel of Fig. 13. According to this hypothesis, the bonds disrupted in the transition from state 1 to state 0 are different for nucleosomes containing H4 than for nucleosomes containing H4-R45H. Therefore, as a result, we may expect that the force-dependent rate for unwinding the nucleosome inner turn of nucleosomes containing H4-R45H will be different than that for nucleosomes containing H4, as we observe experimentally. Furthermore, on this basis, we predict that nucleosomes containing H4 and nucleosomes containing H4-R45H show different dissociation rates to the unbound state. However, since unwinding and rewinding the nucleosome outer turn does not involve region 2 bonds, we also predict that the winding and unwinding rates of these nucleosomes’ outer turn are the same for nucleosomes containing H4 and nucleosomes containing H4-R45H.
FIG. 13.
(Color online) Hypothetical mapping of binding energies to nucleosome locations. Bottom: hypothetical mapping of bond energies to nucleosome locations for nucleosomes containing H4. Top: hypothetical mapping of bond energies to nucleosome locations for nucleosomes containing H4-R45H. The height of the bars corresponds to the binding energy at that location. The innermost circular grid line corresponds to zero binding energy, the next to 2kB T, the next to 4kB T, the next to 6kB T, and the outermost to 8kB T.
V. CONCLUSIONS
Building on the experiments presented in Ref. [22], the principal result of this paper is that the force-dependent unwinding and rewinding rates of the nucleosome inner turn can be explained (except at the highest forces) on the basis of a simple, physical model that incorporates in an essential fashion both the elastic free-energy barrier to unwinding and rewinding introduced in Ref. [12] and elaborated in Refs. [16,23], and localized histone-DNA binding with an approximate 5 bp periodicity, as proposed in Ref. [19]. This analysis provides insight into nucleosome winding and unwinding, the energetics of histone-DNA interactions, and will be important for the growing numbers of simulations of nucleosome and chromatin behavior that are appearing in the literature [52–65]. Beyond an improved understanding of nucleosome unwinding and rewinding, these results also have important implications for theories of nucleosome sliding [45,66–69], other processes that involve partial or complete unwinding of dsDNA from the histone octamer [7], and the mechanisms of eukaryotic gene expression more generally [4–6].
Acknowledgments
We thank J. Antonypillai, C. Cheng, R. Ilagen, and J. Marko for valuable discussions. This work was supported by the Raymond and Beverly Sackler Institute for Biological, Physical and Engineering Sciences and NSF PoLS 1019147. D.J.S. is the recipient of a NSF Graduate Research Fellowship. M.K. acknowledges the support of a NSF Postdoctoral Research Fellowship in Biology Award DBI-1103715.
References
- 1.Luger K, Mader AW, Richmond RK, Sargent DF, Richmond TJ. Nature (London) 1997;389:251. doi: 10.1038/38444. [DOI] [PubMed] [Google Scholar]
- 2.Davey CA, Sargent DF, Luger K, Maeder AW, Richmond TJ. J Mol Biol. 2002;319:1097. doi: 10.1016/S0022-2836(02)00386-8. [DOI] [PubMed] [Google Scholar]
- 3.Chua E, Vasudevan D, Davey G, Wu B, Davey C. Nucleic Acids Res. 2012;40:6338. doi: 10.1093/nar/gks261. [DOI] [PMC free article] [PubMed] [Google Scholar]
- 4.Boeger H, Griesenbeck J, Strattan JS, Kornberg RD. Mol Cell. 2003;11:1587. doi: 10.1016/s1097-2765(03)00231-4. [DOI] [PubMed] [Google Scholar]
- 5.Adkins MW, Williams SK, Linger J, Tyler JK. Mol Cell Biol. 2007;27:6372. doi: 10.1128/MCB.00981-07. [DOI] [PMC free article] [PubMed] [Google Scholar]
- 6.Kim HD, O’Shea EK. Nat Struct: Mol Biol. 2008;15:1192. doi: 10.1038/nsmb.1500. [DOI] [PMC free article] [PubMed] [Google Scholar]
- 7.Saha A, Wittmeyer J, Cairns BR. Nat Rev Mol Cell Biol. 2006;7:437. doi: 10.1038/nrm1945. [DOI] [PubMed] [Google Scholar]
- 8.Cui Y, Bustamante C. Proc Natl Acad Sci USA. 2000;97:127. doi: 10.1073/pnas.97.1.127. [DOI] [PMC free article] [PubMed] [Google Scholar]
- 9.Bennink ML, Leuba SH, Leno GH, Zlatanova J, de Grooth BG, Greve J. Nat Struct Biol. 2001;8:606. doi: 10.1038/89646. [DOI] [PubMed] [Google Scholar]
- 10.Brower-Toland B, Smith CL, Yeh RC, Lis JT, Peterson CL, Wang MD. Proc Natl Acad Sci USA. 2002;99:1960. doi: 10.1073/pnas.022638399. [DOI] [PMC free article] [PubMed] [Google Scholar]
- 11.Pope LH, Bennink ML, Greve J. J Muscle Res Cell Motil. 2002;23:397. doi: 10.1023/a:1023450204528. [DOI] [PubMed] [Google Scholar]
- 12.Kulic IM, Schiessel H. Phys Rev Lett. 2004;92:228101. doi: 10.1103/PhysRevLett.92.228101. [DOI] [PubMed] [Google Scholar]
- 13.Brower-Toland B, Wacker DA, Fulbright RM, Lis JT, Kraus WL, Wang MD. J Mol Biol. 2005;346:135. doi: 10.1016/j.jmb.2004.11.056. [DOI] [PubMed] [Google Scholar]
- 14.Gemmen GJ, Sim R, Haushalter KA, Ha PC, Kadonaga JT, Smith DE. J Mol Biol. 2005;351:89. doi: 10.1016/j.jmb.2005.05.058. [DOI] [PubMed] [Google Scholar]
- 15.Pope LH, Bennink ML, van Leijenhorst-Groener KA, Nikova D, Greve J, Marko JF. Biophys J. 2005;88:3572. doi: 10.1529/biophysj.104.053074. [DOI] [PMC free article] [PubMed] [Google Scholar]
- 16.Mihardja S, Spakowitz AJ, Zhang Y, Bustamante C. Proc Natl Acad Sci USA. 2006;103:15871. doi: 10.1073/pnas.0607526103. [DOI] [PMC free article] [PubMed] [Google Scholar]
- 17.Kruithof M, van Noort J. Biophys J. 2009;96:3708. doi: 10.1016/j.bpj.2009.01.048. [DOI] [PMC free article] [PubMed] [Google Scholar]
- 18.Kruithof M, Chien FT, Routh A, Logie C, Rhodes D, van Noort J. Nat Struct: Mol Biol. 2009;16:534. doi: 10.1038/nsmb.1590. [DOI] [PubMed] [Google Scholar]
- 19.Hall MA, Shundrovsky A, Bai L, Fulbright RM, Lis JT, Wang MD. Nat Struct: Mol Biol. 2009;16:124. doi: 10.1038/nsmb.1526. [DOI] [PMC free article] [PubMed] [Google Scholar]
- 20.Simon M, North JA, Shimko JC, Forties RA, Ferdinand MB, Manohar M, Zhang M, Fishel R, Ottesen JJ, Poirier MG. Proc Natl Acad Sci USA. 2011;108:12711. doi: 10.1073/pnas.1106264108. [DOI] [PMC free article] [PubMed] [Google Scholar]
- 21.Mollazadeh-Beidokhti L, Mohammad-Rafiee F, Schiessel H. Biophys J. 2012;102:2235. doi: 10.1016/j.bpj.2012.04.012. [DOI] [PMC free article] [PubMed] [Google Scholar]
- 22.Mack AH, Schlingman DJ, Ilagan R, Regan L, Mochrie SGJ. J Mol Biol. 2012;423:687. doi: 10.1016/j.jmb.2012.08.021. [DOI] [PMC free article] [PubMed] [Google Scholar]
- 23.Sudhanshu B, Mihardja S, Koslover EF, Mehraeen S, Bustamante C, Spakowitz AJ. Proc Natl Acad Sci USA. 2011;108:1885. doi: 10.1073/pnas.1010047108. [DOI] [PMC free article] [PubMed] [Google Scholar]
- 24.Forties RA, North JA, Javaid S, Tabbaa OP, Fishel R, Poirier MG, Bundschuh R. Nucleic Acids Res. 2011;39:8306. doi: 10.1093/nar/gkr422. [DOI] [PMC free article] [PubMed] [Google Scholar]
- 25.Sternberg PW, Stern MJ, Clark I, Hershkowitz I. Cell. 1987;48:567. doi: 10.1016/0092-8674(87)90235-2. [DOI] [PubMed] [Google Scholar]
- 26.Kruger W, Peterson CL, Sil A, Coburn C, Arents G, Moudrianakis EN, Hershkowitz I. Genes Dev. 1995;9:2770. doi: 10.1101/gad.9.22.2770. [DOI] [PubMed] [Google Scholar]
- 27.Wechser MA, Kladde MP, Alfieri JA, Peterson CL. EMBO J. 1997;16:2086. doi: 10.1093/emboj/16.8.2086. [DOI] [PMC free article] [PubMed] [Google Scholar]
- 28.Muthurajan UM, Bao Y, Forsberg LJ, Edayathumangalam RS, Dyer PN, White CL, Luger K. EMBO J. 2004;23:260. doi: 10.1038/sj.emboj.7600046. [DOI] [PMC free article] [PubMed] [Google Scholar]
- 29.Flaus A, Rencurel C, Ferreira H, Wiechens N, Owen-Hughes T. EMBO J. 2004;23:343. doi: 10.1038/sj.emboj.7600047. [DOI] [PMC free article] [PubMed] [Google Scholar]
- 30.Kurumizaka H, Wolffe AP. Mol Cell Biol. 1997;17:6953. doi: 10.1128/mcb.17.12.6953. [DOI] [PMC free article] [PubMed] [Google Scholar]
- 31.Jenuwein T, Allis CD. Science. 2001;293:1074. doi: 10.1126/science.1063127. [DOI] [PubMed] [Google Scholar]
- 32.Fraga MF, Esteller M. Cell Cycle. 2005;4:1377. doi: 10.4161/cc.4.10.2113. [DOI] [PubMed] [Google Scholar]
- 33.Ausió J. Brief Funct Genomic Proteomic. 2006;5:228. doi: 10.1093/bfgp/ell020. [DOI] [PubMed] [Google Scholar]
- 34.Montel F, Menoni H, Castelnovo M, Bednar J, Dimitrov S, Angelov D, Faivre-Moskalenko C. Biophys J. 2009;97:544. doi: 10.1016/j.bpj.2009.04.042. [DOI] [PMC free article] [PubMed] [Google Scholar]
- 35.Henikoff S. Nat Rev Genet. 2008;9:15. doi: 10.1038/nrg2206. [DOI] [PubMed] [Google Scholar]
- 36.Tinoco I, Bustamante C. Biophys Chem. 2002;102:513. doi: 10.1016/s0301-4622(02)00177-1. [DOI] [PubMed] [Google Scholar]
- 37.Bell GI. Science. 1978;200:618. doi: 10.1126/science.347575. [DOI] [PubMed] [Google Scholar]
- 38.Dudko OK, Hummer G, Szabo A. Phys Rev Lett. 2006;96:108101. doi: 10.1103/PhysRevLett.96.108101. [DOI] [PubMed] [Google Scholar]
- 39.Wiggins PA, van der Heijden T, Moreno-Herrero F, Spakowitz A, Phillips R, Widom J, Dekker C, Nelson PC. Nat Nanotechnol. 2006;1:137. doi: 10.1038/nnano.2006.63. [DOI] [PubMed] [Google Scholar]
- 40.Luscombe NM, Laskowski RA, Thornton JM. Nucleic Acids Res. 1997;25:4940. doi: 10.1093/nar/25.24.4940. [DOI] [PMC free article] [PubMed] [Google Scholar]
- 41.Hanggi P, Talkner P, Borkovec M. Rev Mod Phys. 1990;62:251. [Google Scholar]
- 42.Redner S. A Guide to First-Passage Possesses. Cambridge University Press; New York: 2001. [Google Scholar]
- 43.Privman V, Frisch HL. J Chem Phys. 1991;94:8216. [Google Scholar]
- 44.Palyulin VV, Metzler R. J Stat Mech: Theory Exp. 2012:L03001. [Google Scholar]
- 45.Schiessel H, Widom J, Bruinsma RF, Gelbart WM. Phys Rev Lett. 2001;86:4414. doi: 10.1103/PhysRevLett.86.4414. [DOI] [PubMed] [Google Scholar]
- 46.Li G, Levitus M, Bustamante C, Widom J. Nat Struct: Mol Biol. 2005;12:46. doi: 10.1038/nsmb869. [DOI] [PubMed] [Google Scholar]
- 47.Zwanzig R. Proc Natl Acad Sci USA. 1988;85:2029. doi: 10.1073/pnas.85.7.2029. [DOI] [PMC free article] [PubMed] [Google Scholar]
- 48.Hyeon C, Thirumalai D. Proc Natl Acad Sci USA. 2003;100:10249. doi: 10.1073/pnas.1833310100. [DOI] [PMC free article] [PubMed] [Google Scholar]
- 49.Khatri BS, Kawakami M, Byrne K, Smith DA, McLeish TCB. Biophys J. 2007;92:1825. doi: 10.1529/biophysj.106.097709. [DOI] [PMC free article] [PubMed] [Google Scholar]
- 50.Nevo R, Brunfeld V, Kapon R, Hinterdorfer P, Reich Z. EMBO Rep. 2005;6:482. doi: 10.1038/sj.embor.7400403. [DOI] [PMC free article] [PubMed] [Google Scholar]
- 51.Polach KJ, Widom J. J Mol Biol. 1995;254:130. doi: 10.1006/jmbi.1995.0606. [DOI] [PubMed] [Google Scholar]
- 52.Grigoryev SA, Arya G, Correll S, Woodcock CL, Schlick T. Proc Natl Acad Sci USA. 2009;106:13317. doi: 10.1073/pnas.0903280106. [DOI] [PMC free article] [PubMed] [Google Scholar]
- 53.Schlick T, Perisic O. Phys Chem Chem Phys. 2009;11:10729. doi: 10.1039/b918629h. [DOI] [PMC free article] [PubMed] [Google Scholar]
- 54.Materese CK, Savelyev A, Papoian GA. J Am Chem Soc. 2009;131:15005. doi: 10.1021/ja905376q. [DOI] [PubMed] [Google Scholar]
- 55.Ponomarev SY, Putkaradze V, Bishop TC. Phys Chem Chem Phys. 2009;11:10633. doi: 10.1039/b910937b. [DOI] [PubMed] [Google Scholar]
- 56.Wocjan T, Klenin K, Langowski J. J Phys Chem B. 2009;113:2639. doi: 10.1021/jp806137e. [DOI] [PubMed] [Google Scholar]
- 57.Higuchi Y, Sakaue T, Yoshikawa K. Phys Rev E. 2010;82:031909. doi: 10.1103/PhysRevE.82.031909. [DOI] [PubMed] [Google Scholar]
- 58.Stehr R, Schopflin R, Ettig R, Kepper N, Rippe K, Wedemann G. Biophys J. 2010;98:1028. doi: 10.1016/j.bpj.2009.11.040. [DOI] [PMC free article] [PubMed] [Google Scholar]
- 59.Ettig R, Kepper N, Stehr R, Wedemann G, Rippe K. Biophys J. 2011;101:1999. doi: 10.1016/j.bpj.2011.07.057. [DOI] [PMC free article] [PubMed] [Google Scholar]
- 60.Biswas M, Voltz K, Smith JC, Langowski J. PLOS Comput Biol. 2011;7:e1002279. doi: 10.1371/journal.pcbi.1002279. [DOI] [PMC free article] [PubMed] [Google Scholar]
- 61.Korolev N, Fan Y, Lyubartsev AP, Nordenskiold L. Curr Opin Struct Biol. 2012;22:151. doi: 10.1016/j.sbi.2012.01.006. [DOI] [PubMed] [Google Scholar]
- 62.Cao Q, Zuo C, Ma Y, Li L, Zhang Z. Soft Matter. 2011;7:506. [Google Scholar]
- 63.Voltz K, Trylska, Calimet N, Smith JC, Langowski J. Biophys J. 2012;102:849. doi: 10.1016/j.bpj.2011.11.4028. [DOI] [PMC free article] [PubMed] [Google Scholar]
- 64.Kulaeva OI, Zheng G, Polikanov YS, Colasanti AV, Clauvelin N, Mukhopadhyay S, Sengupta AM, Studitsky VM, Olson WK. J Biol Chem. 2012;287:20248. doi: 10.1074/jbc.M111.333104. [DOI] [PMC free article] [PubMed] [Google Scholar]
- 65.Dobrovolskaia IV, Arya G. Biophys J. 2012;103:989. doi: 10.1016/j.bpj.2012.07.043. [DOI] [PMC free article] [PubMed] [Google Scholar]
- 66.Chou T. Phys Rev Lett. 2007;99:058105. doi: 10.1103/PhysRevLett.99.058105. [DOI] [PubMed] [Google Scholar]
- 67.Mollazadeh-Beidokhti L, Deseigne J, Lacoste D, Mohammad-Rafiee F, Schiessel H. Phys Rev E. 2009;79:031922. doi: 10.1103/PhysRevE.79.031922. [DOI] [PubMed] [Google Scholar]
- 68.Padinhateeria R, Marko JF. Proc Natl Acad Sci USA. 2011;108:7799. doi: 10.1073/pnas.1015206108. [DOI] [PMC free article] [PubMed] [Google Scholar]
- 69.Biswas M, Wocjan T, Langowski J, Smith JC. Europhys Lett. 2012;97:38004. [Google Scholar]


