


Abstract
The androgen receptor (AR) is a key regulator of prostate tumorgenesis through actions that are not fully understood. We identified the repressor element (RE)-1 silencing transcription factor (REST) as a mediator of AR actions on gene repression. Chromatin immunoprecipitation showed that AR binds chromatin regions containing well-characterized cis-elements known to mediate REST transcriptional repression, while cell imaging studies confirmed that REST and AR closely co-localize in vivo. Androgen-induced gene repression also involves modulation of REST protein turnover through actions on the ubiquitin ligase β-TRCP. Androgen deprivation or AR blockage with inhibitor MDV3100 (Enzalutamide) leads to neuroendocrine (NE) differentiation, a phenomenon that is mimicked by REST inactivation. Gene expression profiling revealed that REST not only acts to repress neuronal genes but also genes involved in cell cycle progression, including Aurora Kinase A, that has previously been implicated in the growth of NE-like castration-resistant tumors. The analysis of prostate cancer tissue microarrays revealed that tumors with reduced expression of REST have higher probability of early recurrence, independently of their Gleason score. The demonstration that REST modulates AR actions in prostate epithelia and that REST expression is negatively correlated with disease recurrence after prostatectomy, invite a deeper characterization of its role in prostate carcinogenesis.
INTRODUCTION
The androgen receptor (AR) plays a key role in prostate cancer (PCa) development at all stages (1–3). The importance of the AR in PCa progression seems at odds with its function in controlling differentiation of the normal prostate epithelial cells and the fact that PCa incidence increases with aging, when the levels of circulating androgens are reduced (4,5). In the normal prostate gland, the luminal epithelial cells express high AR levels. These AR+ cells are terminally differentiated and quiescent (6,7). However, there is a population of AR+ cancer-initiating cells in the prostate, suggesting a role for AR in cancer development that is supported by the effectiveness of castration therapy (8).
The AR is a ligand-dependent transcription factor belonging to the nuclear hormone receptor superfamily. The paradigm of gene regulation by androgens indicates that on dihydrotestosterone (DHT) binding, the AR translocates to the nucleus where it binds androgen responsive elements (ARE). This binding is followed by the recruitment of co-regulators and the RNA polymerase II complex, which leads to chromatin modifications and altered transcription (9,10). The recent application of chromatin immunoprecipitation (ChIP) combined with next-generation sequencing have altered our understanding of the AR mechanisms of action (11–13). It is now clear that most of the AR binding to enhancer or promoter regions does not result in an activation of transcription in proximal genes (14). Transcriptional induction by the AR requires its binding to chromatin regions poised for transcriptional activation. Directing the AR to such regions may involve interaction with other DNA-bound transcription factors in gene enhancers (11). The fact that there are many cryptic AR binding sites in the genome that could be activated if the appropriate chromatin remodeling occurs has significant implications, as PCa progression is accompanied by genetic instability and chromatin remodeling. This may alter the AR transcriptional program in tumor cells and help to explain the duality of the AR role as a pro-differentiating factor in normal epithelial cells and a tumor promoter in cancer cells (14–16).
In this study, we analyzed the sequence content of human gene promoter regions occupied by AR on DHT stimulation to identify enrichment in DNA elements corresponding to known transcription factor binding sites. A novel mechanism for AR control of transcription and cell differentiation, mediated by repressor element (RE)-1 silencing transcription factor (REST), was identified. The expression of REST in localized tumors was also analyzed.
MATERIALS AND METHODS
Materials
The anti-AR antibodies N20 (SC-816), 441 (SC-7305) and PG21 (Millipore), anti-β-actin (SC130301), anti-REST (SC-25398, HPA006079, Ab21635, 07-579), anti-chromogranin A (Ab-15160), β-TRCP (SC-33213), fluorescein-conjugated anti-mouse IgG and anti-rabbit IgG were obtained from Santa Cruz Biotechnologies. DHT and R1881 were obtained from Sigma-Aldrich (St. Louis, MO, USA). The control siRNA and those targeting the AR, REST and β-TRCP were purchased from Qiagen (Valencia, CA, USA). siRNAs with a modified backbone (LNAs) (Ambion, Carlsbad, CA, USA) for REST have been used for gene expression profiling.
Clinical samples
Tissue samples from 129 patients who underwent radical prostatectomy at the Department of Urology, Skåne University Hospital, Malmö, Sweden, were used to construct a tissue microarray (TMA), with duplicate tissue cores (1.0 mm in diameter), as previously described (17). A senior National Board–certified pathologist (L. Helczynski) examined the hematoxylin- and eosin-stained sections for Gleason grading. The study was approved by the ethics committee of Lund University, Sweden, and the Helsinki Declaration of Human Rights was strictly observed.
Cell culture
The human PCa cell lines LNCaP and CWR22RV1 were obtained from the American Tissue Culture Collection and grown in RPMI-1640, supplemented with l-glutamine and 10% fetal bovine serum. For the experiments involving androgen treatment, the cells were cultured in phenol red-free medium, supplemented with 5% dextran-coated charcoal-treated fetal bovine serum (HyClone Inc., Logan, UT, USA) for 48 h before exposure to the same medium containing 0.1% ethanol (control) or 10 nM DHT for the indicated time.
Chromatin immunoprecipitation
ChIP was performed using the anti-AR antibody (PG-21) and the anti-REST antibody (07–579), obtained from Millipore (Billerica, MA, USA) essentially as described (14,18). Microarray analysis was performed using the Human HG18 385K RefSeq promoter tiling array according to the protocols provided by NimbleGen (Roche, Mannheim, Germany). Data analysis was performed using the NimbleGen proprietary software, as described earlier (14). The Benjamini method was used to control the false discovery rate (FDR) at an FDR (α) level of 0.1. Regions with at least four consecutive probes passing the statistical threshold were considered as a peak, and then peaks were extended until the first insignificant probe was encountered. Overlapping peaks were merged. AR-occupied regions (ARORs) were defined as the peaks present in the two independently replicated experiments (Supplementary Table S1). Polymerase chain reaction (PCR) analysis of ChIP products was performed as described (18).
Motif searches
To identify enriched transcription factor binding motifs within the ARORs, we used the TFBS computational framework for transcription factor binding site analysis (19,20). All AROR identified by the ChIP microarray analysis (average size of 500 bases) were included in the analysis. A reference set was generated from a group of randomly selected sequences corresponding to the genomic regions represented in the arrays matching the ARORs in average size and GC content. The GC content was 52.9% for the control regions and 50.1 and 59.6% for the ARORs in CWR22rv1 and LNCaP, respectively. The presence of sequences matching known TFBS in each of the regions was analyzed using the weight matrices contained in the JASPAR database (21). The TFBS searching was performed for a set of 129 model matrices using an 80% threshold for the sequence and matrix model similarity. A chi-square statistical analysis was used to compare the occurrence of individual TFBS in the set of references and target sequences. Ps < 0.01 were considered significant (Supplementary Table S2).
Quantitative reverse transcriptase-polymerase chain reaction
The measurements of mRNA levels were performed by quantitative reverse transcriptase-polymerase chain reaction (RT-PCR) as reported (22). Primer sequences can be found in Supplementary Table S3.
Western blot
The Neon transfection system (Invitrogen, Carlsbad, CA, USA) was used for transfection of siRNA into PCa cells following the manufacturer’s instructions. The preparation of cell lysates, western blot and immunoprecipitation procedures have been described (23). Quantification has been done using the Quantity One software from BIORAD (Hercules, CA, USA).
Luciferase reporter gene assays
The region corresponding to the nucleotides 47 429–47 529 on the X chromosome of the human genome was amplified by PCR. We then cloned the 5′ end of the minimal CMV promoter driving the firefly luciferase gene into the pGL4-luciferase vector (Promega, Fitchburg, WI, USA) to generate the pSYN-Luc vector. Mutations in the REST binding regions were introduced by site-directed mutagenesis using the QuickChange site-directed mutagenesis kit (Agilent Technologies, Santa Clara, CA, USA) with primers designed to remove five bases from the RE-1 element (Supplementary Table S3). The LNCaP cells were transfected with the pSYN-LUC or the pSYN-Mut Luc along with a control vector expressing Renilla luciferase (pGL4.74[hRluc/TK] Vector). Luminescence activity was measured with a Dual Luciferase assay system (Promega, Fitchburg, WI, USA). Renilla luciferase measurements were used for data normalization.
Immunofluorescence
The analysis was performed as described (24). The REST (1:50, Santa Cruz Biotechnology, Santa Cruz, CA, USA) and AR (1:100, Santa Cruz Biotechnology, Santa Cruz, CA, USA) antibodies were used as the primary antibodies. Secondary antibodies labeled with Alexa Flour 594 and Alexa Flour 488 (Invitrogen, Carlsbad, CA, USA) were used. The primary antibodies were omitted in the negative controls. Images were acquired using the Zeiss LSM 780 Axio Observer microscope. The analysis was performed using Zen 2009 image analysis software (Carl Zeiss, Oberkochen, Germany). A global threshold was set that clearly separated the background from the nucleic signal. Co-localization coefficients for the nucleus were then measured based on the global threshold for all pictures. For the immunofluorescent analysis of the TMAs, we used REST rabbit antibodies [Sigma (HPA006079), diluted to 1:150] and mouse monoclonal antibodies against chromogranin A [Millipore (MAB5268), diluted to 1:50].
In situ proximity ligation assay
We used the DuoLink in situ proximity ligation assay (Olink Bioscience, Uppsala, Sweden) to quantify the interaction between REST and AR in cells using the manufacturer’s protocol. The primary REST (H-290) and AR (441 and N20) antibodies were obtained from (Santa Cruz Biotechnology (Santa Cruz, CA, USA) and were used in 1:50 (REST) and 1:100 (AR) dilutions. As a positive control, two different AR antibodies were used, and in the negative control, one of the primary antibodies was excluded. The fluorescence signal was detected with a Zeiss LSM 78 Axio Observer. The number of fluorescent spots in each cell was quantified using FiJi in at least 15 cells from four independent images for each independent experiment. A 3D stack of each nucleus was used to acquire the number and volume of spots/cell; a global threshold was established to separate the spots, and the average number of spots/cell was calculated.
Neuroendocrine differentiation
LNCaP cells were transfected with REST and AR siRNAs, as described above. Steroid-depleted charcoal-stripped serum–containing medium was added the day after the transfection. Cells were grown for 6 days in the absence and presence of DHT. Four contrast phase pictures were taken per experimental group. The length of each membrane extension in the imaged cells was measured using the Image J software program and compared between the experimental groups. The experiment was performed three times.
Immunohistochemistry
Consecutive 4-µm thick TMA sections were used for immunohistochemistry, as reported (17). REST (1:75, Sigma, rabbit polyclonal) and AR (1:100, Thermo Fisher Scientific Inc., mouse monoclonal, code 441) were used as the primary antibodies. The resultant samples were scored as 0 (no staining), 1 (weak staining), 2 (moderate staining) or 3 (strong staining), and for REST, the predominant localization (k = nuclear; m = cytoplasmic; e = equally cytoplasmic/nuclear) was also recorded. Photographs were taken using an Olympus A × 70 microscope equipped with a Nikon DS-U1 digital camera. Kaplan–Meier survival curves and a Mantel–Cox test were performed using Prism software (GraphPad Software Inc.).
LNCaP orhotopic xenograft models
Eight male athymic Balb/c nude mice (Beijing HFK Bio-Technology Co. Ltd.) were injected subcutaneouslly with 2 × 10⁶ LNCaP cells suspended in 0.1 ml of Matrigel (BD Biosciences), half of the mice were castrated when tumors reached 10 mm and the tumors were allowed to grow back and later transplanted orthotopically into the prostate ventral lobe of intact or castrated Balb/c mice. The latter procedure was repeated at least twice before tumors were dissected and snap frozen for further analysis. All procedures for animal studies were conducted in compliance with the policies and regulations of Tianjin Medical University Institutional Animal Care and Use Committee (Tianjin, China).
Gene expression profiling
Genome-wide transcriptomics analysis was performed using the Agilent platform following manufacturer’s protocols (Agilent Technologies, Santa Clara, CA, USA). Total RNA was prepared from LNCaP cells transfected with three individual siRNAs targeting REST and a control siRNA targeting a nonrelevant gene (Luciferase). The chemically modified Silencer Select siRNAs were sourced from Ambion, Life Technologies (MA, USA). In addition, RNA was also prepared from LNCaP cells grown in normal medium, in steroid-depleted medium (denoted −DHT) for 5 days or from cells grown in steroid-depleted medium supplemented with 10 nM synthetic androgen R1881 for 5 days. The data sets have been deposited in the Gene Expression Omnibus database/Acc x and Acc y). Statistical analysis was performed using SAM (25) as implemented in MEV software tool (26). All genes identified as regulated (Supplementary Table S3) have an associated FDR of <1%.
RESULTS
The AR and REST bind to overlapping chromatin regions in PCa cells
We used ChIP to analyze the AR binding to gene promoter regions using a tiling microarray containing 375 000 oligonucleotide probes covering 2.7 kb centered on the transcription initiation sites of all known human genes. ChIP was performed on LNCaP and CWR22rv1 cells after treatment with synthetic androgen R1881 (10 nM) for 2 h. The study identified multiple ARORs in the vicinity of the human genes in the two PCa cell lines analyzed. In the LNCaP cells, 2461 AROR-containing gene promoters were identified, while 1200 were identified in the CWR22rv1 cells (Supplementary Table S1). We next proceed to validate our findings using ChIP in LNCaP cells treated with DHT for 2 h (Figure 1A). A significant induction of AR binding to promoter regions of genes FOXA3, PER1, SLC6A8, ADAMST8, AXL, CYP2B6, MCM5, NPC, PSA, RAI1, CAI1 and BDNF were observed, confirming the ChIP/microarray analysis (primer sequences can be found in Supplementary Table S3). We next analyzed the genes containing AROR for evidence of androgen regulation using data sets that measure androgen-induced expression changes (GEO database sets GSE7868 and GDS2057) or genes that are regulated by the AR-inhibitor bicalutamide (GDS2782). This analysis corroborate previous findings that induction of AR binding to promoter regions on DHT treatment does not generally correlate with changes in mRNA levels for the neighboring genes, but for a minority of genes [Figure 1B and (13)]. This is also in line with ChIP-sequencing data, indicating that most AR binding sites that regulate transcription occur in distant enhancers (14,27).
Figure 1.

Analysis of ARORs by ChIP. (A) Quantitative PCR analysis of AR binding to promoter region of ARE– and RE-1–containing genes in LNCaP cells treated or not with DHT for 2 h. All gene names are provided by genenames.org. Students t-test was used to analyze the statistical significance of the differences observed on DHT treated versus control samples (*P < 0.05 and **P < 0.01). (B) Heat map illustrating changes in expression on androgen or bicalutamide treatment for genes whose promoters bind AR in ChIP analysis. Data were obtained from GEO database (http://www.ncbi.nlm.nih.gov/geo/). The experiments accession numbers are indicated (C) ChIP microarray analysis. The number of regions containing binding sites for the indicated transcription factors within AROR (dark gray) or a set of control regions that did not bind the AR in the ChIP microarray analysis, denoted as controls (light gray). Only the TFBS, with a statistically significant (P < 0.05, χ2 analysis) overrepresentation within AROR, are shown. The transcription factor binding sites are named using JASPAR similarity matrix names as follows: REST, repressor element-1 silencing transcription factor; PPARG, peroxisome proliferation activated receptor gamma; AR, androgen receptor; NFκB, nuclear factor of kappa light polypeptide gene enhancer in B cells; D-Vit, vitamin D receptor; ESR1, estrogen receptor 1; MIZF, histone H4 transcription factor; bZIP911, ELK4, ETS domain proteins; E2F1, E2F transcription factor; Su(H), suppressor of hairless; NR2F1, nuclear receptor subfamily 2, group F, member 1; MAX MYC, Myc associated factor X; RREB1, Ras-responsive element binding protein 1; T, T box protein; TEAD1, transcriptional enhancer factor TEF1; and NR2F1, nuclear receptor subfamily 2, group F, family 1. (D) ChIP analysis of REST binding to promoter region of ARE and RE-1 containing genes in LNCaP cells treated or not with DHT for 2 h. The statistical significance was analyzed using Students t-test (*P < 0.01).
DNA sequence analysis of the AROR has the potential to identify AR interacting regulatory proteins (13). Therefore, we next analyzed the AROR identified in our study for the presence of known transcription factor response elements using the TFBS computational framework for transcription factor binding site analysis (19) and the JASPAR collection of weight matrices for transcription factor binding sites (20). Similarly to previous reports (13), the presence of AR response elements was identified in 15% of the AROR, a frequency significantly higher than that found in the control sequences but still a minor fraction of all the AROR (Figure 1C). This frequency is similar to the one reported by Massie et al. (13). The analysis also identified additional cis-regulatory elements that were overrepresented among the AROR, including binding sites for REST, NKX3.1, RREB1 and NFκB. The interaction between the AR and some of the transcription factors that have the capacity to bind these regions (e.g. NFκB and RREB1) have been previously demonstrated (28,29), indicating that this method applied to our data set can identify known AR interacting transcription factors. Despite the fact that only 430 AROR overlap in the CWR22rv1 and LNCaP cells lines, there is good concordance in the nature of the transcription factors predicted to interact with the AR between the two cell models (Figure 1C).
The previous analysis predicts that REST, a transcriptional repressor with a proposed role as a regulator of tumor growth and neuronal differentiation may bind to regions also recognized by AR and as such regulate its function (30–32). To confirm our predictions, we first analyzed whether AR associates to chromatin regions containing REST binding sites (RE-1). In Figure 1A, we confirm that RE-1 sites containing AROR in the vicinity of genes PER1, SLC6A8, FOXA3, RAI1 and BDNF bind AR on hormone treatment. Next, we explored whether REST was also able to bind these sites in response to DHT treatment. As shown in Figure 1D, REST was found to associate with RE-1 sites containing areas within the promoters of PER1, SLC6A8, FOXA3 and RAI1 but also to regions containing AR response elements in promoters of genes such as MCM5, ADAMST8, NPC1, CYP2B6 and AXL in response to DHT treatment. These genes contain no recognizable RE-1 sites. In summary, our data suggest that REST and AR may interact either physically or functionally to regulate transcription in response to androgens.
Next, we used confocal microscopy to analyze the co-localization of these two proteins through the analysis of the spatial relationship between the REST and AR proteins in LNCaP cells (Figure 2A). As previously described, both the AR and REST were preferentially expressed in the nucleus, although they were also detected in the cytosol (33,34). Image analysis of light intensities for individual pixels showed a significant correlation between the nuclear signal intensities in the 594 and 488 nm wavelengths that correspond with the REST and AR expression levels, respectively. This demonstrates that REST and AR coexist in close proximity within the nucleus of LNCaP cells. Significant co-localization was already observed in the cells deprived of androgen, with a pixel intensity correlation coefficient of 0.75. However, statistically significant increases in the co-localization coefficients of the nuclear REST and AR were evident after 2 and 48 h of androgen treatment (Figure 2B).
Figure 2.

Co-localization of REST and AR in PCa cells. (A) The protein expression levels of REST and AR were measured by co-staining with specific antibodies and visualized by immunofluorescence using a confocal microscope. Parallel images acquired for REST (594 nm) and AR (488 nm) were analyzed. Representative images of REST and AR expression in cells grown in DHT are shown. Nuclear staining was performed with DAPI. The images show the nuclear and cytosolic co-localization of REST and AR. (B) The correlation coefficient was calculated from the pixel signal intensity measurements acquired in both wavelengths and within the cell nucleus. This parameter is denoted as the AR/REST co-localization coefficient. Asterisk indicates statistically significant differences between DHT-treated and control cells (P < 0.001, Student’s t-test).
For a more quantitative assessment of the REST and AR interaction within cells, we used the proximity ligation assay. This methodology uses oligonucleotide-conjugated antibodies combined with a proximity sensitive DNA ligation step and a DNA polymerase-generated high-intensity fluorescent signal to assess whether the two proteins are located within close proximity in situ (35). Our results, depicted in Figure 3A, showed that the ligation assays performed in the presence of the AR and REST antibodies resulted in strong punctuated signals in the nucleus of the LNCaP cells, indicating a close proximity between the AR and REST in vivo. Quantification of the number of individual spots demonstrated a statistically significant association between REST and the AR that was further stimulated by androgen treatment (Figure 3B).
Figure 3.
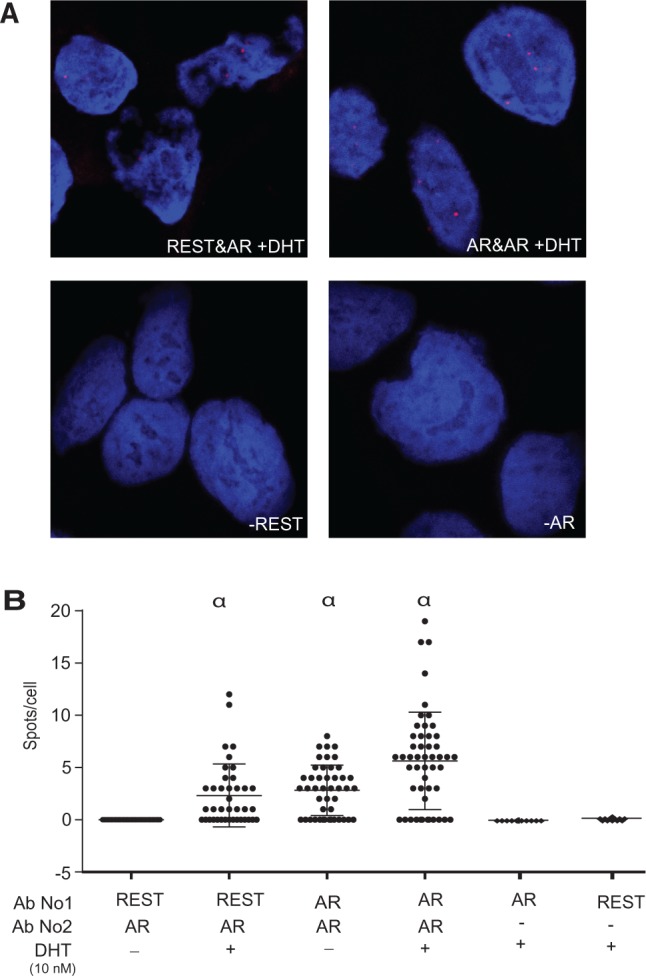
In situ proximity ligation assays. (A) Representative images of REST/AR co-localization in situ visualized by the proximity ligation assays. LNCaP cells were stained with REST and/or AR antibodies as indicated and subjected to proximity ligation assays to measure their co-localization in situ, visualized by the appearance of high-intensity fluorescent spots at the 634 nm wavelength. Two different antibodies recognizing the AR and raised from different species were used as positive controls. Analyses performed in the absence of one of the primary antibodies were used as negative controls. (B) The co-localization of AR and REST was analyzed by the quantification of the number of fluorescent spots localized in the nucleus of individual cells (α, P < 0.0001).
In summary, data from ChIP and location analysis by confocal microscopy and proximity ligation assays demonstrate that AR and REST coexist in close proximity within PCa cells and suggest the existence of a functional crosstalk between these two transcription factors.
REST mediates AR repression of gene expression and modulates neuroendocrine differentiation
Previous studies have demonstrated that REST recruitment to chromatin does not always lead to repression of nearby genes as also shown in Figure 1B and D (36). Therefore, to study the interplay between REST on AR in PCa cells, we analyzed how androgen treatment regulates the mRNA levels of genes known to be repressed by REST: brain-derived neurotrophic factor (BDNF), synapsin 1 (Syn1); neurotrophic tyrosine kinase receptor type 3 (NTRK3) and glutamate receptor ionotropic N-methyl d-aspartate 2a (Grin2a) (18). As shown in Figure 4A, DHT treatment of LNCaP cells results in a significant reduction in mRNA levels for these genes. No transcriptional regulation of REST by DHT was detected (data not shown) but REST protein levels increased by the treatment (Figure 4F), suggesting that androgens could regulate REST protein turnover. Indeed, 35S-methionine pulse-chase experiments show that the degradation rate of REST in steroid-depleted cells is delayed by DHT treatment (Figure 4B). To further analyze how REST influences AR function, we tested how the siRNA-based knockdown of REST and AR affects the expression of Syn1, NTRK3, BDNF and Grin2A genes. Downregulation of REST and AR protein levels resulted in increased expression of REST-repressed genes (Figure 4C). However, the androgen induction of PSA was not significantly affected by the REST knockdown within the time frame of this analysis, suggesting that the functional cross talk between the AR and REST modulates only a subset of androgen-regulated genes. The analysis of the effects of the siRNAs on REST and AR expression not only confirmed the reduction in protein expression after siRNA transfection but also showed a reduction of REST protein levels when AR expression levels decreased (Figure 4C). No significant reduction on REST mRNA abundance was detected after the downregulation of AR expression, in line with the proposed existence of a posttranslational mechanism for the regulation of REST levels by AR.
Figure 4.

Androgens regulate REST function. (A) LNCaP cells were starved from steroids and then treated with DHT for 24 h. RT-PCR was used to measure expression levels of four known REST target genes: BDNF, Grin2a, NTRK3 and Synapsin1. All differences were statistically significant (*P < 0.01). (B) In a pulse chase experiment, LNCaP cells were labeled with 35S-methionine and treated for 2 and 4 h with androgen when REST was immunoprecipitated and analyzed by autoradiography. (C) LNCaP cells were transfected with two siRNA targeting either REST or the AR, followed by measurements of the mRNA levels of the indicated genes. Asterisks indicate statistically significant differences between the cells transfected with control siRNA and those targeting AR or REST (*P < 0.05, **P < 0.01). Western blot shows protein levels of REST and AR after REST and AR knockdown. (D) A luciferase reporter construct driven by the synapsin 1 gene promoter region containing the REST response element (RE-1) and a variant in which the N-terminal half region of the RE element was deleted was used to assess REST-mediated repression in the cells transfected with siRNAs targeting the REST and AR in the presence and absence of androgens. Significant differences in the comparison between luciferase activity in the cells transfected with siControl and Syn-Luc and the other experimental groups are denoted by *P < 0.05 or **P < 0.01. Significant differences between the control group–transfected Syn-luciferase mutant and the rest of the groups are marked with α, P < 0.01. (E) Measurement of REST and AR binding to chromatin regions within the promoters of BDNF, Syn1 and Grin2a genes containing an RE-1 or to the ARE in a PSA gene enhancer. The influence of DHT treatment on REST and AR chromatin binding was also measured. DNA quantization was performed by q-PCR. Means differences between IgG control ChIP and those performed with the indicated antibodies (AR or REST) were compared by Student’s t-test (*P < 0.01 and **P < 0.05). The statistical differences between DHT treated and untreated samples was also analyzed (α denotes a P < 0.05) (F) Measurement of REST, AR and β-TRCP levels in LNCaP cells with the indicated treatments.
We next analyzed REST activity using a RE-1 containing promoter upstream of a luciferase reporter gene. Our analysis confirmed the previous findings, showing enhanced luciferase activity in cells in which REST or AR expression levels were reduced by siRNA interference (Figure 4D). Mutation of the REST binding site in this reporter caused a marked increase in luciferase activity, and this reporter variant was no longer sensitive to AR or REST knockdown. We also analyzed the recruitment of REST to previously characterized RE-1 sites in the promoters of BDNF, Syn1 and Grin2a genes in a time course manner using ChIP (18). As shown in Figure 4E, REST associates with the promoters of these genes and this association significantly increases on DHT treatment in a sustained manner. In contrast, REST association with an ARE-containing enhancer of the KLK3 (PSA) gene in response to DHT treatment is transient and does not lead to significant gene repression (Figure 4A). Similarly, binding of AR to RE-1–containing sites or the a KLK3 enhancer region containing an ARE is in most cases transient although maximal binding is 20 times stronger in the case of KLK3. These findings suggest that the transcriptional consequences of REST recruitment to chromatin on androgen treatment may also depend of the strength and duration of the interaction and the sequence context.
The ubiquitin ligase β-TRCP is being shown to ubiquitinate REST, promoting its proteasomal degradation (37). Accordingly, siRNA-based β-TRCP knockdown in LNCaP cells results in increased levels of REST (Figure 4F). Consequently, it is possible that β-TRCP regulation by androgens in PCa cells explains its effects on REST protein levels. We observed that DHT treatment results in diminished β-TRCP and increased REST protein levels, whereas AR knockdown or treatment with the AR antagonist MDV3100 leads to increased levels of this ubiquitin ligase, parallel to a reduced expression of REST (Figure 4F). Together, these results demonstrate that the effects of androgen treatment on REST protein levels can in part be explained by regulation of β-TRCP content.
REST modulates neuroendocrine transdifferentiation
LNCaP cells undergo a process of neuroendocrine (NE) differentiation on long-term androgen withdrawal. Given the key role of REST in restricting the neuronal differentiation of stem cells (30) and the finding that some castration-resistant tumors express low REST levels (38), we studied how REST influences the NE differentiation of LNCaP cells (Figure 5). First, we studied the effects of androgen deprivation on REST protein levels. Short-term androgen withdrawal has little effect on REST levels, which remained stable for at least 24 h before a noticeable reduction was observed after 3 days. Interestingly, the reduced expression of REST coincides with increased expression of chromogranin A, a marker of NE differentiation and an androgen-repressed gene in LNCaP cells (Figure 5A) (39). Likewise, the mRNA expression levels of the previously characterized REST-regulated genes NTRK3 and Grin2a increased after long-term androgen deprivation, while no effects were observed on the REST mRNA levels (Figure 5B). As previously shown, the prolonged incubation of these cells with androgen-depleted media resulted in increased NE differentiation, which was characterized by the appearance of dendrite-like membrane extensions and the increased expression of the NE marker CgA (Figure 5A and B) (39). Measurement of the length of the membrane processes under androgen depletion conditions showed a significant increase in the average length of the dendrite-like extensions. Cells transfected with siRNA targeting REST showed increased NE differentiation in the presence of the androgens, as measured by cell morphology analysis (Figure 5C). Similar results were observed in the cells with reduced expression of the AR. Parallel to these morphological changes, we observed that the expression levels of the NE marker CgA also increased with the siRNA-based knockdown of both REST and the AR (Figure 5D). Likewise, treatment with the AR antagonist MDV3100 (Enzalutamide) also resulted in increased expression of CgA both at the mRNA and protein levels (Figure 5E). In addition to the experiments performed in vitro, we also analyzed REST and chromogranin A protein expression in LNCaP tumor xenografts grown orthotopically either in castrated mice or intact controls. We found that the REST protein levels were significantly reduced in tumors grown in the absence of testicular androgens while the expression of chromogranin A increases in the same group (Figure 5F). Together, these findings demonstrate that REST is a key mediator of NE differentiation caused by androgen depletion.
Figure 5.

REST regulates NE differentiation in LNCaP cells. (A) Protein levels of NE marker chromogranin A and REST in cells depleted of androgens for the indicated times in the presence and absence of DHT. (B) mRNA levels of the REST target genes: Grin2a and NTRK3 and NE marker chromogranin A in same experiment as above. (C) NE differentiation was quantified by analyzing the length of cytoplasmic extensions processes during androgen deprivation for 7 days or in cells grown in the presence of androgen (+DHT) but transfected with siRNAs targeting REST or the AR. Statistical analysis was performed using the Wilcox ranked test; asterisk denotes statistically significant differences (P < 0.001) with the siControl +DHT group, while α denotes significant differences (P < 0.001) in comparison with control nontransfected cells −DHT. (D) mRNA levels of CgA in REST and AR knockdowns (*P < 0.05, Student’s t-test). (E) Protein and mRNA levels of chromogranin A after 72- and 96-h treatment with AR antagonist MDV3100. (F) Chromogranin A and REST levels in LNCaP orhotopic xenograft grown in castrated or intact mice.
To further evaluate the relationship between REST expression and NE differentiation, we analyzed the expression of REST and CgA in a PCa TMA sections using immunofluorescence. Cells exhibiting strong expression of the NE marker CgA appeared sporadically and only in a minority of the tissue sections. CgA exhibited a predominantly cytosolic staining and was always negative for nuclear REST staining (Supplementary Figure S1). However, most cells exhibiting reduced REST nuclear staining did not express high levels of CgA, indicating that although REST may inhibit NE differentiation, additional factors also contribute to promote this process. Interestingly, we also detected cells with a strong cytosolic expression of REST that were positive for the NE marker CgA (Supplementary Figure S1).
Global analysis of REST regulated genes in PCa cells
Following the demonstration that REST influences the NE differentiation of PCa cells and can mediate androgen-stimulated gene repression, we performed a more comprehensive analysis of REST actions on PCa cells using genome-wide transcript profiling. We analyzed gene expression changes induced by three independent REST targeting siRNAs in comparison to a control siRNA. Of the 34 126 gene probes analyzed, 2079 exhibited statistically significant (FDR < 1%) changes in cells expressing REST targeting siRNAs. Of these probes, 667 correspond to protein-coding genes that increased expression by siREST and as such are candidates to be targets of the REST repressor complex. As expected, these set was enriched for genes that participate in cell signaling events, particularly synaptic transmission and neuropeptide receptor activity (Figure 6A), confirming the role of REST as a repressor of prostate neuronal trans differentiation. Interestingly several genes involved in the mitotic phase of the cell cycle were also derepressed by REST knockdown, in line with the proposed role of REST as a regulator of cell cycle (32,37). Supporting the direct role of REST in mediating the repression of some of these genes is the finding that regulatory regions of 78 of the genes induced by siREST in LNCaP cells have been shown to contain REST binding sites by ChIP sequencing analysis (40), an overlap that is highly significant (FDR < 0.001) by gene set enrichment analysis (41) (Supplementary Figure S2). We also identified a similar number of protein-coding genes that significantly reduced their expression on REST knockdown, indicating extensive gene expression remodeling that goes beyond simply gene derepression.
Figure 6.

Effects of REST knockdown on gene expression. (A) Gene expression profiling was used to identify protein coding genes that increase expression on REST downregulation. The regulated genes where assigned to biological functions according to Gene Ontology categories. The enrichment of specific categories in comparison with what is expected from similar analysis for the entire genome and the associated P were calculated. Results (P < 0.05) were visualized using Cytoscape. Nodes identify functional categories, with the size representing number of genes and color representing P-value. The thicknesses of the edges indicate the number of overlapping genes between categories. (B) Selected genes identified within specified categories. REST 1, 2 and 3 represent experiments performed with three independent REST targeting siRNAs. Log2-transformed fold ratios are indicated by the color code. (C) Expression changes of selected genes consistently upregulated by REST knockdown that are also repressed by treatment with synthetic androgen R1881 (10 nM). −DHT indicates changes induced by androgen depletion. (D) As above by showing selected genes consistently upregulated by REST knockdown that are also induced by treatment with synthetic androgen R1881 (10 nM).
Next, we also compared the changes induced by REST knockdown to those caused by androgen depletion or stimulation with the synthetic androgen R1881, treatments that either induce or repress NE differentiation of LNCaP cells (Figure 6C), respectively. Statistical analysis (FDR < 1%) identified 3010 genes that were regulated by either one of the treatments. As expected, a strong correlation (Pearson’s R = −0.81) was observed between genes regulated by androgen depletion or by treatment with R1881 (Supplementary Table S4 and Supplementary Figure S6). Of these genes, 739 were also regulated by REST knockdown (Supplementary Table S4). When analyzing the set of genes that are repressed by REST, we identified a subgroup of 107 genes showing a similar pattern to the neuron-enriched genes previously analyzed; they were either repressed by androgen treatment or induced by androgen withdrawal, confirming that REST participates in androgen-regulated gene repression. Interestingly, we also identified a larger set of 190 genes that are repressed by REST but stimulated by androgen treatment. This set of genes includes bona fide AR targets, including KLK2, KLK3, ORM2 and AZGP1, suggesting that REST may also function to limit the expression of a subset of androgen-regulated genes in PCa cells (Figure 6D).
REST immunoreactivity in PCa
Having shown that the AR can modulate REST protein levels, we next analyzed the expression of these two proteins in consecutive 4-μm TMA sections. As expected, the AR was detected in the nuclei of the luminal and stromal cells in both benign and cancer tissue specimens (Figure 7). In benign prostate glands, REST was also detected in the nuclei of luminal and stromal cells, but occasionally with cytoplasmic expression and with varying degrees of staining between the nucleus and the cytoplasm among specimens (Figure 7 and Supplementary Figure S3). Basal cells were mainly negative for nuclear AR and REST staining but occasionally exhibited weak cytoplasmic REST staining. In the tumor specimens, REST was mostly nuclear but was also cytoplasmic, with variable strength. The average REST immunoreactivity (IR) was 2.4 in the population (SD = 0.73), on a scale of 0–3, while the average IR of the AR was 2.36 (SD = 0.72). A Spearman Rank analysis was used to calculate the correlation between REST and AR protein expression. REST staining, regardless of the intracellular localization, was correlated with the AR expression (r = 0.76, P < 0.001), except when expressed strongly in the cytoplasm of scattered cells within the tumor. These cells were observed rarely and were negative for nuclear AR expression, apparently corresponding to a subpopulation of NE cells (Supplementary Figure S3). No significant correlation was detected between the REST score and the Gleason score (r = 0.07, P = 0.34) or the preoperative PSA levels (r = −0.14, P = 0.77), and no significant differences in REST expression were detected in the tumors with and without seminal vesicle invasion or positive or negative for surgical margins (Table 1). REST expression was significantly reduced in the tumors that relapsed within 3 years compared with tumors that did not relapse (1.8 versus 2.7, P = 0.0005), but these differences were not observed with the AR (2.11 versus 2.42, P = 0.1) (Table 2). We used multivariate Cox proportional-hazards regression analysis to examine the association of REST levels and another four covariates with biochemical (PSA) recurrence (Table 2). As expected, patients with higher Gleason scores are also at increased risk of early PSA recurrence in multivariate analysis [hazard ratio (HR): 1.5699; 95% confidence interval (CI): 1.01–2.42]. In addition, we observed that REST levels are independently associated to disease recurrence. The tumors with lower REST levels had a significantly increased risk of biochemical (PSA) recurrence (HR: 0.20; 95% CI: 0.10–0.41). To further analyze the relationship between Gleason score and REST levels, we performed a Kaplan–Meier analysis of disease recurrence comparing groups of patients with either high (>7) or low (≤7) Gleason scores that express low (IR = 1) of high levels (IR = 2 or 3) of REST. Statistical analysis by a log rank test (Mantel–Cox) demonstrated that low REST expression is significantly associated (P < 0.001) with faster disease recurrence for tumors with Gleason scores <7 confirming that REST is a Gleason-independent predictor of disease recurrence in prostatectomy-treated patients (Figure 7B). We also evaluated the performance of the REST IR score to predict the occurrence biochemical recurrences within 3 years past prostatectomy by analyzing the receiving operating curves (ROC) characteristics of this parameter. The area under the ROC curve was 0.80 (standard error = 0.07, 95% CI: 0.67–0.93, P < 0.001). Using a REST IR cutoff of ≤1 the biomarker performs with a specificity of 95.24% (95% CI: 86.71–99.01%) and a sensitivity of 47.62% (95% CI: 25.71–70.22%). Therefore, low REST nuclear abundance in prostatectomy specimens provides a strong indication for disease recurrence within 3 years after surgery.
Figure 7.

Immunohistochemical analysis of REST and AR expression in consecutive sections of PCa TMAs. (A) Examples of tissue cores of benign glands and tumors (Gleason grade 7 and 5) illustrate the correlation in expression of REST and AR. (B) Kaplan–Meier curves for the time to PSA recurrence after radical prostatectomies for patients expressing low (1, n = 13), medium (2, n = 22) or high (3, n = 49) REST protein levels (left panel) or according to the Gleason grade at the time of the prostatectomy: G < 7, n = 51; G = 7, n = 35; G > 7, n = 8 (right panel). The P-value was calculated according to the Mantel–Cox test. Table 1 presents a summary of REST immune reactivity in relation to clinical parameters.
Table 1.
REST immunohistochemistry score in relation to clinical parameters
| All samples |
Gleason score |
Seminal vesicle invasion |
Surgical margins |
Extra capsular extensions |
Location |
||||||||||
|---|---|---|---|---|---|---|---|---|---|---|---|---|---|---|---|
| Mean (SD) | Mean (SD) | P | Mean (SD) | P | Mean (SD) | P | Mean (SD) | P | Mean (SD) | P | |||||
| 2.41 (0.75) | 5–6 | 2.48 (0.7) | 0.5 | + | 2.27 (0.80) | 0.37 | + | 2.42 (0.75) | 0.9 | + | 2.44 (0.76) | 0.62 | Equal | 2.11 (0.9) | 0.07 |
| 7 | 2.35 (0.78) | − | 2.44 (0.72) | − | 2.40 (0.75) | − | 2.40 (0.71) | Nuclear | 2.58 (0.62) | ||||||
| 8–10 | 2.25 (0.71) | Cytoplasm | 2.2 (0.92) | ||||||||||||
TMAs containing 129 prostatectomy samples were analyzed by IHC and scored on a scale of 0–3, with the latter representing high levels of immune reactivity. The nonparametric Kruskal–Wallis test was used for statistical analysis.
Table 2.
Multivariate Cox proportional hazards analysis
| Descriptive statistics of indicated variables |
|||||||||||
|---|---|---|---|---|---|---|---|---|---|---|---|
| REST | AR | Gleason score | Seminal vesicle invasion | Surgical margins | |||||||
| Biochemical recurrence | + | − | + | − | + | − | + | − | + | − | |
| Mean | 1.714 | 2.667 | 2.095 | 2.517 | 7.048 | 6.3 | 0.3333 | 0.1 | 0.762 | 0.5167 | |
| SD | 0.7838 | 0.5724 | 0.7684 | 0.6507 | 1.396 | 0.8887 | 0.483 | 0.3025 | 0.436 | 0.5039 | |
| P-value | <0.0001 | 0.0185 | 0.0209 | 0.013 | 0.0522 | ||||||
| Overall model fitness | |||||||||||
| Chi square = 36.2724; df = 5; P < 0.00001 | |||||||||||
| Coefficients, standard errors, significance and CIs | ||||||
|---|---|---|---|---|---|---|
| Variables | Coefficient | Standard error | P | 95% CI | ||
| 1 | REST levels | −1.5857 | 0.3513 | P < 0.00001 | −2.2743 to −0.897 | |
| 2 | AR levels | 0.4003 | 0.3011 | 0.1838 | −0.19 to 0.9905 | |
| 3 | Gleason score | 0.451 | 0.2204 | 0.0407 | 0.019 to 0.883 | |
| 4 | Seminal vesicle invasion | 0.4389 | 0.5476 | 0.4228 | −0.6343 to 1.5121 | |
| 5 | Surgical margins | 0.8878 | 0.5392 | 0.0996 | −0.169 to 1.9446 | |
| Risk ratios and CIs | ||||
|---|---|---|---|---|
| Variables | Risk ratio | 95% CI | ||
| 1 | REST levels | 0.2048 | 0.1029 to 0.4078 | |
| 2 | AR levels | 1.4922 | 0.827 to 2.6926 | |
| 3 | Gleason score | 1.5699 | 1.0192 to 2.4182 | |
| 4 | Seminal vesicle invasion | 1.5511 | 0.5303 to 4.5364 | |
| 5 | Surgical margins | 2.4298 | 0.8445 to 6.9909 | |
In conclusion, our analysis demonstrates a strong positive correlation between REST and AR expression in localized prostate tumor tissue and suggests that REST may have tumor suppressor functions in localized prostate tumors.
DISCUSSION
In this study, we demonstrate that REST mediates some of the effects of androgens on the repression of gene expression and is recruited to promoters of androgen-regulated genes on hormone treatment. We also show that androgens regulate REST levels in PCa cells, which in turn influence NE differentiation. Low levels of REST expression in prostatectomy samples are strongly associated with early disease recurrence independently of Gleason score.
The current model of AR-mediated transcription proposes that AR binds to enhancers that contain several histone modifications characteristic of open chromatin regions, including mono- and dimethylated H3K4 and, most prominently, acetylated H3K9,14 (11,42–44). It has been shown that the recruitment of AR to these regions involves the cooperation of additional transcription factors, such as FoxA1 or GATA2 (11,43). AR binding to gene enhancers triggers the recruitment of co-activator complexes from the p160/SRC (45) and CBP/p300 (46,47) families, which in turn induces H3 acetylation and recruitment of RNA polymerase II, leading to enhanced transcription (48). Remarkably, both androgen-repressed as well as the androgen-induced genes share similar mechanisms for the recruitment of the AR, suggesting that additional gene locus–specific events, which possibly influence RNA polymerase II activity, are essential for determining whether the AR binding leads to transcriptional induction or repression (27,49).
A recent study identified H3K27 methylation through the EZH2 polycomb complex as one of the events mediating the AR repression (27). Our study identified REST as an AR-interacting protein that may inhibit gene expression in response to androgen stimulation. These effects of androgen appear to be exerted through the regulation of REST protein levels, a notion supported by the strong correlation between the AR and REST levels in PCa tissue. We demonstrated that long-term androgen ablation or siRNA-mediated AR knockdown results in the diminished expression of REST and the concomitant upregulation of REST-repressed genes. Interestingly, we also observed that AR itself can be recruited to RE-1 sites in enhancers of androgen-repressed genes such as BDNF and Syn1 in response to hormonal treatment and parallel to the recruitment of REST, suggesting that AR may contribute to the recruitment of REST to enhancers of androgen-repressed genes. Likewise, REST is also recruited to promoters of androgen-stimulated genes such as KLK3 (PSA). Gene expression profiling experiments detected a group of REST-repressed genes that were also induced by androgen treatment, suggesting that the REST–AR interplay may also be important to limit transcriptional stimulation by AR.
In our experimental model, we see little effect from a short-term (2 h) androgen treatment on the expression of most genes located nearby ARORs, irrespective of whether they contain RE-1 sites (Figure 1), signifying that the effects of androgen on REST-mediated repression seems to be context specific and may require long-term stable REST binding and chromatin remodeling of these gene loci. In this regard, the ability of androgens to inhibit REST turnover may be a key determinant of its function in PCa cells. REST is known to exert strong inhibitory actions on gene expression through the recruitment of corepressor platforms, CoREST and Sin3A, which in turn recruit HDAC1/2 histone deacetylase, G9a H3K9 methyl, MCep2 methyl DNA binding protein, the Polycomb complex and LSD1 (36) (31). This then leads to extensive chromatin remodeling characterized by decreased histone acetylation (H3K9, H4K12, H4K5, H3K4, H3k18, H3k36 and H3k27) and increased methylation of H3K9 and H3K27, which result in transcriptional repression (50). ChIP experiments have shown changes in H3K27me3 in the BDNF, Grin2A and NTRK3 enhancers in response to androgen treatment (49), which may in part explain the role of REST in androgen repression. Interestingly, some of the chromatin remodelers known to be associated with REST, such as LSD1, Sin3A and the mediator complex, are also known to interact with the AR (16,51,52). Therefore, these factors could hypothetically facilitate the interaction between these two proteins in vivo. Although additional studies will be needed to clarify the role of AR on the chromatin remodeling actions of REST both on androgen-stimulated and -repressed genes; the data collected in this study allow us to formulate a working model for the functional interplay between AR and REST (Figure 8).
Figure 8.
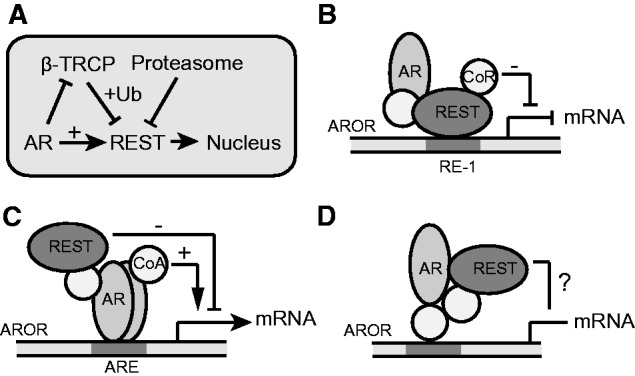
A working model for AR and REST functional interaction in PCa cells. (A) Androgens can reduce REST turnover by inhibiting the expression of β-TRCP, a known ubiquitin ligase of REST. In the presence of androgens, REST accumulates and translocates to the nucleus where it can bind chromatin in regions occupied by the AR (AROR). Depending on the sequence context, this binding leads to different transcriptional outcomes: (B) Sustained binding of REST to RE-1 sites in gene promoters leads to transcriptional inhibition. (C) Binding of REST to regions containing ARE can in some instances limit the stimulatory effects of androgens on transcription. (D) A number of regions can bind both AR and REST with no obvious effects on transcription of nearby genes. The outcome of these binding events may be determined by yet unidentified auxiliary proteins and chromatin modifiers.
To study the significance of REST modulation by androgens, we analyzed its influence on prostate NE differentiation. REST has well-characterized functions in the regulation of neuronal differentiation and the maintenance of neuronal function as confirmed by our transcriptomic analysis of cells expressing REST-targeting siRNAs (Figure 6A). NE cells are a rare population in the normal prostate gland. They are mostly AR-negative and have limited proliferative potential (53,54). Androgen ablation therapy in PCa results in an increased number of NE cells in the prostate, some of which are also AR-positive, which has led to the proposal that NE-differentiated tumor cells may arise via the trans-differentiation of AR-positive cancer cells (55). This process is mimicked in LNCaP cells, which during androgen deprivation undergo a process of NE differentiation characterized by the outgrowth of membrane extensions and the expression of genes such as chromogranin A. In this study, we demonstrated that long-term androgen deprivation as well as AR blockage with antagonist MDV3100 leads to the reduced expression of REST coinciding with increased levels of well-known NE markers. In addition, REST protein downregulation, either directly by siRNA knockdown or indirectly through AR inhibition, leads to increased NE differentiation, suggesting that one of the functions of REST is to limit NE differentiation in AR-positive luminal cells. The analysis of REST and CgA co-expression within human tumors by immunofluorescence shows that CgA-positive cells are negative for nuclear REST staining, reinforcing the observation that nuclear REST functions as a transcriptional repressor that inhibits NE differentiation. We found a subset of NE cells that were similar to a subpopulation of neuronal cells in brain tissue and that had strong cytosolic REST staining (33), confirming the notion that NE cells in the prostate constitute a heterogeneous population. The molecular nature of cytosolic REST and its possible functional role in NE differentiation or other biological processes remains to be elucidated.
In prostate luminal cells, AR promotes differentiation. A number of studies have demonstrated that tumor development is associated with a loss of differentiation, which is manifested in the down regulation of a significant portion of androgen-stimulated genes (56). Increased numbers of NE cells within the tumor have been linked to rapid progression of the disease. The role of REST as an inhibitor of NE differentiation and our analysis demonstrating inverse relation between REST expression and tumor progression suggest that REST may be part of the AR-controlled differentiation program that inhibits tumorigenesis in prostate tissues. Our analysis of PCa tissues show that most cells that are negative for nuclear REST staining are also negative for chromogranin A, suggesting that REST may have a growth inhibitory function independent of its function as regulator of neuronal genes. Remarkably, similar findings have been reported in breast cancer, where reduced levels of nuclear REST correlate with increased disease aggressiveness irrespective of their histological class or the expression levels of CHGA (57). In small cell lung cancer and colon cancer cell models, REST is expressed at low levels, and restoring REST expression leads to the inhibition of tumor growth through the downregulation of proto-oncogene TrkC and inhibition of AKT1 activity (31), the latter of which is known to participate in PCa development (58). Our analysis of siREST expressing cells also demonstrate increased expression of TrkC (NTRK3), AKT3 and it downstream effector AKTS1, in addition to several genes involved in mitosis (Figure 6B), suggesting a potential role of REST as an inhibitor of cell transformation, which is supported by our analysis of clinical samples (Figure 7). Noticeably the Aurora kinase A (AurKA) gene, which has been shown to be amplified in a large fraction of castration-resistant PCas with a NE phenotype was also induced on REST knockdown (59). Therefore, AurKA may mediate some of REST actions in castration-induced prostate NE-like tumors.
In contrast to our findings in clinical samples, we found that REST knockdown in LNCaP cells inhibits proliferation (data not shown), which in line with the limited proliferative activity of the normal NE cells in vivo. REST knockdown in LNCaP causes the induction of several proteins with tumor suppressor function such as the cyclin-dependent kinase inhibitor 1A (p21Cip1) or GTSE and the downregulation of several growth factor receptors (e.g. erbb3, PDGF), which may help to explain the reduced proliferation rate. Our attempts to analyze the REST function in other PCa cell lines such as PC3 and CWR22rv1, where AR expression is known to promote differentiation and inhibit tumorigenesis, have failed to provide conclusive evidence that REST in its own modulates cell proliferation in vitro. Therefore, the manifestation of REST tumor suppressor function may require additional genetic or signaling events that cannot be induced in LNCaP cells by REST knockdown alone. Future experiments will clarify whether the negative relationship between tumor progression and REST expression in prostate tumors can be directly attributed to REST tumor suppressor functions in PCa cells.
In conclusion, we have described a novel mechanism for androgen-mediated gene repression through the regulation of REST content in PCa cells. The demonstration that REST participates in the differentiation program of prostate epithelia and that REST expression is negatively correlated with disease recurrence warrants a deeper characterization of its role in prostate carcinogenesis, including its possible role as a prognostic biomarker.
ACCESSION NUMBERS
SUPPLEMENTARY DATA
Supplementary Data are available at NAR Online.
FUNDING
Novo Nordisk Foundation, Danish Research Council; Swedish Cancer Foundation [2009-3738 to A.F.-M.]; Terry Fox Research Institute, and the Terry Fox Foundation [#116129]; the Prostate Cancer Foundation and Movember (to C.C. and Y.Z.); Science Foundation of Tianjin [NO: 11JCZDJC19700, 09ZCZDSF04300] and the National Natural Science Foundation of China [2012CB518304, 2012DFG32220 to J.N. and N.Y.]. Funding for open access charge: Novo Nordisk Foundation.
Conflict of interest statement. None declared.
Supplementary Material
ACKNOWLEDGMENTS
The authors thank the members of the Core Facility of Integrated Microscopy (CFIM), Copenhagen University for help with confocal microscopy and Anne Haegert and Stephane Le Bihan at the Vancouver Prostate Center in Canada for the transcript profiling. They also thank Nico Dantuma at Karolinska Institute, Stockholm, Sweden, for providing us the pCMW-AR vector.
REFERENCES
- 1.Epstein JI, Amin M, Boccon-Gibod L, Egevad L, Humphrey PA, Mikuz G, Newling D, Nilsson S, Sakr W, Srigley JR, et al. Prognostic factors and reporting of prostate carcinoma in radical prostatectomy and pelvic lymphadenectomy specimens. Scand. J. Urol. Nephrol. 2005:34–63. doi: 10.1080/03008880510030932. [DOI] [PubMed] [Google Scholar]
- 2.Taichman RS, Loberg RD, Mehra R, Pienta KJ. The evolving biology and treatment of prostate cancer. J. Clin. Invest. 2007;117:2351–2361. doi: 10.1172/JCI31791. [DOI] [PMC free article] [PubMed] [Google Scholar]
- 3.Pienta KJ, Bradley D. Mechanisms underlying the development of androgen-independent prostate cancer. Clin. Cancer Res. 2006;12:1665–1671. doi: 10.1158/1078-0432.CCR-06-0067. [DOI] [PubMed] [Google Scholar]
- 4.Schaeffer EM, Marchionni L, Huang Z, Simons B, Blackman A, Yu W, Parmigiani G, Berman DM. Androgen-induced programs for prostate epithelial growth and invasion arise in embryogenesis and are reactivated in cancer. Oncogene. 2008;27:7180–7191. doi: 10.1038/onc.2008.327. [DOI] [PMC free article] [PubMed] [Google Scholar]
- 5.Heinlein CA, Chang C. Androgen receptor in prostate cancer. Endocr. Rev. 2004;25:276–308. doi: 10.1210/er.2002-0032. [DOI] [PubMed] [Google Scholar]
- 6.Wang X, Kruithof-de Julio M, Economides KD, Walker D, Yu H, Halili MV, Hu YP, Price SM, Abate-Shen C, Shen MM. A luminal epithelial stem cell that is a cell of origin for prostate cancer. Nature. 2009;461:495–500. doi: 10.1038/nature08361. [DOI] [PMC free article] [PubMed] [Google Scholar]
- 7.Taylor RA, Toivanen R, Risbridger GP. Stem cells in prostate cancer: treating the root of the problem. Endocr. Relat. Cancer. 2010;17:R273–R285. doi: 10.1677/ERC-10-0145. [DOI] [PubMed] [Google Scholar]
- 8.Vander Griend DJ, Karthaus WL, Dalrymple S, Meeker A, DeMarzo AM, Isaacs JT. The role of CD133 in normal human prostate stem cells and malignant cancer-initiating cells. Cancer Res. 2008;68:9703–9711. doi: 10.1158/0008-5472.CAN-08-3084. [DOI] [PMC free article] [PubMed] [Google Scholar]
- 9.Taplin ME, Rajeshkumar B, Halabi S, Werner CP, Woda BA, Picus J, Stadler W, Hayes DF, Kantoff PW, Vogelzang NJ, et al. Androgen receptor mutations in androgen-independent prostate cancer: Cancer and Leukemia Group B Study 9663. J. Clin. Oncol. 2003;21:2673–2678. doi: 10.1200/JCO.2003.11.102. [DOI] [PubMed] [Google Scholar]
- 10.Brinkmann AO, Blok LJ, de Ruiter PE, Doesburg P, Steketee K, Berrevoets CA, Trapman J. Mechanisms of androgen receptor activation and function. J. Steroid Biochem. Mol. Biol. 1999;69:307–313. doi: 10.1016/s0960-0760(99)00049-7. [DOI] [PubMed] [Google Scholar]
- 11.Wang Q, Li W, Liu XS, Carroll JS, Janne OA, Keeton EK, Chinnaiyan AM, Pienta KJ, Brown M. A hierarchical network of transcription factors governs androgen receptor-dependent prostate cancer growth. Mol. Cell. 2007;27:380–392. doi: 10.1016/j.molcel.2007.05.041. [DOI] [PMC free article] [PubMed] [Google Scholar]
- 12.Lupien M, Eeckhoute J, Meyer CA, Wang Q, Zhang Y, Li W, Carroll JS, Liu XS, Brown M. FoxA1 translates epigenetic signatures into enhancer-driven lineage-specific transcription. Cell. 2008;132:958–970. doi: 10.1016/j.cell.2008.01.018. [DOI] [PMC free article] [PubMed] [Google Scholar]
- 13.Massie CE, Adryan B, Barbosa-Morais NL, Lynch AG, Tran MG, Neal DE, Mills IG. New androgen receptor genomic targets show an interaction with the ETS1 transcription factor. EMBO Rep. 2007;8:871–878. doi: 10.1038/sj.embor.7401046. [DOI] [PMC free article] [PubMed] [Google Scholar]
- 14.Jia L, Berman BP, Jariwala U, Yan X, Cogan JP, Walters A, Chen T, Buchanan G, Frenkel B, Coetzee GA. Genomic androgen receptor-occupied regions with different functions, defined by histone acetylation, coregulators and transcriptional capacity. PLoS One. 2008;3:e3645. doi: 10.1371/journal.pone.0003645. [DOI] [PMC free article] [PubMed] [Google Scholar]
- 15.Takayama K, Kaneshiro K, Tsutsumi S, Horie-Inoue K, Ikeda K, Urano T, Ijichi N, Ouchi Y, Shirahige K, Aburatani H, et al. Identification of novel androgen response genes in prostate cancer cells by coupling chromatin immunoprecipitation and genomic microarray analysis. Oncogene. 2007;26:4453–4463. doi: 10.1038/sj.onc.1210229. [DOI] [PubMed] [Google Scholar]
- 16.Metzger E, Wissmann M, Yin N, Muller JM, Schneider R, Peters AH, Gunther T, Buettner R, Schule R. LSD1 demethylates repressive histone marks to promote androgen-receptor-dependent transcription. Nature. 2005;437:436–439. doi: 10.1038/nature04020. [DOI] [PubMed] [Google Scholar]
- 17.Ahlqvist K, Saamarthy K, Sayed Khaja AS, Bjartell A, Massouimi R. Expression of Id proteins is regulated by Bcl-3 proto-oncogene in prostate cancer. Oncogene. 2013;32:1601–1608. doi: 10.1038/onc.2012.175. [DOI] [PubMed] [Google Scholar]
- 18.Bruce AW, Donaldson IJ, Wood IC, Yerbury SA, Sadowski MI, Chapman M, Gottgens B, Buckley NJ. Genome-wide analysis of repressor element 1 silencing transcription factor/neuron-restrictive silencing factor (REST/NRSF) target genes. Proc. Natl Acad. Sci. USA. 2004;101:10458–10463. doi: 10.1073/pnas.0401827101. [DOI] [PMC free article] [PubMed] [Google Scholar]
- 19.Lenhard B, Wasserman WW. TFBS: computational framework for transcription factor binding site analysis. Bioinformatics (Oxford, England) 2002;18:1135–1136. doi: 10.1093/bioinformatics/18.8.1135. [DOI] [PubMed] [Google Scholar]
- 20.Vidal OM, Merino R, Rico-Bautista E, Fernandez-Perez L, Chia DJ, Woelfle J, Ono M, Lenhard B, Norstedt G, Rotwein P, et al. In vivo transcript profiling and phylogenetic analysis identifies suppressor of cytokine signaling 2 as a direct signal transducer and activator of transcription 5b target in liver. Mol. Endocrinol. 2007;21:293–311. doi: 10.1210/me.2006-0096. [DOI] [PubMed] [Google Scholar]
- 21.Sandelin A, Alkema W, Engstrom P, Wasserman WW, Lenhard B. JASPAR: an open-access database for eukaryotic transcription factor binding profiles. Nucleic Acids Res. 2004;32:D91–D94. doi: 10.1093/nar/gkh012. [DOI] [PMC free article] [PubMed] [Google Scholar]
- 22.Chuan YC, Iglesias-Gato D, Fernandez-Perez L, Cedazo-Minguez A, Pang ST, Norstedt G, Pousette A, Flores-Morales A. Ezrin mediates c-Myc actions in prostate cancer cell invasion. Oncogene. 2010;29:1531–1542. doi: 10.1038/onc.2009.442. [DOI] [PubMed] [Google Scholar]
- 23.Chuan YC, Pang ST, Cedazo-Minguez A, Norstedt G, Pousette A, Flores-Morales A. Androgen induction of prostate cancer cell invasion is mediated by ezrin. J. Biol. Chem. 2006;281:29938–29948. doi: 10.1074/jbc.M602237200. [DOI] [PubMed] [Google Scholar]
- 24.Ceder JA, Jansson L, Helczynski L, Abrahamsson PA. Delta-like 1 (Dlk-1), a novel marker of prostate basal and candidate epithelial stem cells, is downregulated by notch signalling in intermediate/transit amplifying cells of the human prostate. Eur. Urol. 2008;54:1344–1353. doi: 10.1016/j.eururo.2008.03.006. [DOI] [PubMed] [Google Scholar]
- 25.Tusher VG, Tibshirani R, Chu G. Significance analysis of microarrays applied to the ionizing radiation response. Proc. Natl Acad. Sci. USA. 2001;98:5116–5121. doi: 10.1073/pnas.091062498. [DOI] [PMC free article] [PubMed] [Google Scholar]
- 26.Saeed AI, Bhagabati NK, Braisted JC, Liang W, Sharov V, Howe EA, Li J, Thiagarajan M, White JA, Quackenbush J. TM4 microarray software suite. Methods Enzymol. 2006;411:134–193. doi: 10.1016/S0076-6879(06)11009-5. [DOI] [PubMed] [Google Scholar]
- 27.Zhao JC, Yu J, Runkle C, Wu L, Hu M, Wu D, Liu JS, Wang Q, Qin ZS. Cooperation between Polycomb and androgen receptor during oncogenic transformation. Genome Res. 2012;22:322–331. doi: 10.1101/gr.131508.111. [DOI] [PMC free article] [PubMed] [Google Scholar]
- 28.Mukhopadhyay NK, Cinar B, Mukhopadhyay L, Lutchman M, Ferdinand AS, Kim J, Chung LW, Adam RM, Ray SK, Leiter AB, et al. The zinc finger protein ras-responsive element binding protein-1 is a coregulator of the androgen receptor: implications for the role of the Ras pathway in enhancing androgenic signaling in prostate cancer. Mol. Endocrinol. 2007;21:2056–2070. doi: 10.1210/me.2006-0503. [DOI] [PubMed] [Google Scholar]
- 29.Mukhopadhyay NK, Ferdinand AS, Mukhopadhyay L, Cinar B, Lutchman M, Richie JP, Freeman MR, Liu BC. Unraveling androgen receptor interactomes by an array-based method: discovery of proto-oncoprotein c-Rel as a negative regulator of androgen receptor. Exp. Cell Res. 2006;312:3782–3795. doi: 10.1016/j.yexcr.2006.07.017. [DOI] [PubMed] [Google Scholar]
- 30.Ballas N, Mandel G. The many faces of REST oversee epigenetic programming of neuronal genes. Curr. Opin. Neurobiol. 2005;15:500–506. doi: 10.1016/j.conb.2005.08.015. [DOI] [PubMed] [Google Scholar]
- 31.Mulligan P, Westbrook TF, Ottinger M, Pavlova N, Chang B, Macia E, Shi YJ, Barretina J, Liu J, Howley PM, et al. CDYL bridges REST and histone methyltransferases for gene repression and suppression of cellular transformation. Mol. Cell. 2008;32:718–726. doi: 10.1016/j.molcel.2008.10.025. [DOI] [PMC free article] [PubMed] [Google Scholar]
- 32.Westbrook TF, Hu G, Ang XL, Mulligan P, Pavlova NN, Liang A, Leng Y, Maehr R, Shi Y, Harper JW, et al. SCFbeta-TRCP controls oncogenic transformation and neural differentiation through REST degradation. Nature. 2008;452:370–374. doi: 10.1038/nature06780. [DOI] [PMC free article] [PubMed] [Google Scholar]
- 33.Zuccato C, Tartari M, Crotti A, Goffredo D, Valenza M, Conti L, Cataudella T, Leavitt BR, Hayden MR, Timmusk T, et al. Huntingtin interacts with REST/NRSF to modulate the transcription of NRSE-controlled neuronal genes. Nat. Genet. 2003;35:76–83. doi: 10.1038/ng1219. [DOI] [PubMed] [Google Scholar]
- 34.Holter E, Kotaja N, Makela S, Strauss L, Kietz S, Janne OA, Gustafsson JA, Palvimo JJ, Treuter E. Inhibition of androgen receptor (AR) function by the reproductive orphan nuclear receptor DAX-1. Mol. Endocrinol. 2002;16:515–528. doi: 10.1210/mend.16.3.0804. [DOI] [PubMed] [Google Scholar]
- 35.Jarvius M, Paulsson J, Weibrecht I, Leuchowius KJ, Andersson AC, Wahlby C, Gullberg M, Botling J, Sjoblom T, Markova B, et al. In situ detection of phosphorylated platelet-derived growth factor receptor beta using a generalized proximity ligation method. Mol. Cell. Proteomics. 2007;6:1500–1509. doi: 10.1074/mcp.M700166-MCP200. [DOI] [PubMed] [Google Scholar]
- 36.Dietrich N, Lerdrup M, Landt E, Agrawal-Singh S, Bak M, Tommerup N, Krappsilber J, Södersten E, Hansen K. REST-mediated recruitment of polycomb repressor complexes in mammalian cells. PLoS Genet. 2012;8:e1002494. doi: 10.1371/journal.pgen.1002494. [DOI] [PMC free article] [PubMed] [Google Scholar]
- 37.Guardavaccaro D, Frescas D, Dorrello NV, Peschiaroli A, Multani AS, Cardozo T, Lasorella A, Iavarone A, Chang S, Hernando E, et al. Control of chromosome stability by the beta-TrCP-REST-Mad2 axis. Nature. 2008;452:365–369. doi: 10.1038/nature06641. [DOI] [PMC free article] [PubMed] [Google Scholar]
- 38.Lapuk AV, Wu C, Wyatt AW, McPherson A, McConeghy BJ, Brahmbhatt S, Mo F, Zoubeidi A, Anderson S, Bell RH, et al. From sequence to molecular pathology, and a mechanism driving the neuroendocrine phenotype in prostate cancer. J. Pathol. 2012;227:286–297. doi: 10.1002/path.4047. [DOI] [PMC free article] [PubMed] [Google Scholar]
- 39.Abrahamsson PA. Neuroendocrine cells in tumour growth of the prostate. Endocr. Relat. Cancer. 1999;6:503–519. doi: 10.1677/erc.0.0060503. [DOI] [PubMed] [Google Scholar]
- 40.Johnson DS, Mortazavi A, Myers RM, Wold B. Genome-wide mapping of in vivo protein-DNA interactions. Science. 2007;316:1497–1502. doi: 10.1126/science.1141319. [DOI] [PubMed] [Google Scholar]
- 41.Subramanian A, Tamayo P, Mootha VK, Mukherjee S, Ebert BL, Gillette MA, Paulovich A, Pomeroy SL, Golub TR, Lander ES, et al. Gene set enrichment analysis: a knowledge-based approach for interpreting genome-wide expression profiles. Proc. Natl Acad. Sci. USA. 2005;102:15545–15550. doi: 10.1073/pnas.0506580102. [DOI] [PMC free article] [PubMed] [Google Scholar]
- 42.Kim J, Coetzee GA. Prostate specific antigen gene regulation by androgen receptor. J. Cell. Biochem. 2004;93:233–241. doi: 10.1002/jcb.20228. [DOI] [PubMed] [Google Scholar]
- 43.Andreu-Vieyra C, Lai J, Berman BP, Frenkel B, Jia L, Jones PA, Coetzee GA. Dynamic nucleosome-depleted regions at androgen receptor enhancers in the absence of ligand in prostate cancer cells. Mol. Cell. Biol. 2011;31:4648–4662. doi: 10.1128/MCB.05934-11. [DOI] [PMC free article] [PubMed] [Google Scholar]
- 44.Wang Q, Li W, Zhang Y, Yuan X, Xu K, Yu J, Chen Z, Beroukhim R, Wang H, Lupien M, et al. Androgen receptor regulates a distinct transcription program in androgen-independent prostate cancer. Cell. 2009;138:245–256. doi: 10.1016/j.cell.2009.04.056. [DOI] [PMC free article] [PubMed] [Google Scholar]
- 45.Irvine RA, Ma H, Yu MC, Ross RK, Stallcup MR, Coetzee GA. Inhibition of p160-mediated coactivation with increasing androgen receptor polyglutamine length. Hum. Mol. Genet. 2000;9:267–274. doi: 10.1093/hmg/9.2.267. [DOI] [PubMed] [Google Scholar]
- 46.Aarnisalo P, Palvimo JJ, Janne OA. CREB-binding protein in androgen receptor-mediated signaling. Proc. Natl Acad. Sci. USA. 1998;95:2122–2127. doi: 10.1073/pnas.95.5.2122. [DOI] [PMC free article] [PubMed] [Google Scholar]
- 47.Fu M, Wang C, Reutens AT, Wang J, Angeletti RH, Siconolfi-Baez L, Ogryzko V, Avantaggiati ML, Pestell RG. p300 and p300/cAMP-response element-binding protein-associated factor acetylate the androgen receptor at sites governing hormone-dependent transactivation. J. Biol. Chem. 2000;275:20853–20860. doi: 10.1074/jbc.M000660200. [DOI] [PubMed] [Google Scholar]
- 48.Jia L, Shen HC, Wantroba M, Khalid O, Liang G, Wang Q, Gentzschein E, Pinski JK, Stanczyk FZ, Jones PA, et al. Locus-wide chromatin remodeling and enhanced androgen receptor-mediated transcription in recurrent prostate tumor cells. Mol. Cell. Biol. 2006;26:7331–7341. doi: 10.1128/MCB.00581-06. [DOI] [PMC free article] [PubMed] [Google Scholar]
- 49.Yu J, Mani RS, Cao Q, Brenner CJ, Cao X, Wang X, Wu L, Li J, Hu M, Gong Y, et al. An integrated network of androgen receptor, polycomb, and TMPRSS2-ERG gene fusions in prostate cancer progression. Cancer Cell. 2010;17:443–454. doi: 10.1016/j.ccr.2010.03.018. [DOI] [PMC free article] [PubMed] [Google Scholar]
- 50.Zheng D, Zhao K, Mehler MF. Profiling RE1/REST-mediated histone modifications in the human genome. Genome Biol. 2009;10:R9. doi: 10.1186/gb-2009-10-1-r9. [DOI] [PMC free article] [PubMed] [Google Scholar]
- 51.Buchanan G, Need EF, Barrett JM, Bianco-Miotto T, Thompson VC, Butler LM, Marshall VR, Tilley WD, Coetzee GA. Corepressor effect on androgen receptor activity varies with the length of the CAG encoded polyglutamine repeat and is dependent on receptor/corepressor ratio in prostate cancer cells. Mol. Cell. Endocrinol. 2011;342:20–31. doi: 10.1016/j.mce.2011.05.023. [DOI] [PMC free article] [PubMed] [Google Scholar]
- 52.Huang ZQ, Li J, Sachs LM, Cole PA, Wong J. A role for cofactor-cofactor and cofactor-histone interactions in targeting p300, SWI/SNF and Mediator for transcription. EMBO J. 2003;22:2146–2155. doi: 10.1093/emboj/cdg219. [DOI] [PMC free article] [PubMed] [Google Scholar]
- 53.Vashchenko N, Abrahamsson PA. Neuroendocrine differentiation in prostate cancer: implications for new treatment modalities. Eur. Urol. 2005;47:147–155. doi: 10.1016/j.eururo.2004.09.007. [DOI] [PubMed] [Google Scholar]
- 54.DaSilva JO, Amorino GP, Casarez EV, Pemberton B, Parsons SJ. Neuroendocrine-derived peptides promote prostate cancer cell survival through activation of IGF-1R signaling. Prostate. 2013;73:801–812. doi: 10.1002/pros.22624. [DOI] [PMC free article] [PubMed] [Google Scholar]
- 55.Sauer CG, Roemer A, Grobholz R. Genetic analysis of neuroendocrine tumor cells in prostatic carcinoma. Prostate. 2006;66:227–234. doi: 10.1002/pros.20338. [DOI] [PubMed] [Google Scholar]
- 56.Hendriksen PJ, Dits NF, Kokame K, Veldhoven A, van Weerden WM, Bangma CH, Trapman J, Jenster G. Evolution of the androgen receptor pathway during progression of prostate cancer. Cancer Res. 2006;66:5012–5020. doi: 10.1158/0008-5472.CAN-05-3082. [DOI] [PubMed] [Google Scholar]
- 57.Wagoner MP, Gunsalus KT, Schoenike B, Richardson AL, Friedl A, Roopra A. The transcription factor REST is lost in aggressive breast cancer. PLoS Genet. 2010;6:e1000979. doi: 10.1371/journal.pgen.1000979. [DOI] [PMC free article] [PubMed] [Google Scholar]
- 58.Malik SN, Brattain M, Ghosh PM, Troyer DA, Prihoda T, Bedolla R, Kreisberg JI. Immunohistochemical demonstration of phospho-Akt in high Gleason grade prostate cancer. Clin. Cancer Res. 2002;8:1168–1171. [PubMed] [Google Scholar]
- 59.Beltran H, Rickman DS, Park K, Chae SS, Sboner A, MacDonald TY, Wang Y, Sheikh KL, Terry S, Tagawa ST, et al. Molecular characterization of neuroendocrine prostate cancer and identification of new drug targets. Cancer Discov. 2011;1:487–495. doi: 10.1158/2159-8290.CD-11-0130. [DOI] [PMC free article] [PubMed] [Google Scholar]
Associated Data
This section collects any data citations, data availability statements, or supplementary materials included in this article.