


Abstract
The tumor suppressor protein p53 exhibits high affinity to the response elements regulating cell cycle arrest genes (CCA-sites), but relatively low affinity to the sites associated with apoptosis (Apo-sites). This in vivo tendency cannot be explained solely by the p53-DNA binding constants measured in vitro. Since p53 can bind nucleosomal DNA, we sought to understand if the two groups of p53 sites differ in their accessibility when embedded in nucleosomes. To this aim, we analyzed the sequence-dependent bending anisotropy of human genomic DNA containing p53 sites. For the 20 CCA-sites, we calculated rotational positioning patterns predicting that most of the sites are exposed on the nucleosomal surface. This is consistent with experimentally observed positioning of human nucleosomes. Remarkably, the sequence-dependent DNA anisotropy of both the p53 sites and flanking DNA work in concert producing strong positioning signals. By contrast, both the predicted and observed rotational settings of the 38 Apo-sites in nucleosomes suggest that many of these sites are buried inside, thus preventing immediate p53 recognition and delaying gene induction. The distinct chromatin organization of the CCA response elements appears to be one of the key factors facilitating p53-DNA binding and subsequent activation of genes associated with cell cycle arrest.
INTRODUCTION
The tumor suppressor protein p53 is a sequence-specific DNA-binding protein playing a pivotal role in preventing tumor development (1). In a normal unstressed cell, the p53 protein level remains low owing to its rapid turnover. In response to DNA damage and other types of cellular stresses, p53 is stabilized through phosphorylation of its N-terminal domain and quickly accumulates [reviewed in (2)]. The activated p53 selectively induces downstream target genes (3,4) and triggers protective mechanisms such as cell cycle arrest and apoptosis, depending on the type of damage and the cellular environment (5–7). Typically, if the damage is minor, the cell signals p53 to induce the genes associated with cell cycle arrest (CCA-genes, e.g. p21 or 14-3-3σ), allowing the damage to be repaired. If the damage is lethal or irreparable, the cell begins to self-destruct by inducing the apoptosis-associated genes (Apo-genes, e.g. PUMA, BAX, IGFBP3).
The biological functions of p53 critically depend on its DNA binding properties (8). Mutations in the p53 gene are found in ∼50% of human cancers and the vast majority of them occur in the sequence-specific DNA binding domain, p53DBD (9). p53 binds to DNA as a tetramer, recognizing two decanucleotides RRRCWWGYYY (R=A,G; Y=C,T; W=A,T) separated by a variable spacer (10) (Figure 1). In this regard, p53 is a typical eukaryotic transcription factor (TF). Although thousands of p53 binding sites have been mapped in vivo based on chromatin immunoprecipitation (11–13), only ∼150 response elements (REs) are proven to be functional (4). From the evolutionary point of view, it is remarkable that the human CCA-sites display high similarity with their counterparts in the mouse and rat genomes, while the Apo-sites as a group show little homology to the corresponding rodent sequences (14,15). Consistent with this observation, we found that 13 out of ∼150 human p53 REs (4) occur in primate-specific Alu repeats and 10 of them belong to the Apo-sites (16). At the same time, there are no functional CCA-sites embedded in Alu repeats. These data suggest that the Apo-sites and the network of p53-dependent regulation of apoptosis as a whole evolved later than the CCA-sites and the CCA network.
Figure 1.

Structural model of four p53DBD subunits bound to bent DNA. The two ‘anterior’ p53DBD subunits are shown as magenta ribbons; the two ‘posterior’ subunits are shown as green ribbons and gray surface. Initially, this model was based on molecular modeling (17) suggesting that the DNA bending is necessary to relieve the clashes between the p53 molecules bound to DNA; later, it was corroborated by gel electrophoresis (18) and electron microscopy (19). The overall DNA bending was found to be 30–35° for p53DBD and 50–55° for wild-type p53 (18,19). The sequence-specific p53–DNA interactions are the same as in the co-crystal structures (20–23). The lateral positioning of p53DBDs on the external side of the DNA loop and the degree of DNA bending imply that the p53 tetramer can bind to nucleosomal DNA (18). The 20-bp-long p53 site is shown in blue, with the center of the site indicated by a yellow ball. The red vertical arrows show the major-groove bending (M) in the CWWG tetramers; the blue arrow is for the minor-groove bend (m) in the center of the p53 site. Horizontal arrows represent orientations of the four p53 subunits. The major-groove bends (M) are observed in all available co-crystal p53DBD–DNA structures (20–23); the minor-groove bend (m) is observed in three co-crystals out of four; see Supplementary Table S3.
A long-held viewpoint is that the differential affinity of p53 for DNA is one of the key factors dictating the critical choice of survival versus death and, in general, the CCA-sites have relatively higher affinity to p53 compared with Apo-sites (3). This notion is consistent with several findings obtained from in vivo and in vitro experiments: (i) low-level p53 expression is associated with cell cycle arrest, whereas high-level p53 expression is associated with apoptosis (24); (ii) p53 can efficiently use CCA-sites but not Apo-sites for transcription in cell-based assays (25); (iii) some tumor-derived p53 mutants with low affinity to DNA retain the ability to induce cell cycle arrest but not apoptosis (26–29); and (iv) the kinetics of induction of apoptotic genes Fas and KILLER are markedly delayed compared with the cell cycle regulators p21 and GADD45 (30).
The binding affinities of a limited number of the CCA- and Apo-sites to p53 in solution have been measured by Veprintsev and Fersht (31). It was shown that the binding affinities measured as Kd values of five CCA-sites vary from 4.9 to 12 nM, while the Kd values of nine Apo-sites range from 7.1 to 260 nM, generally agreeing with the observations in vivo. However, it should be noted that there is no easy way to separate the two sets of p53 sites based on their affinity values: four out of the nine Apo-sites (PUMA, Noxa, p53AIP1 and PIDD) are nearly as strong as the CCA-sites—their binding affinities vary from 7.1 to 14.7 nM. This indicates that the affinities of p53 to its REs (i.e. the short range p53-DNA interactions) are not sufficient to account for the distinctive gene activation observed in vivo (see above).
Therefore, it is natural to assume that some additional factors, such as nucleosomal organization of genomic DNA, are operative in distinguishing between the two groups of p53 sites. Over the past decade, we evidenced explosion of the genome-wide studies of the nucleosome positioning [reviewed in (32)]. As a result, the high-resolution nucleosomal maps are available practically for all regions of yeast genome. As to the human genome, the situation here is less clear, with most of the published information describing the nucleosome occupancy rather than positioning (33,34). Only recently, the first map of the precisely localized 147-bp-long nucleosome fragments became available (35). The rotational positioning of human nucleosomes is consistent with the tendency observed in the pioneering study by Satchwell et al. (36) for the chicken nucleosomes and more recently, for yeast (37–39)—namely, the A/T-rich and G/C-rich fragments are most frequent at the sites where nucleosomal DNA bends into the minor and major grooves, respectively (36). It gives a good chance that using existing approaches for predicting rotational positioning of nucleosomes will give adequate results for the human genome as well.
Usually, it is believed that nucleosomes are refractory to protein–DNA binding (40). According to this paradigm, a nucleosome has to unravel (at least partially) to allow TF–DNA recognition. On the other hand, several lines of evidence suggest that TFs can bind to their cognate binding sites in the context of nucleosomal DNA (41,42). Some examples are the glucocorticoid receptor (43), the early developmental TF FoxA (HNF3) (44) and NF-κB (45). Therefore, in principle, the long-range chromatin organization may be critical for TF–DNA interactions in general, and for p53–DNA interaction in particular (46,47).
For instance, Espinosa and Emerson (46) compared the binding affinity of p53 to the p21 REs (5′ and 3′ sites) in free DNA and in chromatin, and found that p53 binds to the nucleosomal template with a higher affinity than to free DNA. Later, Lidor et al. (48) showed that p53 binds preferentially to genomic regions with high DNA-encoded nucleosome occupancy in vivo. Recently, Laptenko et al. (49) demonstrated that p53 binds to a nucleosome close to the ends (∼30 bp away from one end), while Sahu et al. (50) showed that p53 can bind near the nucleosome dyad. Thus, it is plausible that in nucleosomes certain p53 REs may be in a more favorable rotational frame that facilitates rapid p53-DNA recognition, while the other REs (with different rotational frames) may require additional steps, i.e. recruiting chromatin remodeling complexes, to expose them.
To test this hypothesis, we analyzed the most rigorous and comprehensive sets of CCA- and Apo-sites that are proven to be functional (4). The rotational setting of these sites in nucleosomes was examined by two computational approaches and both of them predicted that the CCA-sites are predominantly exposed on the nucleosomal surface, while many of the Apo-sites are buried inside nucleosomes, hampering p53 binding. These theoretical results are consistent with the available data on high-resolution nucleosome positioning in the human genome for the CCA-sites (35). Finally, we suggest a new scheme in which chromatin organization in the vicinity of p53 REs is one of the key factors (together with relative affinity, stability, cooperativity of binding and p53 modification status) controlling p53 binding to DNA. This scheme is in accord with in vivo observations, suggesting the increased p53 affinity to the CCA-sites compared with the Apo-sites.
MATERIALS AND METHODS
Selection of the functional p53 REs
The CCA- and Apo-sites were selected based on the functional annotations of ∼150 p53 REs collected by Riley et al. [see Supplementary Table S2 in (4)]. Specifically, the CCA-sites include the ones exclusively assigned to ‘C’ (cell cycle arrest), while the Apo-sites contain those exclusively assigned to ‘A’ (apoptosis). In addition, we included CASP10 RE in the Apo-group since it is known to induce apoptosis (51). As a result, we selected 20 CCA-sites and 38 Apo-sites (Supplementary Tables S1 and S2), which were extended at both ends by 250-bp flanking sequences extracted from the human genome (NCBI Build 36).
W/S and YR schemes for predicting rotational positioning of nucleosomes
The nucleosome rotational positioning (NRP) determines the DNA orientation with respect to the histone octamer. In general, this positioning is a result of interplay of many factors, two of which have been studied in most detail. The first is the sequence-dependent bending anisotropy of the DNA duplex (52–54). The second factor is the interaction of DNA with histones, especially with the arginines penetrating the DNA minor groove where it is facing the histone octamer (55–58).
Here, we used two methods for calculating the NRP score. The first method (denoted below W/S) takes into account the well-known preference of the A/T-rich and G/C-rich fragments to occur at the sites where nucleosomal DNA bends into the minor and major grooves, respectively (36–39). To calculate the W/S score, we first defined 14 minor-groove bending sites and 12 major-groove bending sites based on the Roll values of the 147-bp core DNA in the high-resolution nucleosome 1kx5 (59); each site is 4 bp long (Supplementary Figure S1). Then we counted occurrence of WW (W stands for A or T) and SS (S stands for G or C) dimers at the minor- and major-groove bending sites. If two or three WW dimers occur at a 4-bp long site, they are counted two or three times, respectively. This ‘additive’ approach is consistent with the idea that three or four consecutive AT pairs are more favorable (compared with a single WW dimer) for interaction with the histone arginines in the minor groove, and for DNA bending in this direction (56–58). The final W/S score is calculated as the sum of the number of WW dimers in the minor-groove sites and the number of SS dimers in the major-groove sites, minus the number of WW and SS dimers occurring in the major- and minor-groove sites, respectively (Supplementary Figure S1).
The second method (denoted YR), in addition to the A/T-rich and G/C-rich fragments, takes into account the flexible pyrimidine–purine dimers YR, as well as the tetramers YYRR and RYRY, which facilitate anisotropic bending of DNA in a nucleosome into the minor and major groove, respectively (58,60). [See Set 2 in Supplementary Table SIII of (60) for details]. When we used the YR scheme, the agreement between our predictions and the nucleosome positions precisely mapped in vitro was closer compared with the case when only the WW and SS patterns were used (60). In particular, 17 out of 20, or 85% of the in vitro positions were predicted with 1–2 bp accuracy (60).
For the sake of comparison, below we present results obtained with both methods. The advantage of the W/S scheme is that it is simple and easily reproducible. On the other hand, the more sophisticated YR scheme was adjusted for specific nucleosome positions established with high precision in vitro.
RESULTS AND DISCUSSION
Comparison of the CCA- and Apo-sites
Analyzing the genomic ‘environment’ as well as binding affinity of the CCA- and Apo-sites, we found that the two sets of p53 REs are practically indistinguishable in several aspects. First, the CCA- and Apo-sites are distributed similarly with regard to the transcription start sites (TSS) of corresponding genes, that is, 90% of the CCA-sites and ∼80% of the Apo-sites are found ±2 kb from TSS (Supplementary Figure S2A). Second, the GC content of the sequences flanking the CCA- and Apo-sites is comparable (Supplementary Figure S2B). Third, the predicted binding affinities of p53, PHMM scores (4), for both CCA- and Apo-sites are practically the same (Supplementary Figure S2C): 77.1 (±11.7) for CCA-sites and 76.7 (±8.8) for Apo-sites, which is consistent with the overlap of experimental binding affinities between the two sets of REs (31). Finally, both CCA- and Apo-sites have ∼50% of the sites with spacer S = 0 (Supplementary Figure S2D). This is important because the p53 sites with S = 0 are generally stronger in terms of the p53 binding affinity and p53-induced transactivation (4) compared with the sites with S ≠ 0. (Below, we mostly focus on the sites with S = 0.)
Overall, these observations suggest that conventional ‘literal’ analysis of the CCA- and Apo-sites is not sufficient to explain selective activation of the two groups of genes. Other higher-order factors such as 3D chromatin organization may be involved in the p53 site selection. Therefore, below we test the hypothesis that accessibility of the CCA- and Apo-sites embedded in nucleosomes may serve as an additional layer of regulation of the p53-induced gene activation.
Structural model for accessibility of p53 sites in the nucleosome
To identify the rule(s) discriminating between the accessible and inaccessible p53 sites, we modeled a 20-bp p53 site with two opposite rotational settings relative to the histone core. This idea follows from a recent study showing that the rotational setting of a p53 site on a nucleosome is critical for p53 binding (50). Figure 2A and B show the two states of a p53 site, accessible and inaccessible to p53, respectively. When the site center is shifted from the nucleosome dyad by 5 bp (Figure 2A), the directionality of bending of the 20-bp-long p53 site is similar to that in the p53–DNA complex (Figure 1): the major groove bends (M) at the half-site centers and the minor groove bend (m) between the two half-sites points toward the histone core (compare Figures 1 and 2A). This site is ‘exposed’ to the surface and accessible to p53. When the p53 site is shifted by another 5 bp (rotating by ∼180° = ∼36° × 5) as in Figure 2B, it becomes inaccessible.
Figure 2.

Accessibility of nucleosomal DNA for p53 binding depends on rotational setting of the p53 site embedded in the core particle. (A and B) Structural models for the p53 sites, which are accessible (A) and inaccessible (B) to p53. The DNA and histone octamer are taken from the high-resolution nucleosome structure (59). The p53 sites are shown in blue. (A) The center of the p53 site (yellow ball) is separated from the dyad position (black ball and diamond) by 5 bp. The directionality of bending of the 20-bp-long p53 site is similar to that shown in Figure 1, thereby exposing DNA for p53 binding (indicated by circled blue ‘+’ sign and solid blue arrow). The same is true for the other locations of the p53 site, shifted by ∼10 n from the one shown (dotted arrows). (B) The center of the p53 site is located 10 bp away from the dyad position, with its rotational setting in the core particle changed by ∼180° compared with that shown in (A). The tetrameric p53 cannot bind to this site due to steric repulsion between p53DBDs and the histone octamer (indicated by circled red ‘−’ sign and solid red arrow). The other locations of the p53 site with a similar rotational setting are also protected from p53 binding (dotted arrows). (C and D) Representative NRP score profiles for DNA fragments containing the p53 sites accessible (C) or inaccessible to p53 (D). The NRP score at position x evaluates the ease with which a 147-bp fragment with the center at x would wrap around the histone core. The score profiles of nucleosomal DNA oscillate with the periodicity p≈10 bp, with peaks indicating the optimal positions of nucleosome dyads. Arbitrary profiles are shown for illustration; see Supplementary Figures S4 and S5 for specific examples. (C) As follows from the structural model (A), the center of an accessible p53 site (yellow circle) is 5 bp away from the dyad position (diamond); therefore, it is characterized with a minimal score. (D) By contrast, the center of the site inaccessible to p53 (B) is characterized with a maximal score because it is shifted from the dyad position by 10 bp. In general, the distance between the p53 site and the dyad position is ∼10 n+5 bp for (C) and ∼10 n bp for (D).
Thus, a simple structural rule for the accessibility of a p53 site in a nucleosome can be derived from Figure 2A and B: the site is accessible if its center is out of phase with the dyad (∼10 n + 5 bp from the dyad; n = 0, 1, 2,…); the site is inaccessible if its center is in phase with the dyad (∼10 n bp from the dyad). Thus, the accessibility of a given p53 site embedded in a nucleosome can be predicted, given that the NRP score is known (Figure 2C and D).
To capture the NRP signal contained in a given DNA fragment, we used two computational schemes, W/S and YR (see ‘Materials and Methods’ section). As shown in Supplementary Figures S2 and S3, the experimentally observed dyad positions are characterized with maximal W/S and YR scores, indicating that the two schemes correctly predict the rotational settings of the nucleosome positions established in vivo (Supplementary Figure S2) and in vitro (Supplementary Figure S3).
Opposite rotational settings on the nucleosome predicted for CCA- and Apo-sites
For a detailed comparison, we selected two well-studied p53 sites, p21 5′ RE (61) from the CCA set and PUMA RE (62) from the Apo set (Figure 3). Although the NRP profiles exhibit periodic patterns for both sequences, they differ in several aspects. First, the p21 RE profiles have a wider variation range: for example, the W/S score varies from −20 to 16 (Figure 3A), while the corresponding PUMA profile varies from −14 to 5 (Figure 3B). The strong NRP signal calculated for the p21 RE is comparable with that for the nucleosome-positioning ‘601’ sequence, characterized by the highest affinity to the histone octamer in vitro (Supplementary Figure S3). On the other hand, the smaller NRP amplitude for the PUMA site approximately corresponds to the average NRP profile obtained for the other nucleosome sequences studied in vitro, which are characterized by a less pronounced stability (Supplementary Figure S3).
Figure 3.

The NRP score profiles for DNA sequences containing two p53 REs, p21 5′ RE (A and C) and PUMA RE (B and D). The W/S score (A and B) and YR score (C and D) are calculated as described in ‘Materials and Methods’ section. The centers of the REs (position 0) are denoted by filled circles. The peaks of the profiles corresponding to the favorable positions of nucleosome dyads are indicated by diamonds. The distances between the RE centers and the dyad positions are presented (in base pairs). The raw data are shown in thin lines and the three-point averages are in thick lines. The circled ‘+’ signs and ‘−’ signs indicate that the p21 5′ RE is accessible for p53 binding, while the PUMA RE is inaccessible to p53 (when p53 RE is embedded in nucleosome).
Another difference in the p21 and PUMA NRP profiles is that the peaks are in the opposite phasing with the p53 RE centers. In particular, for the p21 profile, the distances between the RE center and neighboring peaks are ∼10 n+5 bp (Figure 3A and C). Since the nucleosome dyad positions are associated with the NRP peaks (Figure 2), the center of the p21 RE is clearly out of phase with the predicted dyad positions (diamonds in Figure 3A and C). This suggests that the p21 5′ site is likely to be ‘exposed’ on the nucleosomal surface. By contrast, the distances between the center of the PUMA RE and neighboring peaks are ∼10 n bp (Figure 3B and D), indicating that the RE center is in phase with the dyad positions. That is, the PUMA RE is likely to be inaccessible when wrapped into a nucleosome.
We observed a similar tendency in the averaged profiles of all the CCA- and Apo-sites (Figure 4). That is, the CCA-sites are out of phase with predicted dyad positions (Figure 4A and C), while the Apo-sites are in phase with the dyad positions (Figure 4B and D). Thus, our data suggest that the CCA-sites are more likely to be in the rotational frames that promote exposure in nucleosomes, presenting themselves on the nucleosomal surface for direct p53 binding. By contrast, the Apo-sites tend to have the opposite orientation, in which p53 binding is strongly inhibited.
Figure 4.

Profiles of the W/S and YR scores for 20 CCA-sites (A and C) and 38 Apo-sites (B and D). The scores for the DNA sequences flanking p53 REs are averaged for each position and the resulting average scores are symmetrized with respect to the RE center (position 0). The notations are as in Figure 3. All CCA- and Apo-sites are selected for the analysis (both with spacer S = 0 and S > 0).
The accessibility of an individual p53 site in nucleosomal DNA can be represented by one of three states: ‘exposed’ (denoted as ‘+’), ‘buried’ (denoted as ‘−’) and unknown (denoted as ‘±’ in Supplementary Tables S1 and S2). The typical NRP profiles for the three states are shown for the CCA-sites (Figure 3A and C; Supplementary Figure S4) and for the Apo-sites (Figure 3B and D; Supplementary Figure S5). General statistics are presented in Supplementary Tables S1 and S2; for the 20 CCA-sites, the (+):(−):(±) ratio is 11:5:4, while for the 38 Apo-sites, the corresponding ratio is 7:24:7. The difference between the two sets is statistically significant with P < 0.01 by chi-square test (http://www.quantpsy.org/chisq/chisq.htm).
The same conclusion can be drawn from a more ‘rigorous’ analysis of the limited sets of 10 CCA-sites and 22 Apo-sites with spacer S = 0 (Supplementary Figure S6). The ‘structural’ rationale behind consideration of only these sites comes from stereochemistry. That is, the spacer length determines the relative orientation between the two p53 half-sites and between the two p53 dimers bound to DNA (Figure 1). The requirement of S = 0 means that the centers of the two half-sites are separated by 10 bp, and therefore the two p53 half-sites are ‘in phase’ on the DNA. Thus, theoretically, both half-sites would be equally accessible to p53 if the center of the p53 site is oriented properly with respect to the histone core. The (+):(−):(±) ratio is 7:3:0 for the 10 CCA-sites and 2:16:4 for the 22 Apo-sites (P < 0.002 by chi-square test). In other words, 70% of the CCA-sites are predicted to be ‘exposed’ and ∼70% of the Apo-sites are predicted to be ‘buried’ on nucleosome. In addition, the nucleosome-positioning signal (embedded in the DNA sequence) is somewhat stronger for the CCA-sites (see W/S and YR scores in Figure 3 and YR score in Figure 4 and Supplementary Figure S6). In summary, results for the limited sets of the p53 sites (with spacer S = 0) further emphasize our prediction that the CCA-sites tend to be ‘exposed’ on the nucleosomal surface, while the Apo-sites are more likely to be ‘buried’ in the nucleosomes.
Comparison with experimental nucleosome occupancy and positioning data
The genome-wide nucleosome map published by Gaffney et al. (35) was used to calculate the nucleosome occupancy profiles in the vicinity of the p53 REs. This is the largest data set published so far, containing ∼2.5 billion reads and providing ∼125× nucleosome coverage of the human genome. As follows from Figure 5, the CCA-sites occur in the genomic regions with high nucleosome occupancy. By contrast, the Apo-sites correspond to the local minimum in the occupancy profile. This result does not depend on the criteria used for selecting the sites for comparison—the same trend is observed for the p53 sites with spacer S = 0 characterized by a stronger p53 affinity (Figure 5A) and for all available sites with variable spacers (Figure 5B). Qualitatively similar results were obtained for the nucleosome occupancy data published by Valouev et al. (34) (Supplementary Figure S7). Thus, we see that the CCA- and Apo-sites reside in genomic regions with distinct nucleosome occupancy—a higher-than-average density of nucleosomes around the CCA-sites, and local nucleosome depletion around the Apo-sites. It does not mean that the Apo-sites are located in the nucleosome-free regions, however. The nucleosome occupancy over the Apo-sites is ∼115 or ∼125 (Figure 5A and B, respectively), which is close to the genome-wide average occupancy (see above).
Figure 5.
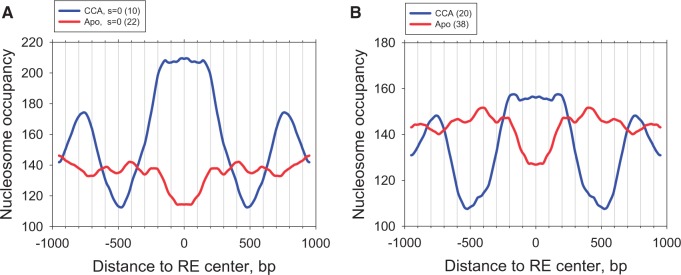
Nucleosome occupancy for genomic DNA flanking the CCA- (blue) and Apo-sites (red). (A) The data for the p53 sites with spacer S = 0. (B) The data for all sites (both with spacer S = 0 and S > 0). Nucleosome occupancy at each position is averaged and symmetrized across the center of the p53 site. Nucleosome occupancy data for seven human lymphoblastoid cell lines (35) were used for analysis (∼2.5 billion reads).
Overall, our data generally agree with the results by Lidor et al. (48) who showed that the ‘strongly bound’ p53 sites reside in the regions with higher intrinsic nucleosome occupancy, while the ‘weakly bound’ sites reside in the regions with lower intrinsic nucleosome occupancy. Since the Apo-sites on average have relatively low affinity to p53 (compared with the CCA-sites), they are expected to reside in the regions with lower nucleosome occupancy, which is consistent with our data in Figure 5.
Note that the nucleosome occupancy data (33–35) represent the DNA fragments ∼150 ± 30 bp in length. As such, these data do not allow direct evaluation of the rotational positioning of nucleosomes (and accessibility of the p53 REs embedded in these nucleosomes). Therefore, to analyze accessibility of the p53 sites in chromatin in vivo, we used the more limited set of well-positioned human nucleosomes, containing 134 million 147-bp fragments (35). This set only provides a modest 7 × nucleosome coverage of the genome. Nevertheless, this is the most comprehensive set of high-resolution human nucleosomes available so far; we used it to compare experimentally detected nucleosome positions with the ones predicted theoretically. We extracted the nucleosomes located close to the p53 REs and analyzed the distribution of distances between the RE centers and the nucleosome dyads (Figure 6). The distributions for the CCA- and Apo-sites are obviously different.
Figure 6.
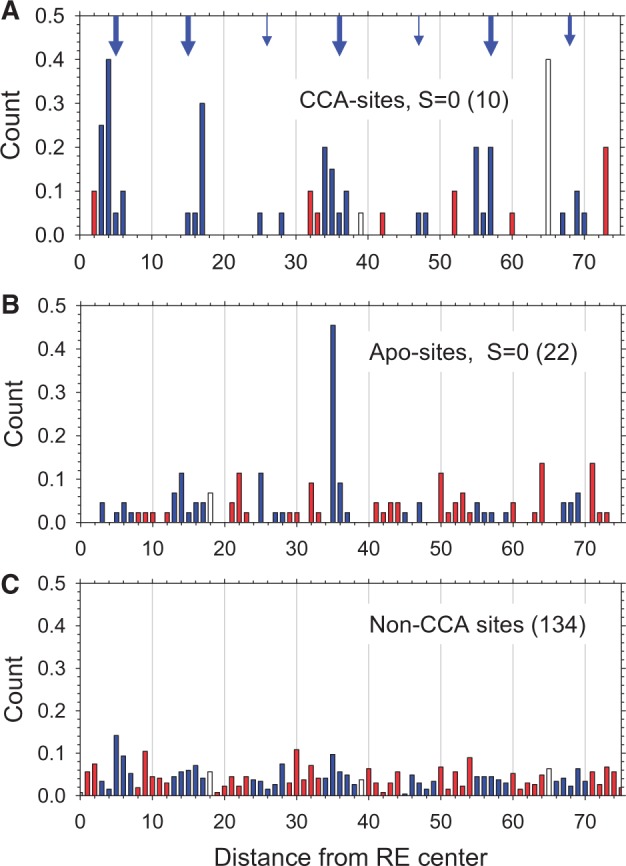
Distributions of the distances between nucleosome dyad positions and the centers of p53 REs for CCA-sites (A), Apo-sites (B) and 134 non-CCA sites (C). The 10 CCA-sites and 22 Apo-sites with spacer S = 0 are given in Supplementary Tables S1, S2. The 134 non-CCA sites were taken from Riley et al. (4). One hundred thirty-four million of the 147-bp-long human nucleosomal fragments published by Gaffney et al. (35) were used for this analysis. The data were averaged and symmetrized across the centers of the p53 sites. The ‘exposed’ positions are shown in blue, while the ‘buried’ positions are shown in red; the ‘intermediate’ positions 18, 39 and 65 are shown in white. The arrows indicate the ideally ‘exposed’ positions in nucleosome separated by multiples of 10.4 bp (59)—positions 5, 15, 26, 36, 47, 57 and 68 (Figure 2A). The sizes of the arrows reflect the ‘strengths’ of the peaks in the distribution.
In the case of the CCA-sites, the distance distribution is quazi-periodic, with the peaks corresponding to the ‘exposed’ positions in nucleosome—see arrows in Figure 6A. (The exception is the peak at position 65, which is located between the ‘exposed’ and ‘buried’ areas at the end of the nucleosomal DNA fragment.) Consider the p21 5′ RE as an example: there are five identical nucleosome positions with the dyad located 17 bp away from the center of this site. According to Sahu et al. (50) this location secures effective binding of the p53 tetramer to the p53 site embedded in the nucleosome.
By contrast, for the Apo-sites, the distances between the p53 RE centers and the nucleosome dyads are distributed almost randomly, with the average occurrence of nucleosomes being less than for the CCA-sites (0.037 for Apo-sites versus 0.048 for CCA-sites, Figure 6B). There is only one prominent peak at position 35 (Figure 6B), originating from the PERP site (63). In this case, the p53 RE is exposed in the nucleosome, which agrees with our prediction (Supplementary Table S2). In general, however, there is no predominant rotational setting of the Apo-sites in nucleosomes.
A more detailed analysis revealed that the ratio between the ‘exposed’ and ‘buried’ nucleosome positions around the CCA-sites is 3.9 (Figure 6A), meaning that the CCA-sites are approximately four times more likely to adopt an ‘exposed’ rather than a ‘buried’ configuration on a nucleosome. By contrast, this ratio for the other p53 sites is ∼1.2 or 1.0 (Figure 6B and C, respectively), indicating that there is no preferred rotational positioning for the non-CCA sites on a nucleosome, at least based on the limited set of observed nucleosome positions (35).
In summary, the experimental genome-wide nucleosome maps (34,35) demonstrate the following:
The CCA-sites are more likely to be embedded in nucleosomes than the Apo-sites. Note in this regard that the nucleosome-positioning signal is stronger for selected CCA-sites (see Figure 3 and above). (ii) In agreement with our predictions, the ‘exposed’ configuration of the CCA-sites in nucleosomes is predominant (∼70% for both observed and predicted nucleosome positions). (iii) The results for the Apo-sites (and other non-CCA sites) are ambiguous—both the ‘exposed’ and ‘buried’ configurations of the p53 REs in nucleosomes are nearly equally represented. In this case, the predicted probabilities of the two configurations of the p53 sites differ from the observed fractions, but the general tendency is predicted correctly: The fraction of the ‘exposed’ configurations is significantly higher for the CCA-sites than for the Apo-sites. Since the positioned nucleosomes are less numerous around the Apo-sites, more biochemical data is required to clarify if there is any statistically significant trend in the rotational setting of the Apo-sites in nucleosomes.
Structural interpretation
To interpret the differences between the CCA- and Apo-sites, first we focused on the CWWG motifs in the p53 half-sites (RRRCWWGYYY) where the DNA deformations in the complex with p53 are the strongest (Figure 1). In both cases, the CTAG motif is the least frequent (Figure 7A). A noticeable difference is found for the CATG and CAAG:CTTG tetramers: the former is more frequent in the CCA-sites, and the latter is predominant in the Apo-sites. This difference may be functionally significant. The YR dinucleotides, especially CA:TG, are known to be extremely flexible and exhibit remarkable structural variability (54,64). Since the CATG motif (in the CCA-sites) has two flexible YR steps (CA and TG), and CAAG:CTTG motif (in the Apo-sites) has only one YR step, the DNA in CCA-sites is more likely to be deformed than in the Apo-sites. In turn, the structural deformability conferred by the prevalence of YR steps in REs could affect binding affinity for p53, in particular, by facilitating the DNA bending into the major groove (Figure 1). A recent study (65) confirmed the earlier data (66), indicating that the REs containing a CATG motif exhibit higher binding affinity for p53 compared with those REs containing a CAAG:CTTG motif.
Figure 7.

Different sequence content at the centers of s p53 half-sites and full sites. (A) Dinucleotide content at the centers of s p53 half-sites. The frequencies of 10 dinucleotides are calculated for the two central positions in p53 half-sites RRRCWWGYYY (i.e. positions 5 and 6 denoted as WW). (B) The frequencies of 10 dinucleotides are calculated for the two central positions in full sites RRRCWWGYYY|RRRCWWGYYY (i.e. positions 10 and 11 denoted as Y|R). Only the p53 REs with spacer S = 0 are selected for the analysis: 10 CCA-sites (blue) and 22 Apo-sites (red); see Supplementary Tables S1 and S2 for the sequences.
A more striking difference between the two groups of p53 REs is observed at the center of the full sites (RRRCWWGYYY|RRRCWWGYYY). The CA:TG dinucleotide is frequently found in the center of CCA-sites (Figure 7B and Supplementary Table S1), while no CG is observed here. By contrast, the CG dinucleotide occurs more frequently than CA:TG in the center of Apo-sites (Figure 7B and Supplementary Table S2). If the four central positions (denoted YY|RR above) are considered, 100% of the CCA-sites contain at least one flexible CA:TG step, compared with only 50% of the Apo-sites (Supplementary Tables S1 and S2). Again, we see that the CA:TG dinucleotide is predominant in the center of the CCA-sites.
To interpret this observation, consider conformations of the central YR steps in the radiographic structures of the tetrameric p53DBD–DNA complex (20–23) (Supplementary Table S3 and Supplementary Figure S8A). In three cases out of four, these conformations resemble the Kink-and-Slide deformations of DNA in crystallized nucleosomes (59,67)—namely, they have strong positive Slide >2.5 Å, negative Roll and high Twist >40°. The structure reported by Kitayner et al. (20) presents an exception, with positive Roll = 3°, relatively low Twist = 34° and small Slide = 1.3 Å. This p53–DNA complex is unique, however, as its DNA contains six G:C pairs in the center of the p53 site, CCC|GGG (Supplementary Table S3), whereas all other co-crystals have both G:C and A:T pairs in the center, similar to a typical native p53 RE (Supplementary Tables S1 and S2). Interestingly, the CCC|GGG motif is observed in two Apo-sites (BAX and p53AIP1), but not in the CCA-sites (Supplementary Tables S1 and S2).
Note in this regard that the Kink-and-Slide deformations in crystallized nucleosomes (56) are observed mostly in the YY|RR tetramers with the CA:TG or TA dimeric steps in the center (59,67); see Supplementary Figure S8B. All-atom energy computations (58) confirmed this sequence dependence: the Kink-and-Slide deformation energy of DNA increases in the order TA < CA:TG < CG. Thus, the CCA-sites containing CA:TG in the center (rather than the Apo-sites) are predisposed for Kink-and-Slide deformations. These Kink-and-Slide deformations are critical for nucleosome positioning (56). Therefore, the CCA-sites can be wrapped into a nucleosome relatively easily, as the energy cost for the DNA deformations is decreased by the intrinsic deformability of the properly located CA:TG (or TA) steps. This is consistent with the high nucleosome occupancy observed around the CCA-sites (Figure 5).
A somewhat different perspective follows from the data provided by Schlereth et al. (29) on p53 mutants binding to different DNA sites in vivo. Tetrameric binding of wild-type (wt) p53 to DNA is stabilized by a strong electrostatic interaction between the H1 helices, more specifically between Glu180 and Arg181. This favorable interaction secures a high affinity of the wt p53 tetramer to a wide spectrum of DNA sequences (e.g. CCA- and Apo-sites). However, some cancer-derived p53 mutants (with substitutions in positions 180 and 181) have a less favorable H1–H1 interaction. Importantly, these ‘low cooperativity’ p53 mutants retain the ability to bind to CCA-sites but not to Apo-sites (29).
In terms of the free energy of tertiary p53–p53–DNA interactions, this observation can be interpreted as follows: To bind to Apo-sites in vivo, p53 has to overcome some energy barriers (probably caused by steric hindrances), which are missing in the case of CCA-sites. These barriers are easily overcome by the wt p53 tetramers (due to strong electrostatic interaction between the H1 helices) but not by the p53 mutants unable to form the Glu180–Arg181 salt bridges. We consider this as yet another indication that the CCA- and Apo-sites have different structural organization.
A new scheme for selective binding of p53 to the CCA-sites
We have compared accessibility of the CCA- and Apo-sites in a chromatin context, analyzing the nucleosomal rotational positioning signals in the vicinity of these sites, as well as the experimentally observed nucleosome positions in the human genome. Our results suggest that the DNA flanking sequences adjacent to these p53 REs encode distinct nucleosome positioning patterns, thereby affecting the accessibility of the REs to p53. In light of these findings, we suggest a hypothetical model for selective p53–DNA interactions in chromatin (Figure 8). This model is consistent with the data obtained in vitro (46) and in vivo (48) indicating that p53 has a high affinity for nucleosomal DNA.
Figure 8.
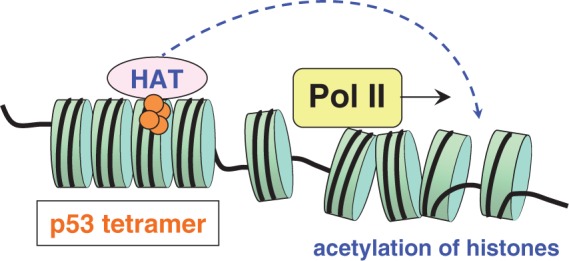
A scheme for the p53-induced activation of CCA-genes. Typically, the p53 RE associated with CCA-genes is embedded in the nucleosome in a rotational setting allowing its exposure and direct binding of p53 to nucleosomal DNA. On binding to DNA, the 53 tetramer recruits various co-activators such as histone acetyltransferase p300 (HAT), which are brought into the vicinity of RNA polymerase by virtue of an enhancer loop. As a result, the chromatin partially unravels in the transcribed area, thereby activating the process of transcription. Note that a typical distance between the CCA-site and promoter is several kilobases (Supplementary Figure S1).
The CCA-sites are mostly embedded in the ‘well-positioned’ nucleosomes, so that these sites are exposed in a bent conformation favorable for p53 binding (18,50). The possibility of a direct recognition of these p53 sites in nucleosomes is apparently consistent with the ‘fast’ kinetics of induction of p21 and other CCA genes (30). Following the p53-DNA binding, various cofactors such as histone acetyltransferase p300/CBP (68–70) are recruited to the tetrameric p53–DNA complex and subsequently delivered to the vicinity of promoters through formation of an enhancer-like loop (71) (Figure 8). Naturally, binding of p300/CBP close to the p53 REs would result in acetylation of histones and destabilization of nucleosomes in the vicinity of p53 REs. This effect can explain the observations made by Lidor et al. (48) on the local depletion of nucleosomes around the p53 sites on p53 activation.
By contrast, the Apo-sites (and other non-CCA sites) are often ‘buried’ inside nucleosomes, inhibiting direct p53–DNA interactions (Figures 2B, 4B and D, 6B and C). Additional events (such as nucleosome remodeling) are required to expose these sites; this may lead to a ‘relatively slow’ kinetics of induction of the apoptotic genes (30). Most likely, apoptotic cofactors also play an important role in making the ‘live or let die’ decision and in modulating p53 binding to the Apo-sites (7). For example, our data suggest that putative Sp1 binding sites frequently occur in the vicinity of these p53 REs (72). A detailed analysis of this question goes beyond the scope of our present investigation, however.
Our study adds a new ‘dimension’ to the existing paradigm—that is, the CCA-sites comprise a distinct class of the p53 REs that differs from most of the other p53 sites (including the Apo-sites) not only in the strength of p53 binding, but also in their spatial accessibility in chromatin. This finding provides a new 3D perspective to our understanding of the complicated cellular mechanisms of the selective activation of cell cycle arrest genes by p53.
SUPPLEMENTARY DATA
Supplementary Data are available at NAR Online, including [73,74].
ACKNOWLEDGEMENTS
We are grateful to D. Wang for help with computer graphics and to G. Leiman for text editing.
FUNDING
The Intramural Research Program of the National Institutes of Health (Center for Cancer Research, National Cancer Institute) and Grant Writers’ Boot Camp Seed Funding Program of the Rochester Institute of Technology. Funding for open access charge: NIH Intramural Program.
Conflict of interest statement. None declared.
REFERENCES
- 1.Levine AJ. p53, the cellular gatekeeper for growth and division. Cell. 1997;88:323–331. doi: 10.1016/s0092-8674(00)81871-1. [DOI] [PubMed] [Google Scholar]
- 2.Appella E, Anderson CW. Post-translational modifications and activation of p53 by genotoxic stresses. Eur. J. Biochem. 2001;268:2764–2772. doi: 10.1046/j.1432-1327.2001.02225.x. [DOI] [PubMed] [Google Scholar]
- 3.Vousden KH. p53: death star. Cell. 2000;103:691–694. doi: 10.1016/s0092-8674(00)00171-9. [DOI] [PubMed] [Google Scholar]
- 4.Riley T, Sontag E, Chen P, Levine A. Transcriptional control of human p53-regulated genes. Nat. Rev. Mol. Cell Biol. 2008;9:402–412. doi: 10.1038/nrm2395. [DOI] [PubMed] [Google Scholar]
- 5.Baker SJ, Markowitz S, Fearon ER, Willson JK, Vogelstein B. Suppression of human colorectal carcinoma cell growth by wild-type p53. Science. 1990;249:912–915. doi: 10.1126/science.2144057. [DOI] [PubMed] [Google Scholar]
- 6.Bates S, Vousden KH. Mechanisms of p53-mediated apoptosis. Cell. Mol. Life Sci. 1999;55:28–37. doi: 10.1007/s000180050267. [DOI] [PMC free article] [PubMed] [Google Scholar]
- 7.Vousden KH, Lu X. Live or let die: the cell's response to p53. Nat. Rev. Cancer. 2002;2:594–604. doi: 10.1038/nrc864. [DOI] [PubMed] [Google Scholar]
- 8.Kern SE, Kinzler KW, Bruskin A, Jarosz D, Friedman P, Prives C, Volgelstein B. Identification of p53 as a sequence-specific DNA-binding protein. Science. 1991;252:1708–1711. doi: 10.1126/science.2047879. [DOI] [PubMed] [Google Scholar]
- 9.Cho Y, Gorina S, Jeffrey PD, Pavletich NP. Crystal structure of a p53 tumor suppressor-DNA complex: understanding tumorigenic mutations. Science. 1994;265:346–355. doi: 10.1126/science.8023157. [DOI] [PubMed] [Google Scholar]
- 10.el-Deiry WS, Kern SE, Pietenpol JA, Kinzler KW, Vogelstein B. Definition of a consensus binding site for p53. Nat. Genet. 1992;1:45–49. doi: 10.1038/ng0492-45. [DOI] [PubMed] [Google Scholar]
- 11.Wei CL, Wu Q, Vega VB, Chiu KP, Ng P, Zhang T, Shahab A, Yong HC, Fu Y, Weng Z, et al. A global map of p53 transcription-factor binding sites in the human genome. Cell. 2006;124:207–219. doi: 10.1016/j.cell.2005.10.043. [DOI] [PubMed] [Google Scholar]
- 12.Smeenk L, van Heeringen SJ, Koeppel M, van Driel MA, Bartels SJ, Akkers RC, Denissov S, Stunnenberg HG, Lohrum M. Characterization of genome-wide p53-binding sites upon stress response. Nucleic Acids Res. 2008;36:3639–3654. doi: 10.1093/nar/gkn232. [DOI] [PMC free article] [PubMed] [Google Scholar]
- 13.Botcheva K, McCorkle SR, McCombie WR, Dunn JJ, Anderson CW. Distinct p53 genomic binding patterns in normal and cancer-derived human cells. Cell Cycle. 2011;10:4237–4249. doi: 10.4161/cc.10.24.18383. [DOI] [PMC free article] [PubMed] [Google Scholar]
- 14.Horvath MM, Wang X, Resnick MA, Bell DA. Divergent evolution of human p53 binding sites: cell cycle arrest versus apoptosis. PLoS Genet. 2007;3:e127. doi: 10.1371/journal.pgen.0030127. [DOI] [PMC free article] [PubMed] [Google Scholar]
- 15.Jegga AG, Inga A, Menendez D, Aronow BJ, Resnick MA. Functional evolution of the p53 regulatory network through its target response elements. Proc. Natl Acad. Sci. USA. 2008;105:944–949. doi: 10.1073/pnas.0704694105. [DOI] [PMC free article] [PubMed] [Google Scholar]
- 16.Cui F, Sirotin MV, Zhurkin VB. Impact of Alu repeats on the evolution of human p53 binding sites. Biol. Direct. 2011;6:2. doi: 10.1186/1745-6150-6-2. [DOI] [PMC free article] [PubMed] [Google Scholar]
- 17.Durell SR, Jernigan RL, Appella E, Nagaich AK, Harrington RE, Zhurkin VB. DNA bending induced by tetrameric binding of the p53 tumor suppressor protein: steric constraints on conformation. In: Sarma RH, Sarma MH, editors. Structure, Motion, Interaction and Expression of Biological Macromolecules. New York: Adenine Press; 1999. pp. 277–295. [Google Scholar]
- 18.Nagaich AK, Zhurkin VB, Durell SR, Jernigan RL, Appella E, Harrington RE. p53-induced DNA bending and twisting: p53 tetramer binds on the outer side of a DNA loop and increases DNA twisting. Proc. Natl Acad. Sci. USA. 1999;96:1875–1880. doi: 10.1073/pnas.96.5.1875. [DOI] [PMC free article] [PubMed] [Google Scholar]
- 19.Cherny DI, Striker G, Subramaniam V, Jett SD, Palecek E, Jovin TM. DNA bending due to specific p53 and p53 core domain-DNA interactions visualized by electron microscopy. J. Mol. Biol. 1999;294:1015–1026. doi: 10.1006/jmbi.1999.3299. [DOI] [PubMed] [Google Scholar]
- 20.Kitayner M, Rozenberg H, Rohs R, Suad O, Rabinovich D, Honig B, Shakked Z. Diversity in DNA recognition by p53 revealed by crystal structures with Hoogsteen base pairs. Nat. Struct. Mol. Biol. 2010;17:423–429. doi: 10.1038/nsmb.1800. [DOI] [PMC free article] [PubMed] [Google Scholar]
- 21.Chen Y, Dey R, Chen L. Crystal structure of the p53 core domain bound to a full consensus site as a self-assembled tetramer. Structure. 2010;18:246–256. doi: 10.1016/j.str.2009.11.011. [DOI] [PMC free article] [PubMed] [Google Scholar]
- 22.Malecka KA, Ho WC, Marmorstein R. Crystal structure of a p53 core tetramer bound to DNA. Oncogene. 2009;28:325–333. doi: 10.1038/onc.2008.400. [DOI] [PMC free article] [PubMed] [Google Scholar]
- 23.Emamzadah S, Tropia L, Halazonetis TD. Crystal structure of a multidomain human p53 tetramer bound to the natural CDKN1A (p21) p53 response element. Mol. Cancer Res. 2011;9:1493–1499. doi: 10.1158/1541-7786.MCR-11-0351. [DOI] [PubMed] [Google Scholar]
- 24.Chen X, Ko LJ, Jayaraman L, Prives C. p53 levels, functional domains, and DNA damage determine the extent of the apoptotic response of tumor cells. Genes Dev. 1996;10:2438–2451. doi: 10.1101/gad.10.19.2438. [DOI] [PubMed] [Google Scholar]
- 25.Qian H, Wang T, Naumovski L, Lopez CD, Brachmann RK. Groups of p53 target genes involved in specific p53 downstream effects cluster into different classes of DNA binding sites. Oncogene. 2002;21:7901–7911. doi: 10.1038/sj.onc.1205974. [DOI] [PubMed] [Google Scholar]
- 26.Ludwig RL, Bates S, Vousden KH. Differential activation of target cellular promoters by p53 mutants with impaired apoptotic function. Mol. Cell. Biol. 1996;16:4952–4960. doi: 10.1128/mcb.16.9.4952. [DOI] [PMC free article] [PubMed] [Google Scholar]
- 27.Rowan S, Ludwig RL, Haupt Y, Bates S, Lu X, Oren M, Vousden KH. Specific loss of apoptotic but not cell-cycle arrest function in a human tumor derived p53 mutant. EMBO J. 1996;15:827–838. [PMC free article] [PubMed] [Google Scholar]
- 28.Friedlander P, Haupt Y, Prives C, Oren M. A mutant p53 that discriminates between p53-responsive genes cannot induce apoptosis. Mol. Cell. Biol. 1996;16:4961–4971. doi: 10.1128/mcb.16.9.4961. [DOI] [PMC free article] [PubMed] [Google Scholar]
- 29.Schlereth K, Beinoraviciute-Kellner R, Zeitlinger MK, Bretz AC, Sauer M, Charles JP, Vogiatzi F, Leich E, Samans B, Eilers M, et al. DNA binding cooerativity of p53 modulates the decision between cell cycle arrest and apoptosis. Mol. Cell. 2010;38:356–368. doi: 10.1016/j.molcel.2010.02.037. [DOI] [PubMed] [Google Scholar]
- 30.Zhao R, Gish K, Murphy M, Yin Y, Notterman D, Hoffman WH, Tom E, Mack DH, Levine AJ. Analysis of p53-regulated gene expression patterns using oligonucleotide arrays. Genes Dev. 2000;14:981–993. [PMC free article] [PubMed] [Google Scholar]
- 31.Veprintsev DB, Fersht AR. Algorithm for prediction of tumour suppressor p53 affinity for binding sites in DNA. Nucleic Acids Res. 2008;36:1589–1598. doi: 10.1093/nar/gkm1040. [DOI] [PMC free article] [PubMed] [Google Scholar]
- 32.Struhl K, Segal E. Determinants of nucleosome positioning. Nat. Struct. Mol. Biol. 2013;20:267–273. doi: 10.1038/nsmb.2506. [DOI] [PMC free article] [PubMed] [Google Scholar]
- 33.Schone DE, Cui K, Cuddapah S, Roh TY, Barski A, Wang Z, Wei G, Zhao K. Dynamic regulation of nucleosome positioning in the human genome. Cell. 2008;132:887–898. doi: 10.1016/j.cell.2008.02.022. [DOI] [PMC free article] [PubMed] [Google Scholar]
- 34.Valouev A, Johnson SM, Boyd SD, Smith CL, Fire AZ, Sidow A. Determinants of nucleosome organization in primary human cells. Nature. 2011;474:516–520. doi: 10.1038/nature10002. [DOI] [PMC free article] [PubMed] [Google Scholar]
- 35.Gaffney DJ, McVicker G, Pai AA, Fondufe-Mittendorf YN, Lewellen N, Michelini K, Widom J, Gilad Y, Pritchard JK. Controls of nucleosome positioning in the human genome. PLoS Genet. 2012;8:e1003036. doi: 10.1371/journal.pgen.1003036. [DOI] [PMC free article] [PubMed] [Google Scholar]
- 36.Satchwell SC, Drew HR, Travers AA. Sequence periodicities in chicken nucleosome core DNA. J. Mol. Biol. 1986;191:659–675. doi: 10.1016/0022-2836(86)90452-3. [DOI] [PubMed] [Google Scholar]
- 37.Segal E, Fondufe-Mittendorf Y, Chen L, Thåstroöm A, Field Y, Moore IK, Wang JZ, Widom J. A genomic code for nucleosome positioning. Nature. 2006;442:772–778. doi: 10.1038/nature04979. [DOI] [PMC free article] [PubMed] [Google Scholar]
- 38.Albert I, Mavrich TN, Tomsho LP, Qi J, Zanton S, Schuster SC, Pugh BF. Translational and rotational settings of H2A.Z nucleosomes across the Saccharomyces cerevisiae genome. Nature. 2007;446:572–576. doi: 10.1038/nature05632. [DOI] [PubMed] [Google Scholar]
- 39.Cui F, Cole HA, Clark DJ, Zhurkin VB. Transcriptional activation of yeast genes disrupts intragenic nucleosome phasing. Nucleic Acids Res. 2012;40:10753–10764. doi: 10.1093/nar/gks870. [DOI] [PMC free article] [PubMed] [Google Scholar]
- 40.Segal E, Widom J. DNA sequence to transcriptional behavior: a quantitative approach. Nat. Rev. Genet. 2009;10:443–456. doi: 10.1038/nrg2591. [DOI] [PMC free article] [PubMed] [Google Scholar]
- 41.Kingston RE. A snapshot of a dynamic nuclear building block. Nat. Struct. Biol. 1997;4:763–766. doi: 10.1038/nsb1097-763. [DOI] [PubMed] [Google Scholar]
- 42.Ballaré C, Castellano G, Gaveglia L, Althammer S, González-Vallinas J, Eyras E, Le Dily F, Zaurin R, Soronellas D, Vicent GP, et al. Nucleosome-driven transcription factor binding and gene regulation. Mol. Cell. 2013;49:67–79. doi: 10.1016/j.molcel.2012.10.019. [DOI] [PubMed] [Google Scholar]
- 43.Perlmann T, Wrange O. Specific glucocorticoid receptor binding to DNA reconstituted in a nucleosome. EMBO J. 1988;7:3073–3079. doi: 10.1002/j.1460-2075.1988.tb03172.x. [DOI] [PMC free article] [PubMed] [Google Scholar]
- 44.Cirillo LA, Zaret KS. An early developmental transcription factor complex that is more stable on nucleosome core particles than on free DNA. Mol. Cell. 1999;4:961–969. doi: 10.1016/s1097-2765(00)80225-7. [DOI] [PubMed] [Google Scholar]
- 45.Angelov D, Lenouvel F, Hans F, Műller CW, Bouvet P, Bednar J, Moudrianakis EN, Cadet J, Dimitrov S. Histone octamer is invisible when NF-kappa B binds to the nucleosome. J. Biol. Chem. 2004;279:42374–42382. doi: 10.1074/jbc.M407235200. [DOI] [PubMed] [Google Scholar]
- 46.Espinosa JM, Emerson BM. Transcriptional regulation by p53 through intrinsic DNA/chromatin binding and site-directed cofactor recruitment. Mol. Cell. 2001;8:57–69. doi: 10.1016/s1097-2765(01)00283-0. [DOI] [PubMed] [Google Scholar]
- 47.Braastad CD, Han Z, Hendrickson EA. Constitutive DNase I hypersensitivity of p53-regulated promoters. J. Biol. Chem. 2003;278:8261–8268. doi: 10.1074/jbc.M204256200. [DOI] [PubMed] [Google Scholar]
- 48.Lidor NE, Field Y, Lubling Y, Widom J, Oren M, Segal E. p53 binds preferentially to genomic regions with high DNA-encoded nucleosome occupancy. Genome Res. 2010;20:1361–1368. doi: 10.1101/gr.103945.109. [DOI] [PMC free article] [PubMed] [Google Scholar]
- 49.Laptenko O, Beckerman R, Freulich E, Prives C. p53 binding to nucleosomes within the p21 promoter in vivo leads to nucleosome loss and transcriptional activation. Proc. Natl Acad. Sci. USA. 2011;108:10385–10390. doi: 10.1073/pnas.1105680108. [DOI] [PMC free article] [PubMed] [Google Scholar]
- 50.Sahu G, Wang D, Chen CB, Zhurkin VB, Harrington RE, Appella E, Hager GL, Nagaich AK. p53 binding to nucleosomal DNA depends on the rotational positioning of DNA response element. J. Biol. Chem. 2010;285:1321–1332. doi: 10.1074/jbc.M109.081182. [DOI] [PMC free article] [PubMed] [Google Scholar]
- 51.Kischkel FC, Lawrence DA, Tinel A, LeBlanc H, Virmani A. Death receptor recruitment of endogenous caspase-10 and apoptosis initiation in the absence of caspase-8. J. Biol. Chem. 2001;276:46639–46646. doi: 10.1074/jbc.M105102200. [DOI] [PubMed] [Google Scholar]
- 52.Zhurkin VB, Lysov YP, Ivanov VI. Anisotropic flexibility of DNA and the nucleosomal structure. Nucleic Acids Res. 1979;6:1081–1096. doi: 10.1093/nar/6.3.1081. [DOI] [PMC free article] [PubMed] [Google Scholar]
- 53.Trifonov EN. Sequence-dependent deformational anisotropy of chromatin DNA. Nucleic Acids Res. 1980;8:4041–4053. doi: 10.1093/nar/8.17.4041. [DOI] [PMC free article] [PubMed] [Google Scholar]
- 54.Olson WK, Gorin AA, Lu XJ, Hock LM, Zhurkin VB. DNA sequence-dependent deformability deduced from protein-DNA crystal complexes. Proc. Natl Acad. Sci. USA. 1998;95:11163–11168. doi: 10.1073/pnas.95.19.11163. [DOI] [PMC free article] [PubMed] [Google Scholar]
- 55.Garcia-Pérez M, Pinto M, Subirana JA. Nonsequence-specific arginine interactions in the nucleosome core particle. Biopolymers. 2003;69:432–439. doi: 10.1002/bip.10389. [DOI] [PubMed] [Google Scholar]
- 56.Tolstorukov MY, Colasanti AV, McCandlish DM, Olson WK, Zhurkin VB. A novel roll-and-slide mechanism of DNA folding in chromatin: implications for nucleosome positioning. J. Mol. Biol. 2007;371:725–738. doi: 10.1016/j.jmb.2007.05.048. [DOI] [PMC free article] [PubMed] [Google Scholar]
- 57.Rohs R, West SM, Sosinsky A, Liu P, Mann RS, Honig B. The role of DNA shape in protein-DNA recognition. Nature. 2009;461:1248–1253. doi: 10.1038/nature08473. [DOI] [PMC free article] [PubMed] [Google Scholar]
- 58.Wang D, Ulyanov NB, Zhurkin VB. Sequence-dependent Kink-and-Slide deformations of nucleosomal DNA facilitated by histone arginines bound in the minor groove. J. Biomol. Struct. Dyn. 2010;27:843–859. doi: 10.1080/07391102.2010.10508586. [DOI] [PMC free article] [PubMed] [Google Scholar]
- 59.Davey CA, Sargent DF, Luger K, Maeder AW, Richmond TJ. Solvent mediated interactions in the structure of the nucleosome core particle at 1.9 Å resolution. J. Mol. Biol. 2002;319:1097–1113. doi: 10.1016/S0022-2836(02)00386-8. [DOI] [PubMed] [Google Scholar]
- 60.Cui F, Zhurkin VB. Structure-based analysis of DNA sequence patterns guiding nucleosome positioning in vitro. J. Biomol. Struct. Dyn. 2010;27:821–841. doi: 10.1080/073911010010524947. [DOI] [PMC free article] [PubMed] [Google Scholar]
- 61.el-Deiry WS, Tokino T, Velculescu VE, Levy DB, Parsons R, Trent JM, Lin D, Mercer WE, Kinzler KW, Vogelstein B. WAF1, a potential mediator of p53 tumor suppression. Cell. 1993;75:817–825. doi: 10.1016/0092-8674(93)90500-p. [DOI] [PubMed] [Google Scholar]
- 62.Yu J, Zhang L, Hwang PM, Kinzler KW, Vogelstein B. PUMA induces the rapid apoptosis of colorectal cancer cells. Mol. Cell. 2001;7:673–682. doi: 10.1016/s1097-2765(01)00213-1. [DOI] [PubMed] [Google Scholar]
- 63.Reczek EE, Flores ER, Tsay AS, Attardi LD, Jacks T. Multiple response elements and differential p53 binding control PERP expression during apoptosis. Mol. Cancer Res. 2003;1:1048–1057. [PubMed] [Google Scholar]
- 64.Yanagi K, Prive GG, Dickerson RE. Analysis of local helix geometry in three B-DNA decamers and eight dodecamers. J. Mol. Biol. 1991;217:201–214. doi: 10.1016/0022-2836(91)90620-l. [DOI] [PubMed] [Google Scholar]
- 65.Beno I, Rosenthal K, Levitine M, Shaulov L, Haran TE. Sequence-dependent cooperative binding of p53 to DNA targets and its relationship to the structural properties of the DNA targets. Nucleic Acids Res. 2011;39:1919–1932. doi: 10.1093/nar/gkq1044. [DOI] [PMC free article] [PubMed] [Google Scholar]
- 66.Nagaich AK, Appella E, Harrington RE. DNA bending is essential for the site-specific recognition of DNA response elements by the DNA binding domain of the tumor suppressor protein p53. J. Biol. Chem. 1997;272:14842–14849. doi: 10.1074/jbc.272.23.14842. [DOI] [PubMed] [Google Scholar]
- 67.Tan S, Davey CA. Nucleosome structural studies. Curr. Opin. Struct. Biol. 2011;21:128–136. doi: 10.1016/j.sbi.2010.11.006. [DOI] [PMC free article] [PubMed] [Google Scholar]
- 68.Avantaggiati ML, Ogryzko V, Garnder K, Giordano A, Levine AS, Kelly K. Recruitment of p300/CBP in p53-dependent signal pathways. Cell. 1997;89:1175–1184. doi: 10.1016/s0092-8674(00)80304-9. [DOI] [PubMed] [Google Scholar]
- 69.Shikama N, Lee CW, France S, Delavaine L, Lyon J, Krstic-Demonacos M, La Thangue NB. A novel cofactor for p300 that regulates the p53 response. Mol. Cell. 1999;4:365–376. doi: 10.1016/s1097-2765(00)80338-x. [DOI] [PubMed] [Google Scholar]
- 70.Barlev NA, Liu L, Chehab NH, Mansfield K, Harris KG, Halazonetis TD, Berger SL. Acetylation of p53 activates transcription through recruitment of coactivators/histone acetyltransferases. Mol. Cell. 2001;8:1243–1254. doi: 10.1016/s1097-2765(01)00414-2. [DOI] [PubMed] [Google Scholar]
- 71.Dean A. In the loop: long range chromatin interactions and gene regulation. Brief. Funct. Genomics. 2011;10:3–10. doi: 10.1093/bfgp/elq033. [DOI] [PMC free article] [PubMed] [Google Scholar]
- 72.Cui F, Sirotin M, Zhurkin VB. Comparative sequence analysis of the p53 response elements associated with apoptosis and cell cycle arrest. In: Arabnia HR, Valafar H, editors. Biomolecular Pathways and System Biology. 2006. Proceedings of the 2006 International Conference on Bioinformatics & Computational Biology (BIOCOMP’06). NV CSREA Press, Las Vegas, pp. 48–55. [Google Scholar]
- 73.Gorin AA, Zhurkin VB, Olson WK. B-DNA twisting correlates with base-pair morphology. J. Mol. Biol. 1995;247:34–48. doi: 10.1006/jmbi.1994.0120. [DOI] [PubMed] [Google Scholar]
- 74.Lu XJ, Olson WK. 3DNA: a software package for the analysis, rebuilding and visualization of three-dimensional nucleic acid structures. Nucleic Acids Res. 2003;31:5108–5121. doi: 10.1093/nar/gkg680. [DOI] [PMC free article] [PubMed] [Google Scholar]
Associated Data
This section collects any data citations, data availability statements, or supplementary materials included in this article.