

Significance
During development, three-dimensional tissues with defined architecture are generated from one single cell. To achieve this, cells divide with specific orientations to ensure correct placement of their daughter cells. Because the direction of cell division is determined by the orientation of the mitotic spindle apparatus, precise methodology for determining spindle orientation in three-dimensional tissues is crucial to understanding developmental processes. Here, we describe a method for the analysis of spindle orientation in three dimensions. We use mathematical modeling to demonstrate that our method can avoid systematic errors that are intrinsic to conventional 2D analysis of the process. Using experimental data from the developing mouse brain, we show that our method can distinguish between mechanistically different models for spindle orientation.
Abstract
The orientation of the mitotic spindle determines the relative size and position of the daughter cells and influences the asymmetric inheritance of localized cell fate determinants. The onset of mammalian neurogenesis, for example, coincides with changes in spindle orientation. To address the functional implications of this and related phenomena, precise methods for determining the orientation of the mitotic spindle in complex tissues are needed. Here, we present methodology for the analysis of spindle orientation in 3D. Our method allows statistical analysis and modeling of spindle orientation and involves two parameters for horizontal and vertical bias that can unambiguously describe the distribution of spindle orientations in an experimental sample. We find that 3D analysis leads to systematically different results from 2D analysis and, surprisingly, truly random spindle orientations do not result in equal numbers of horizontal and vertical orientations. We show that our method can describe the distribution of spindle orientation angles under different biological conditions. As an example of biological application we demonstrate that the adapter protein Inscuteable (mInsc) can actively promote vertical spindle orientation in apical progenitors during mouse neurogenesis.
Controlling the orientation of mitotic spindles is an important aspect of tissue development and homeostasis. The position of the mitotic spindle is regulated by pulling forces acting between the spindle poles and cortical microtubule attachment sites (1, 2). The spindle position determines the cleavage plane and thereby influences the size and position of the newly forming daughter cells (3, 4). A defined spatial organization of newly generated cells is crucial for creating complex 3D structures such as tubes, ducts, and vessels (5, 6). Multicellular organisms therefore use spindle orientation for various purposes, for example to regulate planar expansion and tissue stratification in epithelia.
In stem cells, spindle orientation can regulate the ratio between proliferating and differentiating divisions (7). Because the maintenance of stem cell populations often depends on contact with a signaling niche, spindle orientation determines whether daughter cells maintain niche contact and stem cell fate or lose contact and differentiate. Alternatively, spindle orientation can ensure the reliable inheritance of localized cell-fate determinants by the correct daughter cells in stem cell populations that are regulated by cell-intrinsic signals. The early development of the mammalian neocortex, for example, starts with symmetric divisions of neural progenitor cells to expand the progenitor pool. At later stages, asymmetric divisions of the same progenitor cells generate both self-renewing daughter cells and also cells that give rise to transit-amplifying cells or neurons (8–13). The precise control of spindle orientation is vital for determining the different cell fate decisions during the course of cortical development (14–16).
Here, we describe a mathematical method for the analysis of spindle orientation that takes into account the 3D structure of the dividing cell and the variability of the reference plane and its effect on angle determination. We identify and quantify potential sources of error that can occur when mitotic figures are analyzed in 2D. Currently, terms such as “randomized spindle orientation” are not unambiguously defined, but this would be necessary to describe mutant phenotypes in a way that allows mechanistic interpretation. We therefore establish a mathematical definition of randomness for spindle orientation in 3D and use this to calculate the expected frequencies for various spindle orientation angles. We establish statistics allowing us to determine how far experimental data deviate from true randomness and introduce two parameters called λh and λv that describe the degree of horizontal and vertical spindle enrichment, respectively, in an experimental dataset. Finally, we apply our method to biological data from mice overexpressing the mouse Inscuteable (mInsc) gene and show that these data are consistent with a role of mInsc in promoting vertical spindle orientations during mouse corticogenesis but not with simply inhibiting horizontal orientation.
Results
Calculation of Spindle Orientation Angles in 3D.
To facilitate the measurement of spindle orientation in three dimensions, we developed an algorithm that allows the calculation of spindle angles from confocal image stacks (15). The angle of the mitotic spindle is typically determined relative to a reference surface, for example the ventricular surface in the mouse cortex. In reality, the reference surface is usually uneven and therefore an optimal reference plane needs to be calculated from the experimental data. We address this problem by defining five points (P1 ... Pn, n = 5) on the uneven reference surface in the 3D-image stack (Fig. 1), which are then used to determine the best-fitting plane by orthogonal distance regression (Supporting Information). The spindle axis is defined by the x,y,z-coordinates of the two centrosomes (C1 and C2) and spindle orientation α is calculated as the angle between the spindle axis and the best-fitting plane. An R script for spindle angle determination and variance estimation together with a file containing example measurement raw data are provided in Supporting Information (Dataset S1 and R Script S2).
Fig. 1.

Calculation of the spindle orientation angle. (A) Example of a 3D reconstructed mitotic cell. N-cadherin (red) and γ-tubulin (red) mark the cell border and the centrosomes, respectively. PH3 (green) marks mitotic DNA (DAPI, blue); the gray spheres are the reference points used for angle determination. (B) Diagram of a mitotic cell for calculating the spindle orientation angle α. C1 and C2 define the positions of the two centrosomes of the spindle apparatus (blue). The five points P1 ... P5 mark the reference surface and are used to determine an optimal reference plane. n is the normal vector of this best-fitting plane. The angle ϕ describes the orientation of the cleavage plane that is orthogonal to the spindle axis.
Systematic Errors in 2D Analysis of Spindle Orientation.
So far, spindle or cleavage plane orientations were mostly analyzed in two dimensions using thin tissue sections stained for centrosomes or DNA and cell cortex markers. Spindle orientation angles are reported as the angle between a line connecting the two centrosomes and another line approximating the basement membrane, luminal surface, or any other reference structure. Our mathematical analysis reveals that this 2D approach will only lead to correct numbers if the line connecting the two centrosomes is exactly parallel to the plane of tissue sectioning and the reference surface is orthogonal to the sectioning plane. Any horizontal or vertical rotation results in incorrect angle determination, that is, the apparent angle α′ is different from the true angle α of spindle orientation (Fig. 2A). The size of the error (ε = α′ – α) depends both on the spindle orientation angle (α) as well as on the out-of-plane rotation angles (ξ and ζ), and therefore oblique spindles are most strongly affected (Fig. 2, Materials and Methods gives details). Under laboratory conditions, the forward and backward tilting (ξ, Fig. 2B) is usually small because the sample can be oriented in such a way that the section plane is perpendicular to the reference plane (e.g., the ventricular surface in brain sections). The left and right tilting (ζ, Fig. 2C), however, cannot be reduced even by the most careful sample preparation and will lead to an overestimation of the spindle angle that contributes most to measurement errors.
Fig. 2.
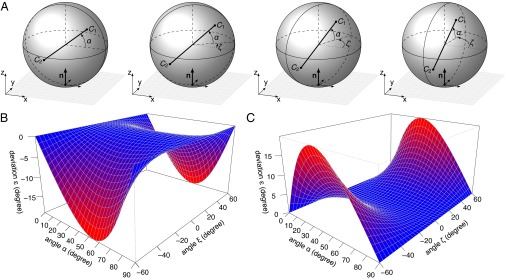
Deviations of apparent spindle orientations owing to out-of-plane rotation. (A) Increasing out-of-plane rotation (ζ) around the z axis leads to an increase of the apparent spindle orientation angle α′ if the structure is analyzed as a 2D projection (e.g., maximum intensity projection of a confocal stack). The true spindle orientation angle is α = 40° in all panels. The tissue sectioning plane is the xz-plane. (B) Deviation ε owing to rotation ξ around the x axis. (C) Deviation ε owing to rotation ζ around the z axis. The deviation ε is the difference between the apparent (α′) and the true (α) spindle orientation angle ε = α′ – α.
In addition to these measurement errors, 2D analysis is also influenced by a selection bias. In a coronal brain section, for example, spindle orientations can be correctly determined for all cells in which both centrosomes lie within the sectioning plane. As a result, all cells with vertical spindle orientation will be included in the analysis. Cells with a horizontal spindle orientation, however, will only be included when both centrosomes lie in parallel to the sectioning plane. All cells with spindles that are rotated out of this plane are disregarded, leading to a systematic error in the measurements.
Thus, the analysis of spindle orientation in 2D will systematically overestimate spindle orientation angles, especially for oblique orientations. In addition, the arbitrary and not strictly defined selection of cells whose spindles are more or less parallel to the sectioning plane further contributes systematic errors during spindle analysis in 2D.
Random Spindle Orientation in 3D.
The mitotic spindle is oriented by directional pulling forces that act more strongly on one of the two centrosomes because astral microtubules preferentially attach to discrete sites at the cell cortex (17, 18). Key components of the spindle orientation machinery were identified via their mutant phenotype. When these components are missing, the mitotic spindle is not actively oriented and assumes a random orientation instead. So far, however, there is no accurate definition for what constitutes a randomly oriented mitotic spindle. In addition, statistical tools that can determine whether experimental data represent random or nonrandom spindle orientation are missing.
We set out to develop a method for describing spindle orientation in mathematical terms. To provide an unambiguous description of random spindle orientation, we approximate the mitotic cell by a sphere and elongate the spindle axis so that it intersects with the surface of the sphere. This defines two points on the surface of the sphere that unambiguously define a specific orientation of the spindle axis. If and only if the density of these points is identical within every area element of the sphere, then the spindles are oriented randomly. Mathematically, this means that the probability of any spindle orientation angle is proportional to the sphere surface area at this angle (Fig. 3A). Using this definition, we can determine the distribution function describing random spindle orientation in three dimensions (Materials and Methods gives mathematical equations). Grouping spindle orientation angles into the three commonly reported categories (i.e., horizontal, oblique, and vertical) gives the expected percentages listed in Table 1 if spindle orientation occurs randomly.
Fig. 3.

Random spindle orientation for different shapes. (A) Surface areas containing horizontal (red, 0°–30°), oblique (blue, 30°–60°), and vertical (green, 60°–90°) spindle orientation angles. The probability of an angle in each category is proportional to the surface area. (B) Cumulative distributions of random spindle orientation angles assuming different shapes of the mitotic cell.
Table 1.
Probabilities for random spindle orientation angles in a 3D sphere
| Term | Horizontal |
Oblique |
Vertical |
|||
| Range ψ1–ψ2 | 0°–30° | 30°–60° | 60°–90° | |||
| Probability P, % | 50.0 | 36.6 | 13.4 | |||
| Range ψ1–ψ2 | 0°–15° | 15°–30° | 30°–45° | 45°–60° | 60°–75° | 75°–90° |
| Probability P, % | 25.9 | 24.1 | 20.7 | 15.9 | 10.0 | 3.4 |
Very surprisingly and somewhat counterintuitively, however, a truly random orientation of mitotic spindles does not result in equal numbers of horizontal, oblique, and vertical spindles. In fact, our calculations show that 50% of the random spindles are between 0° and 30° from the reference plane, but only around 13% of them are between 60° and 90° (Table 1). Clearly, these calculations disqualify the commonly used representation of spindle orientation where spindle angles are binned into specific intervals from 0° to 90° and randomness is thought to result in equal distribution among those bins. In fact, an equal frequency of horizontal, oblique, and vertical spindles means that a nonrandom, active mechanism is in place to achieve this. However, a predominance of horizontally oriented spindles (about 50%) can be explained by true stochasticity and no further active spindle orientation mechanism needs to be postulated. Our model is robust with respect to cell shape because qualitatively similar numbers are calculated assuming a cuboidal cell shape (Fig. 3 and Table S1). In fact, the 3D shape of the cell has less influence on the expected random distribution than analyzing a 2D projection of the cell (e.g., compare 3D sphere with 2D circle in Fig. 3B).
In one special case, however, 2D random spindle orientations can occur: When the spindle is aligned along one axis (by planar cell polarity, for example) and at the same time other localization mechanisms are abolished, then all possible spindle orientations are restricted to one particular 2D plane within the 3D cell. Under these special circumstances, a 2D random distribution would be observed (i.e., all angles occur with equal frequency) (Table S2).
Taken together, however, our calculations indicate that in all other cases mitotic spindle orientation needs to be analyzed in 3D because 2D analysis is error-prone and can lead to incorrect mechanistic conclusions.
Modeling of Spindle Orientation.
Experimentally obtained data for spindle orientation are typically displayed as percentages of spindles falling into specific intervals, such as 0° through 30°, 30° through 60°, and 60° through 90°. Because this approach reduces the information content and results in the misinterpretations listed above, we set out to develop a better way to describe and interpret such data. Our goal was to fit the data to a mathematical model that would allow their interpretation in a mechanistically meaningful way. For this, we started by modeling random spindle distribution in a 3D sphere. We then extended the model so that it can generate distributions with horizontal and vertical enrichment. The levels of horizontal and vertical enrichment are quantified by the parameters λh and λv, respectively (Fig. 4, Materials and Methods gives details). For any experimental distribution of spindle orientation angles, the parameters λh and λv are determined by minimizing the difference between the modeled distribution and the experimental data. Because we exclude effects of planar cell polarity, we can assume rotational symmetry around the z axis. The resulting enrichment parameters λh and λv allow us to unambiguously describe the distribution of experimental spindle orientation angles (Fig. 5 and Fig. S1). We propose to use these quantitative parameters for describing spindle distributions in addition to vague terms such as “randomization” or “horizontal enrichment.” In Supporting Information we provide an R script that can be used to calculate those values for any experimental dataset (R Script S3). In addition to those values, the script returns the Kolmogorov–Smirnov test statistics DKS describing the quality of the fit.
Fig. 4.

Modeling of horizontal (A) and vertical (B) enrichment. Cumulative distributions of spindle orientation angles modeled with different λ.
Fig. 5.
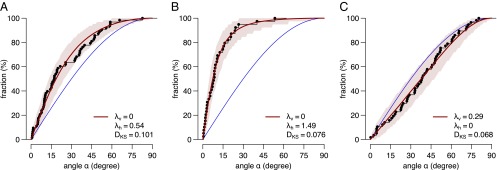
mInsc can promote an enrichment of vertical spindle orientations. Cumulative distributions of spindle orientation angles determined from mitotic radial glial cells at E13.5. (A) Wild-type cells exhibit horizontal enrichment of spindle orientations. (B) mInsc knock-out leads to an increased enrichment of horizontal angles compared with wild type. (C) Expression of a conditional knock-in mInsc causes vertical enrichment of spindle angles. The blue line indicates the random distribution; the 95% confidence interval is shaded in pink. Data were obtained from ref. 15.
Thus, our method can be used to fit any experimental data set to a model for spindle orientation and to describe this data set in a biologically meaningful manner.
Biological Applications.
Our method provides tools to describe experimental data for spindle orientation in an improved manner. To test whether it allows us to draw conclusions on potential mechanisms for spindle orientation, we tested it using a dataset obtained from Protein Phosphatase 4c (PP4c) (16) and mInsc (15) mutant mice.
During early mouse brain development, apical progenitors undergo proliferative divisions with predominantly horizontal spindle orientations. As neurogenesis ensues, however, these divisions become asymmetric and at the same time the relative fraction of oblique and vertical spindle orientations increases (10, 11, 13, 19).
Mitotic spindles are oriented by pulling forces acting on astral microtubules that connect the spindle poles to the cell cortex and attach to specific cortical sites (1, 2, 17). The genes PP4c and mInsc have been assigned distinct roles in this process. PP4c acts by controlling the interaction of astral microtubules with cortical attachment sites via the microtubule binding protein Ndel1 (16). Hence, interfering with PP4c function should lead to the uncoupling of the spindle from the cell cortex and thereby randomize spindle orientation. To test this hypothesis, we modeled the distribution of spindle angles from mitotic radial glial cells after PP4c knock-down. Indeed, PP4c knock-down led to spindle randomization, and coexpression of nonphosphorylatable Ndel1 restored horizontal spindle orientations (Fig. S1). Thus, the experimental data are consistent with the postulated mechanism by which PP4c is proposed to act.
mInsc, in contrast, is thought to act specifically by promoting nonplanar spindle orientation. An original model for mInsc proposed that it connects the nuclear mitotic apparatus protein (NuMA)-Leu-Gly-Asn repeat-enriched protein (LGN) complex to the apically localized Par-3/Par-6/aPKC complex (20). The NuMA-LGN complex is located around the cell equator and is instructive for orienting the mitotic spindle horizontally (21–23). More recent biochemical and structural analyses, however, have demonstrated that mInsc and NuMA are mutually exclusive interaction partners of LGN and that mInsc is able to displace NuMA from its LGN binding site (24, 25). This competitive interaction for LGN has led to an alternative model where mInsc exerts its effect on spindle orientation by titrating NuMA binding sites on LGN and prevents tethering of the spindle to the cell cortex leading to a randomization of spindle orientation (26, 27).
Previous qualitative descriptions of spindle orientation data cannot distinguish between randomization and vertical preference in experimental data. We therefore used our modeling approach to ask whether mInsc blocks the machinery for horizontal spindle orientation and shifts the distribution of spindle orientations to a more random-like distribution or whether mInsc actively promotes vertical spindle orientation during mouse corticogenesis. We modeled the distribution of spindle angles for apical progenitors from wild-type, mInsc knock-out, and mInsc overexpressing mice (15) and determined the enrichment parameters λh and λv. Fig. 5 A and B show the distributions of spindle angles of wild-type and mInsc knock-out apical progenitors at embryonic day 13.5. Both distributions exhibit an enrichment of horizontal spindle orientations and the enrichment is increased in the mInsc knock-out (λh = 1.49 versus λh = 0.54 in wild type). These observations are in agreement with a titration role of mInsc. More LGN binding sites are available for NuMA in the mInsc knock-out, leading to increased horizontal spindle localization. However, mild ectopic expression of mInsc causes a shift of the distribution beyond randomization toward vertical spindle orientations (Fig. 5C). A competitive model alone cannot explain this result, because complete titration of LGN binding sites should cause random spindle distributions. Thus, our data show that mInsc can actively lead to a reorientation of mitotic spindles toward more vertical orientations in apical progenitors (λv = 0.29) rather than simply randomizing spindle orientations.
Discussion
In this study, we present a unique approach to analyze spindle orientation in 3D. Spindle orientation is usually measured relative to a reference plane, but in real biological samples the surfaces that serve as reference are uneven and curved. Because the exact choice of the reference plane has a strong influence on angle measurement, we determine the accuracy of measurements by calculating the variance of both the reference plane and the angle. We demonstrate that 2D analysis of spindle orientation leads to systematic errors because out-of-plane rotations of the spindle axis relative to the sectioning plane result in incorrect assignments of spindle orientation angles. We show that 2D analysis can lead to incorrect mechanistic conclusions because random spindle distributions differ significantly when measured in 2D or 3D. Surprisingly, we demonstrate that random spindle orientation does not result in equal probabilities for any spindle orientation. In fact, only about 13% of the spindle angles are between 60° to 90°, whereas about 50% of all angles are in the range between 0° through 30° relative to the reference surface when mitotic spindles are randomly distributed in 3D. The deviations from the real probabilities are strongest for horizontal and vertical spindle orientations, leading to underestimation and overestimation, respectively (Table S2). Most importantly, these deviations can lead to wrong conclusions about whether spindle positions are randomized or actively oriented, which is a prerequisite for identifying active spindle localization processes.
Currently, data for spindle orientation are typically represented as the percentage of cells that fall within particular intervals. We describe an alternative way that uses two parameters to quantify horizontal and vertical enrichment, λh and λv. For a random spindle orientation, both of these values are zero. Positive values for each of them can be interpreted as forces acting to orient the mitotic spindle in parallel or perpendicularly to the reference plane.
We demonstrate the usefulness of our model by investigating the role of mInsc in spindle orientation during mouse neurogenesis. It has been proposed that lateral localization of LGN recruits NuMA to establish a preferentially horizontal orientation of the mitotic spindle. In this model, mInsc titrates the NuMA binding sites on LGN and thereby inhibits the machinery for horizontal spindle orientation to increase the frequency of oblique spindles (24, 25). Once all binding sites on LGN are occupied by mInsc, spindle orientation should be random. In support of this hypothesis, horizontal mitotic spindles are enriched during the early stages of neurogenesis when mInsc expression is low (28). More importantly, the enrichment of horizontally oriented mitotic spindles persists during the later neurogenic stages of neurogenesis in mInsc knock-out mice, whereas it is less pronounced in wild-type mice.
However, our analysis indicates that overexpression of mInsc leads to an enrichment of vertical spindle orientations and not only to a decrease of horizontal orientations. Whereas the horizontal enrichment parameter λh becomes zero, the vertical enrichment parameter λv significantly increases (i.e., the fraction of oblique and vertical spindle orientations is higher than what would be expected for a random distribution). Hence, mInsc not only blocks NuMA binding sites on LGN but, in addition, provides instructive cues for more vertical spindle orientation. Thus, our analysis method allows interpreting biological data in a mechanistically meaningful manner.
In apical progenitors, the instructive role of mInsc for vertical orientations might only come into play once all binding sites of LGN are saturated. It is possible that under physiological conditions mInsc does not reach this expression level during mouse neurogenesis, and the amount of asymmetric divisions achieved by lowering λh is sufficient for proper development. The situation might be different in other tissues: A bimodal distribution of spindle angles has been observed in the developing mouse skin (29), indicative of two separate, active mechanisms. mInsc might cause vertical spindle orientations while NuMA-LGN interactions are active as well.
Taken together, our mathematical modeling of different biological phenotypes allowed us to quantify horizontal (mInsc knock-out) and vertical (mInsc knock-in) enrichment and to distinguish active from random (PP4c knock-down) spindle orientation mechanisms.
In addition to helping the mechanistic interpretation of experimental data, our modeling approach allows the transfer of concepts from statistical mechanics and information theory to problems in spindle orientation analysis. For a given condition, the parameters λh and λv describe the “macrostate” of spindle orientation that corresponds to the set of all individual mitotic spindle orientations (“microstate”). This situation has an analogy in statistical thermodynamics where the temperature (macrostate) relates to the stochastic kinetics of microscopic particles (microstate) in a similar manner. The analogy can be taken further and even extended to differential entropy: In information theory the differential entropy h of a given probability density function is defined as
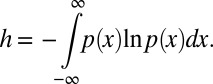 |
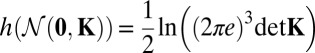
Applying h to the multivariate normal distribution  with zero means 0 and the (diagonal) covariance matrix K, we get as shown in refs. 30 and 31
 |
and we can express h as a function of λh and λv (for simplicity, we ignore the fact that the normal distributions are “wrapped” around a unit sphere)
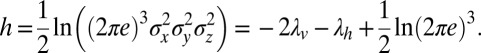 |
Therefore, the entropy difference Δh of any distribution compared with the random distribution (λh = λv = 0) is
This equation quantifies the decrease of entropy that is caused by active spindle orientation and, hence, the gain of order in the system. It is tempting to speculate that this increase of order inside the cell physically manifests itself in the developing biological structures arising from oriented cell divisions. In a broader context, our model allows us to mathematically quantify the emergence of positional order in the developing mammalian brain.
Materials and Methods
Calculation of the Spindle Orientation Angle.
The angle ϕ between the vector c connecting the centrosomes (C1, C2) and the normal vector n of the best-fitting plane (Supporting Information) is calculated using the scalar product
The angle ϕ describes the orientation of the cleavage plane, which is orthogonal to the spindle axis. The angle α of spindle orientation is calculated as α = 90° – ϕ.
To estimate the variability of the best-fitting plane, we repeat the analysis taking all possible combinations of only four out of the five points within the reference surface (i.e., we calculate n normal vectors n1…nn of best-fitting planes using all n combinations of points). We follow the definitions used in ref. 32 and determine the circular variance V of n1…nn
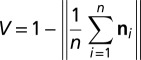 |
and the angular SD  (for small V).
To estimate the potential effect of the unevenness of the reference surface on spindle angle determination, we take each of the n normal vectors n1…nn and calculate ϕ1…ϕn according to Eq. 1. We transform the angles ϕi to unit vectors in a 2D plane by
and use ri to determine the circular variance V and the angular SD s of the spindle angles.
Systematic Errors in 2D Analyses Owing to Out-of-Plane Rotation.
We define the deviation ε between the apparent angle α′ and the true angle α of spindle orientation as ε = α′ – α. Under ideal conditions, the vector c connecting the two centrosomes is exactly parallel to the tissue sectioning plane (i.e., cy = 0), and the angle α of spindle orientation is given by
If the vector connecting the two centrosomes is not exactly parallel but rotated around the x axis by ξ degrees out of the sectioning plane (cy = 0), the resulting vector c′ is given by
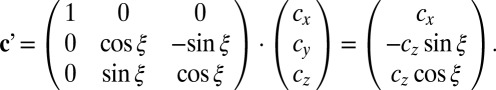 |
Hence, the apparent angle of spindle orientation α′ using 2D analysis is
leading to a systematic underestimation of the angle (α′≤ α, Fig. 2B).
If the vector connecting the two centrosomes is rotated around the z axis by ζ degrees out of the sectioning plane (cy = 0), the resulting vector c′ is given by
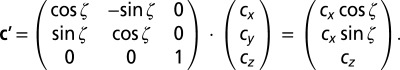 |
Hence, the apparent angle of spindle orientation α′ using 2D analysis is
leading to a systematic overestimation of the angle (α′ ≥ α, Fig. 2C).
Determination of the Random Distribution of Spindle Orientations in 3D.
The probability of any spindle orientation angle is proportional to the sphere surface area at this angle. The circumference C of a sphere (with a radius of 1) at an angle α from its equator is  . Hence, the surface area Aψ between the angles –ψ and ψ (with 0° ≤ ψ ≤ 90°) is
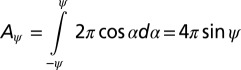 |
and the fraction fψ of the area within –ψ and ψ (Aψ) to the total surface area of the sphere (A90° = 4π) is
If spindles are statistically distributed, the probability P (or fraction) of spindle orientation angles falling into the range between ψ1 and ψ2 (0° ≤ ψ1 < ψ2 ≤ 90°) is  .
.
Modeling of Spindle Orientation Distribution as Deviation from Random Distribution.
Let  define a multivariate normal distribution with zero means 0 and unity covariance matrix K
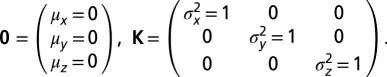 |
Let the vector z ∼  have three independent, (μ = 0, σ2 = 1)-normally distributed components zx, zy, zz. By normalizing z we get a vector c = z/||z|| with the components cx, cy, cz that is randomly distributed on a unit sphere (33) and that represents a randomly oriented spindle axis.
By decreasing the SD σz of the (0, σz2)-normally distributed component of z we obtain models of horizontal enrichment. We introduce the parameter λh = –ln σz to quantify the extent of horizontal enrichment (λh > 0) relative to the random distribution (λh = 0, Fig. 4A).
Models of vertical enrichment can analogously be obtained by decreasing the SDs σx and σy. Because we exclude effects of planar cell polarity on spindle orientation in our models, we can assume rotational symmetry around the z axis and therefore σx = σy. We introduce the parameter λv = –ln σx = –ln σy to quantify the extent of vertical enrichment (λv > 0) relative to the random distribution (λv = 0, Fig. 4B).
Interestingly, increasing σz instead of decreasing σx and σy results in identical distributions (if λh = –λv). Hence, both parameters could be used to describe the same distribution. To unambiguously distinguish horizontal and vertical enrichment, however, we restrict our modeling parameters to λh ≥ 0 for horizontal and λv ≥ 0 for vertical enrichment.
Supplementary Material
Acknowledgments
We thank members of the Knoblich lab for helpful discussions. We thank Matthias Jüschke, Alipasha Vaziri, and Carl-Philipp Heisenberg for helpful discussions and comments on the manuscript. We thank Xiaoqun Wang, Jan H. Lui, and Arnold R. Kriegstein whose preview article (34) about ref. 15 prompted us to mathematically analyze randomization. C.J. was supported by a Federation of European Biochemical Societies long-term fellowship. Work in J.A.K.’s laboratory is supported by the Austrian Academy of Sciences, Austrian Science Fund Projects P20547-B09, Z153-B09, and I552-B19, and an advanced grant from the European Research Council.
Footnotes
The authors declare no conflict of interest.
This article is a PNAS Direct Submission.
This article contains supporting information online at www.pnas.org/lookup/suppl/doi:10.1073/pnas.1314984111/-/DCSupplemental.
References
- 1.Kotak S, Gönczy P. Mechanisms of spindle positioning: Cortical force generators in the limelight. Curr Opin Cell Biol. 2013;25(6):741–748. doi: 10.1016/j.ceb.2013.07.008. [DOI] [PubMed] [Google Scholar]
- 2.McNally FJ. Mechanisms of spindle positioning. J Cell Biol. 2013;200(2):131–140. doi: 10.1083/jcb.201210007. [DOI] [PMC free article] [PubMed] [Google Scholar]
- 3.Morin X, Bellaïche Y. Mitotic spindle orientation in asymmetric and symmetric cell divisions during animal development. Dev Cell. 2011;21(1):102–119. doi: 10.1016/j.devcel.2011.06.012. [DOI] [PubMed] [Google Scholar]
- 4.Gillies TE, Cabernard C. Cell division orientation in animals. Curr Biol. 2011;21(15):R599–R609. doi: 10.1016/j.cub.2011.06.055. [DOI] [PubMed] [Google Scholar]
- 5.Poulson ND, Lechler T. Asymmetric cell divisions in the epidermis. Int Rev Cell Mol Biol. 2012;295:199–232. doi: 10.1016/B978-0-12-394306-4.00012-5. [DOI] [PMC free article] [PubMed] [Google Scholar]
- 6.Tang N, Marshall WF, McMahon M, Metzger RJ, Martin GR. Control of mitotic spindle angle by the RAS-regulated ERK1/2 pathway determines lung tube shape. Science. 2011;333(6040):342–345. doi: 10.1126/science.1204831. [DOI] [PMC free article] [PubMed] [Google Scholar]
- 7.Yadlapalli S, Yamashita YM. Spindle positioning in the stem cell niche. Wiley Interdiscip Rev Dev Biol. 2012;1(2):215–230. doi: 10.1002/wdev.16. [DOI] [PubMed] [Google Scholar]
- 8.Chenn A, McConnell SK. Cleavage orientation and the asymmetric inheritance of Notch1 immunoreactivity in mammalian neurogenesis. Cell. 1995;82(4):631–641. doi: 10.1016/0092-8674(95)90035-7. [DOI] [PubMed] [Google Scholar]
- 9.Noctor SC, Martínez-Cerdeño V, Ivic L, Kriegstein AR. Cortical neurons arise in symmetric and asymmetric division zones and migrate through specific phases. Nat Neurosci. 2004;7(2):136–144. doi: 10.1038/nn1172. [DOI] [PubMed] [Google Scholar]
- 10.Kosodo Y, et al. Asymmetric distribution of the apical plasma membrane during neurogenic divisions of mammalian neuroepithelial cells. EMBO J. 2004;23(11):2314–2324. doi: 10.1038/sj.emboj.7600223. [DOI] [PMC free article] [PubMed] [Google Scholar]
- 11.Götz M, Huttner WB. The cell biology of neurogenesis. Nat Rev Mol Cell Biol. 2005;6(10):777–788. doi: 10.1038/nrm1739. [DOI] [PubMed] [Google Scholar]
- 12.Lui JH, Hansen DV, Kriegstein AR. Development and evolution of the human neocortex. Cell. 2011;146(1):18–36. doi: 10.1016/j.cell.2011.06.030. [DOI] [PMC free article] [PubMed] [Google Scholar]
- 13.Peyre E, Morin X. An oblique view on the role of spindle orientation in vertebrate neurogenesis. Dev Growth Differ. 2012;54(3):287–305. doi: 10.1111/j.1440-169X.2012.01350.x. [DOI] [PubMed] [Google Scholar]
- 14.Yingling J, et al. Neuroepithelial stem cell proliferation requires LIS1 for precise spindle orientation and symmetric division. Cell. 2008;132(3):474–486. doi: 10.1016/j.cell.2008.01.026. [DOI] [PMC free article] [PubMed] [Google Scholar]
- 15.Postiglione MP, et al. Mouse inscuteable induces apical-basal spindle orientation to facilitate intermediate progenitor generation in the developing neocortex. Neuron. 2011;72(2):269–284. doi: 10.1016/j.neuron.2011.09.022. [DOI] [PMC free article] [PubMed] [Google Scholar]
- 16.Xie Y, Jüschke C, Esk C, Hirotsune S, Knoblich JA. The phosphatase PP4c controls spindle orientation to maintain proliferative symmetric divisions in the developing neocortex. Neuron. 2013;79(2):254–265. doi: 10.1016/j.neuron.2013.05.027. [DOI] [PMC free article] [PubMed] [Google Scholar]
- 17.Grill SW, Gönczy P, Stelzer EH, Hyman AA. Polarity controls forces governing asymmetric spindle positioning in the Caenorhabditis elegans embryo. Nature. 2001;409(6820):630–633. doi: 10.1038/35054572. [DOI] [PubMed] [Google Scholar]
- 18.Siller KH, Doe CQ. Spindle orientation during asymmetric cell division. Nat Cell Biol. 2009;11(4):365–374. doi: 10.1038/ncb0409-365. [DOI] [PubMed] [Google Scholar]
- 19.Shitamukai A, Matsuzaki F. Control of asymmetric cell division of mammalian neural progenitors. Dev Growth Differ. 2012;54(3):277–286. doi: 10.1111/j.1440-169X.2012.01345.x. [DOI] [PubMed] [Google Scholar]
- 20.Knoblich JA. Asymmetric cell division: Recent developments and their implications for tumour biology. Nat Rev Mol Cell Biol. 2010;11(12):849–860. doi: 10.1038/nrm3010. [DOI] [PMC free article] [PubMed] [Google Scholar]
- 21.Konno D, et al. Neuroepithelial progenitors undergo LGN-dependent planar divisions to maintain self-renewability during mammalian neurogenesis. Nat Cell Biol. 2008;10(1):93–101. doi: 10.1038/ncb1673. [DOI] [PubMed] [Google Scholar]
- 22.Morin X, Jaouen F, Durbec P. Control of planar divisions by the G-protein regulator LGN maintains progenitors in the chick neuroepithelium. Nat Neurosci. 2007;10(11):1440–1448. doi: 10.1038/nn1984. [DOI] [PubMed] [Google Scholar]
- 23.Peyre E, et al. A lateral belt of cortical LGN and NuMA guides mitotic spindle movements and planar division in neuroepithelial cells. J Cell Biol. 2011;193(1):141–154. doi: 10.1083/jcb.201101039. [DOI] [PMC free article] [PubMed] [Google Scholar]
- 24.Culurgioni S, Alfieri A, Pendolino V, Laddomada F, Mapelli M. Inscuteable and NuMA proteins bind competitively to Leu-Gly-Asn repeat-enriched protein (LGN) during asymmetric cell divisions. Proc Natl Acad Sci USA. 2011;108(52):20998–21003. doi: 10.1073/pnas.1113077108. [DOI] [PMC free article] [PubMed] [Google Scholar]
- 25.Zhu J, et al. LGN/mInsc and LGN/NuMA complex structures suggest distinct functions in asymmetric cell division for the Par3/mInsc/LGN and Gαi/LGN/NuMA pathways. Mol Cell. 2011;43(3):418–431. doi: 10.1016/j.molcel.2011.07.011. [DOI] [PMC free article] [PubMed] [Google Scholar]
- 26.Lancaster MA, Knoblich JA. Spindle orientation in mammalian cerebral cortical development. Curr Opin Neurobiol. 2012;22(5):737–746. doi: 10.1016/j.conb.2012.04.003. [DOI] [PMC free article] [PubMed] [Google Scholar]
- 27.Mapelli M, Gonzalez C. On the inscrutable role of Inscuteable: Structural basis and functional implications for the competitive binding of NuMA and Inscuteable to LGN. Open Biol. 2012;2(8):120102. doi: 10.1098/rsob.120102. [DOI] [PMC free article] [PubMed] [Google Scholar]
- 28.Zigman M, et al. Mammalian inscuteable regulates spindle orientation and cell fate in the developing retina. Neuron. 2005;48(4):539–545. doi: 10.1016/j.neuron.2005.09.030. [DOI] [PubMed] [Google Scholar]
- 29.Williams SE, Beronja S, Pasolli HA, Fuchs E. Asymmetric cell divisions promote Notch-dependent epidermal differentiation. Nature. 2011;470(7334):353–358. doi: 10.1038/nature09793. [DOI] [PMC free article] [PubMed] [Google Scholar]
- 30.Cover TM, Thomas JA. Elements of Information Theory. New York: Wiley-Interscience; 1991. [Google Scholar]
- 31. Shannon C, E. (1948) A mathematical theory of communication (continued). Bell Syst Tech J 27:623–656.
- 32.Mardia KV, Jupp PE. Directional Statistics. Chichester, UK: Wiley; 2000. [Google Scholar]
- 33.Muller ME. A note on a method for generating points uniformly on n-dimensional spheres. Commun ACM. 1959;2:19–20. [Google Scholar]
- 34.Wang X, Lui JH, Kriegstein AR. Orienting fate: Spatial regulation of neurogenic divisions. Neuron. 2011;72(2):191–193. doi: 10.1016/j.neuron.2011.10.003. [DOI] [PMC free article] [PubMed] [Google Scholar]
Associated Data
This section collects any data citations, data availability statements, or supplementary materials included in this article.