

Abstract
Motivation: Identification of expression Quantitative Trait Loci (eQTL), the genetic loci that contribute to heritable variation in gene expression, can be obstructed by factors that produce variation in expression profiles if these factors are unmeasured or hidden from direct analysis.
Methods: We have developed a method for Hidden Expression Factor analysis (HEFT) that identifies individual and pleiotropic effects of eQTL in the presence of hidden factors. The HEFT model is a combined multivariate regression and factor analysis, where the complete likelihood of the model is used to derive a ridge estimator for simultaneous factor learning and detection of eQTL. HEFT requires no pre-estimation of hidden factor effects; it provides P-values and is extremely fast, requiring just a few hours to complete an eQTL analysis of thousands of expression variables when analyzing hundreds of thousands of single nucleotide polymorphisms on a standard 8 core 2.6 G desktop.
Results: By analyzing simulated data, we demonstrate that HEFT can correct for an unknown number of hidden factors and significantly outperforms all related hidden factor methods for eQTL analysis when there are eQTL with univariate and multivariate (pleiotropic) effects. To demonstrate a real-world application, we applied HEFT to identify eQTL affecting gene expression in the human lung for a study that included presumptive hidden factors. HEFT identified all of the cis-eQTL found by other hidden factor methods and 91 additional cis-eQTL. HEFT also identified a number of eQTLs with direct relevance to lung disease that could not be found without a hidden factor analysis, including cis-eQTL for GTF2H1 and MTRR, genes that have been independently associated with lung cancer.
Availability: Software is available at http://mezeylab.cb.bscb.cornell.edu/Software.aspx.
Supplementary information: Supplementary data are available at Bioinformatics online.
Contact: jgm45@cornell.edu
1 INTRODUCTION
Studies that have identified expression Quantitative Trait Loci (eQTL), the genetic loci that produce variation in cellular or tissue gene expression levels, have demonstrated that a considerable fraction of gene expression variation has a genetic basis (Cheung and Spielman, 2009; Cookson et al., 2009). Recently, more precise measurement of genome-wide gene expression levels using RNA-Seq technology (Wang et al., 2009), combined with greater marker coverage of genomes, has increased the resolution of eQTL analyses and has allowed more precise dissection of eQTL effects (Montgomery and Dermitzakis, 2009). A spectrum of new genome-wide assays making use of next-generation sequencing, such as Methly-Seq (Brunner et al., 2009) and DNase-Seq (Denger et al., 2012), are providing quantitative data on other cellular profile variables that can be analyzed using an eQTL approach, opening the door for a broader “x” Quantitative Trait Loci (xQTL) framework (Arends et al., 2012). This expanded capability and diversity of eQTL detection has also been accompanied by an appreciation that eQTL can provide useful insights into the genetic basis of disease (Nica and Dermitzakis, 2008). For example, eQTL identification is now routinely incorporated into the analysis of disease risk and other complex aspects of physiology (Cookson et al., 2009). A consequence of these trends is a renewed interest in analysis methodologies used to identify eQTL from genome-wide data (Fusi et al., 2012; Yang et al., 2013). For these new methods, there is a premium on the ability to identify as many eQTL as possible while simultaneously providing strict false-positive control. High performing, fast and reliable methods will also be particularly valuable for analyzing the highly multivariate mixed data-type xQTL studies that are on the near horizon.
For a typical eQTL study that includes genome-wide data on both gene expression and genetic markers, identification of eQTL is generally accomplished using standard linear modeling approaches, where marker genotypes with a significant association with one or more expression variables are assumed to either indicate an eQTL or a marker that is in linkage disequilibrium (LD) with the eQTL polymorphism, i.e. the marker indicates the local genomic position of an eQTL (Michaelson et al., 2009). Although such approaches are straightforward and successful, it is well appreciated that factors responsible for variation in gene expression, if unaccounted for in the statistical model, can dramatically affect both power and precision of genome-wide eQTL detection (Michaelson et al., 2009). This is particularly true in uncontrolled study designs, as is often the case with human eQTL studies, where unmeasured environmental and other factors can influence gene expression profiles and confound eQTL analysis (Harvey et al., 2007). More precisely, if the effects of unaccounted for factors on gene expression are orthogonal to effects of eQTL, the factors contribute to the error term and this reduces the power to detect eQTL. If the effects of unaccounted for factors are non-orthogonal to the effects of eQTL, the result can be a false positive (Price et al., 2006).
That unaccounted for factors can be a problem for eQTL identification is not surprising given the many studies demonstrating that gene expression levels are highly variable and depend on a host of genetic (Cheung and Spielman, 2009) and non-genetic factors (Harvey et al., 2007). For statistical modeling purposes, we can categorize expression factors into three cases that require different analysis approaches: (i) a factor that is well represented by a variable that is directly measured in the study, (ii) a factor that can be inferred from the genotype data and (iii) a factor with effects that can be learned from gene expression data. The first includes cases where measured variables such as experimental batch, a disease state of an individual and so forth can be directly incorporated into the statistical model as a covariate. The second includes factors such as cryptic population structure (Price et al., 2006) or relatedness among individuals that can produce variation in measured gene expression levels. For many of these cases, appropriate variables can be inferred directly from the genome-wide genotype data, which can then be secondarily incorporated as fixed or random covariates to correct for factor effects (Kang et al., 2010; Price et al., 2006). The third case includes expression factors that cannot be well modeled with covariates inferred from genotype data but have effects that can be learned from the covariance among expressed genes (Listgarten et al., 2010; Stegle et al., 2010). For this case, the assumption is that the expression factor effects are large enough that the effects of the factors, although not the factors themselves, can be learned using a factor analysis or related approach (Friguet et al., 2009; Stegle et al., 2010). These learned factor effects can then be incorporated into the eQTL analysis as covariates (Friguet et al., 2009) and the eQTL analysis can be conducted on the residuals of the expression variables after subtracting the learned factors (Stegle et al., 2010). The value of accounting for factors in an eQTL analysis that can be learned from expression covariance is just beginning to be appreciated and several recent methods have been proposed for this purpose (Friguet et al., 2009; Fusi et al., 2012; Kang et al., 2008; Leek et al., 2012; Leek and Storey, 2007; Listgarten et al., 2010; Parts et al., 2011; Stegle et al., 2010, 2012; Yang et al., 2013). We note that these publications variously refer to these expression factors as hidden confounders (Listgarten et al., 2010), non-genetic factors (Stegle et al., 2010), surrogate variables (Leek and Storey, 2007) and so forth, but here we refer to them as hidden factors.
In this article, we introduce a new method for eQTL analysis that accounts for the effects of hidden factors: Hidden Expression Factor analysis (HEFT). The HEFT framework unifies a number of desirable goals when performing an eQTL analysis in the presence of hidden factors: P-value identification of eQTL with individual or multivariate (pleiotropic) effects on expressed genes, the ability to learn both orthogonal and non-orthogonal hidden factors that can inflate or deflate P-values without pre-learning these factors, and efficient scaling, such that an eQTL analysis of thousands of gene expression variables and hundreds of thousands of marker genotypes can be completed in a few hours on a standard desktop. Critically, inference in HEFT is accomplished using the complete likelihood to derive a ridge estimator for combined factor learning and detection of eQTL, the value of which we illustrate by comparing the performance of HEFT with related hidden factor methods when analyzing simulated data (Fusi et al., 2012; Listgarten et al., 2010; Stegle et al., 2010; Yang et al., 2013). For a combination of null and hidden factor eQTL scenarios, we show that at worst HEFT has equal performance to these other methods and for the most realistic scenarios, where there are hidden factors and a combination of univariate and multivariate (pleiotropic) eQTL effects, HEFT correctly identifies more eQTL than these other methods without an increase in false positives. We also demonstrate the real-world discovery value of a hidden factor analysis by using HEFT to identify eQTL that affect gene expression in the human lung from a sample of smokers and non-smokers by assessing possible associations of 7575 expression variables with 191 959 genotypes. In this analysis, HEFT identified all of the cis-eQTL found by other hidden factor methods and 91 additional cis-eQTL. HEFT also identified a number of eQTLs with direct relevance to lung disease that could not be found without a hidden factor analysis. Many of these newly discovered eQTL have clear connections to lung physiology and disease, including cis-eQTL for General Transcription Factor IIH, Polypeptide 1 (GTF2H1) and 5-Methyltetrahydrofolate-Homocysteine Methyltransferase Reductase (MTRR), two genes that have been independently associated with lung cancer (Shi et al., 2005; Wu et al., 2009).
2 METHODS
2.1 The HEFT model
The HEFT framework assesses associations between genotypes and expression variables by combining a multivariate regression and factor analysis. The following model is used to assess the association of a single genotype with m expression variables for a sample of size n:
| (1) |
where Y is an  matrix of measured expression variables,
  is vector of 1 s of length m, μ is an
  vector of row means, X is a
  matrix with the first column set to 1 and second column set to the genotype, β is the
  matrix of column means and genotypic effects,
  and F are the
  loading matrix and
  matrix of values for p factors and W is the
  error matrix, where we make the standard assumption that covariance among samples can be well modeled by non-error terms such that each column of matrix W has a normal distribution
  with diagonal
  matrix
  . To avoid the potential problems caused by biased estimates of unconstrained error variances (Carroll and Ruppert, 1988), we assume that expression variables have been scaled to a common variance and we constrain each of the
  to be
to be  . In this framework, we assume complete expression and genotype data or that missing values have been imputed before analysis. When considering additional fixed covariates, whether directly measured or independently inferred from genotypes (e.g. population structure), these are incorporated into (1) as additional fixed effects. In addition, additive, dominance and the simultaneous effects of multiple genotypes (including epistasis) can be handled in this framework, although we restrict the current treatment to assessing a single genotype at a time using an additive coding.
A number of proposed methods make use of the modeling strategy of Equation (1) by applying a two-step approach, where hidden factors are learned from a separate factor analysis and the inferred loadings are then incorporated into a fixed  (Friguet et al., 2009) to adjust the P-values. In our treatment here, we simultaneously infer genotype associations and learn factors (i.e. we use an unrestricted
  ) by imposing constraints on F and
  to account for the lack of identifiability of the combined genotype and hidden factor effects. We do this by introducing a hierarchical control by assuming
  and
and  . With this approach, and by considering the complete likelihood for this model, the maximum likelihood estimate of β and the expected value of F given Y have the same form as regression coefficients obtained for a ridge regression (see Supplementary Sections S.1.1–S.1.2). Therefore, this hierarchical approach places a ridge penalty on both the genotype and factor when performing inference with the complete likelihood. Such a modeling strategy is appropriate when we expect the genotype and factor effects to follow a relatively sparse model when considering the entire variable set, a reasonable assumption in many cases when the expression variable set m is large. This approach also has the additional benefits of a ridge regression, e.g. a stable solution on the non-orthogonal linear equations, smaller variance of the estimator of β’s and so forth.
We note that because  is unrestricted, setting the value of
  has no effect on the results. We also find that when setting
  to be the same or larger than the scaled variance of the expression variables (i.e. such that the hierarchical control is diffuse), there is no qualitative effect on results. However, under the set up of our model, we do need to shrink
  and F by the same amount to address the identifiability issue caused by the non-orthogonal factors. Therefore, we adopt this approach in our analyses by setting
  , an approach that prevents biasing estimates toward genotype or factor effects when these are non-orthogonal and also has convenient properties for implementing the expectation maximization (EM) algorithm (see Supplementary Section S.1.2). We also note that the lack of a unique solution for
  is not an issue for our treatment, as we are only interested in accounting for the overall effects of hidden factors and not in learning either factor loadings or the factor scores.
2.2 Likelihood and EM algorithm
As the full HEFT model has the form of Equation (1) and also includes ridge penalties on the genotype and factor effects, the complete likelihood has the form:
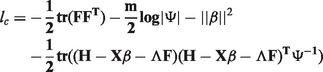 |
(2) |
where  and the variables are the same as described in (1). For the purposes of eQTL analysis, we are only interested in the estimates of the β for a given marker, which takes the following form:
| (3) |
such that this is a ridge estimator of eQTL effects.
Obtaining these estimates is accomplished using an expectation–maximization algorithm, which has time complexity scaling 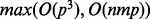 for each iteration over one single nucleotide polymorphism (SNP), where n is the sample size, m is the number of genes and p is the number of the factors (see Supplementary Section S.1.2.3). As p is small, the algorithm is extremely efficient. The likelihood function of the full model is convex (see Supplementary Section S.1.3), and because all expression variables are analyzed simultaneously, analysis of an individual genotype and all expressed genes can be done in a single step with a single run of the algorithm.
2.3 Selection of factor number
We note that the true number of hidden factors p in the model can never be known with certainty. Although for simulated data, standard model selection approaches such as Akaike information criteria or Bayesian information criterion can be used to correctly infer the number of factors (see Supplementary Section S.1.4), we have found that for real data, these can select too many factors, resulting in clear hallmarks of data overfitting. In practice, we therefore select the number of factors by assessing the eigen spectrum of the overall gene expression covariance and selecting p factors corresponding to the number of eigenvalues that explain a certain amount of variance (e.g. 5% of the total variance) or that are visually distinguishable from the rest of the eigen spectrum. This approach performs well for simulated data and for real data, producing a reasonable enrichment of significant eQTL without over-inflating the genome-wide distributions of P-values as measured by the genome-wide inflation factor λ (Devlin and Roeder, 1999) (see later in the text).
2.4 P-values and identification of eQTL
As with a standard eQTL analysis, identification of eQTL using HEFT is accomplished using P-values. We favor a simple t-type test statistic, which requires one run of the algorithm per marker (see Supplementary Section S.1.5). Although this test is not asymptotically exact, we find this to perform well in practice, where resulting P-values are uniform under the null and the statistic has comparatively good power (see later in the text). Because a single significant genotype-gene association indicates an eQTL, in this treatment, we follow the standard practice of eQTL analysis and assess each pair of relationships one at a time and interpret rejection of the null for at least one pair as evidence of an eQTL. The multivariate or pleiotropic effects of an eQTL (i.e. the effects on multiple genes) are determined by the set of genotype-gene pairs for which the null is rejected for a genome-wide multiple test corrected significance threshold.
2.5 Connections between HEFT and other eQTL hidden factor methods
A number of proposed methods use a two-step approach for hidden factor eQTL analysis, where hidden factors are learned from a separate factor analysis and either the inferred loadings  are incorporated as covariates (Friguet et al., 2009) or the residuals
  , which are assumed to be free of the hidden factor structure, are used to perform secondary eQTL analysis (Stegle et al., 2010). A number of methods for simultaneous modeling of eQTL and hidden factors have been proposed. Surrogate variable analysis (SVA) can perform simultaneous modeling using a heuristic approach for finding factor effects from residual variation resulting from iterative fitting of genotype and other fixed effects (Leek and Storey, 2007). The approach of Listgarten et al. (Listgarten et al., 2010; Zhang et al., 2012) makes use of a linear mixed model (LMM) where a full rank kernel matrix for the random effects is seeded from an initial estimate and then allowed to update within the algorithm, where the random effect is integrated out. Fusi et al. (2012) proposed another LMM approach with a reduced rank kernel matrix. Unlike the LMM with random effects integrated out, probabilistic estimation of expression residuals (PEER) (Stegle et al., 2010) used a variational Bayes factor analysis approach that explicitly modeled the hidden confounding, with the potential for incorporating a simultaneous inference procedure. The recently proposed method low-rank representation and sparse regression (LORS) (Yang et al., 2013) makes use of a complete likelihood by applying a Lasso penalty to impose sparsity on the nuclear norm of the matrix of factor effects (i.e. the entire
  of the HEFT model, thus the effects of individual factors are not individually modeled) and a Lasso penalty to perform feature selection when considering multiple markers (or no penalty when considering one marker at a time), where a framework for calculating P-values is not provided.
In contrast to these methods, HEFT makes use of the complete likelihood of a combined multivariate regression and factor analysis model, allowing for the individual modeling of multiple factors by applying a ridge penalty to factor effects (i.e. the matrix F while  is left unconstrained) and similarly a ridge penalty on genotypes, where P-values for assessing individual marker-expression association are calculated. We show using simulations that individual modeling of factor effects and the ridge imposed sparsity of HEFT is an effective strategy for dealing with pleiotropic effects of eQTL in the presence of both orthogonal and non-orthogonal hidden factors.
3 SIMULATIONS AND DATA
3.1 Simulated data and analyses
We simulated data for each of the following scenarios: (i) no eQTL and no hidden factors (null scenario 1), (ii) no eQTL with hidden factors (null scenario 2), (iii) eQTL where each affects one expressed gene (no pleiotropy) and no hidden factors, (iv) a combination of pleiotropic (multivariate) and non-pleiotropic eQTL and no hidden factors, (v) non-pleiotropic eQTL with hidden factors and (vi) a combination of pleiotropic and non-pleiotropic eQTL with hidden factors (see Supplementary Section S.2.1 and Supplementary Table S1). Therefore, scenarios i–iv lack expected aspects of real eQTL datasets and are ‘null’ scenarios from the perspective of hidden factors, where the purpose of these scenarios was to dissect the reasons for different performance among hidden factor methods. In scenarios v and vi, there are both hidden factors and eQTL, although the combination of univariate and multivariate (pleiotropic) eQTL effects of scenario vi seems likely to be the most realistic. For each of the scenarios with hidden factors (ii, v, vi), we simulated 10 datasets where the hidden factor effects were orthogonal to the entire set of markers and 10 datasets with hidden factors that were non-orthogonal to a non-trivial subset of the markers. For the scenarios with no hidden factors (i, iii, iv), we also simulated 10 datasets each. The sample size for each dataset was fixed at n = 200.
To generate the genetic markers of each dataset, 5 Mb of marker data (SNPs) for a single diploid populations of size  were generated using the coalescent simulator MaCS (Chen et al., 2009). For each dataset, we randomly selected 1000 SNPs from those with a derived minor allele frequency >0.1, producing an average LD of 0.45 ± 0.01 for all 10 datasets of pairwise markers as measured by r2. We note that we did not include population structure in our simulation analyses, as we were interested in assessing the ability of hidden factor methods to detect eQTL without this additional layer of complexity. Again, we note that HEFT can include a fixed effect correction for population structure, and we use this approach for the analysis of real data (see later in the text). To generate the gene expression values of each dataset, we simulated 500 gene expression variables with standard normal error. For the eQTL scenarios with no pleiotropy (iii and v), we randomly selected 50 uncorrelated markers to be eQTL, where the additive effect of each on a randomly selected gene was drawn from a standard normal. For the cases with pleiotropy (iv and vi), we included 50 eQTL with individual gene effects and selected an additional 20 uncorrelated SNPs each influencing 20 expression variables, where again, the effect on each gene was selected from a standard normal. Overall, the total variation explained by the eQTL for a given gene ranged from 5.0e-07 to 0.92, with the vast majority in the range of 0–0.025, such that we expect these simulations to reflect a conservative estimate of the gains that could be realized when applying HEFT to real data. For each dataset with hidden factors (ii, v, vi), we additionally incorporated the effects of four orthogonal or non-orthogonal factors (see Supplementary section S.1.2).
As well as applying HEFT, we analyzed each simulated dataset with the following eQTL methods: a linear regression method, PEER (Stegle et al., 2010), LMM (LMM-EH) (Listgarten et al., 2010), Probabilistic ANAlysis of genoMic dAta (PANAMA) (Fusi et al., 2012), SVA (Leek and Storey, 2007), and LORS (Yang et al., 2013). For comparison, we also applied a two-step version of our method (HEFT-TS) where this method first estimates the factor model [the  of Equation (1)] from the multivariate gene expression data without any consideration of genetic effects, and in the second step, fixes the factor model to these estimated values and applies the HEFT model [Equation (1)]. We note that although the PEER framework can in theory apply a simultaneous eQTL/hidden factor analysis, the released R package does not support simultaneous analysis. For analysis methods where the factor number could be controlled (HEFT-TS, PEER and HEFT), for scenarios where there were no hidden factors (i, iii, iv), we analyzed each dataset with factor number P = 1, 2, and for scenarios where there were four hidden factors (ii, v, vi), we analyzed each dataset with factor numbers 3, 4, 5 and 7.
For assessing performance, a P-value below a selected threshold for a SNP-gene pair representing a true eQTL was counted as a true positive and similarly, P-values below the selected threshold for a SNP-gene pair that was not an eQTL was counted as a false positive. We note that while LD was not overly strong in our simulated marker datasets, with this approach, non-eQTL SNPs that were in strong LD with eQTL SNPs could contribute multiple false-positive signals. Thus, although we potentially counted a few cases as false positives that would be merged into a single ‘true’ positive in a real eQTL analysis (where the true eQTL are not known), by applying the same conservative criteria for all analysis methods, this provided a common and fair comparison of performance. To provide a summary of the true-positive and false-positive rates (FPRs), we compared the areas under the curve (AUC) of the Receiver Operating Characteristic (ROC) curves generated by applying each method to the datasets simulated under a given scenario. We compared the (AUC) of HEFT versus each of the other methods for a FPR in the range 0–0.05 using a two-sided t-test, where we note that we obtained qualitatively equivalent results for FPR ranges of 0–0.01 and 0–0.001 (results not shown).
3.2 Lung airway dataset
We used HEFT, PEER, PANAMA and linear regression to identify eQTL affecting gene expression in the lung small airway epithelium (SAE) using a dataset that included 79 smokers and 37 non-smokers (see Supplementary section S.2.2 and Supplementary Table S2). Details concerning data collection for these samples have been provided elsewhere (Harvey et al., 2007). Briefly, SAE cell populations were collected by bronchial brushing of the small airway (Raman et al., 2009) and RNA was hybridized to the HG-U133 Plus 2.0 microarray (Affymetrix, Santa Clara, CA) using standard protocols. We used the custom mapping provided by Dai et al. (2005) and removed probes that appeared to have outliers, providing data on ∼7575 protein-coding genes. Blood was also collected from each individual, and Affymetrix 5.0 microarrays were used to provide SNP genotypes. After filtering SNPs with a minor allele frequency below 0.1, significant deviations from Hardy–Weinberg equilibrium as assessed by a P <0.05, and those genotypes with any missing observations, this left 191 959 genotypes for analysis. The complete expression and genotype dataset analyzed in this study have been deposited in NCBI’s Gene Expression Omnibus (Edgar et al., 2002) and are accessible through GEO Series accession number GSE40364.
In our HEFT analysis of these data, we selected the hidden factor number by visual examination of the eigen spectrum of the gene expression correlation matrix, where five factors were found to be clearly separable from the rest (see Supplementary Fig. S1). We note that we also tried other factor numbers in our analysis (3, 7, 12), although the results were not qualitatively different (not shown). We used the same factor number for PEER and used PANAMA’s default setting to select factor number. To account for the obvious population structure in these data, we applied a factor analysis to the genotype matrix (Engelhardt and Stephens, 2010) and incorporated the loading of the first factor as a fixed covariate. We additionally included fixed covariates for gender, disease status and smoking status. Two strategies for assessing significance of each SNP-expression pair were applied: a conservative Bonferroni-corrected threshold of 0.05/(7575 × 191 959) = 3.438578e-11 and a more liberal Benjamini–Hochberg control of the false discovery rate at  . For the eQTL discovered by each method, we considered both the total number of associations identified at a given significance cutoff and those that were cis- (i.e. the eQTL genotype is within 1 Mb upstream of the start and 1 Mb of the end position of the coding region of the expressed gene with which it is associated).
4 RESULTS
4.1 Comparison of HEFT to hidden factor methods
4.1.1 Performance for null and standard eQTL scenarios
All eQTL analysis methods performed appropriately, under scenario i, where there are no eQTL and no hidden factors (null scenario 1), returning a uniform distribution of P-values (or adjusted P-values in PANAMA) with genomic inflation factors in the range of 1.00–1.04 (Aulchenko et al., 2007) for the set of all SNP-gene tests (see Supplementary section S.3.1.1, Supplementary Table S4 and Fig. S2). This outcome was observed regardless of the number of factors that were provided to HEFT-TS, PEER and HEFT, indicating that these methods are also robust to incorporating the wrong number of factors (>0) for this null scenario. A similar result was observed under scenario ii, where there are no eQTL and hidden factors (null scenario 2), when we considered performance for cases where the effects of the four hidden factors were (approximately) orthogonal to all SNPs (see Supplementary Fig. S3). For the case of non-orthogonal hidden factors under this same null scenario, the performance for linear regression diverged far from the null expectation where far too many small P-values were returned, a result that in practice would result in a large number of false positives (see Supplementary Fig. S4). This result is expected given that the linear regression is unable to distinguish an eQTL signal from the effects of hidden factors. All other methods returned P-values conforming to the null expectation for the non-orthogonal case when provided the correct or greater than the true number of factors ( ), again indicating that all the hidden factor methods perform appropriately in this null scenario.
For the standard eQTL scenarios where there are eQTL but no hidden factors, performance of the analysis methods depended on whether the eQTL had pleiotropic effects. In scenario iii where there was no pleiotropy (each SNP with an eQTL effect was associated with a single gene expression level), the performance of HEFT, HEFT-TS, PEER, PANAMA and LORS were equivalent (see Supplementary Table S4 and Fig. S5). In contrast, in scenario iv, where there were eQTL with pleiotropic effects, HEFT, linear regression and the two-step hidden factor methods HEFT-TS and PEER had comparable performance but these methods had better performance than PANAMA and LORS (see Supplementary Table S4 and Fig. S6), likely a result of these latter methods fitting many of the pleiotropic effects of eQTL as hidden factors (see Supplementary Section S.3.1.1 for further discussion). For both scenarios iii and iv, SVA and LMM had significantly worse performance than other methods, which may be a result of overfitting (again, see Supplementary Section S.3.1.1). Overall, HEFT had at least equal or better performance when compared with all other hidden factor methods for these ‘null’ hidden factor scenarios.
4.1.2 Performance for eQTL and hidden factors
For the scenarios where there are both eQTL and hidden factors, performance depended heavily on whether there was no pleiotropy (scenario v) or pleiotropy (scenario vi). In the scenario where none of the eQTL had pleiotropic effects, all hidden factor methods performed better than linear regression when provided  the true number of factors. This was the case regardless of whether the hidden factor effects were orthogonal or non-orthogonal (see Supplementary Section S.3.1.2, Supplementary Table S4 and Figs S7–S8).
For the scenarios where there were eQTL with pleiotropic effects, HEFT significantly outperformed other methods when comparing the AUC of the ROCs (FPR: 0–0.05) using a two-sided t-test (see Supplementary Table S4). We also summarize these results in terms of the additional number of eQTL associations discovered, where we consider each true association of a genotype with one expressed gene to be a single eQTL association. For example, for scenario vi when including four non-orthogonal hidden factors, HEFT provided significant gains when measured by P-values/average number of additional associations correctly identified when compared with linear regression (7.9e-08/34), LMM (4.74e-13/117), PANAMA (1.83e-10/53), LORS (2.41e-8/48) and SVA (highly significant), and qualitatively equivalent results were obtained when HEFT considered too many (seven) factors (see Fig. 1 and Supplementary Table S4). The only hidden factor methods that had comparable performance were the two-step methods (HEFT-TS, PEER), but only when these methods considered the correct number of factors. When HEFT and these methods considered the incorrect number of factors (seven), HEFT had significantly better performance compared with both HEFT-TS (<0.003/15) and PEER (<0.004/15).
Fig. 1.
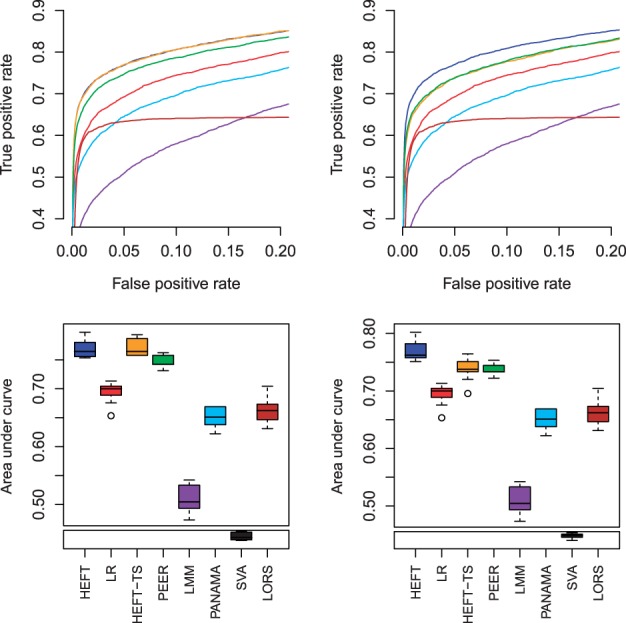
Average ROC curves (top) and box plots of the AUC for the ROC for an FPR in the range 0–0.05 (bottom) for simulated data in the case of pleiotropic eQTL effects and non-orthogonal hidden factors (scenario vi), where left and right correspond to provided factor numbers of four and seven, respectively, for the analysis methods when selection of factor number applies (see Supplementary Fig. S10 for other factor numbers). The methods are color coded as red = linear regression, blue = HEFT, orange = HEFT-TS, green = PEER, purple = LMM-EH, sky blue = PANAMA, black = SVA and brown = LORS. The leveling off of the ROC curve for LORS is a consequence of this method preselecting markers to include, which caps the maximum number of true positives that can be identified
The better performance of HEFT was also observed for scenario vi when orthogonal hidden factors were considered (see Supplementary Table S4 and Fig. S9). Therefore, HEFT had the best performance overall for the pleiotropy eQTL cases of scenario vi and was robust to inclusion of more than the true number of hidden factors (which will generally be unknown in practice). This better performance of HEFT in scenario vi is likely a result of other methods fitting many of the pleiotropic effects of eQTL as hidden factors, which lowers the power of these methods to detect these eQTL. This assessment is supported by the observation that several of the hidden factor methods (PANAMA, HEFT-TS, PEER, LORS) had comparable results with HEFT for scenario v, where there were only non-pleiotropic eQTL and hidden factors (see Supplementary Table S4 and Figs S7–S8). We note that for the non-orthogonal case of scenario vi, the reduced performance of some hidden factor methods (LMM, PANAMA, SVA, LORS) was so extreme that they no longer performed better than linear regression (see Supplementary Section S.3.1.2 for further discussion). Overall, for hidden factor scenario vi that is likely to be most realistic, where there are univariate and multivariate eQTL effects, HEFT correctly identifies significantly more eQTL compared with other hidden factor methods without an increase in false positives.
4.2 HEFT analysis of the lung SAE
We used HEFT with a hidden factor number P = 5 and appropriate covariates to analyze the 7575 SAE expressed genes and 191 959 marker genotypes. For comparison, we also applied linear regression, PEER with five hidden factors and PANAMA using the default settings to select the factor number. The entire analysis took ∼13 h on an 8 core 2.6 G processor. After ranking the full 7575 × 191 959 = 1.45e9 P-values, we found 96 non-duplicated significant hits for HEFT using a Bonferroni cutoff of  , where non-duplicated hits were defined by allowing at most one significant cis- association per overlapping gene region, although a given genotype could count toward multiple non-duplicate associations if it affected multiple genes in trans-. The 96 non-duplicated significant associations identified with HEFT included almost all of the hits identified by the other methods when using the same criteria: PEER identified 70 (all overlapped with HEFT), PANAMA 25 (24) and linear regression 43 (41). This same trend was observed when considering the non-duplicated cis- associations identified by HEFT (63), where these included all cis- associations identified by other methods (see Supplementary Fig. S12).
Figure 2 summarizes the overlap of non-duplicate associations identified when controlling the false discovery rate at q = 0.05. HEFT was able to identify all of the cis- associations that were detected by PEER, PANAMA and linear regression together, where HEFT was also able to identify 91 cis- associations that were not detected by the other hidden factor methods. We note that the Quantile-Quantile (QQ) plot for all 1.45e9 P-values generated by HEFT had a genomic inflation factor of  and behaved correctly overall (see Supplementary Fig. S13), indicating that the additional discoveries identified by HEFT were not a function of inflating P-values overall, but rather the additional power afforded by the method. In addition, a visual inspection of the heat-map of the entire set of P-values returned by HEFT compared with linear regression (Fig. 3 and Supplementary Fig. S14) showed that HEFT was able to remove the cases where SNPs were strongly associated with all expressed genes, a clear sign of an unaccounted for non-orthogonal factor. Together, these observations indicate that HEFT is correctly accounting for hidden factors, while not over-fitting the data and, as a consequence, HEFT is revealing a considerable number of additional eQTL that could not be identified with other methods. This point is further supported by looking at genes individually, where the HEFT analysis produced well-behaved QQ plots and was also able to reveal significant cis-eQTL that are not detectable by linear regression (Fig. 4 and Supplementary Fig. S15). Here, we describe four cases that are of particular relevance to lung disease (see Supplementary Table S5 for a more complete list).
Fig. 2.
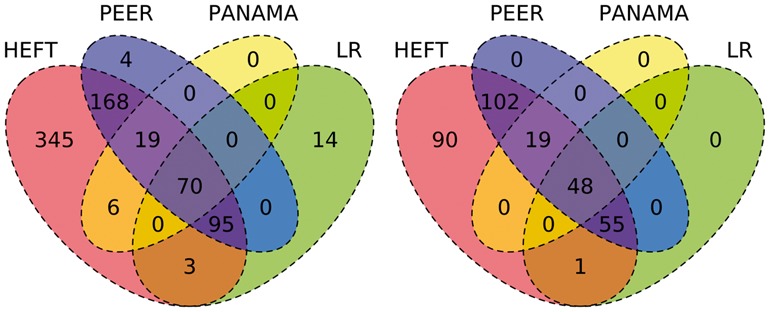
Venn diagram showing the total number of non-duplicate SNP–gene associations (left) and the subset of these that are cis- (right) identified by HEFT, PEER, PANAMA and linear regression when controlling the false discovery rate at 
Fig. 3.
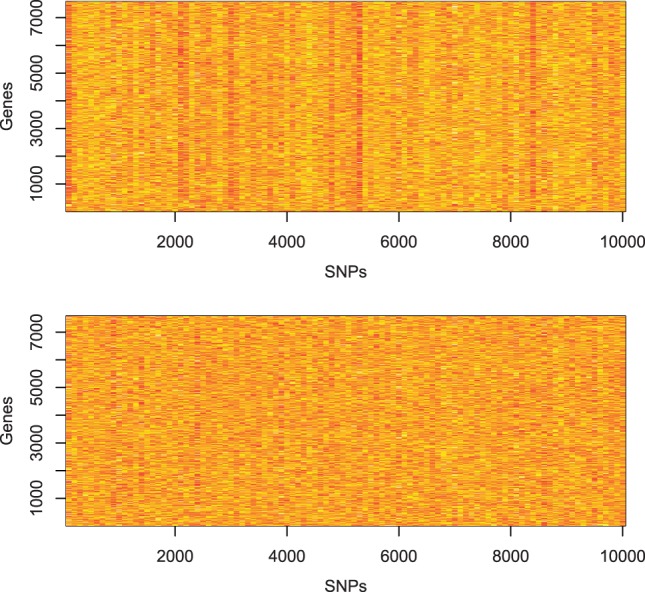
A heat map of a subset of P-values obtained from the analysis of all 191 959 SNPs with all 7575 genes expressed in human lung SAE using linear regression (top) and HEFT (bottom). Genes are arranged in rows and SNPs are arranged in columns, where colors from yellow to red represent large to small (significant) P-values. The map represents the P-values for 10 000 SNPs and all 7575 genes and illustrates the trend observed genome-wide (see Supplementary Fig. S14) that the linear regression analysis identified SNPs associated with almost all expressed genes, indicating unaccounted for hidden factors, where this trend is not observed with HEFT
Fig. 4.
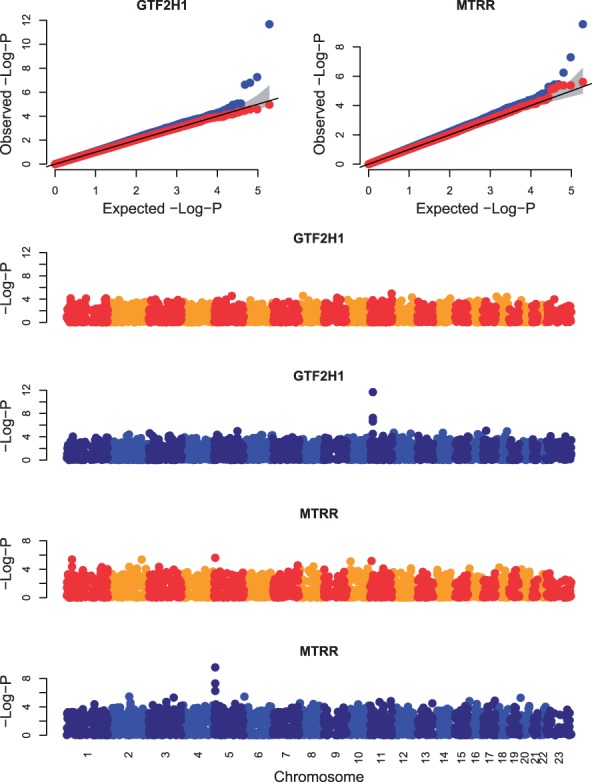
Quantile-Quantile (QQ) plots of observed versus expected −log P-value (top row) and Manhattan plots of −log P-value versus genomic position (bottom four rows) for all genotypes tested for associations with the genes GTF2H1 and MTRR. The gray bands in the QQ plots correspond to the 95% confidence interval of the order statistics. The P-values for HEFT (blue points) indicate a cis-eQTL for these two genes that were not indicated by the P-values of a linear regression (red and orange/yellow points)
GTF2H1 is the p62 subunit of the multiprotein complex transcription factor IIH (TFIIH) that is located on 11p15.1-p14 of chromosome 11. GTF2H1 participates in both the nucleotide excision repair process and transcription control by specifically interacting with a variety of factors important in carcinogenesis. The SNP association we found, rs4150622 is ∼1 kb away from an SNP found to be associated with lung cancer (Wu et al., 2009) (Fig. 4). We identified a cis-eQTL for RuvB-Like AAA ATPase 1 (RUVBL1) located on 3q21.3 of chromosome 3, which is an overexpressed gene in several tumors including non-small cell lung cancer tumors (Dehan et al., 2007). We also found a cis-eQTL for Transcription elongation factor, mitochondrial (TEFM), also known as C17orf42, which is located on chromosome 17 that is necessary for transcription of human mitochondrial DNA (Minczuk et al., 2011). RNA interference leads to inactivation of TEFM in cells, which leads to respiratory incompetence because of decreased levels of H- and L-strand promoter-distal mitochondrial transcripts. We additionally found a cis-eQTL for MTRR, which is located on 5p15.31 (Fig. 4). Previous studies have shown that variants in or near MTRR show associations with lung cancer in a population of >2000 non-Hispanic Caucasians (Shi et al., 2005).
5 CONCLUSION
Although the benefits of applying HEFT for eQTL detection compared with standard eQTL analysis approaches depends on the existence of problematic hidden factors, it does seem reasonable to assume that hidden factors may be a common problem, particularly when considering expression analysis of cell populations or tissues collected under uncontrolled experimental conditions, as is common in human studies. We expect the value of methods such as HEFT that can identify additional eQTL, while providing strict false-positive control will be particularly evident when applied to eQTL studies making use of the greater accuracy provided by RNA-Seq-based measurements, as well as to xQTL studies of new multivariate next-generation sequencing data types. Beyond eQTL and xQTL analysis, the combined multivariate regression and factor analysis model of HEFT makes the method broadly applicable to any discovery or data mining problem where a regression and factor analysis are currently applied in a step-wise manner.
Funding: This work was supported in part by NIH grants R01 HL074326 and P50 HL084936, Qatar National Research Fund NPRP 4-640-1-096 and by NSF grants IOS1026555 and DEB0922432.
Conflict of Interest: none declared.
Supplementary Material
REFERENCES
- Arends D, et al. xQTL workbench: a scalable web environment for multi-level QTL analysis. Bioinformatics (Oxford, England) 2012;28:1042–1044. doi: 10.1093/bioinformatics/bts049. [DOI] [PMC free article] [PubMed] [Google Scholar]
- Aulchenko Y, et al. GenABEL: an R library for genome-wide association analysis. Bioinformatics (Oxford, England) 2007;23:1294–1296. doi: 10.1093/bioinformatics/btm108. [DOI] [PubMed] [Google Scholar]
- Brunner A, et al. Distinct DNA methylation patterns characterize differentiated human embryonic stem cells and developing human fetal liver. Genome Res. 2009;19:1044–1056. doi: 10.1101/gr.088773.108. [DOI] [PMC free article] [PubMed] [Google Scholar]
- Carroll RJ, Ruppert D. Transformation and Weighting in Regression (Chapman and Hall/CRC Monographs on Statistics and Applied Probability) 1 edn. London, UK: Chapman and Hall/CRC; 1988. [Google Scholar]
- Chen G, et al. Fast and flexible simulation of DNA sequence data. Genome Res. 2009;19:136–142. doi: 10.1101/gr.083634.108. [DOI] [PMC free article] [PubMed] [Google Scholar]
- Cheung V, Spielman R. Genetics of human gene expression: mapping DNA variants that influence gene expression. Nat. Rev. Genet. 2009;10:595–604. doi: 10.1038/nrg2630. [DOI] [PMC free article] [PubMed] [Google Scholar]
- Cookson W, et al. Mapping complex disease traits with global gene expression. Nat. Rev. Genet. 2009;10:184–194. doi: 10.1038/nrg2537. [DOI] [PMC free article] [PubMed] [Google Scholar]
- Dai M, et al. Evolving gene/transcript definitions significantly alter the interpretation of geneChip data. Nucleic Acids Res. 2005;33:e175. doi: 10.1093/nar/gni179. [DOI] [PMC free article] [PubMed] [Google Scholar]
- Dehan E, et al. Chromosomal aberrations and gene expression profiles in non-small cell lung cancer. Lung Cancer (Amsterdam, Netherlands) 2007;56:175–184. doi: 10.1016/j.lungcan.2006.12.010. [DOI] [PubMed] [Google Scholar]
- Denger J, et al. DNase 1 sensitivity QTLs are a major determinant of human expression variation. Nature. 2012;482:390–394. doi: 10.1038/nature10808. [DOI] [PMC free article] [PubMed] [Google Scholar]
- Devlin B, Roeder K. Genomic control for association studies. Biometrics. 1999;55:997–1004. doi: 10.1111/j.0006-341x.1999.00997.x. [DOI] [PubMed] [Google Scholar]
- Edgar R, et al. Gene expression omnibus: NCBI gene expression and hybridization array data repository. Nucleic Acids Res. 2002;30:207–210. doi: 10.1093/nar/30.1.207. [DOI] [PMC free article] [PubMed] [Google Scholar]
- Engelhardt B, Stephens M. Analysis of population structure: a unifying framework and novel methods based on sparse factor analysis. PLoS Genet. 2010;6:e1001117. doi: 10.1371/journal.pgen.1001117. [DOI] [PMC free article] [PubMed] [Google Scholar]
- Friguet C, et al. A factor model approach to multiple testing under dependence. J. Am. Stat. Assoc. 2009;104:1406–1415. [Google Scholar]
- Fusi N, et al. Joint modelling of confounding factors and prominent genetic regulators provides increased accuracy in genetical genomics studies. PLoS Comput. Biol. 2012;8:e1002330. doi: 10.1371/journal.pcbi.1002330. [DOI] [PMC free article] [PubMed] [Google Scholar]
- Harvey BG, et al. Modification of gene expression of the small airway epithelium in response to cigarette smoking. J. Mol. Med. 2007;85:39–53. doi: 10.1007/s00109-006-0103-z. [DOI] [PubMed] [Google Scholar]
- Kang HM, et al. Accurate discovery of expression quantitative trait loci under confounding from spurious and genuine regulatory hotspots. Genetics. 2008;180:1909–1925. doi: 10.1534/genetics.108.094201. [DOI] [PMC free article] [PubMed] [Google Scholar]
- Kang HM, et al. Variance component model to account for sample structure in genome-wide association studies. Nat. Genet. 2010;42:348–354. doi: 10.1038/ng.548. [DOI] [PMC free article] [PubMed] [Google Scholar]
- Leek J, et al. The sva package for removing batch effects and other unwanted variation in high-throughput experiments. Bioinformatics. 2012;28:882–883. doi: 10.1093/bioinformatics/bts034. [DOI] [PMC free article] [PubMed] [Google Scholar]
- Leek J, Storey J. Capturing heterogeneity in gene expression studies by surrogate variable analysis. PLoS Genet. 2007;3:e161–e1735. doi: 10.1371/journal.pgen.0030161. [DOI] [PMC free article] [PubMed] [Google Scholar]
- Listgarten J, et al. Correction for hidden confounders in the genetic analysis of gene expression. Proc. Natl Acad. Sci. USA. 2010;107:16465–16470. doi: 10.1073/pnas.1002425107. [DOI] [PMC free article] [PubMed] [Google Scholar]
- Michaelson J, et al. Detection and interpretation of expression quantitative trait loci (eQTL) Methods. 2009;48:265–276. doi: 10.1016/j.ymeth.2009.03.004. [DOI] [PubMed] [Google Scholar]
- Minczuk M, et al. TEFM (c17orf42) is necessary for transcription of human mtDNA. 2011;39:4284–4299. doi: 10.1093/nar/gkq1224. [DOI] [PMC free article] [PubMed] [Google Scholar]
- Montgomery S, Dermitzakis E. The resolution of the genetics of gene expression. Hum. Mol. Genet. 2009;18:R211–R215. doi: 10.1093/hmg/ddp400. [DOI] [PubMed] [Google Scholar]
- Nica A, Dermitzakis E. Using gene expression to investigate the genetic basis of complex disorders. Hum. Mol. Genet. 2008;17:R129–R134. doi: 10.1093/hmg/ddn285. [DOI] [PMC free article] [PubMed] [Google Scholar]
- Parts L, et al. Joint genetic analysis of gene expression data with inferred cellular phenotypes. PLoS Genet. 2011;7:e1001276. doi: 10.1371/journal.pgen.1001276. [DOI] [PMC free article] [PubMed] [Google Scholar]
- Price A, et al. Principal components analysis corrects for stratification in genome-wide association studies. Nat. Genet. 2006;38:904–909. doi: 10.1038/ng1847. [DOI] [PubMed] [Google Scholar]
- Raman T, et al. Quality control in microarray assessment of gene expression in human airway epithelium. BMC Genomics. 2009;10:493. doi: 10.1186/1471-2164-10-493. [DOI] [PMC free article] [PubMed] [Google Scholar]
- Shi Q, et al. Polymorphisms of methionine synthase and methionine synthase reductase and risk of lung cancer: a case-control analysis. Pharmacogenet. Genomics. 2005;15:547–555. doi: 10.1097/01.fpc.0000170916.96650.70. [DOI] [PubMed] [Google Scholar]
- Stegle O, et al. A Bayesian framework to account for complex non-genetic factors in gene expression levels greatly increases power in eQTL studies. PLoS Comput. Biol. 2010;6:e1000770. doi: 10.1371/journal.pcbi.1000770. [DOI] [PMC free article] [PubMed] [Google Scholar]
- Stegle O, et al. Using probabilistic estimation of expression residuals (peer) to obtain increased power and interpretability of gene expression analyses. Nat. Protoc. 2012;7:500–507. doi: 10.1038/nprot.2011.457. [DOI] [PMC free article] [PubMed] [Google Scholar]
- Wang Z, et al. RNA-seq: a revolutionary tool for transcriptomics. Nat. Rev. Genet. 2009;10:57–63. doi: 10.1038/nrg2484. [DOI] [PMC free article] [PubMed] [Google Scholar]
- Wu W, et al. Genetic variants in GTF2h1 and risk of lung cancer: a casecontrol analysis in a Chinese population. Lung Cancer. 2009;63:180–186. doi: 10.1016/j.lungcan.2008.05.014. [DOI] [PubMed] [Google Scholar]
- Yang C, et al. Accounting for non-genetic factors by low-rank representation and sparse regression for eQTL mapping. Bioinformatics. 2013;29:1026–1034. doi: 10.1093/bioinformatics/btt075. [DOI] [PMC free article] [PubMed] [Google Scholar]
- Zhang X, et al. Learning transcriptional regulatory relationships using sparse graphical models. PLoS One. 2012;7:e35762. doi: 10.1371/journal.pone.0035762. [DOI] [PMC free article] [PubMed] [Google Scholar]
Associated Data
This section collects any data citations, data availability statements, or supplementary materials included in this article.