


Abstract
In silico prediction of genomic long non-coding RNAs (lncRNAs) is prerequisite to the construction and elucidation of non-coding regulatory network. Chromatin modifications marked by chromatin regulators are important epigenetic features, which can be captured by prevailing high-throughput approaches such as ChIP sequencing. We demonstrate that the accuracy of lncRNA predictions can be greatly improved when incorporating high-throughput chromatin modifications over mouse embryonic stem differentiation toward adult Cerebellum by logistic regression with LASSO regularization. The discriminating features include H3K9me3, H3K27ac, H3K4me1, open reading frames and several repeat elements. Importantly, chromatin information is suggested to be complementary to genomic sequence information, highlighting the importance of an integrated model. Applying integrated model, we obtain a list of putative lncRNAs based on uncharacterized fragments from transcriptome assembly. We demonstrate that the putative lncRNAs have regulatory roles in vicinity of known gene loci by expression and Gene Ontology enrichment analysis. We also show that the lncRNA expression specificity can be efficiently modeled by the chromatin data with same developmental stage. The study not only supports the biological hypothesis that chromatin can regulate expression of tissue-specific or developmental stage-specific lncRNAs but also reveals the discriminating features between lncRNA and coding genes, which would guide further lncRNA identifications and characterizations.
INTRODUCTION
The ENCODE and related projects have revealed that the majority of eukaryotic transcripts are non-coding RNAs (1). Within the past few years, non-coding RNAs (ncRNAs) have attracted significant attention with regard to their unbelievably numerous biological roles, highlighting the biological significance of previously ‘overlooked’ RNA reservoir (2). Generally, long non-coding RNAs (lncRNAs) are ncRNAs that are longer than 200 nt and are typically expressed in a developmental stage-specific manner (2). Other criteria have also been used such as open reading frame (ORF) size <300 nt and high conservation for filtering interested lncRNAs (3,4). Most of lncRNAs have short ORFs based on conceptual translation and may not generate proteins (5). Similar to protein-coding genes, most lncRNAs are supposed to be transcribed by RNA polymerase II and have typical pre-mRNA-like structure including 5′ Cap and polyA+ tail. lncRNA species can be divided into distinct categories basically including intergenic, sense, antisense, intronic and bidirectional transcripts (6). Previously, lncRNAs were considered to be transcriptional noises and experimental artifacts (7). However, lncRNAs are involved in a plethora of cellular processes including trans-regulation of nearby protein-coding genes (8), imprinting control (9) and alternative splicing (10). For instance, HOTAIR, a HOX-associated lncRNA, which originates from the HOXC locus, can target PRC2 and silence the transcription of the HOXD locus in trans (11). Importantly, a few lncRNAs are involved in embryogenesis in vertebrates (12–15).
Computational approaches are widely used to identify non-coding genes in previous studies. These approaches typically identify non-coding genes that have short ORFs and lack homology to protein-coding genes (16). It is still difficult to distinguish lncRNA genes with long ORFs from long protein-coding genes. In addition, a large number of non-coding transcripts originate from protein-coding loci (17). To tackle the challenges, initial computational approaches based solely on genomic sequences are used to identify lncRNAs. ORF length (3), ORF conservation (18,19), structural approach (20) and artifact filtering (3,21) are the most common criteria used to distinguish lncRNAs from coding mRNAs (22). Machine-learning algorithms are one solution for non-coding RNA identification. Four recent representative tools, CPC (23), PORTRAIT (24), CONC (25) and iSeeRNA (26), use support vector machines to distinguish ncRNAs from coding mRNAs. These support vector machine-derived algorithms take multiple features such as peptide length, amino acid composition, sequence conservation and sequence alignment information into consideration, representing the pioneering methods for identifying lncRNAs from unknown genomic regions. Though successful in predicting structural RNAs (e.g. transfer RNA), these approaches do not perform well in non-structural lncRNAs, due partly to that non-structural RNAs are mRNA-like and less conserved among different species, which limits the applicability of sequence alignment information in lncRNA prediction. Recently, computational studies aiming at identifying non-structural lncRNAs are accumulating. In brief, they can be summarized by three strategies: cDNA sequencing-based filtering, chromatin modification mapping and RNA sequencing-based filtering. First, Boerner et al. (27) developed a computational pipeline for identifying lncRNAs from cDNA sequences. Though cDNA sequence is one source for locating lncRNAs in genome, the relatively higher costs hinder the extensive use. Second, Guttman et al. identified over 1000 putative lncRNAs in mouse genome based on H3K4me3 and H3K36me3 marks. Though successful, one potential limitation of their study is that lncRNAs are assumed to be regulated by same chromatin marks as protein-coding genes, which would underestimate the number of actual lncRNAs. Last, Sun et al. (28) proposed a computational tool for filtering lncRNAs from RNA sequencing (RNA-seq) data. Though RNA-seq-based transcriptome reconstruction is promising for de novo lncRNA identification, it suffers from sequencing precision and lagging algorithms for accurately building full-length transcripts due to low abundance of lncRNAs (29,30). However, the wide availability of RNA-seq data provides a basis for identifying a large number of potential tissue-specific lncRNAs that can be further filtered.
Though sequence-based methods achieve good performance against golden-standard sequence sets, it is not practical to derive tissue-specific expression information from them, making it inefficient to validate and analyze lncRNA function experimentally. Several studies have shown that chromatin modifications are helpful to increase genomic element prediction efficiency (31,32). lncRNAs rely on epigenetic mechanisms to regulate cell differentiation and organ development (33), but little is known about the roles of epigenetic modifications in lncRNA transcriptional regulation. Owing to the chromatin immunoprecipitation followed by massively parallel sequencing (ChIP-seq) technique, which has been widely used to investigate genome-wide chromatin modifications in mammalian genomes (34,35), we are provided an opportunity to understand on a genome-wide scale how lncRNAs are regulated in a cell-type-specific manner based on tissue-specific or developmental stage-specific RNA-seq data and ChIP-seq data. Importantly, little is known about the chromatin modification and genomic features discriminating lncRNAs from protein-coding genes, which emphasizes the necessity to integrate chromatin features in different developmental stages and genomic information in a machine-learning model and evaluate their importance for distinguishing lncRNAs from protein-coding genes.
To this end, we use 22 publicly available high-throughput mouse ChIP-seq data sets involving three developmental stages as well as 19 genomic features to identify features that discriminate lncRNAs from protein-coding genes. We use logistic regression with LASSO regularization to identify discriminating lncRNA signatures, evaluate model performance based on known gene annotations and finally predict lncRNAs from transcriptome-assembled transcribed fragments (transfrags). Logistic regression model, one of the most famous machine learning models, can integrate a large number of features and identify discriminating features/markers, which would tackle the potential problem that each single feature may not be completely representative of lncRNAs. For example, although sequence conservation is usually used to identify regulatory non-coding genes, the degree of variation of conservation involving lncRNAs makes that high conservation feature can depict only a small subset of development related lncRNAs (36). Through the trained model, we evaluate the usefulness of chromatin modification and genomic features for lncRNA prediction. Specifically, LASSO regularization ranks the predictability of features for lncRNA classification with three transposable elements being the most predictive features followed by two enhancer-related histone modification marks H3K9me3 and H3K27ac in gene exons. In addition, the comparison of performance of model using chromatin information and/or sequence information implies the ability of the integrated model to identify lncRNAs involved in embryonic development. Though chromatin modification features yield the performance comparable with genomic features, the model integrating both types of information performs even better against the model with only one type. The lncRNA expression specificity is contributed mostly by the chromatin modification features from same developmental stage, suggesting the trained integrated model is capable of predicting tissue-specific lncRNAs. A large pool of putative lncRNAs that exhibit comparable genomic property and chromatin profile with known lncRNAs is predicted from RNA-seq data. Furthermore, the coexpression of putative lncRNAs with nearby genes and enrichment in close to genes associated with neuron differentiation and transcriptional regulation functions suggest the potential regulatory functionality of lncRNAs.
MATERIALS AND METHODS
The model construction, graphs and statistical analyses were done in R (http://www.r-project.org) and Bioconductor (www.bioconductor.org) unless otherwise stated.
Genomic features and chromatin data sets
The chromatin modification data were taken from the mouse ENCODE project (35). Twenty-two publicly available chromatin ChIP-seq raw data in mouse embryonic stem (ES) cell, Embryonic day 14.5 (E14.5) embryonic brain and adult 8-week Cerebellum (CB) were downloaded from Sequence Read Archive (37) including the following chromatin modifications: CCCTC-binding Factor (CTCF), polymerase II (PolII), H3K4me1, H3K4me3, H3K9me3, H3K27ac, H3K27me3 and H3K36me3 (Table 1), in addition to Input. CpG islands information predicted by CpG_MI was obtained from Su et al. (38). Other genomic features including Phastcons most conserved regions and repeat elements were downloaded from UCSC (mouse mm9 build) (39). ORF-related features including ORF_proportion (ratio of ORF to transcript length) and ORF_length were calculated by txCdsPredict provided by UCSC. PhastCons most conserved regions and nucleotide sequences-based features were calculated by iSeeRNA program suite (26).
Table 1.
The details of 227 features used in the integrated model
| Features | Cell line | Tissue/cell type | Accession | Feature number | Data type |
|---|---|---|---|---|---|
| Histone modifications (H3K4me1, H3K4me3, H3K9me3, H3K36me3, H3K27ac, H3K27me3), PolII and CTCF | E14 | ES | GSE31039 | 8, each with 7 subfeatures, summing up to 56 features | ChIP-seq |
| Histone modifications (H3K4me1, H3K4me3, H3K9me3, H3K36me3, H3K27ac, H3K27me3), PolII and CTCF | E14.5 whole brain | GSE31039 | 8, each with 7 subfeatures, summing up to 56 features | ChIP-seq | |
| Histone modifications (H3K4me1, H3K4me3, H3K27ac, H3K27me3), PolII and CTCF | 8 week CB | GSE31039 | 6, each with 7 subfeatures, summing up to 42 features | ChIP-seq | |
| Repeat elements and CpG islands | UCSC mm9 | 9, each with 7 subfeatures, summing up to 63 features | Bed format | ||
| PhastCons most conserved regions, ORF and nucleotide sequences-based features | UCSC mm9 | 1 conservation feature, 2 ORF features, 7 nucleotide sequences-based features, summing up to 10 features | BED format |
Columns represent the feature names, the cell lines of mouse ES cell used (cell Line), the tissue/cell type of the data (tissue/cell type), the NCBI GEO accession number (Accession), feature number and the data type.
Known lncRNAs for model training and testing
RefSeq was generated by both automated and curated approaches to provide an up-to-date representation of gene sequences (40). Here, we used the lncRNA and long protein-coding genes from RefSeq for model training because the annotation typically had support by experimental validation. In RefSeq, annotated lncRNAs are considered unlikely to be protein-coding for several reasons, including non-sense-mediated decay, truncated ORFs and alternate splice variants with significant ORF truncation. In addition, RefSeq lncRNA annotations were also incorporated in the Havana and Ensembl gene building processes.
We used Ensembl (41) transcripts for validating the proposed integrated model. The Ensembl lncRNA annotation was based on cDNA alignments and was guided by chromatin modifications (H3K4me3 and H3K36me3). Specifically, cDNAs with H3K4me3 and H3K36me3 overlap were identified, followed by protein-coding potential filtering. The procedure was similar to that performed by Guttman et al. (4). The candidate lncRNAs with maximum ORF covering >35% of its length and with PFAM/tigrfam protein domains were not considered as non-coding genes in Ensembl annotation. Other than electronic annotation, the Ensembl annotation also included Havana manual annotation, suggesting that it was a reliable non-coding and coding annotation source.
Sequencing data pre-processing
Raw chromatin modification data (FASTQ format) were aligned to the mouse genome (mm9) by BWA software (v0.6.2) while suppressing alignments with >2 mismatches within a read. The aligned data were then normalized by a fixed read number (25 000 000). Exact duplicate tags were removed from each ChIP-seq data set to avoid PCR amplification biases introduced in the sequencing library preparation processes. Visual inspection suggested that the baseline read numbers were generally comparable for all normalized chromatin modification data, diminishing differences between different data. The aligned sequencing data were processed by MACS (42) to produce enriched chromatin domains.
In lncRNA expression specificity analysis and the relationships with nearby gene analysis, we also used RNA-seq data of the same developmental stages with ChIP-seq data, making it suitable for model construction and testing. Raw paired end RNA-seq FASTQ data were downloaded from GEO with the accession number GSE20851 for ES cell and GSE36025 for E14.5 embryonic brain and adult 8-week CB (43). Raw RNA-seq data were aligned to the mouse genome (mm9) by TopHat software (44), followed by gene expression quantification according to a widely accepted protocol (45). The expression levels of transcripts were quantified by Fragments Per Kilobase of transcript per Million mapped reads (45).
To obtain assembled non-coding transcriptome data sets for genome-wide lncRNA predictions, we removed the reads mapped on RefSeq and Ensembl genes. Further filtering included the removal of transfrags with short length (<400 nt), lower expression (Fragments per kilobase of transcript per million mapped reads < 0.1), coding potential CPC score less than −1 by CPC (23), long ORFs with length >600 nt (26). The remaining transfrags were predicted by our trained feature-selected model. The resulting putative lncRNAs for three developmental stages were listed in Supplementary Table S1.
Feature calculation
The genomic (only repeat elements and CpG islands) and chromatin features of known and predicted transcripts were quantified for the following seven categories respectively: Transcription Start Sites (TSSs) upstream 3k, promoter (TSS until end of first exon), 1st third, 2nd third and 3rd third of gene body excluding 1st exon, respectively, exons in together and lastly Transcription End Sites downstream 3k. For transcripts with only one exon, the promoter was defined as 20% of gene length downstream of TSSs. The lncRNA body was defined as the gene body without first exon. The rule makes seven subfeatures to be modeled for each feature (except 10 sequence features), summing up to 227 features (Table 1). The full data for all features including subfeature information are in Supplementary Table S2. The general naming conventions of the subfeatures are tissue_feature_region, where region represents one of 3000bp_u _TSS, 3000bp_d _TSS, 1_3 _gene, 2_3 _gene, 3_3 _gene, exons and 3000bp_d_TTS, corresponding to the aforementioned feature categories, respectively. The subfeature calculations were done by writing custom JAVA scripts. The feature values for all genes used in the training and testing model were given in Supplementary Table S2.
Selection of potential sequence features is one of the most important steps before modeling. We referred to Sun et al.'s article (26) to select 10 effective sequence features that are listed in Table 1. In addition, the feature space of di- or tri-nucleotide sequence features is large, and these features are highly inter-correlated, which would decrease the performance of integrated model. We only used GC, CT, TAG, TGT, ACG and TCG in our model, which were shown to contribute mostly to the prediction performance (26). Though other features such as those based on homolog search were often used for non-coding RNA classification, they were highly correlated with the conservation and did not improve model performance (26). In addition, CpG island feature was used here because many intergenic CpG islands were associated with non-coding RNAs (46). Repeat elements were also reckoned to regulate lncRNA evolution (47), which were also included in our model.
The gene expression specificity based on three developmental stages was used for analyzing lncRNA expression specificity-related chromatin and genomic features. We used QDMR software (48) to calculate expression specificity. Transcripts without developmental stage-specific expression fell into no specificity category.
Feature selection by LASSO regularized logistic regression
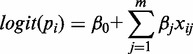
Standardization that can avoid shrinkage of feature weights was performed by subtracting the mean and dividing by the standard deviation for all features in integrated model. A binomial logistic regression was used to model sequence and chromatin features and then predict putative lncRNAs from transcriptomic data in ES cell, E14.5 brain and adult CB. Let yi = 0 or 1 to represent lncRNA or protein-coding gene. Define y = [y1, y2, …, yn]T as the binary class label for all n genes. The probability of yi = 1 is given by pi = Pr(yi = 1), i = 1, …, n. The logistic regression model is defined by:
 |
(1) |
where β is the regression coefficient of variable x, which indicates how well each feature explains the difference of lncRNA and protein-coding genes. The logit(pi) is defined by:
| (2) |
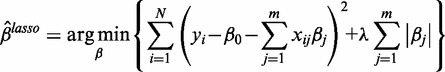
To select efficient features, we used LASSO regularization that introduces an additional penalty with a power raised on the weight vector (49). Using LASSO regularization, feature weights of less significance would shrink to 0 as lambda increases.
The LASSO estimate of β is determined by
 |
(3) |
For the unbalanced size of RefSeq protein-coding and lncRNA genes, we split the coding genes into 10 parts, each of which together with all lncRNAs constituted a data set, respectively. Based on the lambdas that minimized the Mean Squared Error from cross-validation for each of the 10 data sets, we obtained a feature selected model for each data set, respectively.
Model evaluation
The model assessment measures included Area Under Curve (AUC) under Receiver Operating Characteristic (ROC) curves, Precision and Recall in 10-fold cross-validation. The performance was averaged for 10 data sets. We calculated averaged AUC, Precision and Recall values for lncRNA and protein-coding gene predictions. We defined False Negative (FN) as the number of lncRNAs that were classified as coding RNAs in our predictions. The Positive Predictive Value (PPV), specificity and sensitivity were given as TP/(TP + FP), TN/(FP + TN) and TP/(TP + FN), respectively.
Gene Set Enrichment to elucidate lncRNA functions
Gene Set Enrichment was done to explore lncRNA regulatory functions. Briefly, we explored the function of genes closest to putative lncRNAs and systematically performed Gene Ontology (GO) gene function enrichment of these genes using the DAVID system (50) followed by clustering of functions with significant numbers of shared genes using Enrichment map (51). Only Biological Process branches were involved in GO enrichment.
RESULTS
Specific features can discriminate long non-coding genes from coding genes
To discriminate 24 761 long coding and 2383 long non-coding RefSeq gene regions, we used mouse ChIP-seq data sets in three developmental stages: (1) ES cells; (2) E14.5 brain and (3) CB, involving seven histone modifications, one polymerase occupancy and one chromatin-associated protein (Table 1). In addition to these ChIP-seq data sets, genomic features including CpG islands, ORFs, repeat regions and PhastCons most conserved regions were also incorporated in our model. Chromatin features were tissue specific, which implied that the model can be applicable to other cell/tissue contexts to predict other tissue-specific lncRNAs. Besides for model training, all of these data sets were also used for model validation and prediction purposes. Because of the unbalanced size of coding and lncRNA genes, the coding genes were randomly drawn into 10 gene sets with the whole lncRNA genes and 10 non-overlapping coding gene sets of equal size.
In our initial binomial model, we classified the training genes into two categories: coding and lncRNA genes. The regions of gene body plus 3-kb extended from transcript ends were split into seven parts (refer to ‘Materials and Methods’ section). Logistic regression model assumes that each feature contributes independently to the overall performance. However, the trained model would be biased if some features are partially or fully redundant. For example, some histone modifications like H3K4me1, H3K4me2 and H3K4me3 are likely to colocalize specific regions, making some features have no or little additional predictive power. To tackle this, we used a LASSO regularized binomial logistic regression model to evaluate features, by which we can rank the contributions of features to the classification of lncRNA and coding genes. LASSO regularization can shrink feature weights by introducing a lambda penalty factor to filter out uninformative or redundant features. Top ranking features (non-zero weights and occurring at least in 7 of the 10 models) with respect to specific log lambda values for 10 training models were kept to build the feature selected model, whereas the feature weights with respect to log lambda were shown in Figure 1. As increasing the penalty parameter lambda, we observed that the weights of less informative features shrink to zero, whereas weights of informative features keep above-zero. By LASSO regularization, the most positively predictive features for coding genes under the log lambda values determined by cross-validation were ORF_proportion and ORF_length, which have been widely used for coding gene prediction in documented studies. It was not unexpected because long ORF is less likely to be observed in non-coding RNA sequences. H3K4me3_3000bp_d_TSS (promoter) in ES and CB ranked third and fourth, respectively. H3K4me3 was previously shown to associate with active gene expression around TSSs (52), which is consistent with that lncRNAs are generally lowly expressed. Surprisingly, features that best categorized lncRNA genes were three repeat elements, followed by ES_H3K9me3_exons and E14_H3K27ac_exons, in agreement with lncRNA characteristics. Only one stage of the two chromatin modification data was selected by the model, which was reasoned by the average concatenated exon profiles generated by CEAS software (53) in Supplementary Figure S1. From Supplementary Figure S1A and C, we observed that H3K9me3 is more enriched in exon in ES cell than E14 brain, whereas H3K27ac is more enriched in exon in E14 brain than ES cell (Supplementary Figure S1B, D and E).
Figure 1.
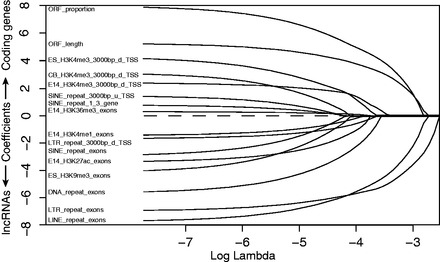
Selected informative features determined by the strict threshold using binomial logistic regression with LASSO regularization. Feature weights in predicting lncRNAs are with respect to log lambda, a penalty to shrink feature weights in the regression model. Weights of features with less discriminative power of the lncRNAs and protein-coding genes shrink to 0 as lambda is increasing. Informative features are those with above-zero weights based on lambda value determined by cross-validation.
After comparing 10-fold cross-validation results, we found that the performance of integrated model decreased slightly after feature selection. AUC, Precision and Recall were used to assess models (refer to ‘Materials and Methods’ section), using 10-fold cross-validation (Table 2). Though chromatin data only model achieved relatively worse performance, integrated model with chromatin information improved the lncRNA prediction. The logit of the full feature selected model was given as follows:
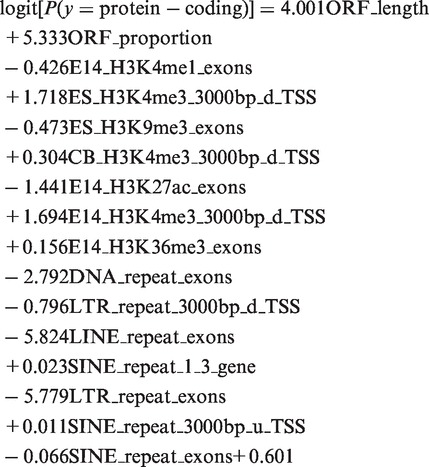 |
(4) |
In our model, the size of bin upstream and downstream of two categories of genes that was used for feature quantification was arbitrarily defined as 3 kb. However, the bin size may not be optimal, as the chromatin signals are expected to span thousands of genomic base pairs. A short bin size may only capture part of chromatin signatures, whereas a large bin size may include non-informative regions, which may degrade the model performance. To better characterize signatures of lncRNA and coding genes, the efficient bin size out of gene body should be optimized, as no explicit bin size was proved best previously. After conducting independent experiments on eight bin sizes (1, 2, 3, 4, 5, 6, 8, 10 kb), we found the performance of cross-validations for the full feature model was best at 3 kb, though 3, 4 and 5 kb have comparably high performances (Supplementary Figure S2A).
Table 2.
Comparison of average performance of 10-fold cross-validation in RefSeq lncRNA and protein-coding gene predictions using all features, chromatin data only, sequence only and feature selected features
| Used features | AUC | Precision | Recall |
|---|---|---|---|
| All features | 0.927 | 0.857 | 0.857 |
| All chromatin features | 0.827 | 0.760 | 0.759 |
| All sequence features | 0.876 | 0.797 | 0.796 |
| Feature selected features | 0.882 | 0.833 | 0.832 |
The comparisons include the AUC under ROC curves, precision and recall values.
The gene body was partitioned into three parts (k = 3), as discretization into three parts is an usual strategy. To evaluate whether the partition was most effective for our model, we also explored other k values for partitioning. As a result, a partition with k = 2 yielded a moderate result, whereas partitions with k = 5 and k = 6 yielded extremely poor results (Supplementary Figure S2B). The partitions with k = 3 and k = 4 generated comparable cross-validation performance. To make our model simple, we preferred to use a partition with k = 3.
The use of loose thresholds for adding more features does not significantly improve the performance of the integrated model
We only kept overrepresented features with common occurrence >6, which was termed as the strict threshold for 10 training models. One would speculate that a model can achieve even better performance with additional feature inclusion. To defy this, we reconstructed three feature-selected models with loose thresholds of 6, 5 and 4 common features in 10 models, respectively. For the integrated model with more features benefited by loose thresholds while keeping other settings unchanged, we observed minor performance increments in the lncRNA and coding gene predictions (Supplementary Figure S3A). For example, the integrated model achieved a precision of 0.803 using the strict threshold, whereas the precision smoothly increased to 0.813 with a looser threshold of 4/10. Such a minor increase of performance suggested that feature selection with a stricter threshold was suitable to perform a genome-wide prediction, with respect to both time and result robustness.
We were also interested whether removal of any one, two or more features from the feature selected integrated model at the strict threshold would harm the model performance. For the feature-selected integrated model, when removal of any one feature, two features or three features, while keeping other settings unchanged, on average, we observed only a weak reduction of the model performance for only one feature removal (Supplementary Figure S3B), whereas the performance was worse when more features were removed. The result further suggested the efficiency of feature selection and the robustness of the proposed feature selected integrated model.
Independent gene set testing shows that the integrated model including chromatin data identifies lncRNAs more accurately than sequence only model
Having the data set of known Ensembl lncRNA and protein-coding genes without training, we conducted model performance testing with the strict threshold, which was shown to be effective compared with other thresholds. It was tempting to evaluate our models without sequence features together with a sequence only model because it was unclear if chromatin data could significantly improve lncRNA prediction power. A set of 6578 Ensembl lncRNA genes without overlapping any RefSeq genes were used as the lncRNA positive testing set for evaluation. In contrast, a set of 1495 protein-coding genes without overlapping any RefSeq genes were used as the negative testing set. The testing set is an unbalanced data set, the size ratio of lncRNAs versus coding genes is ∼4.4. A more proportion of lncRNAs in testing set mimicked the situation where most unannotated transfrags in assembled transcriptome data were expected to be non-coding fragments. Ten independent tests for 10 training models were performed, respectively. The averaged results were shown in Table 3. From Table 3, the chromatin data only model and the sequence only model achieved a comparable accuracy on predicting lncRNAs (average PPV = 86.0% using chromatin data only features versus 87.2% using sequence only features). It was not surprising that the chromatin data only model did not outperform the sequence only model because chromatin modification data from only limited tissues/cell types were included in integrated model, and the performance may be better if more marks and more data from other tissues/cell types could be added. The integrated model with selected features achieved a better PPV, suggesting the usefulness of feature selection. Taken together, the sequence and chromatin information were somewhat complementary, though the sensitivity of chromatin data only model was inferior to that of the sequence only model.
Table 3.
Comparison of averaged performance of testing validation for Ensembl lncRNA and protein-coding genes without overlapping any RefSeq genes using selected features, chromatin data only and sequence only features
| Used features | Sensitivity | Specificity | PPV |
|---|---|---|---|
| All chromatin features | 0.706 | 0.649 | 86.0% |
| All sequence features | 0.764 | 0.657 | 87.2% |
| Feature selected features | 0.753 | 0.823 | 92.8% |
The comparisons include the sensitivity, specificity and PPV.
Though more effective sequence features would help identify lncRNAs in theory, it seemed that features involving ORF were most useful, which were considered irreplaceable by chromatin data. Therefore, an integrated model incorporating both effective chromatin information and genomic sequence information could help identify potential lncRNAs in a more effective manner.
lncRNA prediction based on transfrags of uncharacterized genomic regions by integrated model
We then applied our feature selected integrated model to predict lncRNAs from transfrag sets de novo assembled from RNA-seq data of same developmental stages with chromatin ChIP-seq data. After pre-processing of RNA-seq data (details refer to ‘Materials and Methods’ section), only unannotated intergenic transcripts were kept to be predicted by our model. Furthermore, potential coding transcripts were filtered out by the CPC program, which used six features of putative ORFs to distinguish protein-coding from non-coding genes. In summary, we obtained 19 246, 17 230 and 2688 lncRNAs in E14.5 brain, CB and ES cell, respectively. About 80% of these were developmental stage-specific lncRNAs.
lncRNAs were short, non-conserved and lowly expressed, compared with protein-coding genes in previous studies (4,54,55). To explore whether the putative lncRNAs filtered here also had similar genomic characteristics, we analyzed the gene structure, conservation level and ORF length of developmental stage-specific putative lncRNAs of three tissue/cell types (Figure 2). We found that the length of predicted putative lncRNAs was on average a half of that of known protein-coding transcripts (mean length of 1549 nt for lncRNAs versus 2676 nt for coding transcripts) (Figure 2A). Though shorter than known protein-coding transcripts, the putative lncRNAs were comparable with known RefSeq lncRNAs in length (1549 nt for lncRNAs versus 1899 nt for known lncRNAs). Moreover, lncRNAs had fewer exons per transcript (∼1.5) than protein-coding gene (∼11.2), even fewer than known lncRNA transcripts (∼5.2) (Figure 2B). Though the less number of exons might be an underestimation of the actual size of putative lncRNAs due to potentially incomplete assembly of lowly expressed transcripts, much evidence suggested many lncRNAs were tended to be unspliced, compared with protein-coding genes (56). In supporting this, the gene transcriptional rates were considered to be positively associated with splicing machinery (57). Consistent with prior studies (17,55), the putative lncRNAs were less conserved than known coding transcripts (Figure 2C). Notably, the putative lncRNAs were associated with shorter ORFs than known protein-coding transcripts (mean length of 162.8 nt for lncRNAs versus 1747.0 nt for coding transcripts) (Figure 2D), while comparable with known lncRNAs (384.9 nt for known lncRNAs).
Figure 2.
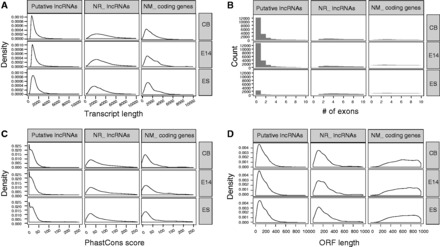
The genomic property of putative lncRNAs with developmental stage specificity, compared with known lncRNAs and protein-coding genes with developmental stage specificity. (A) Putative lncRNAs display shorter transcript length than that of known lncRNAs and known protein-coding genes. (B) Putative lncRNAs display fewer number of exons than that of known lncRNAs and known protein-coding genes. (C) Putative lncRNAs display lower PhastCons conservation scores than that of known lncRNAs and known protein-coding genes. (D) Putative lncRNAs display comparable ORF length with that of known lncRNAs and shorter ORF length than that of known protein-coding genes.
Previous studies have implicated lncRNAs as potential products of enhancer functions. It has been suggested that enhancer elements can produce short transcripts called enhancer RNAs (58). Enhancer RNAs may be related to lncRNAs because both of enhancers and lncRNAs are highly tissue/developmental stage-specific in gene expression. For enhancer marks were associated with lncRNAs based on feature selection, we were interested in whether putative lncRNAs were associated with enhancer related chromatin marks. H3K27ac is known as an active enhancer mark, which is more useful for testing enhancer than H3K4me1 that marks both active and poised enhancer (59). To estimate the proportion of enhancer associated putative lncRNAs, we intersected gene body and promoter of putative lncRNAs at three developmental stages with H3K27ac enriched domains of matched stage, respectively. We observed that ∼20% of promoters of predicted lncRNAs in E14 and CB and ∼10% of promoters of predicted lncRNAs in E14 brain were associated with H3K27ac enriched domain (Supplementary Figure S4). In addition, ∼50% of lncRNA body of predicted lncRNAs (exons excluding first exon, the same for following results) were associated with H3K27ac (Supplementary Figure S4). Taken together, a large proportion of lncRNAs seemed to be regulated by enhancer marks, whereas only a small proportion (∼20%) of lncRNAs may be enhancer products. If only common lncRNAs expressed in the two developmental stages were considered, the proportion of association with the mark is low (∼4% for promoter and ∼13% for body, detailed data not shown), which could be reasoned that lncRNAs were precisely and specifically regulated by this enhancer mark.
As an example of enhancer mark regulated lncRNAs, we showed in Figure 3 that four lncRNAs in an imprinting cluster between Dlk1 and Meg3 were candidates associated with enhancer, which were supported by histone modification patterns (H3K27ac and H3K4me1) and available literature (Figure 3). Only basal levels of H3K4me3 and PolII were observed, in contrast to the enrichment of two enhancer marks H3K27ac and H3K4me1 in the cluster of putative lncRNAs. Court et al. used 3C-qPCR approach to study the chromatin dynamics and long-range cis-interactions for several genomic regions. Based on their data, we found that these lncRNAs were in close to the contact loci with other chromosomes (60). Put together, the lncRNAs we found were reckoned to have roles in chromatin dynamics over large genomic distances even other chromosomes. As another example, we also found an lncRNA located ∼8 kb downstream of Zfp386 and ∼4 kb upstream of Vipr2, as shown in Supplementary Figure S5.
Figure 3.
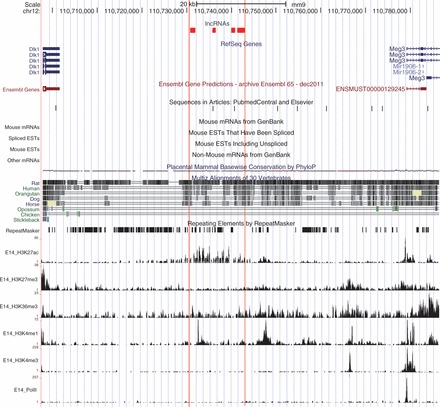
Novel putative enhancer related lncRNAs located between Dlk1 and Meg3 in mouse genome, which are supported by histone modification patterns and known literature. These lncRNAs are ∼35 kb downstream of Dlk1 and ∼40 kb upstream of Meg3. Coverage plots of several histone modification ChIP-seq data in E14.5 brain are shown at the bottom. Data for each chromatin modification are shown as a ‘wiggle’ track of extended reads. Other genomic annotations derived from the UCSC Genome Browser database are also shown with the direction of transcription indicated by arrows. The visualization is based on a local mirror of the UCSC Genome Browser. Chromosome coordinates (mm9) are shown on top of this figure.
We then examined the reliability of lncRNA predictions by evaluating whether predicted lncRNA regions were supported by PolII occupancy and Cap Analysis of Gene Expression (CAGE) clusters. First, we analyzed the predicted developmental stage-specific lncRNAs by stage-matched PolII ChIP-seq data. RNA polymerase II binds the promoters of virtually all known protein-coding and non-coding genes (61,62). Though PolII feature was used to build the training model, it was not included in the feature selected model, consistent with its role as a general gene transcription indicator. The PolII distributions aligned by the putative lncRNAs in E14.5 brain were shown in Figure 4A and B. The distributions in other tissues/cell lines were shown in Supplementary Figures S6 and S7. As expected, we found a peak at the vicinity of TSSs in E14.5 brain, CB and ES cell, respectively (Figure 4A, Supplementary Figures S6A and S7A). Quantitatively, ∼50% of promoters (TSS upstream 3k until end of first exon) of predicted lncRNAs were associated with PolII (Supplementary Figure S8A). Altogether, the PolII patterns were consistent with known distribution of PolII (63). The lncRNA body was significantly enriched with PolII signals over basal levels (Figure 4B, Supplementary Figures S6B and S7B). Approximately 40% of lncRNA body of predicted lncRNAs was associated with PolII (Supplementary Figure S8B). It has been known that genes with low expression have more tendency of PolII distribution toward TSSs and less in gene body compared with genes with high expression (64), which implied that most lncRNAs we identified were lowly expressed exclusively in specific stages, considering the stage of PolII ChIP-seq data was exactly matched with that of predicted stage-specific lncRNAs in this analysis.
Figure 4.
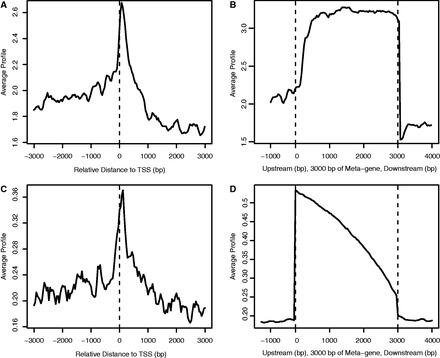
The average profile of PolII ChIP-seq tags and CAGE tags around TSS and within gene body for stage-specific lncRNAs in E14.5 brain. (A) The TSS of lncRNAs is enriched with PolII tags over basal levels, where PolII density is aligned around TSS with ± 3000 bp extensions. The average signal represents the average number of reads per 100-bp interval. (B) The gene body of lncRNAs normalized by length of 3000 bp with 1000-bp extension from TSS toward upstream and TTS toward downstream is enriched with PolII tags over basal levels. (C) The TSS of lncRNAs is enriched with CAGE tags over basal levels, where CAGE tag density is aligned around TSS with ± 3000-bp extensions. (D) The gene body of lncRNAs normalized by length of 3000 bp with 1000-bp extension from TSS toward upstream and TTS toward downstream is enriched with CAGE tags over basal levels. The size of the gene body of all lncRNAs is scaled to 3000 bp for comparison (Meta-gene defined by the CEAS package).
CAGE was developed to map promoters, and we were interested whether the predicted lncRNA promoters were supported by CAGE tags, which would add extra evidence for supporting our predictions. The basic assumption of the evaluation was that the larger the number of CAGE tags overlapped with the predicted lncRNA promoters, the more confident the predictions were. Though only one CAGE tag was needed to map a promoter, lncRNAs would be reliable by multiple tags, due to the potential noise of CAGE, which would be better to be demonstrated in the similar manner with that of PolII. The CAGE data used here were taken from the FANTOM4 project with over 20 tissues/cell lines including brain tissues (65). Analogous to PolII profile, we also found a peak at the vicinity of TSSs in E14, CB and ES cell, respectively (Figure 4C, Supplementary Figures S6C and S7C). Quantitatively, >80% of promoters of predicted lncRNAs were associated with CAGE tags (Supplementary Figure S8C). No enrichment of CAGE tags in gene body was consistent with the fact that CAGE was developed to map TSSs rather than other genomic regions (Figure 4D, Supplementary Figure S6D and S7D). In contrast, ∼60% of lncRNA body of predicted lncRNAs was associated with CAGE tags (Supplementary Figure S8D). Altogether, the evaluation of putative lncRNAs by PolII occupancy and CAGE data suggested that the integrated model was powerful for identifying developmental stage-specific lncRNAs.
lncRNAs are coexpressed with nearby genes and are associated with differentiation and development
To explore the regulatory roles of the predicted lncRNA candidates, we assigned developmental stage-specific lncRNA candidates to their closest genes and compared the gene expression changes of lncRNAs and their closest genes during development, as previous studies raised a hypothesis that the regulation of lncRNAs on nearby protein-coding genes was a possible regulatory mechanism (Figure 5A), and almost 40% of GENCODE v7 lncRNAs were estimated to flank protein-coding gene loci (17). We showed the distance distributions between lncRNAs and nearby protein-coding genes in Supplementary Figure S9, where most of E14.5 brain-specific lncRNAs (∼71.5%) had gene neighbors within 100 kb and ∼18.3% within 10 kb. Similarly, ∼78.5% of CB-specific lncRNAs had gene neighbors within 100 kb and ∼19.9% had within 10 kb. The detailed distance information for lncRNAs and neighboring genes was available in Supplementary Table S3. An lncRNA candidate may be difficult to be assigned to one specific nearby gene, as lncRNAs were often located in intergenic deserts and even may not regulate closest genes in a linear genome. Here, we preferred to keep lncRNAs with closest genes <500 kb, and we also discarded lncRNAs with closest genes <5 kb to avoid potential untranslated region extensions from known genes. We were interested in the expression changes of the closest genes to tissue-specific lncRNAs (10 013 CB-specific lncRNAs, 12 029 E14.5 brain-specific lncRNAs and 7217 common lncRNAs) during development. The expression data we used were stage matched with chromatin modification data in ES, E14.5 brain and CB, respectively. Here, an lncRNA or nearby protein-coding gene was defined as upregulated if the expression in E14.5 brain is <50% of that in CB, whereas it was downregulated if the expression in E14.5 brain is >2-fold of that in CB. In Figure 5B, most (71%) of closest genes of CB-specific lncRNAs were upregulated in CB, and most (75%) of closest genes of E14.5-specific lncRNAs were downregulated in CB, consistent with the proposed hypothesis. In contrast, neighboring lncRNAs expressed both in E14.5 or CB were not tended to have such a pattern (Figure 5C). In addition, 36% of closest genes of common lncRNAs expressed in all developmental stages were upregulated or downregulated (data not shown). These findings suggested that the putative lncRNA candidates regulated transcription of nearby genes in brain development, in contrast to common lncRNAs and neighboring lncRNA–lncRNA pairs. The coexpression of lncRNAs and neighboring coding genes was supposed to be regulated by chromatin modifications, as the genomic information remained constant for all developmental stages.
Figure 5.
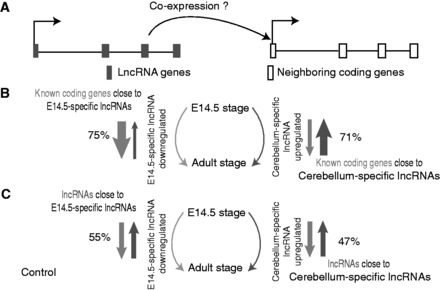
Developmental stage-specific lncRNAs are positively associated with neighboring protein-coding genes with regard to gene expression level. (A) A hypothetical model is proposed, assuming stage-specific lncRNAs can regulate neighboring protein-coding genes and therefore have a positive coexpression relationship. (B) We analyze the known protein-coding gene expression changes from E14.5 brain to CB and find that 75% of protein-coding genes closest to the E14.5-specific lncRNAs are downregulated, whereas 71% of protein-coding genes closest to the CB-specific lncRNAs are upregulated. (C) We analyze the expression changes from E14.5 brain to CB for neighboring lncRNA–lncRNA pairs as a control and found that 55% of neighboring lncRNAs around the E14.5-specific lncRNAs are downregulated, whereas 47% of neighboring lncRNAs around the CB-specific lncRNAs are upregulated.
To further testify the regulatory roles of lncRNAs in mouse brain development, we performed GO function enrichment for the genes closest to lncRNAs using the DAVID system (50) followed by clustering of resulting function terms with significant numbers of shared genes using Enrichment map (51). Nearest coding genes of the E14.5 brain-specific lncRNAs were significantly enriched in GO terms such as neuron differentiation and cell morphogenesis involved in differentiation and axonogenesis (FDR = 6.2 × 10⁻¹³ and 1.9 × 10⁻⁹, respectively) (Figure 6) and included many genes involved in brain functional regulation: Bdnf, Dbx1, Alkbh1, Neurod2 and Nrcam, suggesting lncRNAs were potentially associated with embryonic brain development. Although in adult CB, there were only eight enriched terms (q-value < 0.021), which were related to neuron differentiation, transcriptional regulation and synaptic transmission (Figure 7). This result indicated that embryonic brain continued to develop, and neuron differentiation did not finish even after mouse birth, compared with adult mouse brain. Although for common lncRNAs, there were only three enriched GO terms (FDR < 0.001), less than that in E14.5 brain (41 terms) and in CB (five terms). The full enriched GO terms for E14.5 brain-specific lncRNAs, CB-specific lncRNAs and common lncRNAs were listed in Supplementary Table S4. Taken together, the assumed links between lncRNAs and functional genes in brain development sounded reasonable, which also suggested the regulatory roles of putative lncRNAs in stage-specific brain development.
Figure 6.
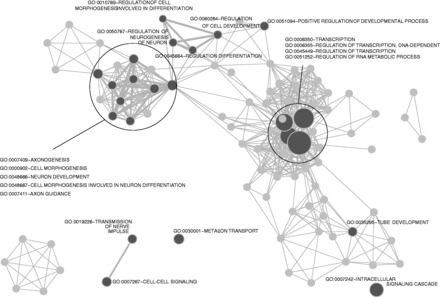
GO enrichment analysis of genes close to developmental stage-specific lncRNAs in E14.5 brain. The GO enrichment is done from DAVID (FDR < 0.01) and is followed by clustering of resulting function terms with significant numbers of shared genes using Enrichment map. Dense gene functions are surrounded by circles with function terms labeled aside. Line thickness between connected nodes is proportional to gene numbers shared between terms. Twenty-three terms indicated by dark gray are enriched by q < 0.021 filtering. Many terms are related to Brain development, Neuron differentiation and Transcriptional regulation.
Figure 7.
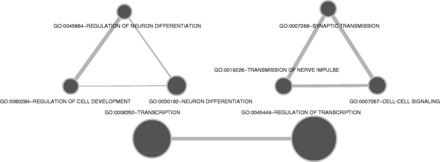
GO enrichment analysis of genes close to developmental stage-specific lncRNAs in adult CB. Terms are related to Neuron differentiation, Transcriptional regulation and Synaptic transmission.
Furthermore, we also used the UP_TISSUE annotation from the DAVID system to explore whether known genes close to stage-specific lncRNAs tended to be tissue-specific genes. The UP_TISSUE list is a curated list of gene expression specificity based on literature mining. Indeed, we found brain-related organ-specific genes are highly enriched in genes neighboring stage-specific lncRNAs. There were 12 enriched terms in E14.5 brain and 17 terms in CB after multiple testing adjustment (Supplementary Figure S10). Though top terms were shared by stage-specific lncRNAs and common lncRNAs, a few terms were developmental stage-specific, like Cortex in E14.5 brain and Hippocampus in adult CB, suggesting lncRNAs were involved in stage-specific organ development. As supporting evidence, transcriptional regulation in cortex might change significantly before and after birth (66). These results suggested that lncRNA regulation may play an important role during a critical window of brain development.
Developmental stage-specific lncRNAs could be efficiently modeled by chromatin modifications
Most of lncRNAs exhibited more tissue-specific expression patterns than protein-coding genes (55). With this in mind, we investigated whether lncRNA expression specificity can be explained by the integrated model. Specifically, we investigated the developmental stage-specific expression of known RefSeq lncRNAs by replacing the class label of the initial integrated model with the expression specificity and then re-building the model. The expression specificity included ES specificity, E14.5 brain specificity, CB specificity and, lastly, no specificity. In detail, there were 429 ES-specific, 738 E14-specific and 605 CB-specific lncRNA genes, whereas there were 7412 ES-specific, 6598 E14-specific and 5698 CB-specific protein-coding genes. In addition, 611 lncRNAs and 5053 protein-coding genes belonged to no specificity class. Unexpectedly, we did not observe tendency of lncRNAs to have specificity labels compared with coding genes, reflecting the global transcriptomic changes during mouse brain development. For the balanced number of four classes of expression specific lncRNAs, we directly applied LASSO regularized multinomial logistic regression model to evaluate features without any partitions. Here, we only analyzed the model of lncRNAs for simplicity.
We also performed feature selection and desired to know whether chromatin features from a particular developmental stage contributed more to lncRNAs with matched developmental stage specificity in integrated model. Indeed, we found that most of top chromatin features of lncRNAs specific at E14.5 stage were chromatin features in E14, like H3K36me3 and H3K4me3, rather than in ES or CB (Figure 8). Similar situation was also revealed at the other two stages (Supplementary Figure S11), while the stage-specific features were different from non-specific genes (Supplementary Figure S12). The observation was consistent with the hypothesis that chromatin modifications directed tissue-specific or developmental stage-specific lncRNA gene expression. When chromatin modification features and genomic sequence features were both included, the integrated model had a much lower precision and AUC in 10-fold cross-validation for predicting lncRNA expression specificity (Table 4). In addition, genomic sequence information was shown to have little contribution to the integrated model performance, as genomic information degraded the integrated model performance (Precision from 0.823 in the chromatin data only model to 0.794 in the integrated model). Altogether, stage-specific chromatin data were proved more useful to predict mouse developmental stage-specific lncRNAs.
Figure 8.
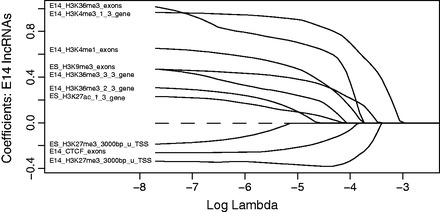
Selected informative features of embryonic E14.5 brain expression specificity determined by the strict threshold using multinomial logistic regression with LASSO regularization. Feature weights in predicting expression specificity of embryonic E14.5 brain lncRNAs with respect to log lambda, a penalty to shrink feature weights in the regression model. Weights of features with less discriminative power of the lncRNAs expressed in embryonic E14.5 brain shrink to 0 as lambda is increasing. Informative features of embryonic E14.5 brain lncRNAs are those with above-zero weights based on lambda value determined by cross-validation.
Table 4.
Comparison of averaged performance of 10-fold cross-validation in lncRNA expression specificity predictions using all features, chromatin data only, sequence only and selected features
| Used features | AUC | Precision | Recall |
|---|---|---|---|
| All features | 0.936 | 0.794 | 0.793 |
| All chromatin features | 0.955 | 0.823 | 0.823 |
| All sequence features | 0.653 | 0.385 | 0.392 |
| Feature selected features | 0.641 | 0.674 | 0.674 |
The comparisons include the AUC under ROC curves, precision and recall values
DISCUSSION
Here, we present a systematic study to identify and assess discriminating features for lncRNA identification over mouse ES cell differentiation to adult CB. We point out the importance of feature selection by LASSO regularized binomial logistic regression model. Selected chromatin modification features are explained from a chromatin biology point of view. We also highlight the importance of chromatin information in prediction of development related lncRNAs.
Recent genome-wide transcriptomic maps have revealed a growing body of putative lncRNAs (28,54,55,67–69). It has been established that the expression of lncRNAs is strongly associated with vertebrate development (54,55,67,69). Cufflinks and Scripture are two earlier pioneering tools that can assemble and quantify transcriptome-wide coding and non-coding transcripts based directly on RNA-seq data (67,70). Other programs or pipelines can also filter lncRNAs de novo from RNA-seq data, of which Codon Substitution Frequency (71) and PhyloCSF (72) are most typical. Many mouse development studies used these tools to identify and filter novel lncRNAs based on high-throughput transcriptomic data (4,28,67,70). However, such alignment-based tools are not suitable to identify lineage-specific lncRNAs and are time-consuming. Recent attempts to mitigate this problem of RNA-seq based strategy used multiple chromatin modifications (12,73). In this study, we suggest that chromatin modification data involving mouse brain development can improve lncRNA prediction, both revealed in 10-fold cross-validation and independent gene set evaluation. Nevertheless, the model we present here is preliminary and is expected to further improve lncRNA predictions by using other chromatin data, given that ChIP-seq data in public databases are rapidly accumulating. A researcher who is interested in lncRNAs in specific loci related to other development and differentiation processes should use other tissue/cell-related chromatin data, though relatively comprehensive chromatin data were only available for a handful of tissues/cells and species.
Individual features from our model are associated with lncRNAs to different extents, which prompts us to use modeling approaches to discriminate lncRNAs from coding genes. Feature selection using chromatin features has been previously demonstrated to be efficient for predicting genomic elements such as enhancer and transcription factor binding site (TFBS), based on available histone modification ChIP-seq or ChIP-chip data (31,74–76). Particularly, Narlikar et al. (77) also use LASSO regularization to identify heart-specific enhancers based on sequence features. Inspired by these studies, we use chromatin features from ChIP-seq data as well as genomic sequence features to identify lncRNAs. Because chromatin marks are generally enriched in the vicinity of TSSs and are broadly distributed in genic regions, which may yield co-occurrence of chromatin features and is difficult to be handled by generalized linear model. LASSO regularization is expected to eliminate overfitting to training sets and reduce feature space; thus, LASSO regularization-based logistic regression model is useful to model such data.
It is assumed in previous studies that coding and non-coding RNAs are under regulation by similar epigenetic modifications, like H3K4me1/2/3, H3K27me3, H3K9me3 and H3K36me3. Though epigenetic mechanisms of protein-coding gene regulation are relatively well-characterized previously, whether the transcription of lncRNAs itself is regulated by chromatin regulators and how difference between coding genes and long non-coding genes is not well understood. To tackle the circumstance, Sati et al. (78) compared chromatin modifications between genome-wide lncRNA and coding genes and observed that lncRNAs seemed to share same chromatin marks with coding genes, except DNA methylation and H3K9me3 that did not seem to regulate lncRNAs. Later, Santoni (79) developed an algorithm to characterize given genomic elements based on ChIP-seq data. Based on the algorithm, H3R2me1 mark was shown to be differentially distributed between lncRNA and coding genes. In the integrated model, 16 features are effective for distinguishing lncRNA from protein-coding genes. The top features predictive of lncRNAs are three repeat elements, followed by ES_H3K9me3_exons and E14_H3K27ac_exons, all in agreement with lncRNA characteristics. Transposable elements were previously shown to be associated with lncRNAs (80). It is supposed that lncRNA evolution is driven by transposable element insertions, which would partially explain the poor conservation of lncRNA transcripts. Once, H3K9me3 was not considered as a distinguishing mark of lncRNAs; here, we show that H3K9me3 is generally moderately related to lncRNAs. Compared with a prior study (78), we detected significant H3K9me3 differences in gene body rather than TSS proximal regions, which may explain why H3K9me3 had role in predicting lncRNAs but failed to be detected previously. ORF-related features are shown to have important roles in predicting coding genes, and ORF length is considered as the most efficient feature for distinguishing lncRNA from coding genes.
There are two candidate explanations for the improved model performance and potential usefulness of chromatin information relative to DNA sequence-derived information. First, chromatin modifications are indicative of enhancer regions and other intergenic elements such as TFBS regions, as shown by recent high-throughput characterization studies in human (74,81). The explanation seems likely, given that available evidence suggests that some chromatin marks are indicative of enhancer. Here, we discover many instances where lncRNAs are marked by H3K4me1 and/or H3K27ac. Therefore, the model may be biased toward enhancer elements. Though enhancer-related lncRNAs may be important for recruitment of chromatin-modifying enzymes (82), we also find a large number of transcripts marked by well-recognized transcription initiation marks, such as H3K4me3 and PolII, whereas a less number of transcripts marked by H3K4me1 and/or H3K27ac, as exemplified by those lncRNAs in Supplementary Figure S13 and S14. In contrast to Figure 3, these lncRNAs have relatively weaker H3K27ac and H3K4me1 marks, suggesting they are less likely to relate to enhancer function. Developmental specificity prediction also suggests that other chromatin features contribute more to specificity predictions than enhancer-related features. From Supplementary Figure S4, we estimate that the proportion of lncRNAs with H3K27ac occupancy is ∼40%. Though the proportion of enhancer-related lncRNAs is difficult to determine, enhancer-related lncRNAs may not dominate the lncRNA reservoir.
Second, the improved performance is more likely to be contributed by chromatin features, which is well supported in this article. Interestingly, some chromatin features such as H3K9me3 and H3K27ac are relatively higher distributed along gene body of lncRNAs at different developmental stages, whereas the other chromatin features are more stage-specific (Figures 1 and 8 and Supplementary Figure S11). The predictability of stage-specific lncRNAs is an evident merit, given that lncRNAs may only act in specific cell/tissue types. The simple strategy of incorporating chromatin information in model can improve lncRNA predictions and stage-specific predictions, which can be explained that chromatin data reflect directly the molecular activity that modulates lncRNA transcription, whereas sequence information is indirect and interwoven with a few confounding variables such as transcription factor binding. However, chromatin and sequence data are shown complementary, possibly due to the limited chromatin modification data in use. An integrated model involving multiple information sources is therefore useful for lncRNA predictions. Taken together, these observations suggest that chromatin modifications account for the performance improvement compared with sequence only model. Though the proposed model achieves satisfactory performance, lncRNA transcriptions may be regulated by different regulatory mechanisms but are not within the central topic of this article, which can be separately analyzed by machine-learning tools in future studies.
There are exceptions where chromatin information does not improve lncRNA predictions. The DNA-binding protein CTCF does not improve lncRNA predictions, in contrast to histone modification marks. We are not surprised because chromatin modifications are not closely related to this particular DNA-binding protein, in accordance with a previous study (83). Besides CTCF, PolII is also irrelevant to lncRNA prediction, which is consistent with that PolII can bind to both transcriptionally active and inactive gene promoters (84,85). Notably, though H3K4me1 and H3K27ac are overrepresented for lncRNAs in the integrated model, it is useless for stage-specific lncRNA predictions.
The integrated model is applied to transcriptome RNA-seq data and predicts many novel lncRNAs that are around imprinted genes. Many imprinted genes are themselves non-coding RNAs, including Meg3 and Airn. Our predictions appear to reveal the regulation of nearby genes by lncRNAs, such as those putative lncRNAs upstream of Meg3 (Figure 3).
Interestingly, we have also analyzed the enriched functions of known genes close to lncRNAs. In agreement with previous studies, genes associated with putative lncRNAs are enriched in GO terms related to neuron differentiation and transcriptional regulation. Additionally, the modified model for investigating developmental stage specificity suggests the potential roles of chromatin modifications in stage-specific non-coding RNA regulation. The regulation by distal lncRNAs on nearby genes perhaps allows gene expression to be fine tuned in a cell-type/developmental stage-specific manner. Together, these findings suggest that lncRNAs tend to be involved in stage-specific transcriptional regulation.
CONCLUSIONS
We show here the logistic regression model with LASSO regularization can be used to predict lncRNAs using selected top characteristic histone modification and genomic features. We evaluate the integrated model by cross-validation together with independent data testing. Though more features are helpful for lncRNA predictions, the model performance is contributed mostly by top features. We compare the performance of model with only chromatin information and model with only genomic sequence information and show that they are both irreplaceable by each other, suggesting the usefulness of an integrated model with both types of information. The observation suggests that the integrated model has an acceptable capability of learning complicated patterns from weak and complex chromatin and genomic patterns in lncRNAs. When applying the integrated model to assembled transcripts from RNA-seq data, we demonstrate the putative lncRNAs show strong tendency to close to genes associated with functions such as neuron differentiation and transcriptional regulation. For the tissue and developmental stage specificity of lncRNAs, more high-throughput chromatin data would be critical in deciphering non-coding RNA regulation, which would be encouraged by more availing high-throughput data. With more and more high-throughput chromatin modification data at hand, we envision that integrative modeling will facilitate more cell/tissue-specific lncRNA predictions.
SUPPLEMENTARY DATA
Supplementary Data are available at NAR Online.
FUNDING
National Natural Science Foundation of China [31371478, 31171383, 31271558, 31371334 and 61203262]; The Fundamental Research Funds for the Central Universities [HIT.NSRIF.2010027]; and Natural Science Foundation of Heilongjiang Province [C201217]. Funding for open access charge: The National Natural Science Foundation of China [31371478, 31171383, 31271558, 31371334 and 61203262].
Conflict of interest statement. None declared.
Supplementary Material
ACKNOWLEDGEMENTS
The authors thank two anonymous referees for their important suggestions. The authors also thank National Natural Science Foundation of China for funding.
REFERENCES
- 1.Maher B. ENCODE: The human encyclopaedia. Nature. 2012;489:46–48. doi: 10.1038/489046a. [DOI] [PubMed] [Google Scholar]
- 2.Mercer TR, Dinger ME, Mattick JS. Long non-coding RNAs: insights into functions. Nat. Rev. Genet. 2009;10:155–159. doi: 10.1038/nrg2521. [DOI] [PubMed] [Google Scholar]
- 3.Okazaki Y, Furuno M, Kasukawa T, Adachi J, Bono H, Kondo S, Nikaido I, Osato N, Saito R, Suzuki H, et al. Analysis of the mouse transcriptome based on functional annotation of 60,770 full-length cDNAs. Nature. 2002;420:563–573. doi: 10.1038/nature01266. [DOI] [PubMed] [Google Scholar]
- 4.Guttman M, Amit I, Garber M, French C, Lin MF, Feldser D, Huarte M, Zuk O, Carey BW, Cassady JP, et al. Chromatin signature reveals over a thousand highly conserved large non-coding RNAs in mammals. Nature. 2009;458:223–227. doi: 10.1038/nature07672. [DOI] [PMC free article] [PubMed] [Google Scholar]
- 5.Banfai B, Jia H, Khatun J, Wood E, Risk B, Gundling WE, Jr, Kundaje A, Gunawardena HP, Yu Y, Xie L, et al. Long noncoding RNAs are rarely translated in two human cell lines. Genome Res. 2012;22:1646–1657. doi: 10.1101/gr.134767.111. [DOI] [PMC free article] [PubMed] [Google Scholar]
- 6.Ponting CP, Oliver PL, Reik W. Evolution and functions of long noncoding RNAs. Cell. 2009;136:629–641. doi: 10.1016/j.cell.2009.02.006. [DOI] [PubMed] [Google Scholar]
- 7.Ponjavic J, Ponting CP, Lunter G. Functionality or transcriptional noise? Evidence for selection within long noncoding RNAs. Genome Res. 2007;17:556–565. doi: 10.1101/gr.6036807. [DOI] [PMC free article] [PubMed] [Google Scholar]
- 8.Zhang B, Arun G, Mao YS, Lazar Z, Hung G, Bhattacharjee G, Xiao X, Booth CJ, Wu J, Zhang C, et al. The lncRNA Malat1 is dispensable for mouse development but its transcription plays a cis-regulatory role in the adult. Cell Rep. 2012;2:111–123. doi: 10.1016/j.celrep.2012.06.003. [DOI] [PMC free article] [PubMed] [Google Scholar]
- 9.Koerner MV, Pauler FM, Huang R, Barlow DP. The function of non-coding RNAs in genomic imprinting. Development. 2009;136:1771–1783. doi: 10.1242/dev.030403. [DOI] [PMC free article] [PubMed] [Google Scholar]
- 10.Tripathi V, Ellis JD, Shen Z, Song DY, Pan Q, Watt AT, Freier SM, Bennett CF, Sharma A, Bubulya PA, et al. The nuclear-retained noncoding RNA MALAT1 regulates alternative splicing by modulating SR splicing factor phosphorylation. Mol. Cell. 2010;39:925–938. doi: 10.1016/j.molcel.2010.08.011. [DOI] [PMC free article] [PubMed] [Google Scholar]
- 11.Rinn JL, Kertesz M, Wang JK, Squazzo SL, Xu X, Brugmann SA, Goodnough LH, Helms JA, Farnham PJ, Segal E, et al. Functional demarcation of active and silent chromatin domains in human HOX loci by noncoding RNAs. Cell. 2007;129:1311–1323. doi: 10.1016/j.cell.2007.05.022. [DOI] [PMC free article] [PubMed] [Google Scholar]
- 12.Ulitsky I, Shkumatava A, Jan CH, Sive H, Bartel DP. Conserved function of lincRNAs in vertebrate embryonic development despite rapid sequence evolution. Cell. 2011;147:1537–1550. doi: 10.1016/j.cell.2011.11.055. [DOI] [PMC free article] [PubMed] [Google Scholar]
- 13.Klattenhoff CA, Scheuermann JC, Surface LE, Bradley RK, Fields PA, Steinhauser ML, Ding H, Butty VL, Torrey L, Haas S, et al. Braveheart, a long noncoding RNA required for cardiovascular lineage commitment. Cell. 2013;152:570–583. doi: 10.1016/j.cell.2013.01.003. [DOI] [PMC free article] [PubMed] [Google Scholar]
- 14.Han Z, He H, Zhang F, Huang Z, Liu Z, Jiang H, Wu Q. Spatiotemporal expression pattern of Mirg, an imprinted non-coding gene, during mouse embryogenesis. J. Mol. Histol. 2012;43:1–8. doi: 10.1007/s10735-011-9367-x. [DOI] [PubMed] [Google Scholar]
- 15.Han Z, Liu Q, Huang Z, Cui W, Tian Y, Yan W, Wu Q. Expression and imprinting analysis of AK044800, a transcript from the Dlk1-Dio3 imprinted gene cluster during mouse embryogenesis. Mol. Cells. 2013;35:285–290. doi: 10.1007/s10059-013-2275-z. [DOI] [PMC free article] [PubMed] [Google Scholar]
- 16.Clamp M, Fry B, Kamal M, Xie X, Cuff J, Lin MF, Kellis M, Lindblad-Toh K, Lander ES. Distinguishing protein-coding and noncoding genes in the human genome. Proc. Natl Acad. Sci. USA. 2007;104:19428–19433. doi: 10.1073/pnas.0709013104. [DOI] [PMC free article] [PubMed] [Google Scholar]
- 17.Derrien T, Johnson R, Bussotti G, Tanzer A, Djebali S, Tilgner H, Guernec G, Martin D, Merkel A, Knowles DG, et al. The GENCODE v7 catalog of human long noncoding RNAs: analysis of their gene structure, evolution, and expression. Genome Res. 2012;22:1775–1789. doi: 10.1101/gr.132159.111. [DOI] [PMC free article] [PubMed] [Google Scholar]
- 18.Gish W, States DJ. Identification of protein coding regions by database similarity search. Nat. Genet. 1993;3:266–272. doi: 10.1038/ng0393-266. [DOI] [PubMed] [Google Scholar]
- 19.Furuno M, Kasukawa T, Saito R, Adachi J, Suzuki H, Baldarelli R, Hayashizaki Y, Okazaki Y. CDS annotation in full-length cDNA sequence. Genome Res. 2003;13:1478–1487. doi: 10.1101/gr.1060303. [DOI] [PMC free article] [PubMed] [Google Scholar]
- 20.Gruber AR, Findeiss S, Washietl S, Hofacker IL, Stadler PF. RNAz 2.0: improved noncoding RNA detection. Pac. Symp. Biocomput. 2010;15:69–79. [PubMed] [Google Scholar]
- 21.Carninci P, Kasukawa T, Katayama S, Gough J, Frith MC, Maeda N, Oyama R, Ravasi T, Lenhard B, Wells C, et al. The transcriptional landscape of the mammalian genome. Science. 2005;309:1559–1563. doi: 10.1126/science.1112014. [DOI] [PubMed] [Google Scholar]
- 22.Dinger ME, Pang KC, Mercer TR, Mattick JS. Differentiating protein-coding and noncoding RNA: challenges and ambiguities. PLoS Comput. Biol. 2008;4:e1000176. doi: 10.1371/journal.pcbi.1000176. [DOI] [PMC free article] [PubMed] [Google Scholar]
- 23.Kong L, Zhang Y, Ye ZQ, Liu XQ, Zhao SQ, Wei L, Gao G. CPC: assess the protein-coding potential of transcripts using sequence features and support vector machine. Nucleic Acids Res. 2007;35:W345–W349. doi: 10.1093/nar/gkm391. [DOI] [PMC free article] [PubMed] [Google Scholar]
- 24.Arrial RT, Togawa RC, Brigido Mde M. Screening non-coding RNAs in transcriptomes from neglected species using PORTRAIT: case study of the pathogenic fungus Paracoccidioides brasiliensis. BMC Bioinformatics. 2009;10:239. doi: 10.1186/1471-2105-10-239. [DOI] [PMC free article] [PubMed] [Google Scholar]
- 25.Liu J, Gough J, Rost B. Distinguishing protein-coding from non-coding RNAs through support vector machines. PLoS Genet. 2006;2:e29. doi: 10.1371/journal.pgen.0020029. [DOI] [PMC free article] [PubMed] [Google Scholar]
- 26.Sun K, Chen X, Jiang P, Song X, Wang H, Sun H. iSeeRNA: identification of long intergenic non-coding RNA transcripts from transcriptome sequencing data. BMC Genomics. 2013;14(Suppl. 2):S7. doi: 10.1186/1471-2164-14-S2-S7. [DOI] [PMC free article] [PubMed] [Google Scholar]
- 27.Boerner S, McGinnis KM. Computational identification and functional predictions of long noncoding RNA in Zea mays. PLoS One. 2012;7:e43047. doi: 10.1371/journal.pone.0043047. [DOI] [PMC free article] [PubMed] [Google Scholar]
- 28.Sun L, Zhang Z, Bailey TL, Perkins AC, Tallack MR, Xu Z, Liu H. Prediction of novel long non-coding RNAs based on RNA-Seq data of mouse Klf1 knockout study. BMC Bioinformatics. 2012;13:331. doi: 10.1186/1471-2105-13-331. [DOI] [PMC free article] [PubMed] [Google Scholar]
- 29.Costa V, Angelini C, De Feis I, Ciccodicola A. Uncovering the complexity of transcriptomes with RNA-Seq. J. Biomed. Biotechnol. 2010;2010:853916. doi: 10.1155/2010/853916. [DOI] [PMC free article] [PubMed] [Google Scholar]
- 30.Schwartz S, Oren R, Ast G. Detection and removal of biases in the analysis of next-generation sequencing reads. PLoS One. 2011;6:e16685. doi: 10.1371/journal.pone.0016685. [DOI] [PMC free article] [PubMed] [Google Scholar]
- 31.Whitington T, Perkins AC, Bailey TL. High-throughput chromatin information enables accurate tissue-specific prediction of transcription factor binding sites. Nucleic Acids Res. 2009;37:14–25. doi: 10.1093/nar/gkn866. [DOI] [PMC free article] [PubMed] [Google Scholar]
- 32.Ramsey SA, Knijnenburg TA, Kennedy KA, Zak DE, Gilchrist M, Gold ES, Johnson CD, Lampano AE, Litvak V, Navarro G, et al. Genome-wide histone acetylation data improve prediction of mammalian transcription factor binding sites. Bioinformatics. 2010;26:2071–2075. doi: 10.1093/bioinformatics/btq405. [DOI] [PMC free article] [PubMed] [Google Scholar]
- 33.Zhao J, Ohsumi TK, Kung JT, Ogawa Y, Grau DJ, Sarma K, Song JJ, Kingston RE, Borowsky M, Lee JT. Genome-wide identification of polycomb-associated RNAs by RIP-seq. Mol. Cell. 2010;40:939–953. doi: 10.1016/j.molcel.2010.12.011. [DOI] [PMC free article] [PubMed] [Google Scholar]
- 34.Park PJ. ChIP-seq: advantages and challenges of a maturing technology. Nat. Rev. Genet. 2009;10:669–680. doi: 10.1038/nrg2641. [DOI] [PMC free article] [PubMed] [Google Scholar]
- 35.Stamatoyannopoulos JA, Snyder M, Hardison R, Ren B, Gingeras T, Gilbert DM, Groudine M, Bender M, Kaul R, Canfield T, et al. An encyclopedia of mouse DNA elements (Mouse ENCODE) Genome Biol. 2012;13:418. doi: 10.1186/gb-2012-13-8-418. [DOI] [PMC free article] [PubMed] [Google Scholar]
- 36.Marques AC, Ponting CP. Catalogues of mammalian long noncoding RNAs: modest conservation and incompleteness. Genome Biol. 2009;10:R124. doi: 10.1186/gb-2009-10-11-r124. [DOI] [PMC free article] [PubMed] [Google Scholar]
- 37.Kodama Y, Shumway M, Leinonen R. The Sequence Read Archive: explosive growth of sequencing data. Nucleic Acids Res. 2012;40:D54–D56. doi: 10.1093/nar/gkr854. [DOI] [PMC free article] [PubMed] [Google Scholar]
- 38.Su J, Zhang Y, Lv J, Liu H, Tang X, Wang F, Qi Y, Feng Y, Li X. CpG_MI: a novel approach for identifying functional CpG islands in mammalian genomes. Nucleic Acids Res. 2010;38:e6. doi: 10.1093/nar/gkp882. [DOI] [PMC free article] [PubMed] [Google Scholar]
- 39.Dreszer TR, Karolchik D, Zweig AS, Hinrichs AS, Raney BJ, Kuhn RM, Meyer LR, Wong M, Sloan CA, Rosenbloom KR, et al. The UCSC genome browser database: extensions and updates 2011. Nucleic Acids Res. 2012;40:D918–D923. doi: 10.1093/nar/gkr1055. [DOI] [PMC free article] [PubMed] [Google Scholar]
- 40.Pruitt KD, Tatusova T, Brown GR, Maglott DR. NCBI reference sequences (RefSeq): current status, new features and genome annotation policy. Nucleic Acids Res. 2012;40:D130–D135. doi: 10.1093/nar/gkr1079. [DOI] [PMC free article] [PubMed] [Google Scholar]
- 41.Flicek P, Amode MR, Barrell D, Beal K, Brent S, Carvalho-Silva D, Clapham P, Coates G, Fairley S, Fitzgerald S, et al. Ensembl 2012. Nucleic Acids Res. 2012;40:D84–D90. doi: 10.1093/nar/gkr991. [DOI] [PMC free article] [PubMed] [Google Scholar]
- 42.Zhang Y, Liu T, Meyer CA, Eeckhoute J, Johnson DS, Bernstein BE, Nusbaum C, Myers RM, Brown M, Li W, et al. Model-based analysis of ChIP-Seq (MACS) Genome Biol. 2008;9:R137. doi: 10.1186/gb-2008-9-9-r137. [DOI] [PMC free article] [PubMed] [Google Scholar]
- 43.Barrett T, Troup DB, Wilhite SE, Ledoux P, Evangelista C, Kim IF, Tomashevsky M, Marshall KA, Phillippy KH, Sherman PM, et al. NCBI GEO: archive for functional genomics data sets–10 years on. Nucleic Acids Res. 2011;39:D1005–D1010. doi: 10.1093/nar/gkq1184. [DOI] [PMC free article] [PubMed] [Google Scholar]
- 44.Trapnell C, Pachter L, Salzberg SL. TopHat: discovering splice junctions with RNA-Seq. Bioinformatics. 2009;25:1105–1111. doi: 10.1093/bioinformatics/btp120. [DOI] [PMC free article] [PubMed] [Google Scholar]
- 45.Trapnell C, Roberts A, Goff L, Pertea G, Kim D, Kelley DR, Pimentel H, Salzberg SL, Rinn JL, Pachter L. Differential gene and transcript expression analysis of RNA-seq experiments with TopHat and Cufflinks. Nat. Protoc. 2012;7:562–578. doi: 10.1038/nprot.2012.016. [DOI] [PMC free article] [PubMed] [Google Scholar]
- 46.Illingworth RS, Gruenewald-Schneider U, Webb S, Kerr AR, James KD, Turner DJ, Smith C, Harrison DJ, Andrews R, Bird AP. Orphan CpG islands identify numerous conserved promoters in the mammalian genome. PLoS Genet. 2010;6:e1001134. doi: 10.1371/journal.pgen.1001134. [DOI] [PMC free article] [PubMed] [Google Scholar]
- 47.Kapusta A, Kronenberg Z, Lynch VJ, Zhuo X, Ramsay L, Bourque G, Yandell M, Feschotte C. Transposable elements are major contributors to the origin, diversification, and regulation of vertebrate long noncoding RNAs. PLoS Genet. 2013;9:e1003470. doi: 10.1371/journal.pgen.1003470. [DOI] [PMC free article] [PubMed] [Google Scholar]
- 48.Zhang Y, Liu H, Lv J, Xiao X, Zhu J, Liu X, Su J, Li X, Wu Q, Wang F, et al. QDMR: a quantitative method for identification of differentially methylated regions by entropy. Nucleic Acids Res. 2011;39:e58. doi: 10.1093/nar/gkr053. [DOI] [PMC free article] [PubMed] [Google Scholar]
- 49.Friedman J, Hastie T, Tibshirani R. Regularization paths for generalized linear models via coordinate descent. J. Stat. Softw. 2010;33:1–22. [PMC free article] [PubMed] [Google Scholar]
- 50.Jiao X, Sherman BT, Huang da W, Stephens R, Baseler MW, Lane HC, Lempicki RA. DAVID-WS: a stateful web service to facilitate gene/protein list analysis. Bioinformatics. 2012;28:1805–1806. doi: 10.1093/bioinformatics/bts251. [DOI] [PMC free article] [PubMed] [Google Scholar]
- 51.Merico D, Isserlin R, Stueker O, Emili A, Bader GD. Enrichment map: a network-based method for gene-set enrichment visualization and interpretation. PLoS One. 2010;5:e13984. doi: 10.1371/journal.pone.0013984. [DOI] [PMC free article] [PubMed] [Google Scholar]
- 52.Yamashita R, Sathira NP, Kanai A, Tanimoto K, Arauchi T, Tanaka Y, Hashimoto S, Sugano S, Nakai K, Suzuki Y. Genome-wide characterization of transcriptional start sites in humans by integrative transcriptome analysis. Genome Res. 2011;21:775–789. doi: 10.1101/gr.110254.110. [DOI] [PMC free article] [PubMed] [Google Scholar]
- 53.Shin H, Liu T, Manrai AK, Liu XS. CEAS: cis-regulatory element annotation system. Bioinformatics. 2009;25:2605–2606. doi: 10.1093/bioinformatics/btp479. [DOI] [PubMed] [Google Scholar]
- 54.Pauli A, Valen E, Lin MF, Garber M, Vastenhouw NL, Levin JZ, Fan L, Sandelin A, Rinn JL, Regev A, et al. Systematic identification of long noncoding RNAs expressed during zebrafish embryogenesis. Genome Res. 2012;22:577–591. doi: 10.1101/gr.133009.111. [DOI] [PMC free article] [PubMed] [Google Scholar]
- 55.Cabili MN, Trapnell C, Goff L, Koziol M, Tazon-Vega B, Regev A, Rinn JL. Integrative annotation of human large intergenic noncoding RNAs reveals global properties and specific subclasses. Genes Dev. 2011;25:1915–1927. doi: 10.1101/gad.17446611. [DOI] [PMC free article] [PubMed] [Google Scholar]
- 56.Furuno M, Pang KC, Ninomiya N, Fukuda S, Frith MC, Bult C, Kai C, Kawai J, Carninci P, Hayashizaki Y, et al. Clusters of internally primed transcripts reveal novel long noncoding RNAs. PLoS Genet. 2006;2:e37. doi: 10.1371/journal.pgen.0020037. [DOI] [PMC free article] [PubMed] [Google Scholar]
- 57.Kornblihtt AR, de la Mata M, Fededa JP, Munoz MJ, Nogues G. Multiple links between transcription and splicing. RNA. 2004;10:1489–1498. doi: 10.1261/rna.7100104. [DOI] [PMC free article] [PubMed] [Google Scholar]
- 58.Kim TK, Hemberg M, Gray JM, Costa AM, Bear DM, Wu J, Harmin DA, Laptewicz M, Barbara-Haley K, Kuersten S, et al. Widespread transcription at neuronal activity-regulated enhancers. Nature. 2010;465:182–187. doi: 10.1038/nature09033. [DOI] [PMC free article] [PubMed] [Google Scholar]
- 59.Creyghton MP, Cheng AW, Welstead GG, Kooistra T, Carey BW, Steine EJ, Hanna J, Lodato MA, Frampton GM, Sharp PA, et al. Histone H3K27ac separates active from poised enhancers and predicts developmental state. Proc. Natl Acad. Sci. USA. 2010;107:21931–21936. doi: 10.1073/pnas.1016071107. [DOI] [PMC free article] [PubMed] [Google Scholar]
- 60.Court F, Miro J, Braem C, Lelay-Taha MN, Brisebarre A, Atger F, Gostan T, Weber M, Cathala G, Forne T. Modulated contact frequencies at gene-rich loci support a statistical helix model for mammalian chromatin organization. Genome Biol. 2011;12:R42. doi: 10.1186/gb-2011-12-5-r42. [DOI] [PMC free article] [PubMed] [Google Scholar]
- 61.Koch F, Jourquin F, Ferrier P, Andrau JC. Genome-wide RNA polymerase II: not genes only! Trends Biochem. Sci. 2008;33:265–273. doi: 10.1016/j.tibs.2008.04.006. [DOI] [PubMed] [Google Scholar]
- 62.Sun H, Wu J, Wickramasinghe P, Pal S, Gupta R, Bhattacharyya A, Agosto-Perez FJ, Showe LC, Huang TH, Davuluri RV. Genome-wide mapping of RNA Pol-II promoter usage in mouse tissues by ChIP-seq. Nucleic Acids Res. 2011;39:190–201. doi: 10.1093/nar/gkq775. [DOI] [PMC free article] [PubMed] [Google Scholar]
- 63.Barski A, Cuddapah S, Cui K, Roh TY, Schones DE, Wang Z, Wei G, Chepelev I, Zhao K. High-resolution profiling of histone methylations in the human genome. Cell. 2007;129:823–837. doi: 10.1016/j.cell.2007.05.009. [DOI] [PubMed] [Google Scholar]
- 64.Mokry M, Hatzis P, Schuijers J, Lansu N, Ruzius FP, Clevers H, Cuppen E. Integrated genome-wide analysis of transcription factor occupancy, RNA polymerase II binding and steady-state RNA levels identify differentially regulated functional gene classes. Nucleic Acids Res. 2012;40:148–158. doi: 10.1093/nar/gkr720. [DOI] [PMC free article] [PubMed] [Google Scholar]
- 65.Severin J, Waterhouse AM, Kawaji H, Lassmann T, van Nimwegen E, Balwierz PJ, de Hoon MJ, Hume DA, Carninci P, Hayashizaki Y, et al. FANTOM4 EdgeExpressDB: an integrated database of promoters, genes, microRNAs, expression dynamics and regulatory interactions. Genome Biol. 2009;10:R39. doi: 10.1186/gb-2009-10-4-r39. [DOI] [PMC free article] [PubMed] [Google Scholar]
- 66.Han X, Wu X, Chung WY, Li T, Nekrutenko A, Altman NS, Chen G, Ma H. Transcriptome of embryonic and neonatal mouse cortex by high-throughput RNA sequencing. Proc. Natl Acad. Sci. USA. 2009;106:12741–12746. doi: 10.1073/pnas.0902417106. [DOI] [PMC free article] [PubMed] [Google Scholar]
- 67.Guttman M, Garber M, Levin JZ, Donaghey J, Robinson J, Adiconis X, Fan L, Koziol MJ, Gnirke A, Nusbaum C, et al. Ab initio reconstruction of cell type-specific transcriptomes in mouse reveals the conserved multi-exonic structure of lincRNAs. Nat. Biotechnol. 2010;28:503–510. doi: 10.1038/nbt.1633. [DOI] [PMC free article] [PubMed] [Google Scholar]
- 68.Lin M, Pedrosa E, Shah A, Hrabovsky A, Maqbool S, Zheng D, Lachman HM. RNA-Seq of human neurons derived from iPS cells reveals candidate long non-coding RNAs involved in neurogenesis and neuropsychiatric disorders. PLoS One. 2011;6:e23356. doi: 10.1371/journal.pone.0023356. [DOI] [PMC free article] [PubMed] [Google Scholar]
- 69.Tan MH, Au KF, Yablonovitch AL, Wills AE, Chuang J, Baker JC, Wong WH, Li JB. RNA sequencing reveals a diverse and dynamic repertoire of the Xenopus tropicalis transcriptome over development. Genome Res. 2013;23:201–216. doi: 10.1101/gr.141424.112. [DOI] [PMC free article] [PubMed] [Google Scholar]
- 70.Trapnell C, Williams BA, Pertea G, Mortazavi A, Kwan G, van Baren MJ, Salzberg SL, Wold BJ, Pachter L. Transcript assembly and quantification by RNA-Seq reveals unannotated transcripts and isoform switching during cell differentiation. Nat. Biotechnol. 2010;28:511–515. doi: 10.1038/nbt.1621. [DOI] [PMC free article] [PubMed] [Google Scholar]
- 71.Lin MF, Carlson JW, Crosby MA, Matthews BB, Yu C, Park S, Wan KH, Schroeder AJ, Gramates LS, St Pierre SE, et al. Revisiting the protein-coding gene catalog of Drosophila melanogaster using 12 fly genomes. Genome Res. 2007;17:1823–1836. doi: 10.1101/gr.6679507. [DOI] [PMC free article] [PubMed] [Google Scholar]
- 72.Lin MF, Jungreis I, Kellis M. PhyloCSF: a comparative genomics method to distinguish protein coding and non-coding regions. Bioinformatics. 2011;27:i275–i282. doi: 10.1093/bioinformatics/btr209. [DOI] [PMC free article] [PubMed] [Google Scholar]
- 73.Moran I, Akerman I, van de Bunt M, Xie R, Benazra M, Nammo T, Arnes L, Nakic N, Garcia-Hurtado J, Rodriguez-Segui S, et al. Human beta cell transcriptome analysis uncovers lncRNAs that are tissue-specific, dynamically regulated, and abnormally expressed in type 2 diabetes. Cell Metab. 2012;16:435–448. doi: 10.1016/j.cmet.2012.08.010. [DOI] [PMC free article] [PubMed] [Google Scholar]
- 74.Wang J, Lunyak VV, Jordan IK. Genome-wide prediction and analysis of human chromatin boundary elements. Nucleic Acids Res. 2012;40:511–529. doi: 10.1093/nar/gkr750. [DOI] [PMC free article] [PubMed] [Google Scholar]
- 75.Won KJ, Chepelev I, Ren B, Wang W. Prediction of regulatory elements in mammalian genomes using chromatin signatures. BMC Bioinformatics. 2008;9:547. doi: 10.1186/1471-2105-9-547. [DOI] [PMC free article] [PubMed] [Google Scholar]
- 76.Cheng C, Shou C, Yip KY, Gerstein MB. Genome-wide analysis of chromatin features identifies histone modification sensitive and insensitive yeast transcription factors. Genome Biol. 2011;12:R111. doi: 10.1186/gb-2011-12-11-r111. [DOI] [PMC free article] [PubMed] [Google Scholar]
- 77.Narlikar L, Sakabe NJ, Blanski AA, Arimura FE, Westlund JM, Nobrega MA, Ovcharenko I. Genome-wide discovery of human heart enhancers. Genome Res. 2010;20:381–392. doi: 10.1101/gr.098657.109. [DOI] [PMC free article] [PubMed] [Google Scholar]
- 78.Sati S, Ghosh S, Jain V, Scaria V, Sengupta S. Genome-wide analysis reveals distinct patterns of epigenetic features in long non-coding RNA loci. Nucleic Acids Res. 2012;40:10018–10031. doi: 10.1093/nar/gks776. [DOI] [PMC free article] [PubMed] [Google Scholar]
- 79.Santoni FA. EMdeCODE: a novel algorithm capable of reading words of epigenetic code to predict enhancers and retroviral integration sites and to identify H3R2me1 as a distinctive mark of coding versus non-coding genes. Nucleic Acids Res. 2013;41:e48. doi: 10.1093/nar/gks1214. [DOI] [PMC free article] [PubMed] [Google Scholar]
- 80.Kelley D, Rinn J. Transposable elements reveal a stem cell-specific class of long noncoding RNAs. Genome Biol. 2012;13:R107. doi: 10.1186/gb-2012-13-11-r107. [DOI] [PMC free article] [PubMed] [Google Scholar]
- 81.Huda A, Tyagi E, Marino-Ramirez L, Bowen NJ, Jjingo D, Jordan IK. Prediction of transposable element derived enhancers using chromatin modification profiles. PLoS One. 2011;6:e27513. doi: 10.1371/journal.pone.0027513. [DOI] [PMC free article] [PubMed] [Google Scholar]
- 82.Koziol MJ, Rinn JL. RNA traffic control of chromatin complexes. Curr. Opin. Genet. Dev. 2010;20:142–148. doi: 10.1016/j.gde.2010.03.003. [DOI] [PMC free article] [PubMed] [Google Scholar]
- 83.Kim TH, Abdullaev ZK, Smith AD, Ching KA, Loukinov DI, Green RD, Zhang MQ, Lobanenkov VV, Ren B. Analysis of the vertebrate insulator protein CTCF-binding sites in the human genome. Cell. 2007;128:1231–1245. doi: 10.1016/j.cell.2006.12.048. [DOI] [PMC free article] [PubMed] [Google Scholar]
- 84.Guenther MG, Levine SS, Boyer LA, Jaenisch R, Young RA. A chromatin landmark and transcription initiation at most promoters in human cells. Cell. 2007;130:77–88. doi: 10.1016/j.cell.2007.05.042. [DOI] [PMC free article] [PubMed] [Google Scholar]
- 85.Muse GW, Gilchrist DA, Nechaev S, Shah R, Parker JS, Grissom SF, Zeitlinger J, Adelman K. RNA polymerase is poised for activation across the genome. Nat. Genet. 2007;39:1507–1511. doi: 10.1038/ng.2007.21. [DOI] [PMC free article] [PubMed] [Google Scholar]
Associated Data
This section collects any data citations, data availability statements, or supplementary materials included in this article.