

Abstract
We study the closure dynamics of a large number of well-controlled circular apertures within an epithelial monolayer, where the collective cell migration responsible for epithelization is triggered by the removal of a spatial constraint rather than by scratching. Based on experimental observations, we propose a physical model that takes into account border forces, friction with the substrate, and tissue rheology. Border protrusive activity drives epithelization despite the presence of a contractile actomyosin cable at the periphery of the wound. The closure dynamics is quantified by an epithelization coefficient, defined as the ratio of protrusive stress to tissue-substrate friction, that allows classification of different phenotypes. The same analysis demonstrates a distinct signature for human cells bearing the oncogenic RasV12 mutation, demonstrating the potential of the approach to quantitatively characterize metastatic transformations.
Introduction
Epithelization, the process by which an epithelium actively covers a cell-free surface, is not only central to wound healing (1) but—encapsulating various aspects of collective cell migration—also pivotal in embryonic morphogenesis (2), regeneration, and cancer (3). Given the complexity and the diversity of processes involved after an in vivo injury (4), efforts to understand epithelization have heavily relied on cell cultures (5–8). These studies are based on the classical scratch assay, in which epithelization is triggered by physical removal of cells from the previously intact tissue. Practically, scratching is performed on confluent monolayers with pipette tips, razor blades, or laser ablation (9), which, depending on the protocol, results either in open-contour wounds (i.e., long cell-free strips that divide the initial tissue into two separate parts) or closed-contour wounds (i.e., wounds with a single continuous edge in the monolayer).
In scratch experiments, it was shown that depending on the size and geometry of the wounds and on cell type, two major, not mutually exclusive mechanisms are responsible for epithelization (10): 1), cell crawling through lamellipodial and filopodial extensions (6,8); and 2), in the case of closed-contour wounds, contraction of a continuous actomyosin ring along the wound circumference, a process referred to as purse-string closure (9,11). The two mechanisms were observed for epithelia of various cell types, for example, Madin-Darby canine kidney (MDCK) cells (7,10,12) or cornea epithelial cells (5). Furthermore, they have been observed in development, e.g., during dorsal closure of the Drosophila melanogaster embryo (13) or during ventral enclosure in Caenorhabditis elegans (14), which underlines the importance of understanding epithelization mechanisms beyond the context of wound healing.
Although the scratch assay has proved very instructive, several drawbacks have been identified with this technique. Among them are the poorly defined geometry of the initial wound, deleterious effects of the death of the removed cells, permeabilization of the border cells, and uncontrolled chemistry of the cell-free surface. Low spatial resolution is also a drawback of the laser-ablation technique, as wound geometries are here limited by the patterns of preexisting cells (9). This geometrical aspect is particularly relevant at small wound sizes, since the complex force field that develops at the free edge of the monolayer depends on the size and shape of the free area (5,12). As to the effects of physical injury of cells, not only can dead cells release various uncontrolled factors into the medium, but cells that lie at the newly formed wound edge can also be permeabilized. When studying tissue mechanical aspects, these two contributions may interfere with the release of the physical constraint. Another disadvantage of the scratch assay lies in the debris that is often left on the cell-free surface and may perturb cell migration.
To circumvent these drawbacks, another assay, called the barrier assay, which is less traumatic for the cells, has recently been proposed (15,16). This assay relies on the removal of a neutral barrier that spatially constrains the monolayer, thus triggering epithelization without destroying any cell. This concept is compatible with microfabrication techniques to allow for control of the geometry and size of wounds on the order of 1 μm (15). The barrier assay has been used to study open-contour wounds and, more recently, closed-contour wounds (12).
In this article, we study the epithelization of closed-contour wounds with a well-defined circular geometry in different epithelial cell lines. We use a barrier assay that allows us to accurately measure the closure dynamics of several tens of wounds of controlled diameter in parallel, thereby achieving high statistics. We propose a continuum-mechanics model that takes into account border forces, friction with the substrate, and monolayer rheology. The different parameters involved can be estimated from the experiments and a minimal model containing only the crucial ingredients can be derived. We apply this strategy to two distinct cell lines and show the existence of an epithelization parameter that controls the closure dynamics and allows a classification based on this quantitative parameter. In particular, we demonstrate the versatility of the approach by inhibiting specific pathways and quantitatively characterizing the migration phenotypes. The consequences of the expression of an oncogene in a human cell line can be quantified using the same approach.
Materials and Methods
Cell culture
MDCK wild-type cells (17) were cultured in Dulbecco’s modified Eagle’s medium (Gibco, Carlsbad, CA) supplemented with FBS (Sigma, St. Louis, MO), 2 mM L-glutamin solution (Gibco), and antibiotics solution (penicillin (10,000 U/mL) + streptomycin (10 mg/mL), Gibco) at C, 5% CO2, and 90% humidity. The LifeAct-GFP transfected cells were prepared by usual transfection techniques with the plasmid LifeAct-GFP (Ibidi, Verona, WI), using lipofectamine, and cultured in the same medium, supplemented with 400 μg/mL geneticin (Invitrogen, Carlsbad, CA). Other derived MDCK lines used were actin-GFP (kind gift of Prof. W. J. Nelson, Stanford University, Stanford, CA), histone-mCherry, and cadherin-GFP (18). These lines were cultured in the same way as the LifeAct-GFP line.
Human embryonic kidney (HEK)-HT wild-type cells (19) were cultured in Dulbecco’s modified Eagle’s medium (Gibco) supplemented with 10% FBS (Sigma), 2 mM L-glutamine solution (Gibco), 1% antibiotics solution (penicillin (10,000 U/mL) + streptomycin (10 mg/mL), Gibco), 100 μg/mL hygromycin solution (Life Technologies, Carlsbad, CA) and 400 μg/mL geneticin (Invitrogen) at 37°C, 5% CO2 and 90% humidity. The HEK-HT-RasV12 cells (19) (kind gift of Prof. C. M. Counter, Duke University, Raleigh, NC) were cultured in the same medium, supplemented with 0.5 μg/mL puromycin solution (Life Technologies).
The various inhibitors C3-transferase (Tebu-bio, Offenbach, Germany), and NSC-23766 (Tocris Bioscience, Bristol, United Kingdom) were perfused in the flow chamber for 2 h before the polydimethylsiloxane (PDMS) template was removed. We used concentrations of 1 μg/mL for C3-transferase, and 50 μM for NSC-23766.
PDMS pillars preparation
The PDMS (Sylgard 184, Dow Corning, Midland, MI) pillars were molded on a photoresist template obtained by classic photolithography techniques. Circular structures 100 and 200 μm thick were fabricated in negative photoresist (SU8-2100, Microchem, Newton, MA) by photolithography. Uncured PDMS was then poured on this template and 1 mm spacers were used to constrain the height of the whole structure. It was then cured in a 65°C oven overnight. With this technique, thousands of pillars of different radii could be manufactured at once. This PDMS stamp was then manually cut to the right dimension for each experiment.
Experimental protocol
Cells were cultured in a small-volume flow chamber (RC20-h, Warner Instruments, Hamden, CT) (Fig. S1 in the Supporting Material). The chamber was sealed at the top and bottom by No. 1 15 mm glass coverslips (Delta Scientific, Palmdale, CA). The bottom coverslip was treated with 100 μg/mL fibronectin (Life Technologies) in phosphate-buffered saline at room temperature for 1 h before being added to the chamber. The top coverslip was irreversibly bound to the PDMS template by treating both for 30 s in an air plasma. They were then both treated with poly-L-lysine-polyethylene glycol (Suso, Bloomington, IN) at 0.1 mg/mL for 5 min to ensure that cells did not adhere to the pillar side. Care was taken to protect the pillar tops from plasma oxidation so as to avoid their irreversible adhesion to the substrate when they are removed and to insure that only the pillar sides are treated with PLL-PEG. The chamber was then hermetically sealed with silicone high-vacuum grease. Cells were then seeded in the chamber at high concentrations (≈5 × 10⁴ cells/μL) and allowed to adhere for 1 h. Medium was then manually renewed every 30 min to ensure proper growth underneath the template. Under these conditions, the cells reached confluence after 6 h growth; the PDMS template was then delicately removed with the top coverslip and fresh medium was added to the chamber before imaging. We could verify that removing the pillars did not affect the fibronectin coating by using fluorescent fibronectin, and they did not perturb the cell culture, since cells cultivated on surfaces that had previously been in contact with the pillars grew homogeneously. Throughout this study, the initial time, t = 0, corresponds by convention to the time when the first image was acquired, unless explicitly stated otherwise.
Image acquisition and treatment
The dynamics of closure were imaged in phase contrast on an Olympus IX-71 inverted microscope equipped with thermal and atmospheric regulation (LIS, Life Imaging Service, Basel, Switzerland). Images were acquired by a CCD-camera (Retiga 4000R, QImaging, Surrey, British Columbia, Canada) and the setup was controlled by Metamorph (Molecular Devices, Sunnyvale, CA). The typical delay between two successive images was set between 3 and 15 min, depending on the initial sizes of the wounds and we used 10× and 20× objectives. Confocal imaging of either live or fixed cells was performed under an LSM 710 NLO inverted confocal microscope (Zeiss, Oberkochen, Germany) equipped with thermal and atmospheric regulation. Images were then treated using ImageJ (20) and the free surface was computed through a masking algorithm based on a Fourier filter, an edge-detection algorithm and, finally, binarization of the resulting image. This process proved robust. However, we checked by hand on several significative examples that the apparent distribution of initial radii (see Fig. 5 A) for a given wound size resulted from the margin of error of this technique and from intrinsic variability and not from an actual distribution of initial radii that could have been due to variations in the microfabrication process. The raw data on closure dynamics were then analyzed with Matlab (Mathworks, Natick, MA).
Figure 5.
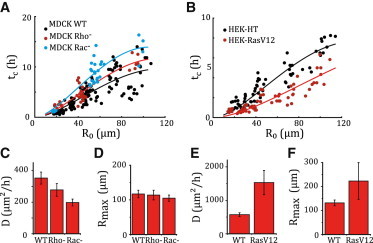
Physical parameters of epithelization. (A and B) Closure time tc (solid circles) as a function of the initial effective radius, R0, fitted by Eq. 1 (solid curves) with the constraints D,Rmax ≥ 0. Each circle corresponds to one wound. (A) MDCK wounds. Wild-type (D = 353 ± 38 μm2 h−1, Rmax = 117 ± 11 μm, ), Rho− assay (D = 278 ± 40 μm2 h−1, Rmax = 114 ± 9 μm, N = 30), and Rac− assay (σp/ξ = 198 ± 22 μm2 h−1, Rmax = 105 ± 11 μm, N = 34). (B) HEK-HT assay (σp/ξ = 572 ± 57 μm2 h−1,Rmax = 132 ± 12 μm, N = 653) and HEK-RasV12 assay (σp/ξ = 1531 ± 363 μm2 h−1, Rmax = 223 ± 77 μm, N = 65). (C–F) Epithelization coefficient, D, and cutoff radius, Rmax, for MDCK (C and D) and HEK wounds (E and F). Error bars correspond to a 95% confidence level.
Circularity measurements
Wound shape was quantified by the circularity , where and denote the perimeter and the area of the wound, respectively, at time t. This definition yields for a circle, for a square, and in general for a closed curve. However, this measurement depends on the resolution of images, due to pixelization artifacts (21). We therefore normalized the circularity of each wound by its initial value, (Fig. S2).
Immunofluorescent stainings
Cells were fixed with 4% paraformaldehyde for 15 min, permeabilized with 0.1% Triton-X100 for 10 min, and saturated in phosphate-buffered saline supplemented with 10% FBS for 20 min. Myosin labeling was performed by incubation for 1 h with a rabbit anti-phospho myosin light chain antibody (Ozyme, Saint Quentin Yvelines, France) at 1:100 before staining for 1 h with a Cy-3-conjugated donkey anti-rabbit (Ozyme) used at 1:500. Actin was stained with an alexa488-conjugated phalloidin (Life Technologies) at 1:1000. Finally, the cells were mounted using Gold Antifade Reagent with DAPI (Life Technologies). The samples were then imaged on an LSM 710 NLO inverted confocal microsope (Zeiss), see Fig. S3.
Laser ablation
Laser ablation experiments were performed under an LSM 710 NLO (Zeiss) inverted confocal microscope with a 64× objective. The microscope was coupled to a femtosecond-pulsed (pulse duration <100 fs) two-photon Mai-Tai HP laser (Spectra Physics, San Jose, CA). For ablation, the wavelength and output power were set at 810 nm and ∼0.1 W, respectively. Between 10 and 20 iterations of the ablation were applied to a zone drawn by hand through the Zen software (Zeiss) leading to a pixel dwell between s and s.
We first performed local ablations, and recorded the time course of the retracted length of the cable (Fig. S4). Rather than using one exponentially decaying function of time, fitting by the sum of two exponentially decaying functions provided better agreement with data. The two characteristic times, one of the order of seconds and the other of the order of minutes, differed by an order of magnitude, indicative of two distinct relaxation processes (see also (22)).
To test whether the cable exerted forces inward, we performed a full ablation of the cable (Fig. S5): the entire edge of the wound retracts, with a single relaxation time >1 min. We thus hypothesize that for local ablation, the longer timescale arises from relaxation at the scale of the tissue, whereas the shorter one pertains to the linear retraction of the cable. After ablation, the circumferential cable reassembles on a timescale of the order of 10 min.
Together these observations show that the cable exerted inward forces and thus could contribute to force generation during closure.
Measurements at the scale of the epithelium
The velocity fields around the wounds were obtained through correlation-based particle image velocimetry analysis (23). The center of mass of the wound was determined at each time with ImageJ to compute the radial averages. Our measurement is consistent with a radial velocity component decaying as (see Fig. 3 B; see also Eq. S5).
Figure 3.
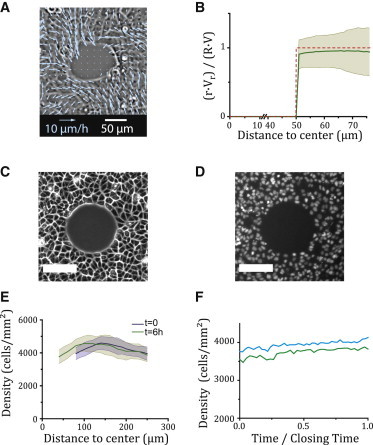
Measurements at the scale of the epithelium. (A) Snapshot of the epithelial velocity field (wild-type MDCK wound, Rw = 50 μm, t = 1 h). (B) Plot of the ensemble-averaged ratio versus radius, r (solid green line, N = 21), where Vr is the angle-averaged radial velocity component, and R(t) and V(t) = (t), respectively denote the effective margin radius and velocity. The shaded area gives the mean ± SD. The radial velocity profile of an incompressible epithelial flow reads rVr(r,t)/(R(t)V(t)) = 1 (Eq. S5), plotted as a dashed red line for comparison. (C and D) Phase-contrast (C) and epifluorescence (D) views of MDCK cells expressing histone-mCherry. Scale bar, 100 μm, Rw = 75 μm. (E) Radial cell density profile at t = 0 h and t = 6 h. The shaded areas give the mean ± SD. (F) Plot of the mean cell density in the entire field of view as a function of time for two wounds (Rw = 75 μm). The relative increase in density is of the order of 10% during closure.
The correlation length of the epithelial velocity field, as plotted in Fig. S6, was measured independently using a microstencil assay. Briefly, a few (two to four) bands of epithelium (size 1 mm × 3 mm) are allowed to migrate by releasing the microstencil. The velocity field is measured by particle image velocimetry during the first 10 h of migration after release, excluding the edges of the tissue (23). The spatial velocity correlation function was computed and averaged over angle, time, and bands. Fitting the averaged correlation function to an exponentially decaying function yielded the correlation length. In Rho− and Rac− assays, inhibitors were added 2 h before stencil removal at concentrations identical to those used in wound-healing assays.
To measure the epithelial cell density, we used a cell line constitutively expressing histone-mCherry to label nuclei (see Fig. 3, C and D). Using Matlab, the position of the center of each nuclei was then determined. To create a density map, the map of the centers of the nuclei was convoluted by a × m window, with care taken to avoid the cell-free patches. For each pixel, we thus computed the number of nuclei found in this 100-μm-wide window around that pixel divided by the surface of the intersection of this window with the tissue. The automated nucleus detection algorithm also allows for a simple count of the number of cells in the field of view at any time point.
Results
Experiment
The experiments relied on the constraint of epithelial growth by cylindrical PDMS pillars whose base, of radius , was in contact with the surface of a glass coverslip, thus preventing cell growth in these areas (Figs. 1 and S1). Removing the pillars (barriers) yielded a continuous cell monolayer surrounding circular cell-free patches, or wounds, with a surface chemistry identical to the rest of the substrate. Pillar removal did not injure the cells but triggered their migration into the cell-free regions (12,15). The free surface area, , of each wound was dynamically monitored and we defined an effective radius , from which the margin velocity was computed. Experiments were first carried out on the well-known MDCK cells that are prototypical of a cohesive epithelium (24). We then studied the influence of an oncogenic transformation on epithelization for the human embryonic kidney (HEK) line (25).
Figure 1.
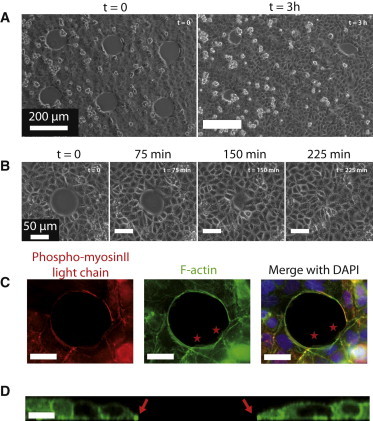
Epithelization of small circular wounds (wild-type MDCK cells). (A) Field of view (Rw = 50 μm). Between two and four such fields are recorded in a typical experiment. Several adjacent MDCK wounds are visible at t = 0 (left) and t = 3 h (right) after removal of the PDMS pillars. Note the intrinsic diversity of closure dynamics. The typical cell size is of the order of 15 μm. (B) Timelapse zoomed on a single wound ( Rw = 37.5 μm). (C) Wound fixed at t = 30 min (Rw = 25 μm) and stained for phosphomyosin II light chain (red), F-actin (green), and nuclei (blue) by immunofluoresence. Note the presence of a pluricellular actomyosin cable and of lamellipodia (stars). For this size, we observed between zero and two lamellipodia whose area ranged between 20 and 175 μm2 (N = 10). Scale bars, 20 μm. (D) Section of a live wound (MDCK-LifeAct-GFP, Rw = 25 μm, t = 30 min) imaged by confocal microscopy. The position of the cable on both sides is indicated by arrows. Scale bar, 25 μm.
MDCK circular wounds of initial radii between m and m rapidly lost their circular shape through the formation of leader cells at several positions around the margin (Movie S1). Subsequently, these leader cells dragged multicellular fingers (8,18) that eventually merged within the wound, thereby creating smaller secondary holes. These holes then proceeded to close, this time without leader cells or roughening of the margin (Movie S2). When m, this assay is therefore qualitatively identical with barrier assays performed on large wounds of rectangular shape (15). In contrast, smaller wounds healed without the formation of leader cells, with only minor distortions of their disklike shape (Figs. 1 and S2). Of note, the observed radius of transition between these two behaviors is of the same order as the epithelial velocity correlation length (23).
Two possible force-generation mechanisms
We focus in the following on the closure of smaller wounds, which was completed within 20 h and presented two striking features (Fig. 1, C and D). 1), Confocal imaging of F-actin revealed lamellipodia in variable number and size at the margin (Movie S3). Active protrusions were not limited to the free surface of the wounds. We also systematically observed cryptic lamellipodia (7) within the tissue, but contrary to the protrusions at the margin, they did not show a preferential orientation (Movie S6). 2), A pluricellular actomyosin cable was assembled at the margin only minutes after removal of the pillars and ran continuously along the wound edge.
The actomyosin cable was probed with two-photon laser ablation experiments (see Methods). Local ablations induced a retraction of the severed ends of the cable (Fig. S4) on a timescale of a few seconds. This observation confirmed that the cable was under tension, as expected from the colocalization of F-actin in the cable with its associated molecular motor myosin II. Furthermore, we observed a small backward displacement (1–2 μm) of the edge of the wound in the radial direction upon ablation of the entire cable, on a timescale of a few minutes (Fig. S5 and Movie S7). Together, these results show that the cable exerts centripetal forces on the closing epithelium.
To substantiate a physical model of epithelization, we used selective inhibition to uncouple the contributions made by the contractile cable and by protrusive activity. Actomyosin contractility and lamellipodial activity are associated with the small G-proteins Rho and Rac1, respectively (26). Whereas the Rho inhibitor c3-transferase had little influence on the closure times (Fig. S7 A, red curves), the Rac1 inhibitor NSC-23766 induced a significant slowing down of the closing process (Figs. 2 A, blue curves, and S7 B, black curves). Some Rac− MDCK wounds of large enough initial radii did not close (7), and epithelization stopped at a final nonzero value of the radius, (Fig. 2 B and Movie S8). We conclude from these results that lamellipodial activity is the dominant driving force of epithelization (6,12).
Figure 2.
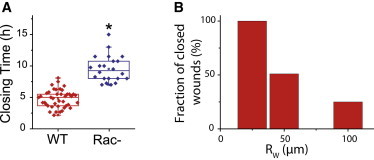
Effect of Rac1-inhibitor on closure dynamics. (A) Closure time (Rw = 50 μm) in MDCK wild-type (red) and Rac− (blue) assay. Rectangular boxes show the first quartile, the median, and the last quartile. (B) Rac− assay, fraction of MDCK wounds proceeding to full closure within 18 h for initial sizes of Rw = 25 μm (N = 8), Rw = 50 μm (N = 39), and Rw = 100 μm (N = 16). To see this figure in color, go online.
Epithelial velocity and cell density
Using velocimetry techniques (25,27), we measured the velocity field around circular wounds in space and time (Fig. 3 A). Strikingly, the angle-averaged radial component of the velocity decayed as the inverse of the distance r to the initial center of the wound (Fig. 3 B), a signature of monolayer incompressibility (Model in the Supporting Material). Indeed, the cell density was approximately uniform (Fig. 3 E), and increased by <10% during closure, since cells divided little or not at all (Fig. 3 F). This observation is consistent with typical cell division times of the order of the duration of closure ( h) for the relevant cell densities (28).
Physical model of closure
Regarding the interpretation of the observations, a unified theoretical description of the involved processes is still lacking (29–31), perhaps as a consequence of the lack of reproducibility in epithelization experiments. On the basis of all experimental observations, we model the tissue as a two-dimensional, isotropic, continuous material, whose flow is incompressible and driven by border forces (Model in the Supporting Material). The epithelium occupies at time t the space outside a disk of radius , with an initial radius (Fig. 4 A). We assume that lamellipodia exert a constant protrusive stress, , at the margin, and that the friction force between epithelium and substrate is proportional to the velocity, with a friction coefficient ξ. The radial force balance equation is integrated with a boundary condition at a (maximal) cutoff radius , a parameter of the model. A differential equation for follows from the stress boundary condition at the border. Neglecting the contribution of the peripheral cable to force generation, and using an inviscid tissue rheology, we obtain an analytical expression for the closure time as a function of the initial radius, (Eq. S12):
| (1) |
where the epithelization coefficient has the dimension of a diffusion coefficient.
Figure 4.
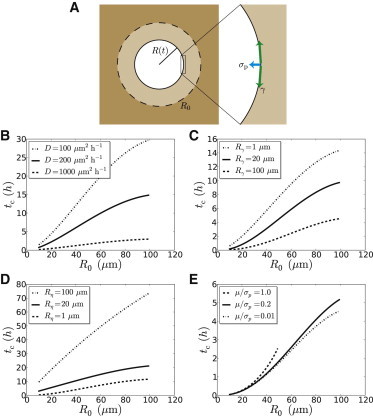
Physical model of epithelial closure. (A) Sketch of a closing circular wound, of initial radius R0 = R(t = 0). Two border forces may drive closure: σp is the protrusive stress produced by lamellipodia and γ the line tension due to the contractile circumferential cable (see the stress boundary condition (Eq. S4)). (B–F) Model predictions. Plots of the closure time, tc, as a function of the initial effective radius, R0. (B) Effect of the variation of D while Rmax = 110 μm is fixed, inviscid rheology without cable (Eqs. 1 and S27). (C) Effect of the variation of Rγ = γ/σp while D = 200 μm2 h−1 and Rmax = 110 μm are fixed, inviscid rheology with a cable (Eq. S28). (D) Effect of the variation of while D = 200 μm2 h−1, Rmax = 110 μm, and Rγ = 10 μm are fixed, viscous rheology (Eq. S29). (E) Effect of the variation of μ/σp while D = 200 μm2 h−1, Rmax = 110 μm, and Rγ = 100 μm are fixed, elastic rheology (Eq. S30). When μ/σp = 1, closure is complete and characterized by a finite closure time only below a value of R0 above which elastic forces are strong enough to stop epithelization. To see this figure in color, go online.
Data analysis
Since the closure time is a robust quantity that depends little on the specifics of image analysis, we used Eq. 1 to fit the data and measure the parameters and (Figs. 5 and S8). Of note, the experimental data plateau for . This behavior is not consistent with a simple scaling relationship where the closure time would be proportional to the initial area , as proposed in (12) (Fig. S8, insets). We checked that taking into account force generation by the actomyosin cable in the stress boundary condition does not modify our results (Data analysis in the Supporting Material, and Fig. S9 A). We found that the cutoff radius, , of the order of , varied little between different conditions. Compared to its wild-type value (, ), the epithelization coefficient was strongly reduced by Rac inhibition (, ) and adopted an intermediate value under Rho inhibition (, ). Furthermore, individual trajectories of wound radii were satisfactorily fitted by the predicted time evolution of the radius, (Eq. S11 and Fig. 6 C), and yielded estimates of the epithelization coefficient consistent within error with those obtained from closure-time data, albeit with larger uncertainties (Fig. S10). Since Rac inhibition impairs actin polymerization at the leading edge of migrating cells (26), one expects a lower protrusive stress in Rac− assays, conducive to a lower value of . Both Rac and Rho inhibition may also modify the friction coefficient, ξ, which generally depends on the intensity and the dynamics of cell-substrate adhesion. This may explain the lower value of measured under Rho inhibition.
Figure 6.
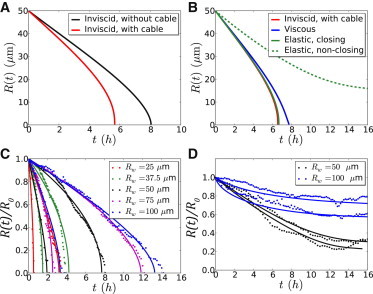
Trajectories. Model predictions: Plots of individual trajectories of the wound radius R(t), R0 = 50 μm. (A) Contribution of border forces for an inviscid fluid. Plots of R(t) as given by Eq. S11, D = 200 μm2 h−1, Rmax = 110 μm (without cable, black curve); and Eq. S10, with the same values of D and Rmax, Rγ = 10 μm (with cable, red curve). (B) Rheology. Plots of R(t) as given by Eq. S10 (inviscid liquid, as in A (red curve)); Eqs. S16 and S17, with Rη = 10 μm (blue curve, viscous liquid); Eqs. S23 and S24, with (solid green curve, elastic solid, closing); Eq. S26, with Re = 15 μm (elastic solid, nonclosing, dashed green curve,); The values of D, Rmax, and Rγ are the same as in A. Experimental data and fits (C) Normalized effective radius, R(t)/R0, is plotted as a function of time t for MDCK wild-type wounds. For clarity, we show only two trajectories (circles) and their fits by Eq. S11 (solid curves) per pillar size, Rw, corresponding to the shortest and longest closure time observed at a given Rw. (D) Normalized effective radius, R(t)/R0, is plotted as a function of time t for nonclosing wounds of the MDCK Rac− assay. For illustrative purposes, we show only two trajectories t(R) per pillar size Rw (solid curves) and their fit by Eq. S26 (dashed curves), with the constraints Ds ≥ 0, Rmax ∈ [96,114] μm (confidence interval obtained from closure-time data) and Re = min R(t). Note that (Eq. S26) is defined only for R > Re.
To check whether our results were robust when changing model assumptions on the epithelial rheology, we investigated the predicted closure dynamics of 1), a viscous epithelium, with shear viscosity coefficient η; and 2), an elastic epithelium, with shear elastic modulus μ. Fitting data with the more complex functional forms of thus obtained (Model in the Supporting Materiral, and Fig. 4, D and E), we concluded that 1), , with external friction dominating internal viscosity (32); and 2), , with protrusive forces dominating elastic forces (Data analysis in the Supporting Material). These results confirm that Eq. 1 provides a satisfactory description of the data on closing wounds. Further, the trajectories of nonclosing Rac− wounds could be fitted with the analytical expressions obtained on the basis of an elastic epithelial rheology (Figs. 6 D and S11). Due to Rac inhibition, the border force was small enough to allow a restoring elastic force to stop epithelization on the timescale of the experiment.
HEK cells
Finally, to test the sensitivity of the proposed quantification to cell phenotypes, we studied and compared epithelization by HEK-HT cells and by the derived cell line constitutively expressing the H-Ras oncogene, HEK-RasV12, using the same experimental and data analysis protocols. The dynamics were globally faster than what had been observed for MDCK cells (compare Movies S3 and S4 and Fig. 5, A and B). Moreover, the HEK-RasV12 cell line had a greater protrusive activity than the HEK-HT line (compare Movies S4 and S5). The model in its simplest form (Eq. 1) accounted well for the closure-time data (Fig. 5 B). Further, HEK-RasV12 wounds were characterized by a larger epithelization coefficient (, ) compared to HEK-HT wounds (, ). The mutation carried by the HEK-RasV12 cell line is known to be common in different types of cancer (33) and to promote angiogenesis (34) and cell motility (35). That the value of the epithelization coefficient for HEK-RasV12 is larger than that for HEK-HT wounds proves to be a signature of the metastatic capacity of the transformed cell line. Thanks to our experimental and data analysis protocols, the kinetics of closure translates into the measurement of a mechanical parameter whose value may allow discrimination of the collective migration phenotypes of various cell types and conditions in screening assays.
Physical parameters
The epithelization coefficient, , estimated for wild-type MDCK wounds was of the order of , or . Using the order of magnitude of cell protrusive forces, nN (36), the two-dimensional protrusive stress, , is of the order of , where L is the typical lateral extension of a cell. Using , we find . We then deduce the order of magnitude of the friction coefficient, , here for a cell monolayer on a glass substrate. Interestingly, this value is consistent with that proposed in (29), using very different assumptions to model epithelization. It is also compatible with the orders of magnitude of epithelial velocities and traction forces (37,38). Down- or upregulating integrin expression or turnover may modify ξ and in turn alter epithelization dynamics. An independent measurement of the friction coefficient could test our predictions.
The second quantifier of closure dynamics is the cutoff radius, . Since the epithelial pressure vanishes at (Eq. S7), it may be interpreted as the lengthscale beyond which the state of the tissue is no longer modified by the presence of an open boundary. Indeed, Fig. S6 shows that a correlation exists between the cutoff radius and the epithelial velocity correlation length, as measured independently in the bulk of a cell monolayer (see Methods). As a consequence, we conjecture that would decrease upon reducing the cohesiveness of the tissue, e.g., by downregulating cadherin expression.
Discussion
Compared to wild-type MDCK assays, the epithelization coefficient, D, adopted a lower value under Rho inhibition, and was further reduced by Rac inhibition. A lower value of the ratio corresponds to a lower value of and/or to a higher value of ξ. In the case of Rac− assays, it is now well established that Rac is responsible, through the activation of the Arp2/3 complex, for actin polymerization at the leading edge of a migrating cell (39–41), which is necessary for force production by lamellipodia. The lower value of D in Rac− assays may well be explained by this effect alone. However, Rac inhibition may also modify the value of ξ: indeed the Rac pathway is also known to be involved in the formation of focal contacts (see, e.g., (42)).
On general physical grounds (43,44), a simple expression for the friction coefficient is given by , where n, k, and τ denote the average density of adhesive bonds, the bond spring constant, and the average binding time, respectively. These three quantities are related to the formation of adhesive bonds, to their maturation state, and to their turnover. The influence of the Rho and Rac GTPases on these three mutally interacting biological processes is complex, often with antagonistic effects on any two of them (39–42,45). On the basis of current knowledge, predicting the effect of Rho and Rac inhibition on epithelium-substrate friction seems very difficult, all the more so since conclusions drawn from single-cell motility assays may not carry over to the case of collective migration of a cell monolayer. Still, it has been shown that Rho is not implicated in the polarization of actin at the leading edge of a migrating cell and that its inhibition can even enhance motility in certain cell types (46). We conjecture that the lower value of D in Rho− assays may be due to a higher value of ξ. This may be explained by the implication of Rho in regulating the turnover of adhesion complexes, more stable under Rho inhibition, thus leading to a higher τ and possibly to a higher ξ (45). However, existing data regarding the effect of Rho on n and k is inconclusive: for instance, it has been observed that Rho− assays lead to a lower integrin density (47). Our measurement may be seen as direct evidence for the effect of Rho inhibition on the epithelium-substrate friction coefficient and may be used as a basis toward a better understanding of the role played by the Rho GTPase in regulating the formation, maturation, and turnover of cell-substrate adhesive bonds in epithelia.
Fits of closing and nonclosing trajectories in Rac− assays showed that the epithelization coefficient is larger when closure is complete. Neglecting the cable line tension , the equilibrium radius reads . Our model suggests that closure is incomplete as soon as , where a is the cellular lengthscale below which microscale mechanisms operate to terminate epithelization (see Model in the Supporting Material). For simplicity, we ignore the possible influence of Rac inhibition on the epithelial elastic modulus, through, e.g., the dynamics and density of cell-cell adhesions (41). The condition corresponds to a threshold value of the protrusive stress, , which increases with . Given the observed experimental variability, we expect the value of to fluctuate from wound to wound in a given Rac− assay. For smaller wounds, crossing the threshold is less likely: indeed, the fraction of nonclosing wounds is an increasing function of initial radius (Fig. 2 B). Altogether, our analysis suggests that Rac inhibition lowers the ratio so that epithelial elasticity can no longer be neglected.
Conclusion
To summarize, a model of the epithelium as an inviscid fluid allowed to quantify the closure of small circular wounds and to classify different cell phenotypes according to the value of the epithelization coefficient, , defined as the ratio of the border protrusive stress, , to the friction coefficient, ξ, between epithelium and substrate. Altogether, the good agreement obtained between model predictions and experimental data validates the modeling assumptions we made, such as isotropy of the epithelium and rotational invariance about the initial center of the wound. On the relevant timescale of several hours, the viscoelastic rheology of the epithelium could be neglected: the protrusive force generated by lamellipodia at and close to the margin dominated force generation and drove collective migration, whereas epithelium-substrate friction dominated dissipation. The purse-string mechanism contributed negligibly to force generation and thus was not necessary for epithelization, a feature reminiscent of in vivo tissue spreading during zebrafish gastrulation (48). In the experiments presented here, the contractile cable likely played a structural role: its tension ensured a symmetric closure by rounding the shape of the wound.
Recent work has shown that the competition between friction and flow governs collective migration in developing organisms (32,48,49). Appropriate modifications of the model may lead to quantitative descriptions of in vivo epithelization during wound healing (2,11,50), but also during embryonic morphogenesis, as, for example, during the dorsal closure of D. melanogaster (13) or the ventral enclosure of C. elegans (14). Depending on the system, we expect to measure relevant quantities among the ratios , , , , and , that quantify collective migration phenotypes through the relative importance of border forces, friction, and tissue rheology.
Acknowledgments
The authors thank Olivier Leroy and Olivier Renaud, along with other members of the PICT-IBISA platform, for their help with confocal imaging and laser ablation experiments, and Maria Carla Parrini for her help with immunostaining experiments.
We acknowledge support from the Association pour la Recherche contre le Cancer, and from the Labex ANR-10-LBX-0038 part of the Idex NANR-10-IDEX-0001-02 PSL.
Contributor Information
Pascal Silberzan, Email: pascal.silberzan@curie.fr.
Philippe Marcq, Email: philippe.marcq@curie.fr.
Supporting Material
References
- 1.Sonnemann K.J., Bement W.M. Wound repair: toward understanding and integration of single-cell and multicellular wound responses. Annu. Rev. Cell Dev. Biol. 2011;27:237–263. doi: 10.1146/annurev-cellbio-092910-154251. [DOI] [PMC free article] [PubMed] [Google Scholar]
- 2.Wood W., Jacinto A., Martin P. Wound healing recapitulates morphogenesis in Drosophila embryos. Nat. Cell Biol. 2002;4:907–912. doi: 10.1038/ncb875. [DOI] [PubMed] [Google Scholar]
- 3.Friedl P., Gilmour D. Collective cell migration in morphogenesis, regeneration and cancer. Nat. Rev. Mol. Cell Biol. 2009;10:445–457. doi: 10.1038/nrm2720. [DOI] [PubMed] [Google Scholar]
- 4.Gurtner G.C., Werner S., Longaker M.T. Wound repair and regeneration. Nature. 2008;453:314–321. doi: 10.1038/nature07039. [DOI] [PubMed] [Google Scholar]
- 5.Grasso S., Hernández J.A., Chifflet S. Roles of wound geometry, wound size, and extracellular matrix in the healing response of bovine corneal endothelial cells in culture. Am. J. Physiol. Cell Physiol. 2007;293:C1327–C1337. doi: 10.1152/ajpcell.00001.2007. [DOI] [PubMed] [Google Scholar]
- 6.Fenteany G., Janmey P.A., Stossel T.P. Signaling pathways and cell mechanics involved in wound closure by epithelial cell sheets. Curr. Biol. 2000;10:831–838. doi: 10.1016/s0960-9822(00)00579-0. [DOI] [PubMed] [Google Scholar]
- 7.Farooqui R., Fenteany G. Multiple rows of cells behind an epithelial wound edge extend cryptic lamellipodia to collectively drive cell-sheet movement. J. Cell Sci. 2005;118:51–63. doi: 10.1242/jcs.01577. [DOI] [PubMed] [Google Scholar]
- 8.Omelchenko T., Vasiliev J.M., Bonder E.M. Rho-dependent formation of epithelial “leader” cells during wound healing. Proc. Natl. Acad. Sci. USA. 2003;100:10788–10793. doi: 10.1073/pnas.1834401100. [DOI] [PMC free article] [PubMed] [Google Scholar]
- 9.Tamada M., Perez T.D., Sheetz M.P. Two distinct modes of myosin assembly and dynamics during epithelial wound closure. J. Cell Biol. 2007;176:27–33. doi: 10.1083/jcb.200609116. [DOI] [PMC free article] [PubMed] [Google Scholar]
- 10.Bement W.M., Forscher P., Mooseker M.S. A novel cytoskeletal structure involved in purse string wound closure and cell polarity maintenance. J. Cell Biol. 1993;121:565–578. doi: 10.1083/jcb.121.3.565. [DOI] [PMC free article] [PubMed] [Google Scholar]
- 11.Brock J., Midwinter K., Martin P. Healing of incisional wounds in the embryonic chick wing bud: characterization of the actin purse-string and demonstration of a requirement for Rho activation. J. Cell Biol. 1996;135:1097–1107. doi: 10.1083/jcb.135.4.1097. [DOI] [PMC free article] [PubMed] [Google Scholar]
- 12.Anon E., Serra-Picamal X., Ladoux B. Cell crawling mediates collective cell migration to close undamaged epithelial gaps. Proc. Natl. Acad. Sci. USA. 2012;109:10891–10896. doi: 10.1073/pnas.1117814109. [DOI] [PMC free article] [PubMed] [Google Scholar]
- 13.Kiehart D.P., Galbraith C.G., Montague R.A. Multiple forces contribute to cell sheet morphogenesis for dorsal closure in Drosophila. J. Cell Biol. 2000;149:471–490. doi: 10.1083/jcb.149.2.471. [DOI] [PMC free article] [PubMed] [Google Scholar]
- 14.Williams-Masson E.M., Malik A.N., Hardin J. An actin-mediated two-step mechanism is required for ventral enclosure of the C. elegans hypodermis. Development. 1997;124:2889–2901. doi: 10.1242/dev.124.15.2889. [DOI] [PubMed] [Google Scholar]
- 15.Poujade M., Grasland-Mongrain E., Silberzan P. Collective migration of an epithelial monolayer in response to a model wound. Proc. Natl. Acad. Sci. USA. 2007;104:15988–15993. doi: 10.1073/pnas.0705062104. [DOI] [PMC free article] [PubMed] [Google Scholar]
- 16.Block E.R., Matela A.R., Klarlund J.K. Wounding induces motility in sheets of corneal epithelial cells through loss of spatial constraints: role of heparin-binding epidermal growth factor-like growth factor signaling. J. Biol. Chem. 2004;279:24307–24312. doi: 10.1074/jbc.M401058200. [DOI] [PubMed] [Google Scholar]
- 17.Bellusci S., Moens G., Jouanneau J. A scatter factor-like factor is produced by a metastatic variant of a rat bladder carcinoma cell line. J. Cell Sci. 1994;107:1277–1287. doi: 10.1242/jcs.107.5.1277. [DOI] [PubMed] [Google Scholar]
- 18.Reffay M., Petitjean L., Silberzan P. Orientation and polarity in collectively migrating cell structures: statics and dynamics. Biophys. J. 2011;100:2566–2575. doi: 10.1016/j.bpj.2011.04.047. [DOI] [PMC free article] [PubMed] [Google Scholar]
- 19.Hahn W.C., Counter C.M., Weinberg R.A. Creation of human tumour cells with defined genetic elements. Nature. 1999;400:464–468. doi: 10.1038/22780. [DOI] [PubMed] [Google Scholar]
- 20.Rasband, W. S. 1997–2012. ImageJ, http://imagej.nih.gov/ij/, U.S. National Institutes of Health, Bethesda, MD,
- 21.Bottema M. Circularity of objects in images. Proc. IEEE Int. Conf. Acoustics, Speech, Signal Proc. 2000;6:2247–2250. and vol. 4. [Google Scholar]
- 22.Landsberg K.P., Farhadifar R., Dahmann C. Increased cell bond tension governs cell sorting at the Drosophila anteroposterior compartment boundary. Curr. Biol. 2009;19:1950–1955. doi: 10.1016/j.cub.2009.10.021. [DOI] [PubMed] [Google Scholar]
- 23.Petitjean L., Reffay M., Silberzan P. Velocity fields in a collectively migrating epithelium. Biophys. J. 2010;98:1790–1800. doi: 10.1016/j.bpj.2010.01.030. [DOI] [PMC free article] [PubMed] [Google Scholar]
- 24.Gaush C.R., Hard W.L., Smith T.F. Characterization of an established line of canine kidney cells (MDCK) Proc. Soc. Exp. Biol. Med. 1966;122:931–935. doi: 10.3181/00379727-122-31293. [DOI] [PubMed] [Google Scholar]
- 25.Ayllón V., Rebollo A. Ras-induced cellular events (review) Mol. Membr. Biol. 2000;17:65–73. doi: 10.1080/09687680050117093. [DOI] [PubMed] [Google Scholar]
- 26.Ridley A.J. Rho GTPases and cell migration. J. Cell Sci. 2001;114:2713–2722. doi: 10.1242/jcs.114.15.2713. [DOI] [PubMed] [Google Scholar]
- 27.Deforet M., Parrini M.C., Silberzan P. Automated velocity mapping of migrating cell populations (AVeMap) Nat. Methods. 2012;9:1081–1083. doi: 10.1038/nmeth.2209. [DOI] [PubMed] [Google Scholar]
- 28.Puliafito A., Hufnagel L., Shraiman B.I. Collective and single cell behavior in epithelial contact inhibition. Proc. Natl. Acad. Sci. USA. 2012;109:739–744. doi: 10.1073/pnas.1007809109. [DOI] [PMC free article] [PubMed] [Google Scholar]
- 29.Arciero J.C., Mi Q., Swigon D. Continuum model of collective cell migration in wound healing and colony expansion. Biophys. J. 2011;100:535–543. doi: 10.1016/j.bpj.2010.11.083. [DOI] [PMC free article] [PubMed] [Google Scholar]
- 30.Almeida L., Bagnerini P., Habbal A. Modeling actin cable contraction. Comput. Math. Appl. 2012;64:310–321. [Google Scholar]
- 31.Lee P., Wolgemuth C.W. Crawling cells can close wounds without purse strings or signaling. PLOS Comput. Biol. 2011;7:e1002007. doi: 10.1371/journal.pcbi.1002007. [DOI] [PMC free article] [PubMed] [Google Scholar]
- 32.Bonnet I., Marcq P., Graner F. Mechanical state, material properties and continuous description of an epithelial tissue. J. R. Soc. Interface. 2012;9:2614–2623. doi: 10.1098/rsif.2012.0263. [DOI] [PMC free article] [PubMed] [Google Scholar]
- 33.Chin L., Tam A., DePinho R.A. Essential role for oncogenic Ras in tumour maintenance. Nature. 1999;400:468–472. doi: 10.1038/22788. [DOI] [PubMed] [Google Scholar]
- 34.Mali P., Wirtz D., Searson P.C. Interplay of RhoA and motility in the programmed spreading of daughter cells postmitosis. Biophys. J. 2010;99:3526–3534. doi: 10.1016/j.bpj.2010.10.006. [DOI] [PMC free article] [PubMed] [Google Scholar]
- 35.Meadows K.N., Bryant P., Pumiglia K.M. Activated Ras induces a proangiogenic phenotype in primary endothelial cells. Oncogene. 2004;23:192–200. doi: 10.1038/sj.onc.1206921. [DOI] [PubMed] [Google Scholar]
- 36.Prass M., Jacobson K., Radmacher M. Direct measurement of the lamellipodial protrusive force in a migrating cell. J. Cell Biol. 2006;174:767–772. doi: 10.1083/jcb.200601159. [DOI] [PMC free article] [PubMed] [Google Scholar]
- 37.Trepat X. Physical forces during collective cell migration. Nat. Phys. 2009;5:426–430. [Google Scholar]
- 38.Saez A., Anon E., Ladoux B. Traction forces exerted by epithelial cell sheets. J. Phys. Condens. Matter. 2010;22:194119. doi: 10.1088/0953-8984/22/19/194119. [DOI] [PubMed] [Google Scholar]
- 39.Hall A. Rho GTPases and the actin cytoskeleton. Science. 1998;279:509–514. doi: 10.1126/science.279.5350.509. [DOI] [PubMed] [Google Scholar]
- 40.Jaffe A.B., Hall A. Rho GTPases: biochemistry and biology. Annu. Rev. Cell Dev. Biol. 2005;21:247–269. doi: 10.1146/annurev.cellbio.21.020604.150721. [DOI] [PubMed] [Google Scholar]
- 41.Etienne-Manneville S., Hall A. Rho GTPases in cell biology. Nature. 2002;420:629–635. doi: 10.1038/nature01148. [DOI] [PubMed] [Google Scholar]
- 42.Rottner K., Hall A., Small J.V. Interplay between Rac and Rho in the control of substrate contact dynamics. Curr. Biol. 1999;9:640–648. doi: 10.1016/s0960-9822(99)80286-3. [DOI] [PubMed] [Google Scholar]
- 43.Schallamach A. A theory of dynamic rubber friction. Wear. 1963;6:375–382. [Google Scholar]
- 44.Gerbal F., Chaikin P., Prost J. An elastic analysis of Listeria monocytogenes propulsion. Biophys. J. 2000;79:2259–2275. doi: 10.1016/S0006-3495(00)76473-3. [DOI] [PMC free article] [PubMed] [Google Scholar]
- 45.Danen E.H.J., van Rheenen J., Sonnenberg A. Integrins control motile strategy through a Rho-cofilin pathway. J. Cell Biol. 2005;169:515–526. doi: 10.1083/jcb.200412081. [DOI] [PMC free article] [PubMed] [Google Scholar]
- 46.Nobes C.D., Hall A. Rho GTPases control polarity, protrusion, and adhesion during cell movement. J. Cell Biol. 1999;144:1235–1244. doi: 10.1083/jcb.144.6.1235. [DOI] [PMC free article] [PubMed] [Google Scholar]
- 47.Ballestrem C., Hinz B., Wehrle-Haller B. Marching at the front and dragging behind: differential alphaVβ3-integrin turnover regulates focal adhesion behavior. J. Cell Biol. 2001;155:1319–1332. doi: 10.1083/jcb.200107107. [DOI] [PMC free article] [PubMed] [Google Scholar]
- 48.Behrndt M., Salbreux G., Heisenberg C.P. Forces driving epithelial spreading in zebrafish gastrulation. Science. 2012;338:257–260. doi: 10.1126/science.1224143. [DOI] [PubMed] [Google Scholar]
- 49.Mayer M., Depken M., Grill S.W. Anisotropies in cortical tension reveal the physical basis of polarizing cortical flows. Nature. 2010;467:617–621. doi: 10.1038/nature09376. [DOI] [PubMed] [Google Scholar]
- 50.Abreu-Blanco M.T., Verboon J.M., Parkhurst S.M. Drosophila embryos close epithelial wounds using a combination of cellular protrusions and an actomyosin purse string. J. Cell Sci. 2012;125:5984–5997. doi: 10.1242/jcs.109066. [DOI] [PMC free article] [PubMed] [Google Scholar]
Associated Data
This section collects any data citations, data availability statements, or supplementary materials included in this article.