

Abstract
The metabolically versatile Burkholderia cepacia complex (Bcc) occupies a variety of niches, including the plant rhizosphere and the cystic fibrosis lung (where it is often fatal to the patient). Bcc members have multipartite genomes, of which the third replicon, pC3 (previously chromosome 3), has been shown to be a nonessential megaplasmid which confers virulence and both antifungal and proteolytic activity on several strains. In this study, pC3 curing was extended to cover strains of 16 of the 17 members of the Bcc, and the phenotypes conferred by pC3 were determined. B. cenocepacia strains H111, MCO-3, and HI2424 were previously cured of pC3; however, this had not proved possible in the epidemic strain K56-2. Here, we investigated the mechanism of this unexpected stability and found that efficient toxin-antitoxin systems are responsible for maintaining pC3 of strain K56-2. Identification of these systems allowed neutralization of the toxins and the subsequent deletion of K56-2pC3. The cured strain was found to exhibit reduced antifungal activity and was attenuated in both the zebrafish and the Caenorhabditis elegans model of infection. We used a PCR screening method to examine the prevalence of pC3 within 110 Bcc isolates and found that this replicon was absent in only four cases, suggesting evolutionary fixation. It is shown that plasmid pC3 increases the resistance of B. cenocepacia H111 to various stresses (oxidative, osmotic, high-temperature, and chlorhexidine-induced stresses), explaining the prevalence of this replicon within the Bcc.
INTRODUCTION
The Burkholderia cepacia complex (Bcc) is a group of closely related bacterial species, currently numbering 17 (1), that are found throughout the natural environment, generally in close association with plants. Strains of each Bcc species have, however, also been isolated from humans, and Bcc species are known as life-threatening opportunistic pathogens, especially of cystic fibrosis (CF) sufferers (2). Treatment of Bcc infections is complicated by their high intrinsic antibiotic resistance. Among Bcc infections of the CF lung, Burkholderia cenocepacia infections are associated with a particularly poor prognosis, especially where the infecting strain is of a transmissible and virulent lineage, such as electropherotype 12 (ET-12) (3).
Bcc species are metabolically versatile and able to thrive in a wide range of environmental niches (4, 5). This versatility is made possible by their large and varied multireplicon genomes, ranging in size from 7 to 9 Mb and consisting of three principal replicons (and in some cases additional plasmids). The two largest of these major replicons are chromosomes 1 and 2, which range in size from 3.3 to 3.9 Mb and 2.4 to 3.6 Mb, respectively, in the sequenced Bcc strains. The third replicon ranges in size from 0.5 to 1.4 Mb in sequenced Bcc strains, and we have shown that this element is not a bacterial chromosome, as was previously believed, but is in fact a megaplasmid involved in virulence and antifungal activity (6). This third replicon was originally designated chromosome 3; however, we have proposed the name pC3 to reflect its true status as a megaplasmid.
In a previous study, we showed that strains belonging to seven Bcc species can be cured of pC3 by employing a plasmid incompatibility approach (6). The cured strains generally showed a reduction in virulence and both proteolytic and antifungal activity and lost the ability to utilize certain carbon and nitrogen sources. In the present study, we extended our plasmid incompatibility approach to cure members of all Bcc species of pC3 (except for Burkholderia cepacia), confirming the nonessential nature of this replicon. In the course of this work, we found that B. cenocepacia K56-2 was resistant to curing. This commonly used model strain for ET-12 lineage B. cenocepacia is highly virulent in higher-animal models and is therefore one of the most studied Bcc members. We identified two putative toxin-antitoxin systems (TASs) and one lone antitoxin in the sequence of B. cenocepacia K56-2 pC3, and by heterologous expression of the antitoxin sequences, we were able to cure this strain of pC3. We screened 110 Bcc isolates available within our laboratory for the presence of pC3 and found only 4 isolates that did not harbor pC3, suggesting that this plasmid represents a conserved feature of the Bcc. We determined that in the case of B. cenocepacia H111 growing in rich medium, the probability that a cell that lacks pC3 will arise is approximately 1 in 1.35 × 10⁴ per generation. These results suggested that selective pressures must exist for the maintenance of pC3, and we therefore investigated the role of this replicon in the stress resistance of B. cenocepacia H111.
MATERIALS AND METHODS
Bacterial strains and media.
All bacterial strains used in this study are shown in Table S1 in the supplemental material. Escherichia coli strains were routinely cultured at 37°C on Luria-Bertani (LB) Lennox agar containing appropriate antibiotics (Iso-Sensitest agar [IST; Oxoid] was used when trimethoprim was used for selection). Bcc strains were cultured at 30°C (37°C for B. cenocepacia) on LB Lennox agar containing appropriate antibiotics and maintained at room temperature on M9 minimal salts agar containing glucose (0.5%, wt/vol) (7). The antibiotic concentrations used were as follows: chloramphenicol, 25 μg ml−1 (E. coli) and 50 μg ml−1 (Bcc); trimethoprim, 25 μg ml−1(E. coli) and 50 μg ml−1 (Bcc); gentamicin, 20 μg ml−1 (E. coli and Bcc); and rifampin, 50 μg ml−1. For B. cenocepacia K56-2, chloramphenicol was used at 150 μg ml−1 and trimethoprim was used at 100 μg ml−1. M9 medium containing uracil as the nitrogen source was used for differentiation between wild-type (wt) and pC3-null Bcc strains, as described previously (6).
Molecular methods.
All plasmids used in this study are shown in Table S1 in the supplemental material. Oligonucleotides used in plasmid construction, PCR screening, and construction of double-stranded oligonucleotides for cloning are shown in Table S2 in the supplemental material. Plasmid DNA was routinely isolated using a Qiagen miniprep kit. DNA prepared by PCR amplification or restriction digestion was purified using a Qiagen PCR purification kit. General molecular methods were as described by Sambrook et al. (8). Plasmids were introduced into Bcc strains by conjugation. Cloning steps were performed in Escherichia coli strain XL1-Blue, MC1061, or CC118λpir for the R6K-based plasmid pSHAFT2.
Conjugal transfer of plasmids.
Bacterial conjugations were carried out using a filter mating technique (9), utilizing a helper strain (HB101/pRK2013) to provide the tra genes. Conjugations were carried out on LB Lennox plates at 30 to 37°C for approximately 16 h. Exconjugants were selected on Pseudomonas isolation agar (Difco) containing appropriate antibiotics.
Deletion of pC3 using pMinic3.
Deletion of pC3 was carried out using pMinic3 as detailed previously (6). Strains bearing pMinic3 were subsequently cured of this plasmid by exploitation of the sacB gene present on this plasmid, as detailed in the same study.
Phenotypic assays.
Phenotypic tests for antifungal activity, exopolysaccharide (EPS) production, and pathogenicity were carried out as previously described (6), as were phenotypic microarrays (Biolog). Proteolytic activity assays were conducted using the method of Safarik (10) with the modifications described by Schmid and colleagues (11).
Pathogenicity assays.
Pathogenicity scores in the different infection models were assigned as follows. For Caenorhabditis elegans assays, the pathogenicity of each strain was scored by use of the following criteria: (i) visible ill health of the nematodes (reduced locomotive capacity and swollen intestine) at day 2, (ii) percentage of living worms on day 2 of the experiment of ≤70% of the original number, and (iii) a total number of living worms at day 5 (including progeny nematodes) of ≤50. If one, two, or three criteria were met, the pathogenicity score was determined to be 1, 2, or 3, respectively, where 3 indicates a very pathogenic strain (12). Where none of the three criteria were met, a score of 0 was given, indicating a nonpathogenic strain.
For Galleria mellonella assays, bacterial suspensions were diluted as follows: for B. seminalis, B. latens, B. diffusa, and B. arboris, 3.5 × 10⁷ to 4.0 × 10⁷ CFU ml−1 (corresponding to 10 μl culture with an optical density at 600 nm [OD600] of 0.125); for B. metallica and B. contaminans, ∼2.0 × 10⁷ CFU ml−1; and for B. multivorans and B. stabilis, 1.4 × 10⁸ to 1.6 × 10⁸ CFU ml−1. Pathogenicity was assessed by assigning a score for the mean experimental time point by which at least 25%, 50%, 75%, and 100% larvae were dead. Points were assigned as follows: ≥25% dead by 24 h, 4 points; 40 h, 3 points; 48 h, 2 points; and 72 h, 1 point; ≥50% dead by 24 h, 5 points; 40 h, 4 points; 48 h, 3 points; and 72 h, 2 points; ≥75% dead by 24 h, 6 points; 40 h, 5 points; 48 h, 4 points; and 72 h, 3 points; and 100% dead by 24 h, 7 points; 40 h, 6 points; 48 h, 5 points; and 72 h, 4 points. The points assigned for each stage were then added together to give a total of between 0 and 22. This scoring system ensured that scores were weighted to give greater importance to faster killing of large numbers of larvae than to small numbers.
For zebrafish assays, pathogenicity was scored visually on the basis of the absence of a heartbeat, as described previously (6, 13). For infection, zebrafish embryos staged at 30 h postfertilization were microinjected with 200 to 300 CFU directly into the blood circulation and incubated in individual wells at 28°C in E3 medium (6, 13). At least 20 embryos per strain per experiment were analyzed for survival, experiments were performed in triplicate, and Kaplan-Meier plots were created using GraphPad Prism. Significance was determined with a log-rank (Mantel-Cox) test. Zebrafish were kept and handled according to French regulations for animal welfare, and required authorizations were obtained from the Direction Departementale de la Protection des Populations and the Comité d'Éthique pour l'Expérimentation Animale Languedoc-Roussillon (reference IDs 30-189-4 and CEEA-LR-12186, respectively).
Resistance to heat stress.
Strains to be tested were grown overnight in LB broth at 37°C with shaking. The overnight cultures were diluted to an OD600 of 0.5, and 1 ml of each was used to inoculate 50-ml aliquots of LB broth preheated to 42°C. Dilutions of the overnight cultures were plated to allow estimation of the starting number of CFU μl−1 for the experiment. Cells were incubated at 42°C with shaking, and the viable count was monitored by plating dilutions at intervals.
Resistance to osmotic stress.
Strains to be tested were grown overnight in LB broth at 37°C with shaking. Aliquots of 1 ml were harvested by centrifugation and resuspended in 1 ml sterile physiological saline. Dilutions were plated to allow estimation of the starting number of CFU μl−1 for the experiment. Cell suspensions were used to inoculate 50-ml aliquots of LB broth supplemented with additional NaCl to a total concentration of 2 M, to gain an OD600 of 0.5. Cultures were incubated at 37°C with shaking, and viable counts were monitored by plating dilutions at intervals.
Resistance to oxidative stress.
Resistance to oxidative stress was tested by disc diffusion assay. Two types of peroxide, organic (tert-butyl-hydroperoxide) and inorganic (hydrogen peroxide), were used to induce oxidative stress. Dilutions of these peroxides were prepared in sterile water (1% and 5% for tert-butyl-hydroperoxide and 1%, 5%, 10%, 20%, and 30% for hydrogen peroxide). Discs of Whatman 3MM chromatography paper (diameter, 5 mm) were treated with 10-μl aliquots of these solutions. Discs treated with 10 μl sterile water were used as a control. Discs were placed on Mueller-Hinton plates inoculated with either strain H111 or a pC3-null derivative of H111 (H111Δc3). The assay was carried out using the Kirby-Bauer method (14).
Resistance to chlorhexidine.
Resistance to chlorhexidine was tested by disc diffusion assay. Chlorhexidine solutions of 5% and 20% were prepared in sterile water. Discs of Whatman 3MM chromatography paper (diameter, 5 mm) were treated with 10-μl aliquots of these solutions. Discs treated with 10 μl sterile water were used as a control. Discs were placed on Mueller-Hinton plates inoculated with either strain H111 or H111Δc3. The assay was carried out using the Kirby-Bauer method (14).
Transfer of K56-2 pC3 into H111Δc3.
Primers gabDXbaFor and gabDBglRev were used to amplify a region of B. cenocepacia H111 pC3. The resultant fragment was digested with XbaI and BglII and cloned into these sites within R6K-based suicide vector pSHAFT2, to give pSHAFT2-gabD. This plasmid was introduced into K56-2 by conjugation, and single-crossover recombinants were selected. A single-crossover K56-2-pC3::gabD mutant was used as the donor in a triparental mating with MM294/pRK2013 as the helper and H111Δc3Rifr (a spontaneous rifampin-resistant mutant selected after plating a dense H111Δc3 culture on LB medium containing rifampin at 100 μg ml−1 and incubating at 37°C for 3 days) as the recipient. Rifampin- and chloramphenicol-resistant exconjugants were selected and screened by PCR using pC3 origin-specific, ET-12 cblC (encoded on chromosome 2 in B. cenocepacia J2315)-specific, and H111-specific primers (pairs were repAFor and repARev, cblCFor and cblCRev, and R33 For and R33Rev, respectively). An H111Δc3 derivative bearing K56-2 pC3 was selected and used for further experiments.
B. cenocepacia K56-2 genome assembly.
Sequencing reads of the B. cenocepacia K56-2 genome project (Bioproject number PRJNA62783) were downloaded from the NCBI SRA database (accession numbers SRX055452 and SRX072491). Reads were assembled using the CLC Genomics Workbench (v.5.0) application. Contigs were aligned against the B. cenocepacia J2315 reference genome (NCBI RefSeq assembly accession number GCF_000009485.1) using Mummer (v.3.0) software (15). Contigs were assembled into scaffolds based on the Mummer alignment using the Bambus tool from the AMOS (v.2.8) software package (16). The scaffolds mapping onto the J2315 pC3 were annotated using the RAST online service (17).
Cloning of TASs onto pBBR1MCS.
The putative antitoxin genes psbB (of TAS1) and pscA, as well as the candidate TAS2-encoding region, were cloned into the broad-host-range vector pBBR1MCS to give pBBR1MCS::AtoxA. This was done in three sections, as follows. First, psbB, psbC, and psbA were amplified from K56-2 genomic DNA using primers Atox2PstI_F and Atox2BamHI_R. The resultant fragment was digested with PstI and BamHI and cloned into these sites within pBBR1MCS, to give pBBR1MCS-atox2. Second, psaB was amplified using primers Atox1KpnI_F and Atox1ClaI_R. This fragment was digested with KpnI and ClaI and inserted between these sites in pBBR1MCS-atox2, to give pBBR1MCS-atox2-atox1. Finally, pscA was amplified using primers Atox3XbaI_F and Atox3SacI_R. This fragment was digested with XbaI and SacI and cloned into these sites within pBBR1MCS-atox2-atox1 to give pBBR1MCS::AtoxA. The sequence of the inserts was confirmed before transfer of the plasmid into B. cenocepacia K56-2 for pC3 curing.
PCR screen for pC3 presence.
Three sets of primers were used sequentially to screen for pC3 presence by PCR. Once a positive result had been obtained for a given strain, no further PCRs were carried out. These primer pairs, in order of use, were repAFor and repARev, oriCFor1 and oriCRev1, and dolpC3repAFor and dolpC3repARev. The 110 strains tested, plus the positive- and negative-control strains used, are given in Table S3 in the supplemental material. Freshly grown bacterial matter from glycerol stocks of each strain was resuspended in 200 μl TE (Tris-EDTA) buffer (pH 8), to give a slightly turbid suspension. Suspensions were lysed by incubation in rapidly boiling water for 4 min, to give crude boiled lysate DNA to act as the template in the PCRs. Positive PCRs, indicating pC3 presence, gave rise to fragments of the following sizes: for repAFor and repARev, ∼1 kb; for oriCFor1 and oriCRev1, ∼750 bp; and for dolpC3repAFor and dolpC3repARev, ∼1 kb.
Confirmation of Bcc membership by recA sequencing.
A fragment of the recA gene from chromosome 1 was amplified using primers BUR1 and BUR2, as described previously (18). Sequencing was carried out in-house. Sequences were assembled using the CLC Genomics Workbench application with a medium alignment stringency and a minimum aligned read length of 50 nucleotides. Low-quality sequence was trimmed, and conflicts were resolved where possible. The assembled sequences were BLAST aligned against all bacterial DNA sequences within the NCBI nucleotide database (http://www.ncbi.nlm.nih.gov/, accessed 31 May 2012). The three best matches were considered for validating Bcc membership.
Whole-genome PFGE.
Whole-genome pulsed-field gel electrophoresis (PFGE) was carried out as described previously (6).
Southern hybridization.
The Southern hybridization protocol used was designed to detect target sequences showing at least 80% sequence homology to the probe. Assays with the DIG-High Prime DNA labeling and detection starter kit I (Roche Applied Science) were augmented with additional protocols, as described below. Before Southern hybridization was performed, the digoxigenin (DIG) labeling efficiency was evaluated as suggested by the manufacturer (DIG-High Prime DNA labeling and detection starter kit I; Roche Applied Science).
To analyze probe regions for suitability, sequence homology throughout the Bcc was checked by BLAST analysis with all sequenced Bcc strains using CLC Main Workbench (v.6.6.1) software. The probes chosen were named repA (minimum homology, 90%), oriC (minimum homology, 83%), and recA (minimum homology, 95%). The probes chosen were amplified by PCR from B. cenocepacia H111 genomic DNA using primers repAFor and repARev, oriCFor1 and oriCRev1, and BUR1 and BUR2 and purified or gel extracted. The purified products were labeled with DIG for 20 h as described in the manufacturer's protocol (DIG-High Prime DNA labeling and detection starter kit I; Roche Applied Science) and stored at −20°C.
Approximately 2.5 μg of genomic target DNA was digested with EcoRI-HF (NEB), which was subsequently heat inactivated. Digested genomic DNA was briefly incubated at 56°C before loading on a 0.7% agarose (Conda) gel. DIG-labeled molecular weight marker II (Roche Applied Science) was loaded as a standard. The gel was electrophoresed, stained, depurinated, and washed per the manufacturer's instructions.
For blotting, a PosiBlot 30-30 pressure blotter (Stratagene) was used per the manufacturer's instruction. The transfer buffer used was 20× SSC, pH 7 (175.3 g NaCl plus 88.25 g trisodium citrate dehydrate per liter). DNA was covalently cross-linked to the membrane using a CL-1 UV cross-linker (Herolab). Prehybridization and hybridization of the DIG-labeled probe were performed using DIG Easy Hyb hybridization working solution (Roche Applied Science). Chemiluminescent detection was performed using CDP-Star as a substrate per the manufacturer's guidelines.
Between blot assays, the membrane was stripped according to the manufacturer's instructions (DIG-High Prime DNA labeling and detection starter kit I; Roche Applied Science).
Construction of strain H111-hfe3.
The dhfrII (trimethoprim resistance) gene was amplified from plasmid pEX-18Tp using primers dhfrFor and dhfrRev and cloned into pBBR1MCS using the BamHI and HindIII sites within its multiple-cloning site (MCS). The resultant plasmid was digested with Acc651 and XhoI, and a double-stranded oligonucleotide constructed by annealing MikeTFor and MikeTRev was ligated between these sites. This double-stranded oligonucleotide fragment constituted a modified lac promoter, chosen for its tight regulation by LacIq, known as pA1-04/03. This promoter is a composite of the pA1/03 and pA1/04 promoters (19). This plasmid, pBBR1MCS-pMTTP, contained a KpnI-BamHI cassette consisting of dhfrII under the control of the pA1-04/03 promoter.
Two suicide vectors were modified for the construction of B. cenocepacia H111-hfe3. The first of these was based on the pEX18Gm backbone. Two fragments of gene I35_4959, the B. cenocepacia H111 ortholog of queF, were amplified from H111 genomic DNA using primer pairs queFXhoFor and queFKpnRev (to give DNA fragment queFup) and queFdownXbaFor2 and queFdownPstRev2 (to give DNA fragment queFdown). The queF gene on chromosome 1 is nonessential and is involved in the queuosine biosynthesis pathway. The queFup fragment was integrated into the pEX18Gm MCS between the KpnI and XhoI sites, and queFdown was integrated between the XbaI and PstI sites. The pA1-04/03–dhfrII cassette was excised and integrated between the two queF fragments using KpnI and BamHI, to give pEX18Gm-pMT-Tp-queF.
The lac repressor gene, lacI, was placed under the control of the moderately expressed constitutive BBa_J23109 promoter (sequence taken from the Standard Registry of Biological Parts, http://partsregistry.org/wiki/index.php?title=Part:BBa_J23109). To do this, BBa_J23109 was synthesized as two oligonucleotides (dsJ23109For2 and dsJ23109Rev2), which were cloned between the KpnI and HindIII sites of pBluescript II KS. The lacI gene was amplified using primers lacIHindFor and lacIPstRev and cloned between the HindIII and PstI sites present in the vector. Finally, aacI (encoding gentamicin resistance) was amplified from pEX18Gm template DNA using primers GmSmaFor and GmSacIRev and cloned between the SmaI and SacI sites of the MCS, to give pBS-pJ23109-lacI-aacI. The assembled cassette (BBa_J23109-lacI-aacI) was excised using Eco53KI and Acc651 and blunted using the Klenow fragment (Roche Applied Science).
To construct the second suicide vector, pSHAFT2-noncon-pJ23109-lacI-aacI, a nonconserved intergenic pC3 fragment was amplified by PCR using primers pC3nonconKpnF and pC3nonconXbaR and H111 genomic DNA as the template. This fragment was inserted into pSHAFT2 between the KpnI and XbaI sites of the MCS. The resultant plasmid was linearized using EcoRV, which cut in the middle of the pC3 region, and the blunted BBa_J23109-lacI-aacI cassette was integrated at this site to give pSHAFT2-noncon-pJ23109-lacI-aacI.
The two suicide vectors were introduced into B. cenocepacia H111 by conjugation and integrated by double homologous recombination. Correct integration was checked by PCR with suitable primers and by sequencing. The constructed B. cenocepacia strain was named H111-hfe3 and was tested for growth comparable to that of H111 and a low incidence of trimethoprim-resistant colonies bearing pC3. The latter was tested by replica plating spontaneous trimethoprim-resistant colonies on the pC3-selective medium M9ura, which was described previously (6).
Assessment of pC3 stability using strain H111-hfe3.
Prior to the experiment assessing pC3 stability using strain H111-hfe3, growth curves were produced for B. cenocepacia strains H111, H111Δc3, and H111-hfe3 at 37°C in 50-ml aliquots of IST in 250-ml Erlenmeyer flasks to allow calculation of the growth rate of strain H111-hfe3 and comparison with the growth rates of the wt and pC3-null strains. The growth rates of the three strains appeared to be identical, and H111-hfe3 was found to have a doubling time of 44.43 min under these conditions.
In the following experiment, care was taken to maintain all cultures at 37°C and to prewarm the liquid medium to this temperature before inoculation. Triplicate colonies of B. cenocepacia H111-hfe3 were cultured overnight in 5-ml volumes of IST containing 10 μg ml−1 gentamicin to ensure the maintenance of pC3. These were diluted to an OD600 of 0.001 in 50-ml aliquots of IST broth in 250-ml Erlenmeyer flasks and grown for 6 h. These cultures were considered to be generation zero (G0) for the experiment (care was taken to maintain exponential phase for the duration of the experiment, as growth phase can affect plasmid stability) and were diluted to an OD600 of 7.63 × 10⁻⁶ in 50-ml aliquots of IST in 250-ml Erlenmeyer flasks. These cultures were grown for 16 generations (11 h 50 min) to give G16 cells, before dilution was repeated as described above. This process was repeated for a total of 96 generations.
The number of CFU per ml was calculated at G0, G16, G32, G48, G64, G80, and G96 by plating dilutions on IST and IST containing 25 μg ml−1 trimethoprim (to give the number that had lost pC3). Colonies growing on IST containing 25 μg ml−1 trimethoprim were replica plated on M9ura (6), to allow correction for resistance developing by means other than the loss of pC3, such as mutations within lacI. Few such colonies grew, however.
The stability of pC3 was calculated using the method of Proctor (20). Briefly, the data generated by the method described above were used to calculate the fraction of cells containing pC3 (Fpc) and the ratio of plasmid-containing to plasmid-free cells (Rpc). Following this, ln(Fpc) was plotted against time (in generations) on a graph, and this graph was used to estimate a starting value for the mutation rate of plasmid-containing to plasmid-free cells (μ). This was achieved by drawing a line of best fit through the data and calculating its initial gradient to obtain −μ. ln(Rpc) was then plotted against time (in generations), and once again, a line of best fit was drawn through the data, although this line was continued to the point at which Rpc reached zero. The final asymptote of this line, along with the previously estimated value of μ, was used for the calculation of the difference in growth rate between plasmid-free and plasmid-containing cells (δ), using the following formula m = −(μ + δ) (where m is the final gradient of the line of best fit).
The Fpc data were then used to draw a graph using R, and the starting values for μ and δ were used with the equation
| (1) |
where t is time.
R was used to calculate residuals, and these were used to assign weights to each data point, recalculate μ and δ, and draw a new line of best fit on the basis of these weights.
Spectrophotometric analysis of growth rate.
Bacterial cultures of B. cenocepacia H111 and H111Δc3 were grown in 5 ml M9 broth at 37°C overnight. These cultures were used to inoculate 1 ml liquid medium to give an OD600 of 0.01 per well in a 24-well plate. For each strain, 3 biological replicates (from separate colonies on a plate) were set up. For each biological replicate, another three replicates were set up to correct for variance due to technical inaccuracy, so that each biological replicate consisted of three technical ones. Three sterile medium blanks were included per plate. Plates were incubated at 37°C in a Synergy HT multidetection microplate reader (KC4 software, v3.3Rev10; Bio-Tek Instruments, Inc.) without shaking for 48 h. The OD600 was measured every 30 min.
Each experiment was carried out three times. Overall mean values were calculated and data were plotted using the Microsoft Office Excel 2007 program, allowing automatic generation of lines of best fit through linear regression and calculation of the exponential growth rate of each strain. To check for significant differences in growth between the two strains, two growth parameters were compared: mean exponential growth rate and mean saturation OD600. A two-sample t test for independence was performed using Microsoft Office Excel 2007 and including all biological replicates per strain.
RESULTS
pC3 is a nonessential replicon of the Bcc.
We previously reported the construction of pC3-cured derivatives of nine Bcc strains representing 7 different species within the complex, which currently consists of 17 species in total. We have since extended our efforts to the remainder of the complex and have achieved curing in 16 species (see Table S1 in the supplemental material for strains cured as part of this study). In order to carry this out, we cloned an additional antibiotic resistance marker into curing vector pMinic3 (6), so that this vector would confer not only the original trimethoprim resistance but also chloramphenicol resistance. This curing vector works by plasmid incompatibility; it bears the single-copy pC3 origin of replication, and upon introduction into a Bcc cell, it replaces the native pC3 as described previously (6). The single species for which we did not achieve a pC3-null mutant was B. cepacia (strain LMG1222), which showed a high level of intrinsic resistance to both antibiotics.
We carried out a selection of phenotypic tests on the pC3-cured Bcc strains and their wt parents, to allow us to assess whether previously observed pC3-dependent characteristics (most notably, in virulence and antifungal activity) held true for this much broader selection of strains from the complex (Table 1; see Fig. S1 in the supplemental material). Our results were consistent with those presented previously (6), with antifungal activity, virulence in invertebrate models of infection, and proteolytic activity generally being dependent on pC3. Phenotypic microarrays were also carried out to investigate the new panel of pC3-cured strains and showed that the loss of pC3 has few effects upon core metabolic phenotypes (see Tables S4 to S6 in the supplemental material). The most commonly observed pC3-dependent phenotypes across the Bcc were fatty acid utilization (caproic, sorbic, and butyric acids specifically) and utilization of histamine as a nitrogen source. These phenotypes were dependent on pC3 presence in the majority of Bcc strains tested.
TABLE 1.
Phenotypic test results for Bcc wt strains and pC3-null derivatives constructed for this studyh
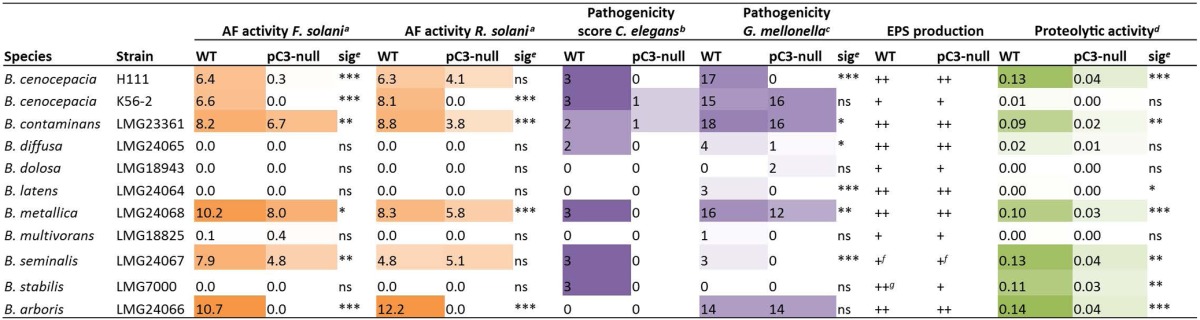
The numbers given show the mean size of the zone of inhibition (mm) between bacteria and fungus in a dual-culture assay.
The pathogenicity score was calculated as described in the Materials and Methods section; the maximum score was 3.
Pathogenicity scores were calculated as described in the Materials and Methods section; the maximum score was 22.
Proteolytic activity is given as a normalized value, calculated as described in the Materials and Methods section.
Significance was determined using Student's t test for both antifungal and proteolytic activity assays and by the Breslow generalized Wilcoxon method for pathogenicity assays carried out in G. mellonella. Significance is indicated as follows: *, 0.01 ≤ P ≤ 0.05; **, 0.001 ≤ P ≤ 0.01; ***, P < 0.001; ns, not significant.
The strain produced very little EPS.
The EPS phenotype was rough and opaque, containing clear bubble areas.
Color depth indicates the intensity of the phenotype tested. Results for strain H111 are included as a reference.
During our attempts to cure Bcc members of pC3, we observed that B. cenocepacia K56-2 was resistant to such curing. This was particularly striking, since we had successfully cured three other B. cenocepacia strains of pC3 (H111, MCO-3, and HI2424) (6). Strain K56-2 is of the ET-12 lineage, unlike the B. cenocepacia strains that we had successfully cured of pC3. As a result, this strain is of particular clinical relevance. B. cenocepacia K56-2 is also more virulent in vertebrate infection models, such as those involving the rat and zebrafish, than H111, MCO-3, and HI2424, and we therefore investigated possible causes for the apparent increased stability of pC3 from strain K56-2 (pC3K56-2) than pC3 from other strains.
B. cenocepacia K56-2 pC3 is stabilized by efficient toxin-antitoxin systems.
The two most likely reasons for the increased stability of B. cenocepacia pC3K56-2 compared with that of pC3 from successfully cured strains were the presence of essential genes or the presence of more efficient toxin-antitoxin systems (TASs). TASs consist of two components: a stable toxin protein and a labile antitoxin that can be a protein or an RNA molecule. When the system is expressed normally, the antitoxin binds the toxin and inactivates it. However, should the genes encoding the system be lost, for example, upon deletion of the replicon carrying them, the antitoxin ceases to be produced and is outlived by the stable toxin, causing growth arrest or death to the cell (for reviews, see references 21 and 22). In order to determine whether TASs prevented the deletion of pC3K56-2, this replicon was transferred into an H111Δc3 (the pC3-null derivative of H111) background, separating any possible effects of the presence of essential genes (which would be dispensable in this new background) from those mediated by TASs. Our pMinic3-based pC3 curing system (6) was then employed to try to remove pC3K56-2 from H111Δc3. Several attempts at pC3 curing failed, however, suggesting that TASs were responsible for the efficient maintenance of pC3K56-2.
At the time of writing of this report, the K56-2 genome is unfinished, although whole-genome shotgun sequencing has been carried out (see Materials and Methods for details). Sequence reads were assembled into contigs in-house, and those contigs appearing to belong to pC3 were searched bioinformatically for core genes, using the list generated by Juhas and colleagues (23), and TASs, using the online tool RASTA-Bacteria (24). It was not clear whether any core genes were present on pC3K56-2, as a key contig could not be unambiguously assigned to pC3. Therefore, efforts were primarily focused on the identification and deactivation of TASs.
Two putative TASs and, additionally, one lone antitoxin are carried on pC3K56-2 (Table 2; see Fig. S2 in the supplemental material). All three antitoxin genes appeared to encode proteins rather than RNAs. One system was predicted to be of the VapBC family (for a review, see reference 25) and was labeled TAS1 (consisting of toxin gene psaA and antitoxin gene psaB), and the other system showed homology to the HicAB family (26) and was termed TAS2. This putative system included a toxin gene (psbA) and two candidate antitoxins (psbB and psbC), either of which (or both) might have been responsible for neutralizing the toxin protein. The candidate lone antitoxin gene bore a HipB domain and was assigned the name atox3. HipAB TASs have a role in the formation of persister cells in E. coli (27). Both TASs (TAS1 and TAS2) had homologs within B. cenocepacia pC3H111, while pscA had no H111 homologue. Three of the proteins encoded by genes carried on pC3K56-2 exhibited amino acid differences compared to the sequences of their H111 orthologues (Table 2), potentially increasing the efficiency of the systems and leading to the observed resistance to curing of pC3K56-2. Alternatively, this could have been due to altered expression of the systems in K56-2.
TABLE 2.
Candidate pC3-encoded TASs of B. cenocepacia K56-2
| Toxin/antitoxin candidatea | Amino acid position | Amino acid inb: |
|
|---|---|---|---|
| K56-2 | H111 homologous sequence | ||
| PsaB | Identical sequence | ||
| PsaA (133) | 6 | Threonine (T, polar, uncharged) | Proline (P, nonpolar, aliphatic) |
| PsbB | Identical sequence | ||
| PsbC (163) | 23 | Arginine (R, polar, positively charged) | Cysteine (C, polar, uncharged) |
| 45 | Tryptophan (W, aromatic) | Serine (S, polar, uncharged) | |
| PsbA (171) | 9 | Glycine (G, nonpolar, aliphatic) | Arginine (R, polar, positively charged) |
| 37 | Leucine (L, nonpolar, aliphatic) | Phenylalanine (F, aromatic) | |
| 50 | Alanine (A, nonpolar, aliphatic) | Glutamate (E, polar, negatively charged) | |
| PscA | No homolog | ||
The size of the proteins (in number of amino acids) is given in parentheses. See Fig. S2 in the supplemental material for the sequences.
One-letter amino acid abbreviations, amino acid polarities, and R-group characteristics are given in parentheses.
In order to maintain toxin inactivation, despite the loss of the TAS-encoding operon upon pC3 curing, a plasmid bearing regions including the antitoxin-encoding genes psaB, psbB, psbC, and pscA was introduced. Using our plasmid incompatibility approach, a pC3-cured derivative of K56-2 was successfully identified, and its pC3-null status was confirmed by a PCR screen with primers annealing at intervals throughout pC3 (results not shown) and pulsed-field gel electrophoresis (see Fig. S3 in the supplemental material). This demonstrated that TASs, and not essential genes, had previously rendered pC3K56-2 incurable.
A range of phenotypic tests was carried out on the pC3-cured K56-2 strain and indicated that nematode pathogenicity and antifungal activity are dependent on pC3 (Table 1), consistent with the findings for other strains of this species. As previously mentioned, ET-12 lineage strains are particularly virulent in higher-organism models of infection, and therefore, pathogenicity assays were carried out in the zebrafish model of infection. Infection with wt K56-2 led to the death of all embryos by 48 h postinfection. As shown previously (13), less than 10 CFU of K56-2 is sufficient to cause embryo mortality within 2 days. Here, 200 to 300 CFU of the pC3-null strain was unable to kill the embryos over a 6-day time period (Fig. 1).
FIG 1.
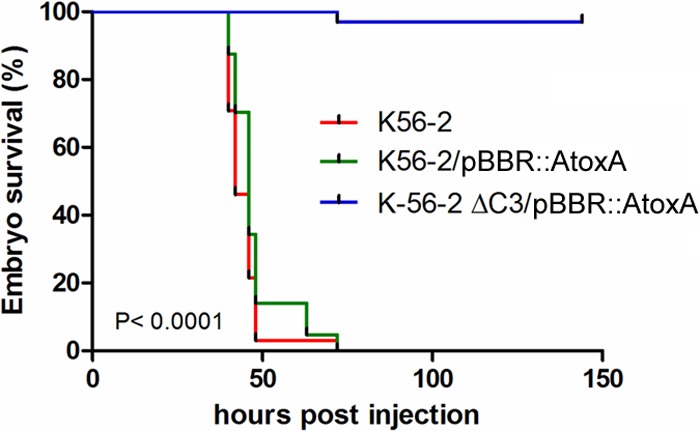
A pC3-cured derivative of B. cenocepacia K56-2 lacked pathogenicity in a zebrafish embryo model of infection. Embryos were microinjected with wt K56-2, K56-2/pBBR::AtoxA, and K56-2 ΔpC/pBBR::AtoxA with, on average, 225, 246, and 253 CFU, respectively, in the blood circulation and incubated at 28°C. Mortality, determined by the absence of a heartbeat, is presented as Kaplan-Meier curves. Significance was determined using the log-rank (Mantel-Cox) test and was found to be <0.001.
The pC3 replicon is highly prevalent in the Bcc.
To date, all sequenced Bcc strains have been found to harbor pC3; however, little is known about the prevalence of pC3 in the natural and host environments. A screen for pC3 presence was conducted to shed light on this matter. Our strain collection holds 110 Bcc isolates from a range of locations and consists of clinical, environmental, and industrial isolates. Oligonucleotide primers were designed to anneal to a region of the highly conserved pC3 origin of replication. The choice of oligonucleotides took into account all available sequenced Bcc genomes, resulting in primers predicted to give rise to an amplified fragment for all sequenced strains (repAFor and repArev) (see Table S2 in the supplemental material). Furthermore, additional primers were used to screen strains that repeatedly gave a negative PCR result. These were oriCFor1 and oriCRev1 (6) and dolpC3repAFor and dolpC3repARev (see Table S2 in the supplemental material). The latter pair was designed using the published B. dolosa AUO158 pC3 repA sequence. A PCR screen using these primers gave a positive result, indicative of the presence of pC3, for 106 of the 110 strains (results not shown). The four Bcc strains that did not give a positive result were subjected to recA sequencing to confirm their status as Bcc members and also to PFGE, which showed that the strains lacked a replicon falling within the size range of pC3 (0.5 to 1.5 Mb) (result not shown). The four Bcc strains that appeared to lack pC3 were further analyzed by Southern hybridization, to allow a more robust conclusion as to whether pC3 was present in these strains. Two probes were tested, and both targeted regions within the highly conserved pC3 origin of replication. Only the control strain gave positive results. Importantly, reprobing the membrane with C1-specific recA primers demonstrated the presence of sufficient DNA for each of the strains. These assays suggested the absence of pC3 from the four candidate strains tested. Two of these strains were of clinical origin, one was of environmental origin, and one was of industrial origin (Table 3).
TABLE 3.
pC3-null Bcc isolates identified from laboratory strain collection
| Species | Strain | Isolation origin |
|---|---|---|
| Burkholderia cepacia | LMG6963 | Soil (Australia) |
| Burkholderia cepacia | Speaky8 | Painting facility |
| Burkholderia stabilis | R3338 | CF patient (Germany) |
| Burkholderia vietnamiensis | R128 | CF patient (USA) |
This screen suggested that pC3 is present in the majority of Bcc isolates. To further investigate the prevalence of pC3, B. cenocepacia H111 was chosen as a model strain, and the stability of its pC3 (pC3H111) was determined.
B. cenocepacia pC3H111 is stable, but dispensable.
Previous experiments had suggested that the rate of spontaneous loss of pC3H111 was too low to use a selectable marker encoded on pC3 to determine the frequency of pC3-null cells occurring per generation. As a result of this, H111 was engineered to allow positive selection of pC3-null cells. This was achieved by the insertion of a lac repressor and gentamicin resistance cassette onto pC3 and a trimethoprim resistance gene under the control of the tightly controlled LacIq-repressible promoter pA1-04/03 (described in detail in Materials and Methods) onto chromosome 1. This resulted in a strain that was normally trimethoprim sensitive but which became trimethoprim resistant upon pC3 loss. This strain also allowed positive selection for pC3 using gentamicin.
A stability assay for pC3H111 based on the method of Proctor (20) was carried out in rich medium at 37°C over 96 generations. This experiment estimated the conversion rate of pC3-containing to pC3-null cells (generally known as μ) to be 0.000147 per generation, meaning that in a population of 6.8 × 10³ pC3-containing cells growing under the conditions tested, 1 pC3-free daughter cell would be expected to arise upon division. The stability experiment also revealed a growth rate differential (δ) between pC3-containing and pC3-null cells. This was demonstrated by the downward curve of the line of best fit (Fig. 2), which is diagnostic for a higher growth rate of plasmid (pC3)-free cells than plasmid-containing cells (20). This growth differential (δ) was estimated to be 0.016595 per generation, meaning that pC3-cured cells have a 44-s shorter generation time than the wild type (44 min 26 s under the experimental conditions used).
FIG 2.
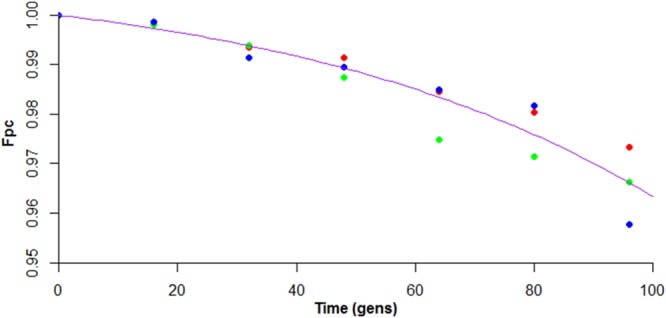
Graph depicting the high stability of pC3H111. The fraction of cells containing pC3 (Fpc) was plotted against time (in generations [gens]). The data points are colored in red, blue, or green according to replicates, and the line of best fit is shown in purple.
These results suggested that pC3 can be spontaneously lost from B. cenocepacia H111 under nutrient-rich conditions and, furthermore, suggested that selective pressures must exist within environmental and clinical niches for the maintenance of pC3.
B. cenocepacia H111 and H111Δc3 appear to grow equally well in nutrient-limited medium.
We had previously found that there was no measurable difference in growth rate in rich medium between H111 and its pC3-null derivative, H111Δc3 (6). To assess whether this remained the case in a nutrient-limited medium, we measured growth spectrophotometrically in M9 minimal salts broth over a 48-h period (see Fig. S4 in the supplemental material). No significant difference in the maximum growth rate or maximum OD600 reached (determined by two-sample t test) was observed between these strains, supporting our earlier observation that the loss of pC3 has little effect on core metabolic functions (6).
We had previously observed that pC3 plays a role in some specific metabolic processes that might be beneficial for survival in soil (pyrimidine, fatty acid, and d-xylose utilization). We had also marked the importance of pC3 for antifungal activity and virulence in model organisms (6). Although these factors would be expected to exert some pressure for maintenance of pC3, it seemed that more general selective pressures might exist. Recent work investigating changes in the B. cenocepacia J2315 transcriptome in response to different stress conditions showed massive upregulation of the chaperonin-encoding genes BCAS0637 and BCAS0638 at 42.5°C compared to the level of regulation at 37°C (202- and 342-fold, respectively) (28). Upregulation of these pC3 genes was also observed under the oxidative stress induced by organic peroxide (23- and 46-fold, respectively) (28). As a consequence of these results, we investigated the potential role of B. cenocepacia H111/pC3 in persistence under stress.
Megaplasmid pC3 confers increased stress resistance upon B. cenocepacia H111.
To investigate the potential role of pC3 in stress resistance, B. cenocepacia strains H111 and H111Δc3 were subjected to tests for persistence under heat, oxidative, chlorhexidine-induced, and osmotic stresses.
Persistence under heat stress was tested at 42°C in two rich media, LB and IST, by measuring the number of CFU over time. Over the course of 6 h at this temperature in LB, H111Δc3 viability dropped 550-fold, whereas H111 viability increased slightly (Fig. 3A). In IST, over the initial 3 h of the experiment, both H111 and H111Δc3 increased in numbers, but over the total course of 20 h, the net result was that H111Δc3 viability dropped 140-fold, whereas the viability of H111 at the conclusion of the experiment was similar to its initial viability (Fig. 3B).
FIG 3.
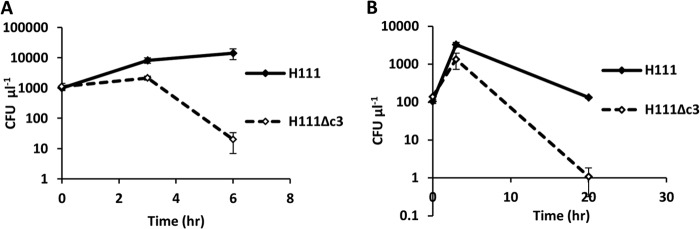
H111 shows greater resistance to heat stress than its pC3-null derivative. Both curves show bacterial viability (in numbers of CFU μl−1) over time at 42°C. (A) Viability in LB broth; (B) viability in Iso-Sensitest broth.
Resistance to oxidative stress was estimated by disc diffusion assay. No difference in resistance to inorganic peroxide (results not shown) was observed between H111 and H111Δc3; however, H111 was insensitive to 1% organic peroxide, whereas H111Δc3 showed decreased resistance (Fig. 4).
FIG 4.
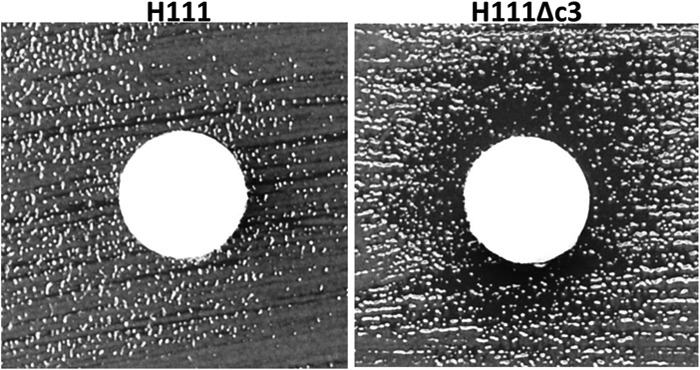
H111 is more resistant to organic peroxide-induced oxidative stress than its pC3-null derivative. Discs soaked in 1% tert-butyl-hydroperoxide were placed on Mueller-Hinton plates inoculated with either H111 or H111Δc3 and incubated for 18 h. A representative disc is shown for each bacterial strain. The discs on the H111Δc3 lawns are surrounded by a clear halo. These are absent from the H111 lawns, indicating the resistance of this strain.
Resistance to chlorhexidine was also estimated by disc diffusion assay. Chlorhexidine is an antiseptic that acts via membrane disruption. It was previously shown to lead to the upregulation of a number of pC3 genes in J2315, including the aforementioned chaperonin-encoding genes BCAS0637 and BCAS0638 (8- and 22-fold, respectively) (29). B. cenocepacia H111 showed very significantly higher resistance to 5% chlorhexidine than H111Δc3 (P = 0.006618; the mean zone of inhibition tested by disc diffusion assay was 5.2 mm for H111 and 6.2 mm for H111Δc3, with a standard error of 0.2 in both cases).
The effect of osmotic stress upon growth was measured in LB containing 2 M NaCl. Bacterial viability was measured over the course of 24 h in this medium. H111 showed an approximately 10-fold higher survival rate than H111Δc3 (Fig. 5A). Changes in colony morphology were observed after 2.5 h in high-osmolarity LB, with H111 colonies retaining the normal morphology for the two strains (well-rounded colonies of ∼3 mm in diameter after 16 h of incubation on LB at 37°C), while H111Δc3 colonies approximately doubled in diameter and had diffuse, wrinkly edges (Fig. 5B).
FIG 5.
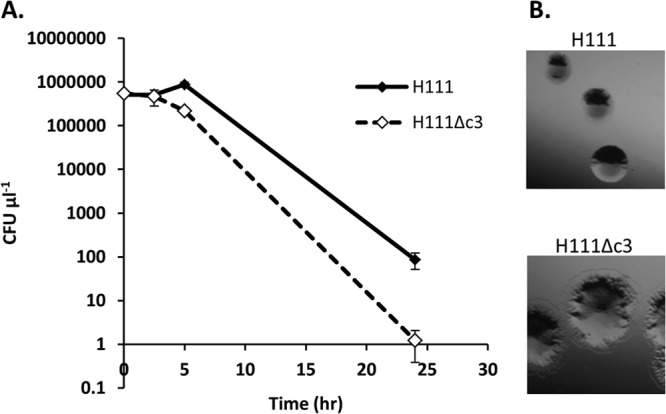
H111 is more resistant to osmotic stress than its pC3-null derivative. (A) Bacteria were grown overnight in LB medium and then subcultured into LB supplemented with additional NaCl to a total concentration of 2 M. Viability was measured before inoculation into high-salt LB broth and after 2.5, 5, and 24 h of incubation at 37°C with shaking in this medium. (B) Morphological differences between H111 and H111Δc3 colonies plated from bacteria grown for 2.5 h growth in high-salt LB. The photographs are to the same scale.
DISCUSSION
In this study, we provide evidence that derivatives of plasmid pC3 are present in all currently described Bcc species and have extended our previous work demonstrating that pC3 is a nonessential replicon, with roles in antifungal activity, virulence, and β-oxidation. Loss of plasmid pC3 results in few changes to the core metabolism, nor does it affect growth in minimal medium or interfere with the strains' ability to colonize plant roots (J. C. Vidal-Quist and E. Mahenthiralingam, unpublished data).
Our previous work had left an open question regarding the reasons for the continued presence of pC3 within nine Bcc species (6). Given the transcriptional and translational burden of the approximately 1,000 genes present on pC3, one would expect to encounter pC3-null Bcc isolates on a regular basis. However, not only do all sequenced Bcc strains harbor pC3 replicons (http://www.burkholderia.com/), but also a screen of 110 Bcc isolates from our in-house strain collection identified only four strains lacking pC3. It is important to bear in mind that we do not know whether the loss of pC3 in these strains had occurred prior to isolation or because of multiple passages in the laboratory. To address this issue, we resuscitated the four pC3-null strains from our original frozen stocks and retested them for the presence of pC3 by PCR. One of the strains, B. stabilis R3338, gave a positive result, suggesting that pC3 had been lost in this strain during cultivation in our laboratory. We would therefore advise caution when subculturing Bcc strains in the laboratory. This might also explain why some of the commonly used model strains show considerable phenotypic variation, particularly with respect to virulence.
The evolutionary fixation of pC3 within the Bcc prompted us to consider more general roles for this replicon. That pC3 must be playing an important role in the environment was made more apparent by the stability assay carried out as part of this study, which showed that a pC3-null derivative of B. cenocepacia H111 had a slight growth advantage over its parent. This result was predictable, given the expected transcriptional and translational burden of carrying pC3, but had not previously been detected due to the small difference (44 s per generation) in growth rates. One reason for this could be that many of the genes located on pC3 are transcribed only in a particular environment or under specific conditions. In support of this, we found that only half of the genes carried by pC3H111 were expressed when the wild-type strain was grown in rich LB medium (6). Moreover, previous work has shown that most genes specifically induced in sterile soil or soil extract in two B. cenocepacia strains were located on chromosome 2 and pC3, suggesting that many of the genes carried by pC3 are important for survival in different environmental niches (30, 31). In line with this, we have shown that pC3H111 plays a role in survival from diverse stresses (heat shock, high osmotic pressure, oxidative stress, and chlorhexidine-induced stress) and could play a role in tolerance to many other, as yet untested stresses that may prevail in some environments. In conclusion, these data support the idea that the translational burden of pC3 is small in commonly used media but is probably high in the natural environment or in an infection host, in which the genes located on pC3 provide a fitness benefit.
This study has revealed two insights into the conservation of pC3 within the Bcc. The first of these is that efficient toxin-antitoxin systems can greatly stabilize pC3. Such systems appear from bioinformatic analysis using RASTA-Bacteria to be present on pC3 in all sequenced Bcc strains. As a result, any stability assay would not give the stability of the replicon alone but, rather, would give a measure of the rate of loss resulting in viable pC3-free cells, as dealt with by Proctor (20). The second general factor that would be expected to limit the occurrence of pC3-null communities in the environment is the importance of this replicon to stress tolerance and environmental fitness. Orthologs of the B. cenocepacia J2315 chaperonin genes BCAS0637 and BCAS0638, which were shown to be upregulated under various stresses (28, 29), were found in several strains of the Bcc species B. cenocepacia, B. multivorans, and B. ambifaria by BLAST analysis. As a result of these factors increasing the stability of pC3 within the Bcc, this nonessential replicon is highly prevalent throughout the complex and could be a useful diagnostic tool for Bcc infection, for example, by PCR amplification of part of its highly conserved replication region.
Supplementary Material
ACKNOWLEDGMENTS
We thank S. Heller and I. Scholl for superb technical assistance and B. Fellinghauer for statistics support.
This work was supported by the Swiss National Science Foundation (project 31003A_ 143773). A.V. was supported by grants from the region Languedoc-Roussillon (Chercheur d'Avenir) and the Marie-Curie Initial Training Network FishForPharma (PITN-GA-2011-289209).
Footnotes
Published ahead of print 13 December 2013
Supplemental material for this article may be found at http://dx.doi.org/10.1128/AEM.03330-13.
REFERENCES
- 1.Vanlaere E, Baldwin A, Gevers D, Henry D, De Brandt E, LiPuma JJ, Mahenthiralingam E, Speert DP, Dowson C, Vandamme P. 2009. Taxon K, a complex within the Burkholderia cepacia complex, comprises at least two novel species, Burkholderia contaminans sp. nov. and Burkholderia lata sp. nov. Int. J. Syst. Evol. Microbiol. 59:102–111. 10.1099/ijs.0.001123-0 [DOI] [PubMed] [Google Scholar]
- 2.Vandamme P, Dawyndt P. 2011. Classification and identification of the Burkholderia cepacia complex: past, present and future. Syst. Appl. Microbiol. 34:87–95. 10.1016/j.syapm.2010.10.002 [DOI] [PubMed] [Google Scholar]
- 3.Drevinek P, Mahenthiralingam E. 2010. Burkholderia cenocepacia in cystic fibrosis: epidemiology and molecular mechanisms of virulence. Clin. Microbiol. Infect. 16:821–830. 10.1111/j.1469-0691.2010.03237.x [DOI] [PubMed] [Google Scholar]
- 4.Coenye T, Vandamme P. 2003. Diversity and significance of Burkholderia species occupying diverse ecological niches. Environ. Microbiol. 5:719–729. 10.1046/j.1462-2920.2003.00471.x [DOI] [PubMed] [Google Scholar]
- 5.Mahenthiralingam E, Urban TA, Goldberg JB. 2005. The multifarious, multireplicon Burkholderia cepacia complex. Nat. Rev. Microbiol. 3:144–156. 10.1038/nrmicro1085 [DOI] [PubMed] [Google Scholar]
- 6.Agnoli K, Schwager S, Uehlinger S, Vergunst A, Viteri DF, Nguyen DT, Sokol PA, Carlier A, Eberl L. 2012. Exposing the third chromosome of Burkholderia cepacia complex strains as a virulence plasmid. Mol. Microbiol. 83:362–378. 10.1111/j.1365-2958.2011.07937.x [DOI] [PubMed] [Google Scholar]
- 7.Clowes RC, Hayes W. 1968. Experiments in microbial genetics. Blackwell Scientific Publications, Oxford, United Kingdom [Google Scholar]
- 8.Sambrook JF, Fritsch EF, Maniatis T. 1989. Molecular cloning: a laboratory manual, 2nd ed. Cold Spring Harbor Laboratory Press, Cold Spring Harbor, NY [Google Scholar]
- 9.Herrero M, de Lorenzo V, Timmis KN. 1990. Transposon vectors containing non-antibiotic resistance selection markers for cloning and stable chromosomal insertion of foreign genes in gram-negative bacteria. J. Bacteriol. 172:6557–6567 [DOI] [PMC free article] [PubMed] [Google Scholar]
- 10.Safarik I. 1987. Thermally modified azocasein—a new insoluble substrate for the determination of proteolytic activity. Biotechnol. Appl. Biochem. 9:323–324 [PubMed] [Google Scholar]
- 11.Schmid N, Pessi G, Deng Y, Aguilar C, Carlier AL, Grunau A, Omasits U, Zhang LH, Ahrens CH, Eberl L. 2012. The AHL- and BDSF-dependent quorum sensing systems control specific and overlapping sets of genes in Burkholderia cenocepacia H111. PLoS One 7:e49966. 10.1371/journal.pone.0049966 [DOI] [PMC free article] [PubMed] [Google Scholar]
- 12.Cardona ST, Wopperer J, Eberl L, Valvano MA. 2005. Diverse pathogenicity of Burkholderia cepacia complex strains in the Caenorhabditis elegans host model. FEMS Microbiol. Lett. 250:97–104. 10.1016/j.femsle.2005.06.050 [DOI] [PubMed] [Google Scholar]
- 13.Vergunst AC, Meijer AH, Renshaw SA, O'Callaghan D. 2010. Burkholderia cenocepacia creates an intramacrophage replication niche in zebrafish embryos, followed by bacterial dissemination and establishment of systemic infection. Infect. Immun. 78:1495–1508. 10.1128/IAI.00743-09 [DOI] [PMC free article] [PubMed] [Google Scholar]
- 14.Bauer AW, Kirby WM, Sherris JC, Turck M. 1966. Antibiotic susceptibility testing by a standardized single disk method. Am. J. Clin. Pathol. 45:493–496 [PubMed] [Google Scholar]
- 15.Kurtz S, Phillippy A, Delcher AL, Smoot M, Shumway M, Antonescu C, Salzberg SL. 2004. Versatile and open software for comparing large genomes. Genome Biol. 5:R12. 10.1186/gb-2004-5-2-r12 [DOI] [PMC free article] [PubMed] [Google Scholar]
- 16.Pop M, Kosack DS, Salzberg SL. 2004. Hierarchical scaffolding with Bambus. Genome Res. 14:149–159. 10.1101/gr.1536204 [DOI] [PMC free article] [PubMed] [Google Scholar]
- 17.Aziz RK, Bartels D, Best AA, DeJongh M, Disz T, Edwards RA, Formsma K, Gerdes S, Glass EM, Kubal M, Meyer F, Olsen GJ, Olson R, Osterman AL, Overbeek RA, McNeil LK, Paarmann D, Paczian T, Parrello B, Pusch GD, Reich C, Stevens R, Vassieva O, Vonstein V, Wilke A, Zagnitko O. 2008. The RAST server: rapid annotations using subsystems technology. BMC Genomics 9:75. 10.1186/1471-2164-9-75 [DOI] [PMC free article] [PubMed] [Google Scholar]
- 18.Payne GW, Vandamme P, Morgan SH, Lipuma JJ, Coenye T, Weightman AJ, Jones TH, Mahenthiralingam E. 2005. Development of a recA gene-based identification approach for the entire Burkholderia genus. Appl. Environ. Microbiol. 71:3917–3927. 10.1128/AEM.71.7.3917-3927.2005 [DOI] [PMC free article] [PubMed] [Google Scholar]
- 19.Lanzer M, Bujard H. 1988. Promoters largely determine the efficiency of repressor action. Proc. Natl. Acad. Sci. U. S. A. 85:8973–8977. 10.1073/pnas.85.23.8973 [DOI] [PMC free article] [PubMed] [Google Scholar]
- 20.Proctor GN. 1994. Mathematics of microbial plasmid instability and subsequent differential growth of plasmid-free and plasmid-containing cells, relevant to the analysis of experimental colony number data. Plasmid 32:101–130. 10.1006/plas.1994.1051 [DOI] [PubMed] [Google Scholar]
- 21.Yamaguchi Y, Park JH, Inouye M. 2011. Toxin-antitoxin systems in bacteria and archaea. Annu. Rev. Genet. 45:61–79. 10.1146/annurev-genet-110410-132412 [DOI] [PubMed] [Google Scholar]
- 22.Gerdes K, Maisonneuve E. 2012. Bacterial persistence and toxin-antitoxin loci. Annu. Rev. Microbiol. 66:103–123. 10.1146/annurev-micro-092611-150159 [DOI] [PubMed] [Google Scholar]
- 23.Juhas M, Stark M, von Mering C, Lumjiaktase P, Crook DW, Valvano MA, Eberl L. 2012. High confidence prediction of essential genes in Burkholderia cenocepacia. PLoS One 7:e40064. 10.1371/journal.pone.0040064 [DOI] [PMC free article] [PubMed] [Google Scholar]
- 24.Sevin EW, Barloy-Hubler F. 2007. RASTA-Bacteria: a web-based tool for identifying toxin-antitoxin loci in prokaryotes. Genome Biol. 8:R155. 10.1186/gb-2007-8-8-r155 [DOI] [PMC free article] [PubMed] [Google Scholar]
- 25.Arcus VL, McKenzie JL, Robson J, Cook GM. 2011. The PIN-domain ribonucleases and the prokaryotic VapBC toxin-antitoxin array. Protein Eng. Des. Sel. 2011 24:33–40. 10.1093/protein/gzq081 [DOI] [PubMed] [Google Scholar]
- 26.Makarova KS, Grishin NV, Koonin EV. 2006. The HicAB cassette, a putative novel, RNA-targeting toxin-antitoxin system in archaea and bacteria. Bioinformatics 22:2581–2584. 10.1093/bioinformatics/btl418 [DOI] [PubMed] [Google Scholar]
- 27.Korch SB, Hill TM. 2006. Ectopic overexpression of wild-type and mutant hipA genes in Escherichia coli: effects on macromolecular synthesis and persister formation. J. Bacteriol. 188:3826–3836. 10.1128/JB.01740-05 [DOI] [PMC free article] [PubMed] [Google Scholar]
- 28.Sass AM, Schmerk C, Agnoli K, Norville PJ, Eberl L, Valvano MA, Mahenthiralingam E. 2013. The unexpected discovery of a novel low-oxygen-activated locus for the anoxic persistence of Burkholderia cenocepacia. ISME J. 7:1568–1581. 10.1038/ismej.2013.36 [DOI] [PMC free article] [PubMed] [Google Scholar]
- 29.Coenye T, Van Acker H, Peeters E, Sass A, Buroni S, Riccardi G, Mahenthiralingam E. 2011. Molecular mechanisms of chlorhexidine tolerance in Burkholderia cenocepacia biofilms. Antimicrob. Agents Chemother. 55:1912–1919. 10.1128/AAC.01571-10 [DOI] [PMC free article] [PubMed] [Google Scholar]
- 30.Yoder-Himes DR, Chain PS, Zhu Y, Wurtzel O, Rubin EM, Tiedje JM, Sorek R. 2009. Mapping the Burkholderia cenocepacia niche response via high-throughput sequencing. Proc. Natl. Acad. Sci. U. S. A. 106:3976–3981. 10.1073/pnas.0813403106 [DOI] [PMC free article] [PubMed] [Google Scholar]
- 31.Nishiyama E, Ohtsubo Y, Nagata Y, Tsuda M. 2010. Identification of Burkholderia multivorans ATCC 17616 genes induced in soil environment by in vivo expression technology. Environ. Microbiol. 12:2539–2558. 10.1111/j.1462-2920.2010.02227.x [DOI] [PubMed] [Google Scholar]
Associated Data
This section collects any data citations, data availability statements, or supplementary materials included in this article.