

Abstract
Objective. To investigate the joint effects of the single nucleotide polymorphisms (SNPs) of genes in the folic acid pathway on homocysteine (Hcy) metabolism. Methods. Four hundred women with normal pregnancies were enrolled in this study. SNPs were identified by MassARRAY. Serum folic acid and Hcy concentration were measured. Analysis of variance (ANOVA) and support vector machine (SVM) regressions were used to analyze the joint effects of SNPs on the Hcy level. Results. SNPs of MTHFR (rs1801133 and rs3733965) were significantly associated with maternal serum Hcy level. In the different genotypes of MTHFR (rs1801133), SNPs of RFC1 (rs1051266), TCN2 (rs9606756), BHMT (rs3733890), and CBS (rs234713 and rs2851391) were linked with the Hcy level adjusted for folic acid concentration. The integrated SNPs scores were significantly associated with the residual Hcy concentration (RHC) (r = 0.247). The Hcy level was significantly higher in the group with high SNP scores than that in other groups with SNP scores of less than 0.2 (P = 0.000). Moreover, this difference was even more significant in moderate and high levels of folic acid. Conclusion. SNPs of genes in the folic acid pathway possibly affect the Hcy metabolism in the presence of moderate and high levels of folic acid.
1. Introduction
The folic acid pathway is essential for hundreds of intracellular transmethylation reactions including DNA methylation and DNA synthesis, processes that are closely related to homocysteine (Hcy) metabolism [1, 2]. Folic acid deficiency and abnormal metabolism of folic acid and Hcy not only play an important role in neural tube defects (NTDs) [3], but also are key factors for congenital heart disease, cleft lip and palate, late pregnancy complications, premature labor different kinds of neurodegenerative and psychiatric diseases, and cancer [3–10]. It was reported that folic acid preconceptional supplementation is effective for NTD prevention. However, it remains unclear whether 30–50% of cases are still unpreventable with folic acid supplementation [2].
Variations in genes that play key roles in the folic acid cycle have been widely investigated, where single nucleotide polymorphisms (SNPs) have been found to be associated with folic acid and Hcy metabolism. The variants of MTHFR and RFC1 were found to interact with Hcy levels [11, 12], while the combined effects of the 2 MTHFR polymorphisms (rs1801133 and rs1801131) were found to be associated with Hcy concentration [13]. However, studies have been limited to one or a few SNPs with joint effects [11, 14–16].
With the rapid development of ongoing high-throughput human gene sequencing and bioinformatics, abundant SNPs can be identified. Support vector machines (SVMs) are a classic supervised machine learning algorithm typically used for classification and regression analysis. SVM has been widely used in solving biological problems, including gene function prediction, gene expression data analysis, and even cancer diagnosis [12, 17, 18]. It has also been applied to the analysis of SNPs.
The aim of the study is to identify the genotypes of 18 SNPs using MassARRAY and to investigate an association between the cumulative effects of 18 SNPs in the 9 genes of the folic acid pathway and Hcy metabolism.
2. Material and Method
2.1. Study Population
Four hundred pregnant women at 11–25 gestational weeks were enrolled in the study conducted at the Obstetrics and Gynecology Hospital of Fudan University, China, from April to May 2011. Women included in the study were not smokers, did not drink alcohol, had no chronic diseases, and were not taking prescription medications. Blood samples were taken from fasting subjects. The serum was separated for the measurement of the concentrations of folic acid and Hcy and the remaining blood clots were used for DNA extraction and genotyping. All individuals enrolled in this study signed the informed consent and the study was approved by the Ethics Committee of the Obstetrics and Gynecology hospital of Fudan University, China.
2.2. Biochemical Measurement of Serum Folic Acid and Hcy Concentrations
Serum folic acid concentration was measured by a chemiluminescent microparticle immunoassay (Architect Folic acid Reagent; Abbott, Lisnamuck, Longford) using the ARCHITECT I Systems following the manufacturer's recommended protocols.
Serum Hcy measurements were carried out by Liquid Chromatography Coupled to Tandem Mass Spectrometry (LC/MS/MS) using an API 3000 LC/MS/MS system (Applied Biosystem) equipped with an electrospray ionization interface that was used in the positive ion mode ([M+H]+) according to the manufacturer's instructions.
2.3. Identification of SNPs Using MassARRAY
18 SNPs in 9 folic acid pathway (Figure 1) related genes that have been documented in the literature to be associated with Hcy related disease were selected in our population [19–22] based on the CHB data using the following criteria: MAF > 0.1 by the Haploview program (version 4.0) (Table 1).
Figure 1.
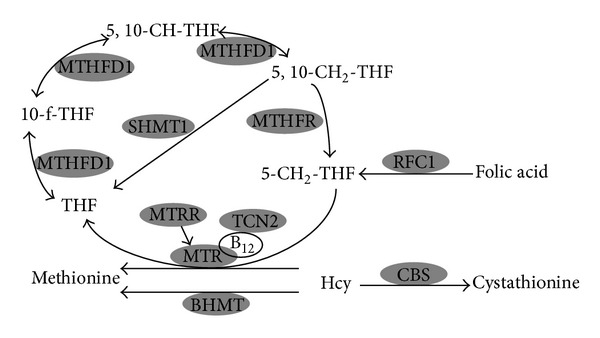
Folic acid gene and homocysteine gene pathways. Hcy: homocysteine; BHMT: betaine Hcy methyltransferase; CBS: cystathionine beta synthase; MTHFD1: methylenetetrahydrofolate dehydrogenase1; MTHFR: methylenetetrahydrofolate reductase; MTR: methionine synthase; MTRR: methionine synthase reductase; RFC1: reduced folate carrier 1; TCN2: transcobalamin2; SHMT1: serine hydroxymethyltransferase1.
Table 1.
9 Folic acid related genes and 16 SNPs.
| SNP | Location | Chromosome site | Gene | Nucleotide and amino acid change | P | MAF | |
|---|---|---|---|---|---|---|---|
| rs1801131 | 11777063 | 1p36.3 | MTHFR | A→C | Glu→Ala | 0.992 | 0.169 |
| rs1801133 | 11778965 | 1p36.3 | MTHFR | C→T | Ala→Val | 0.051 | 0.437 |
| rs3737965 | 11789038 | 1p36.3 | MTHFR | G→A | — | 0.938 | 0.074 |
| rs1805087 | 235115123 | 1q43 | MTR | A→G | Asp→Gly | 0.737 | 0.097 |
| rs162036 | 7938959 | 5p15.31 | MTRR | A→G | Lys→Arg | 0.543 | 0.196 |
| rs1801394 | 7923973 | 5p15.31 | MTRR | A→G | — | 0.424 | 0.249 |
| rs2287780 | 7941304 | 5p15.31 | MTRR | C→T | Arg→Cys | 0.233 | 0.174 |
| rs2303080 | 7931424 | 5p15.31 | MTRR | T→A | Ser→Thr | 0.582 | 0.09 |
| rs3733890 | 78457715 | 5q13.1-q15 | BHMT | G→A | Arg→Gln | 0.434 | 0.3 |
| rs2236225 | 63978598 | 14q24 | MTHFD1 | G→A | Arg→Gln | 0.94 | 0.257 |
| rs1979277 | 18172821 | 17p11.2 | SHMT1 | C→T | Leu→Phe | 0.245 | 0.056 |
| rs1051266 | 45782222 | 21q22.3 | RFC1 | A→G | His→Arg | 0.057 | 0.463 |
| rs234713 | 3360960 | 21q22.3 | CBS | G→A | — | 0.564 | 0.028 |
| rs2851391 | 43360473 | 21q22.3 | CBS | C→T | — | 0.222 | 0.289 |
| rs9606756 | 29336860 | 22q12.2 | TCN2 | A→G | lle→Val | 0.736 | 0.018 |
P: the P value of Hardy-Weinberg; MAF: minimum allele frequency; SNP: single nucleotide polymorphisms; BHMT: betaine homocysteine methyltransferase; CBS: cystathione beta synthase; MTHFD1: methylenetetrahydrofolate dehydrogenase1; MTHFR: methylenetetrahydrofolate reductase; MTR: methionine synthase; MTRR: methionine synthase reductase; RFC1: reduced folate carrier 1; TCN2: transcobalamin2; SHMT1: serine hydroxymethyltransferase1.
Genomic DNA was prepared from peripheral leukocytes using Relax Gene blood DNA System (Relax Gene; TIANGEN, Beijing, China). The genotypes were determined by the Sequenom MassARRAY MALDI-TOF system. Primer sequences of the 18 SNPs were shown in Supplementary Table 1 (see Supplementary Table 1 in the Supplementary Material available online at http://dx.doi.org/10.1155/2014/560183).
2.4. SVM Regression Model
SVM regression model was used to analyze the relationship between the SNPs of genes in the folic acid pathway and the changes in serum Hcy concentration. To minimize the effects of folic acid concentration on Hcy concentration, the residual homocysteine concentration (RHC, RHC = actual Hcy concentration − predicted value with a liner regression function of folic acid) was used as the dependent variable. The predicted RHC was defined as the SNP scores. For the independent variables (features) of the SVM regression model, we coded each SNP as two independent variables. For example, if a SNP has three types, AA, Aa, and aa, its coding features would be only two independent variables, which are feature_AA and feature_Aa, following Table 2. Thus, the input space initially has 30 independent variables for 15 SNPs.
Table 2.
Feature coding of SNPs.
| Feature_AA | Feature_Aa | |
|---|---|---|
| AA | 1 | 0 |
| Aa | 0 | 1 |
| aa | 0 | 0 |
Basically, the SVM regression model was implemented using “SMOReg” algorithm of Weka software package with default parameters, where C equals 1.0; the kernel is polynomial kernel with exponent value equals 1.0. Using all of the 15 SNPs to construct a data model would result in suboptimal accuracy because the different variables may contain overlapping information that disturbs the model-constructing process and thus variable selection was needed. Variable selection out of the total 15 SNP variables was conducted using recursive addition and stepwise addition of the input variables. The basic idea of the method was that, beginning with two features, we tried to add features to the SVM regression model which would improve the correlation coefficient most and then add another feature until none of the added features could improve the model or the improvement was less than the 0.01 correlation coefficient (see van Looy et al.'s paper [23] for more details).
After features selection, a tenfold cross-validation model was used to assess the SVM regression model. In this method, we divided the dataset into 10 subsets of approximately equal size and built the model ten times, each time leaving out one of the subsets as testing set and the others as training sets.
2.5. Statistical Analysis
Statistical analyses were performed using SPSS (SPSS Inc., Chicago, IL, USA), version 16.0 for Windows. A P value of <0.05 was considered statistically significant. The Hardy-Weinberg equilibrium constant was assessed using the chi-squared (χ 2) test. Pairwise linkage disequilibrium of SNPs was estimated using Haploview. The square of the correlation coefficient (r 2) between markers was used to define linkage using the data from the study population. Linear regression was used for detecting the association between folic acid and Hcy concentration, while analysis of variance (ANOVA) was used for the association analysis between SNP and Hcy concentration with serum Hcy concentration as dependent variable, serum SNP genotypes as the fix factor, and folic acid concentration as covariance.
3. Results
3.1. Demographic Characteristics of the Participants
Genotyping results were available for 386 of the 400 subjects (96.5%). A total of 14 subjects were excluded: 5 samples due to sample hemolysis and 9 samples due to sample DNA degradation. Data on serum folic acid and Hcy were available for all subjects. The regression equation used was
| (1) |
(r = −0.385, P < 0.01, Supplementary Figure 1).
All subjects were genotyped for 18 SNPs. Three SNPs were eliminated from further analysis: TCN2 (rs1801198) showed significant (P < 0.05) deviation from the Hardy-Weinberg proportions and CBS (rs5742905) and MTR (rs74767314) were monomorphic. The remaining 15 SNPs are shown in Table 1. The genotyping call rate for each SNP ranged from 96% to 100%. There was no evidence for linkage disequilibrium in our database (P > 0.05, Supplementary Figure 2). There was no significant difference in age, gestational weeks, parities, and pregnancies among each genotype of the 15 SNPs (P > 0.05, Supplementary Tables 2–5).
3.2. The Effects of SNPs on Serum Hcy Concentration Adjusted for Folic Acid Concentration
MTHFR SNPs (rs1801133 and rs3737965) were associated with serum Hcy concentrations which were adjusted for folic acid concentration (Table 3). There were only two cases with homozygous MTHFR SNP (rs3737965). Due to the low frequency of variants for MTHFR SNP (rs3737965) polymorphism, it was not included in the data analysis.
Table 3.
Association between SNPs and Hcy.
| SNP | Wide type | Heterozygous | Homozygous | P | |||
|---|---|---|---|---|---|---|---|
| N | Hcy level | N | Hcy level | N | Hcy level | ||
| MTHFR (rs1801131) | 266 | 4.836 ± 0.064 | 108 | 4.665 ± 0.101 | 11 | 4.824 ± 0.316 | 0.154 |
| MTHFR (rs1801133) | 132 | 4.594 ± 0.089 | 171 | 4.736 ± 0.078 | 83 | 5.23 ± 0.113 | <0.001 |
| MTHFR (rs3737965) | 331 | 4.838 ± 0.058 | 53 | 4.449 ± 0.144 | 2 | 5.098 ± 0.739 | 0.029 |
| MTR (rs1805087) | 312 | 4.804 ± 0.06 | 68 | 4.751 ± 0.128 | 3 | 4.31 ± 0.609 | 0.42 |
| MTRR (rs162036) | 245 | 4.793 ± 0.054 | 125 | 4.785 ± 0.121 | 13 | 4.913 ± 0.376 | 0.562 |
| MTRR (rs1801394) | 214 | 4.817 ± 0.072 | 150 | 4.74 ± 0.086 | 21 | 4.824 ± 0.229 | 0.49 |
| MTRR (rs2287780) | 257 | 4.813 ± 0.066 | 117 | 4.751 ± 0.098 | 8 | 4.596 ± 0.372 | 0.565 |
| MTRR (rs2303080) | 317 | 4.788 ± 0.059 | 61 | 4.819 ± 0.135 | 4 | 4.742 ± 0.525 | 0.838 |
| BHMT (rs3733890) | 183 | 4.835 ± 0.078 | 166 | 4.707 ± 0.082 | 31 | 4.973 ± 0.189 | 0.262 |
| MTHFD1 (rs2236225) | 212 | 4.837 ± 0.072 | 147 | 4.767 ± 0.087 | 26 | 4.574 ± 0.206 | 0.229 |
| SHMT1 (rs1979277) | 341 | 4.875 ± 0.057 | 43 | 4.855 ± 0.161 | 0 | — | 0.68 |
| RFC1 (rs1051266) | 73 | 4.895 ± 0.123 | 210 | 4.753 ± 0.072 | 100 | 4.766 ± 0.105 | 0.227 |
| CBS (rs234713) | 364 | 4.81 ± 0.055 | 22 | 4.503 ± 0.224 | 0 | — | 0.183 |
| CBS (rs2851391) | 200 | 4.75 ± 0.074 | 149 | 4.755 ± 0.86 | 37 | 5.075 ± 0.172 | 0.083 |
| TCN2 (rs9606756) | 373 | 4.793 ± 0.054 | 13 | 4.785 ± 0.291 | 0 | — | 0.979 |
Values are presented as mean ± standard deviation.
P: the P value of analysis of variance between 3 different genotypes of SNPs and homocysteine concentration. The covariate folic acid concentrations were from 14.584 to 15.362 ng/mL. Hcy: homocysteine; SNP: single nucleotide polymorphisms.
Figure 2 shows the effects of SNPs on Hcy concentration in the different genotypes of MTHFR (rs1801133) after the Hcy concentration was adjusted for folic acid concentration. The SNPs MTHFR (rs1801133) CC, RFC1 (rs1051266), and TCN2 (rs9606756) were significantly associated with Hcy concentration (Figures 2(c) and 2(k)). A similar association was observed with the SNPs CBS (rs2851391) in MTHFR (rs1801133) CT and MTHFR (rs3733890) and CBS (rs234713) in MTHFR (rs1801133) TT (Figures 2(m), 2(i), and 2(n)).
Figure 2.

The Relationship between Hcy Concentration and SNPs Based on the Different Genotypes of MTHFR (rs1801133). Hcy: Homocysteine.
3.3. SVM Model of Multiple SNPs and the Residual Hcy Concentration
In the SVM regression, five SNPs were selected: MTHFR (rs1801133, rs1801131, and rs3737965), CBS (rs234713), and BHMT (rs3733890). The weights of the five SNP variables are shown in Table 4 and the relationship between SNP scores and residual Hcy concentration is shown in Figure 3. The correlation coefficient between RHC and SNP scores was 0.275 in training sets and only 0.247 in the cross-validation combined test sets (Supplementary Table 6).
Table 4.
Weights of SNP variables in the SVM model.
| SNP | Genotype | Weight |
|---|---|---|
| MTHFR (rs1801133) | TT | 0.503 |
| MTHFR (rs3737965) | CT | −0.414 |
| CBS (rs234713) | AG | −0.319 |
| BHMT (rs3733890) | AG | −0.264 |
| MTHFR (rs1801131) | CA | 0.196 |
| Constant | −0.000 |
SNP: single nucleotide polymorphism; BHMT: betaine homocysteine methyltransferase; CBS: cystathione beta synthase; MTHFR: methylenetetrahydrofolate reductase.
Figure 3.
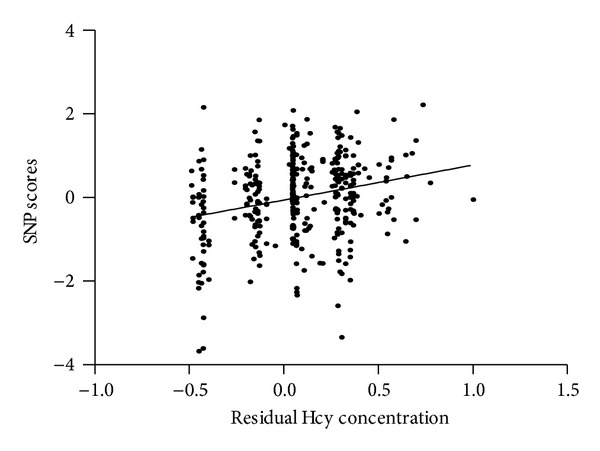
The relationship between SNP scores and residual Hcy concentration. Hcy: homocysteine.
All subjects were divided into four groups according to the 25%, 50% and 75% of the SNP scores (−0.26, 0, and 0.2, resp.). The Hcy concentration was significantly higher in the group with SNP scores of more than 0.2 than that in groups with SNP scores less than 0.2 (P < 0.01, Figure 4(a)). For those with folic acid levels more than 25% (13.1 ng/mL), a possible interaction between Hcy concentration and SNP scores was detected (P < 0.05) (Figures 4(c) and 4(d)). However, for those subjects with folic acid levels less than 25%, SNP scores appeared not to be associated with Hcy concentration (Figure 4(b)).
Figure 4.
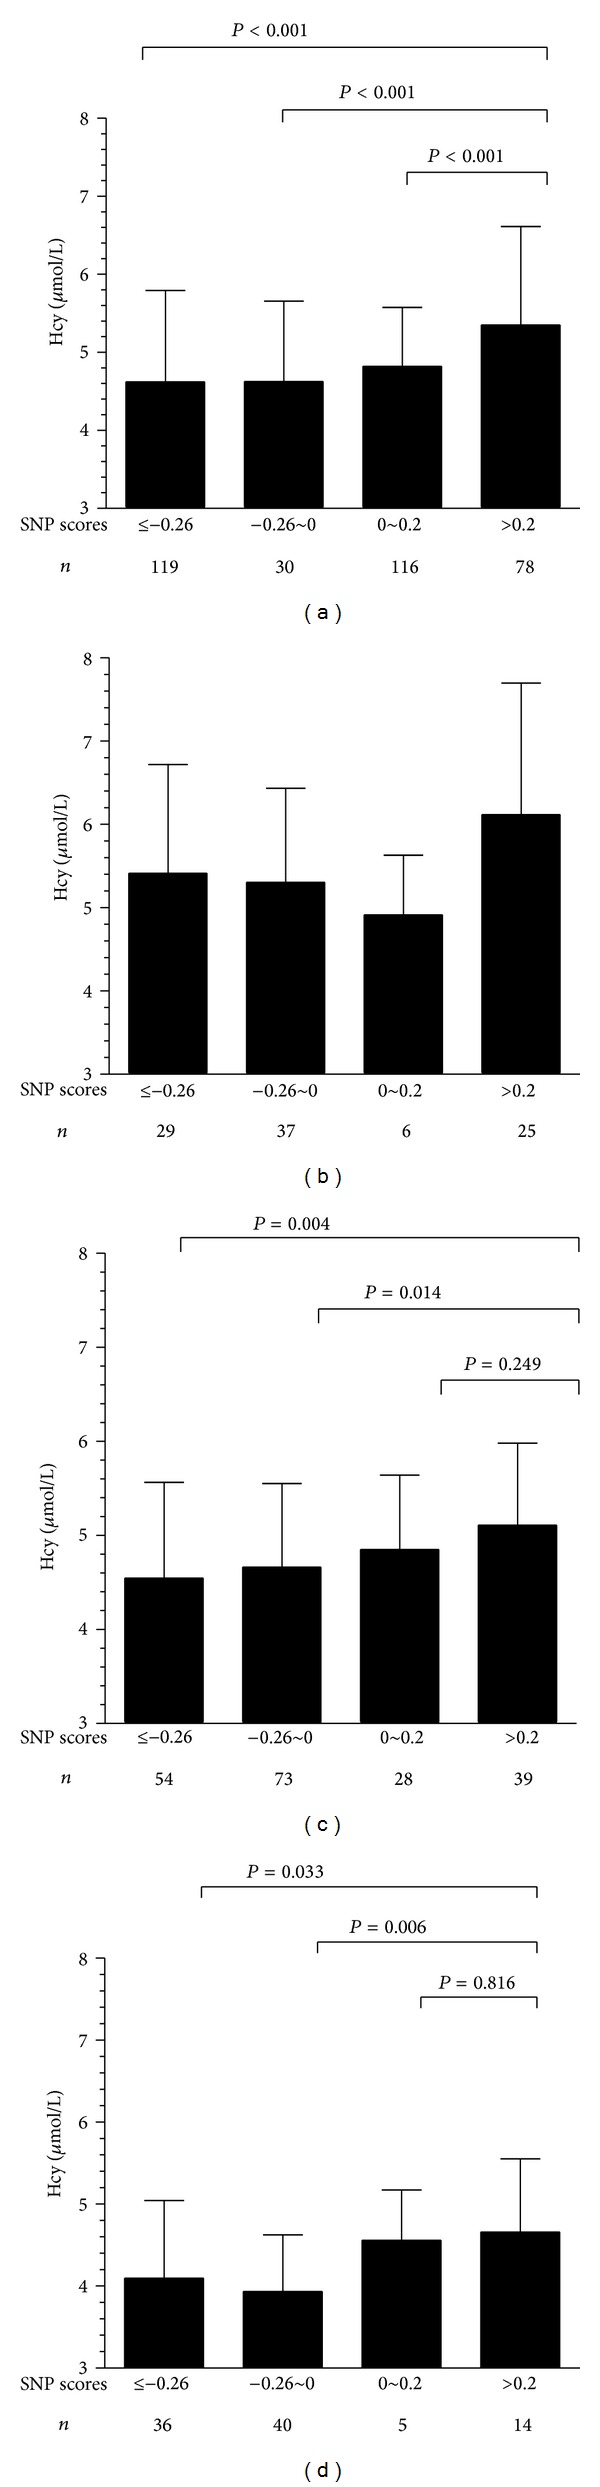
Changes in Hcy among the different groups of SNP scores. (a) In all subjects, (b) low folic acid (less than 13.1 ng/mL (25%)), (c) moderate folic acid concentration (between 13.1 ng/mL (25%) and 18.4 ng/mL (75%)), and (d) high folic acid concentration (more than 18.4 ng/mL (75%).
4. Discussion
We first used SVM regression to predict Hcy concentration from the SNPs of genes in the folic acid pathway after analysis of the joint effect between MTHFR (rs1801133) and other genes related to Hcy metabolism. The results revealed that the integrate SNPs scores of SVM were significantly associated with Hcy concentration, especially at moderate and high levels of folic acid. This finding suggests that the variations in the genes of the folic acid pathway may be an important contributor to Hcy related diseases in women with moderate and high folic acid levels from folic acid supplementation.
Our finding that the SNPs in MTHFR (rs1801133, rs1801131, and rs3737965), RFC1 (rs1051266), CBS (rs2851391 and rs234713), TCN2 (rs9606756), and BHMT (rs3733890) were associated with the Hcy level adjusted for folic acid level is partly consistent with previous studies. Moreover, it is worth noting that the variation of MHTFR (rs1801133) was included, along with other SNPs. The thermolabile protein MTHFR is of great importance for the regulation of available 5-MTHF, which serves as the main circulating folate necessary for Hcy remethylation. MTHFR (rs1801133) can result in 50–60% reduced enzyme activity, while MTHFR (rs1801131) can also decrease MTHFR activity [24, 25]. MTHFR (rs3737965) was moderately associated with plasma folic acid concentration by genome-wide association studies [26]. RFC1 is necessary for the uptake of folic acids such as 5-MTHF and RFC1 (rs1051266) was reported to have an impact on folic acid and Hcy concentrations [19, 22]. BHMT (rs3733890), TCN2 (rs9606756), and CBS (rs2851391 and rs234713) have been reported to be associated with Hcy related diseases [27–29].
High-throughput techniques have spawned a mass of complex biological data. However, analysis of these data creates a bottleneck seen in current studies [30].
In our study, the joint effects of SNPs generated nonlinear, noisy, and complex data sets that also contained a great deal of irrelevant information. Despite the effects of serum folic acid concentration, we have successfully presented a SVM regression model that can evaluate the RHC by five SNPs of genes in the folic acid pathway as inputs. This model translated the complex SNP patterns into a simple output of SNP scores which was significantly related to the changes in Hcy concentration adjusted by serum folic acid concentration, and it was found that 5 out of 15 SNPs were useful as inputs. The RHC was constructed to eliminate the effects of folic acid, for folic acid itself can affect Hcy level. It was suggested that the SVM model could be a potential algorithm for predicting Hcy related diseases.
Furthermore, we found that the Hcy concentration was significantly higher in the group with SNP scores of more than 0.2 than that in groups with SNP scores of less than 0.2, especially for those with folic acid level more than 25%. However, there were no changes in Hcy concentration detected for those subjects with folic acid levels less than 25%. Abnormal metabolism of Hcy is related to many diseases, such as congenital heart disease [5], cleft lip with or without cleft palate [4], and NTDs [6]. The causes of these diseases have not been identified under normal concentrations of folic acid although folic acid periconceptional supplementation can effectively prevent many diseases related to folic acid deficiency. Our study provides the evidence that the joint effects of SNPs in the folic acid pathway may play an important role in Hcy related diseases, especially under sufficient support of folic acid.
In conclusion, the joint effects of SNPs in genes that belong to the folic acid pathway can affect Hcy metabolism especially under normal and high levels of folic acid. Further research that includes a bigger sample size is needed to test this SVM model.
Supplementary Material
The supplementary material includes the basic feather among different SNP Genotypes, primer sequence of 18 SNPs, the relationship between the SNP scores and residual Hcy, linear relationship between folic acid and Hcy concentration and the linkage disequilibrium among SNPs.
Acknowledgments
This work was supported by National Basic Research Program of China (2010CB529500), National Science Fund of China (81270712, 81300506, and 81200449), National Academic-Specific Program of Health Care, the Public Health Care Program of Shanghai (12GWZX0301) from Shanghai Municipal Health Bureau, and the Training Program of Shanghai Academic Leading Talent by Shanghai Committee of Science and Technology and Shanghai Bureau of Human Resources. The authors would like to thank all of the subjects who contributed their time to this study. They would also like to thank Weili Yan and Naiqing Zhao for their assistance with data management.
Abbreviations
- ANOVA:
Analysis of variance
- BHMT:
Betaine-homocysteine methyltransferase
- CBS:
Cystathionine β synthase
- Hcy:
Homocysteine
- LC/MS/MS:
Liquid Chromatography Coupled to Tandem Mass Spectrometry
- LD:
Linkage disequilibrium
- MTHFD1:
Methylenetetrahydrofolate dehydrogenase1
- MTHFR:
Methylenetetrahydrofolate reductase
- MTR:
Methionine synthase
- MTRR:
Methionine synthase reductase
- NTDs:
Neural tube defects
- RFC1:
Reduced folate carrier 1
- RHC:
Residual homocysteine concentration
- SHMT1:
Serine hydroxymethyltransferase1
- SNPs:
Single nucleotide polymorphisms
- SPSS:
Statistical packages for social sciences
- SVM:
Support vector machine
- TCN2:
Transcobalamin2.
Conflict of Interests
There is no conflict of interests about this paper among authors.
Authors' Contribution
Shuang Liang, Yuanpeng Zhou, and Huijun Wang are cofirst authors, equally contributing to the paper.
References
- 1.Levine AJ, Lee W, Figueiredo JC, et al. Variation in folate pathway genes and distal colorectal adenoma risk: a sigmoidoscopy-based case-control study. Cancer Causes and Control. 2011;22(4):541–552. doi: 10.1007/s10552-011-9726-7. [DOI] [PMC free article] [PubMed] [Google Scholar]
- 2.van der Linden IJM, Afman LA, Heil SG, Blom HJ. Genetic variation in genes of folate metabolism and neural-tube defect risk. Proceedings of the Nutrition Society. 2006;65(2):204–215. doi: 10.1079/pns2006495. [DOI] [PubMed] [Google Scholar]
- 3.Stanger O, Fowler B, Pietrzik K, et al. Homocysteine, folate and vitamin B12 in neuropsychiatric diseases: review and treatment recommendations. Expert Review of Neurotherapeutics. 2009;9(9):1393–1412. doi: 10.1586/ern.09.75. [DOI] [PubMed] [Google Scholar]
- 4.van Rooij IALM, Ocké MC, Straatman H, Zielhuis GA, Merkus HMWM, Steegers-Theunissen RPM. Periconceptional folate intake by supplement and food reduces the risk of nonsyndromic cleft lip with or without cleft palate. Preventive Medicine. 2004;39(4):689–694. doi: 10.1016/j.ypmed.2004.02.036. [DOI] [PubMed] [Google Scholar]
- 5.Goldmuntz E, Woyciechowski S, Renstrom D, Lupo PJ, Mitchell LE. Variants of folate metabolism genes and the risk of conotruncal cardiac defects. Circulation: Cardiovascular Genetics. 2008;1(2):126–132. doi: 10.1161/CIRCGENETICS.108.796342. [DOI] [PMC free article] [PubMed] [Google Scholar]
- 6.Taruscio D, Carbone P, Granata O, Baldi F, Mantovani A. Folic acid and primary prevention of birth defects. BioFactors. 2011;37(4):280–284. doi: 10.1002/biof.175. [DOI] [PubMed] [Google Scholar]
- 7.Furness DL, Yasin N, Dekker GA, Thompson SD, Roberts CT. Maternal red blood cell folate concentration at 10–12 weeks gestation and pregnancy outcome. Journal of Maternal-Fetal and Neonatal Medicine. 2012;25(8):1423–1427. doi: 10.3109/14767058.2011.636463. [DOI] [PubMed] [Google Scholar]
- 8.Zhang L, Liu W, Hao Q, Bao L, Wang K. Folate intake and methylenetetrahydrofolate reductase gene polymorphisms as predictive and prognostic biomarkers for ovarian cancer risk. International Journal of Molecular Sciences. 2012;13(4):4009–4020. doi: 10.3390/ijms13044009. [DOI] [PMC free article] [PubMed] [Google Scholar]
- 9.Song J, Sohn K, Medline A, Ash C, Gallinger S, Kim Y. Chemopreventive effects of dietary folate on intestinal polyps in Apc+/- Msh2-/- Mice. Cancer Research. 2000;60(12):3191–3199. [PubMed] [Google Scholar]
- 10.Song J, Medline A, Mason JB, Gallinger S, Kim YI. Effects of dietary folate on intestinal tumorigenesis in the Apc(Min) mouse. Cancer Research. 2000;60(19):5434–5440. [PubMed] [Google Scholar]
- 11.Devlin AM, Clarke R, Birks J, Evans JG, Halsted CH. Interactions among polymorphisms in folate-metabolizing genes and serum total homocysteine concentrations in a healthy elderly population. The American Journal of Clinical Nutrition. 2006;83(3):708–713. doi: 10.1093/ajcn.83.3.708. [DOI] [PubMed] [Google Scholar]
- 12.Brown MPS, Grundy WN, Lin D, et al. Knowledge-based analysis of microarray gene expression data by using support vector machines. Proceedings of the National Academy of Sciences of the United States of America. 2000;97(1):262–267. doi: 10.1073/pnas.97.1.262. [DOI] [PMC free article] [PubMed] [Google Scholar]
- 13.Huang T, Tucker KL, Lee Y, et al. Methylenetetrahydrofolate reductase variants associated with hypertension and cardiovascular disease interact with dietary polyunsaturated fatty acids to modulate plasma homocysteine in Puerto Rican adults. Journal of Nutrition. 2011;141(4):654–659. doi: 10.3945/jn.110.134353. [DOI] [PMC free article] [PubMed] [Google Scholar]
- 14.Saraswathy KN, Asghar M, Samtani R, et al. Spectrum of MTHFR gene SNPs C677T and A1298C: a study among 23 population groups of India. Molecular Biology Reports. 2012;39(4):5025–5031. doi: 10.1007/s11033-011-1299-8. [DOI] [PubMed] [Google Scholar]
- 15.Tsai MY, Bignell M, Yang F, Welge BG, Graham KJ, Hanson NQ. Polygenic influence on plasma homocysteine: association of two prevalent mutations, the 844ins68 of cystathionine β-synthase and A2756G of methionine synthase, with lowered plasma homocysteine levels. Atherosclerosis. 2000;149(1):131–137. doi: 10.1016/s0021-9150(99)00297-x. [DOI] [PubMed] [Google Scholar]
- 16.Komlósi V, Hitre E, Pap E, et al. SHMT1 1420 and MTHFR 677 variants are associated with rectal but not colon cancer. BMC Cancer. 2010;10, article 525 doi: 10.1186/1471-2407-10-525. [DOI] [PMC free article] [PubMed] [Google Scholar]
- 17.Pena-Castillo L, Tasan M, Myers CL, et al. A critical assessment of Mus musculus gene function prediction using integrated genomic evidence. Genome Biology. 2008;9(supplement 1, article S2) doi: 10.1186/gb-2008-9-s1-s2. [DOI] [PMC free article] [PubMed] [Google Scholar]
- 18.Ramaswamy S, Tamayo P, Rifkin R, et al. Multiclass cancer diagnosis using tumor gene expression signatures. Proceedings of the National Academy of Sciences of the United States of America. 2001;98(26):15149–15154. doi: 10.1073/pnas.211566398. [DOI] [PMC free article] [PubMed] [Google Scholar]
- 19.Stanisławska-Sachadyn A, Mitchell LE, Woodside JV, et al. The reduced folate carrier (SLC19A1) c.80G>A polymorphism is associated with red cell folate concentrations among women. Annals of Human Genetics. 2009;73(5):484–491. doi: 10.1111/j.1469-1809.2009.00529.x. [DOI] [PMC free article] [PubMed] [Google Scholar]
- 20.Chen J, Stampfer MJ, Ma J, et al. Influence of a methionine synthase (D919G) polymorphism on plasma homocysteine and folate levels and relation to risk of myocardial infarction. Atherosclerosis. 2001;154(3):667–672. doi: 10.1016/s0021-9150(00)00469-x. [DOI] [PubMed] [Google Scholar]
- 21.Parle-McDermott A, Pangilinan F, O’Brien KK, et al. A common variant in MTHFD1L is associated with neural tube defects and mRNA splicing efficiency. Human Mutation. 2009;30(12):1650–1656. doi: 10.1002/humu.21109. [DOI] [PMC free article] [PubMed] [Google Scholar]
- 22.Chango A, Emery-Fillon N, de Courcy GP, et al. A polymorphism (80G->A) in the reduced folate carrier gene and its associations with folate status and homocysteinemia. Molecular Genetics and Metabolism. 2000;70(4):310–315. doi: 10.1006/mgme.2000.3034. [DOI] [PubMed] [Google Scholar]
- 23.van Looy S, Verplancke T, Benoit D, et al. A novel approach for prediction of tacrolimus blood concentration in liver transplantation patients in the intensive care unit through support vector regression. Critical Care. 2007;11(4, article R83) doi: 10.1186/cc6081. [DOI] [PMC free article] [PubMed] [Google Scholar]
- 24.Finnell RH, Shaw GM, Lammer EJ, Volcik KA. Does prenatal screening for 5,10-methylenetetrahydrofolate reductase (MTHFR) mutations in high-risk neural tube defect pregnancies make sense? Genetic Testing. 2002;6(1):47–52. doi: 10.1089/109065702760093915. [DOI] [PubMed] [Google Scholar]
- 25.van der Put NMJ, Gabreëls F, Stevens EMB, et al. A second common mutation in the methylenetetrahydrofolate reductase gene: an additional risk factor for neural-tube defects? The American Journal of Human Genetics. 1998;62(5):1044–1051. doi: 10.1086/301825. [DOI] [PMC free article] [PubMed] [Google Scholar]
- 26.Hazra A, Kraft P, Lazarus R, et al. Genome-wide significant predictors of metabolites in the one-carbon metabolism pathway. Human Molecular Genetics. 2009;18(23):4677–4687. doi: 10.1093/hmg/ddp428. [DOI] [PMC free article] [PubMed] [Google Scholar]
- 27.Shaw GM, Lu W, Zhu H, et al. 118 SNPs of folate-related genes and risks of spina bifida and conotruncal heart defects. BMC Medical Genetics. 2009;10, article 49 doi: 10.1186/1471-2350-10-49. [DOI] [PMC free article] [PubMed] [Google Scholar]
- 28.Hooshmand B, Solomon A, Kåreholt I, et al. Homocysteine and holotranscobalamin and the risk of Alzheimer disease: a longitudinal study. Neurology. 2010;75(16):1408–1414. doi: 10.1212/WNL.0b013e3181f88162. [DOI] [PubMed] [Google Scholar]
- 29.Riedel BM, Molloy AM, Meyer K, et al. Transcobalamin polymorphism 67A->G, but not 776C->G, affects serum holotranscobalamin in a cohort of healthy middle-aged men and women. Journal of Nutrition. 2011;141(10):1784–1790. doi: 10.3945/jn.111.141960. [DOI] [PubMed] [Google Scholar]
- 30.Listgarten J, Damaraju S, Poulin B, et al. Predictive models for breast cancer susceptibility from multiple single nucleotide polymorphisms. Clinical Cancer Research. 2004;10(8):2725–2737. doi: 10.1158/1078-0432.ccr-1115-03. [DOI] [PubMed] [Google Scholar]
Associated Data
This section collects any data citations, data availability statements, or supplementary materials included in this article.
Supplementary Materials
The supplementary material includes the basic feather among different SNP Genotypes, primer sequence of 18 SNPs, the relationship between the SNP scores and residual Hcy, linear relationship between folic acid and Hcy concentration and the linkage disequilibrium among SNPs.