Abstract
The electrostatic (ΔGel), van der Waals cavity-formation (ΔGvdw), and total (ΔG) solvation free energies for 10 alanine peptides ranging in length (n) from 1 to 10 monomers were calculated. The free energies were computed both with fixed, extended conformations of the peptides and again for some of the peptides without constraints. The solvation free energies, ΔGel, and components ΔGvdw, and ΔG, were found to be linear in n, with the slopes of the best-fit lines being γel, γvdw, and γ, respectively. Both γel and γ were negative for fixed and flexible peptides, and γvdw was negative for fixed peptides. That γvdw was negative was surprising, as experimental data on alkanes, theoretical models, and MD computations on small molecules and model systems generally suggest that γvdw should be positive. A negative γvdw seemingly contradicts the notion that ΔGvdw drives the initial collapse of the protein when it folds by favoring conformations with small surface areas. When we computed ΔGvdw for the flexible peptides, thereby allowing the peptides to assume natural ensembles of more compact conformations, γvdw was positive. Because most proteins do not assume extended conformations, a ΔGvdw that increases with increasing surface area may be typical for globular proteins. An alternative hypothesis is that the collapse is driven by intramolecular interactions. We find few intramolecular h-bonds but show that the intramolecular van der Waal’s interaction energy is more favorable for the flexible than for the extended peptides, seemingly favoring this hypothesis. The large fluctuations in the vdw energy may make attributing the collapse of the peptide to this intramolecular energy difficult.
Keywords: Folding free energy, Solvation effects
Introduction
Measuring and computing solvation free energies (ΔG) is a central problem in solution biophysics. For many biomolecular systems, obtaining desired free energy differences, such as binding, folding, and mutation free energies, is difficult. A common approach to performing these calculations is to express the desired free energy change (ΔGij) between states i and j of the biomolecule in solution as where is the free energy difference between states i and j in vacuum, which is often easy to compute, and ΔGi and ΔGj are the solvation free energies of states i and j, respectively.1,2 This technique has been used with molecular dynamics (MD) simulations, implicit-solvent models,3 such as the Poisson-Boltzmann equation (PBE)4 and generalized Born (GB) models,5 and structured continuum (SC) approaches.6–8
Efforts to develop computationally-convenient models to approximate ΔG have focused on phenomenological decompositions.9 A number of methods have been developed that divide ΔG into different components, each of which can be computed independently. Frequently, for example, ΔG is divided into nonpolar (cavity-formation) and electrostatic components. In the present study, when the peptides are completely solvated, the only forces acting between atoms in the peptide and atoms in the solvent are a 6–12 Lennard-Jones van derWaal’s (vdw) potential and a Coulombic potential. We therefore parsed ΔG into the energy (ΔGvdw) of solvating an uncharged solute cavity of the appropriate size and shape by turning on the vdw forces slowly and the energy (ΔGel) of charging the resulting solvated cavity.10 Clearly, therefore ΔG = ΔGvdw + ΔGel. In practice, ΔGel is commonly approximated with the linear response theory (LRT) or models, including the PBE, GB models, and SC approaches.3,8–12 In contrast, ΔGvdw usually cannot be computed with the LRT, possibly because ΔGvdw includes the energy of forming a dry cavity of the appropriate size and shape. In practice, ΔGvdw is often assumed to be proportional to surface area, as would be expected from surface tension arguments, with a proportionality constant of Γ. Many studies2,13–24 have focused on the computation of Γ, and fundamental issues are still unresolved, including the effect of ΔGvdw and whether it is proportional to surface area, as expected from surface tension arguments.
In previous work25 from this lab we found by free energy simulations in explicit solvent that for extended oligoglycine peptides of lengths (n) ranging from 1–5 monomers ΔGel, ΔGvdw, and ΔG all decreased linearly with increasing n with best-fit lines whose slopes were γel, γvdw, and γ, respectively. We then augmented these findings by finding that for several conformations of decaalanine ΔGel, ΔGvdw, and ΔG all decreased with surface area.26 That γel was negative is easy to rationalize; adding each monomer adds a substantial peptide dipole to a polar solvent. In contrast, that γvdw was negative is difficult to explain. In effect these studies show that for these extended peptides the creation of favorable vdw interactions with water atoms (which are proportional to 1/r6) outweigh the energy penalty of creating a large interface in water. Conversely, experimental studies and simulations have shown that Γ is typically positive for small molecular and model systems,16,23,27 and a positive Γ is also expected from theoretical arguments.18 Additionally, a negative γvdw is puzzling because cavity formation has long been assumed to drive many phenomena including the initial collapse of proteins during folding by favoring configurations with smaller protein-water interfaces,2,21,23 and this assumption implies a positive γvdw.
One possible solution to this puzzle is that the sign of γvdw is irrelevant, as long as its magnitude is small, because the initial collapse of proteins during folding is driven by intramolecular interactions.28 As shown in Results, even when few h-bonds are formed, the average intramolecular vdw energy is indeed more favorable for a flexible peptide containing 6 alanine residues than for the same peptide constrained to an extended conformation. However, the fluctuations in these intramolecular energies were large, potentially casting doubt on the idea that differences in cause collapse. This question merits more thorough investigation.
Our previous work only examined peptides that were in a variety of fixed conformations.25,26 We therefore decided to determine whether such findings would hold for flexible alanine peptides. In this work, we computed ΔGel, ΔGvdw, and ΔG for a series of alanine peptides with n ranging from 1 to 10 constrained, as in our previous study,25 to remain in extended conformations, but here we repeated the calculations for some of these peptides after removing the conformational restraints. Because of the small magnitudes of γvdw, precise calculations of ΔGvdw were required to answer the questions we were trying to address. As we show in Results, our values of ΔGvdw, obtained by integrating dUvdw/dλ over λ as discussed in Methods, have converged because our estimates of dUvdw/dλ had converged at all values of λ. As an additional check, the differences in ΔGel, ΔGvdw, and ΔG between those for a peptide of length n and those for a peptide of length n − 1 were computed by “alchemically” transforming a peptide of length n − 1 into one of length n. We found that the resulting differences in solvation free energies were consistent with our estimates of the absolute solvation free energies. The models and methods used to compute these free energies are discussed in Methods and in the Results and Conclusion sections we compare with experiments and previous computational work.
Methods
Molecular dynamics procedures
All MD simulations were performed with the Amber suite.29 A constant temperature of 300 K was maintained with the Berendsen thermostat, and a constant pressure of 1.0 atm was maintained with the weak-coupling method. Periodic boundary conditions and Ewald summation for the electrostatics were used. SHAKE was used to constrain the hydrogens, allowing a 2 fs time step to be used.
The calculations presented here used the ff03.r1 force field,30 and, to be consistent with this force field, the solvent was modeled as TIP3P waters.31 Unfortunately, the best choice of force field for unstructured peptides, similar to the one that we used here, is an active topic of research.32–35 The conclusions presented in the present paper may be sensitive to our choice of force field, and investigating how these conclusions would differ if we used other force fields could provide an interesting direction of future study.
Structure preparation
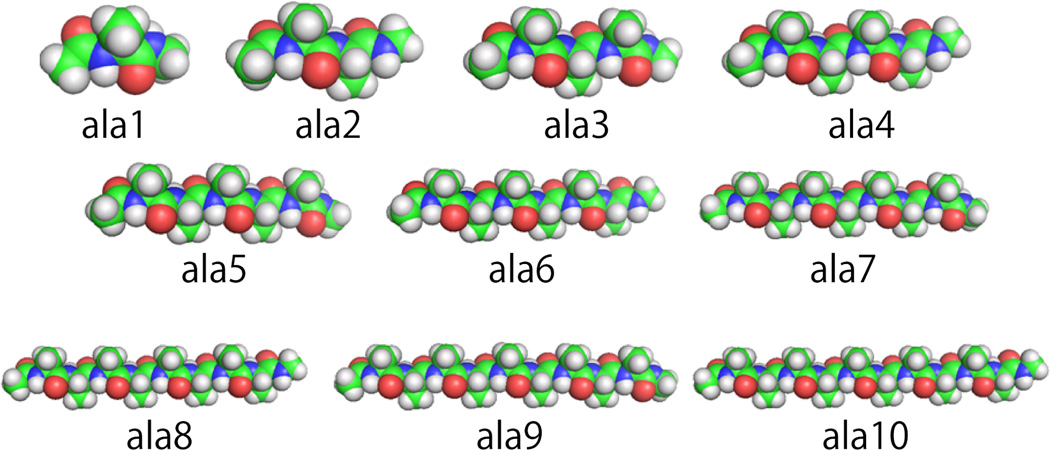
We first prepared extended alanine peptide conformations with MOE,37 with n ranging from 1 (ala1) to 10 (ala10) (Figure 1). The peptide terminals were capped with neutral acetate (ACE) and methyl amide (NME) residues. Short energy minimizations were run on the peptides in GB implicit aqueous solvent.29 Each alanine peptide was then immersed in a rectangular parallelepiped of water with at least 8.0 Å of solvent between the peptide surface and the boundary of the box. The total numbers of water molecules ranged from 392 for the ala1 system to 1804 for the ala10 system. Each structure was then subjected to 500 steps of steepest-descent minimization, 500 steps of conjugate-gradient minimization, and finally equilibrated for 1.2 ns. During this process, harmonic positional restraints were placed on the heavy atoms with force constants of 10 kcal/(mol Å2) to maintain a linear conformation.
Figure 1.
The 10 alanine peptide oligomers examined in this study in their equilibrated extended conformations created in PyMOL.36
Solvation free energy
In the force field used in this study, the nonbonded interaction energy (Uij) between two atoms, i and j, is the sum of two terms. One term is the Coulombic interaction energy,
| (1) |
where qi and qj are the charges on atoms i and j, respectively, ε0 is the permitivity of vacuum, and rij is the distance between the atoms. The other term is the vdw interaction energy,
| (2) |
where εij is the well depth of the Lennard-Jones potential between atoms i and j and , where is the interatomic distance where has a minimum. The potential energy, U, of a molecular configuration is then the sum of the pairwise nonbonded interactions and the bonded interactions.
In the present study, ΔGvdw is defined to be the solvation free-energy difference between a system where the interaction energy between an atom, i, in the alanine peptide and an atom, j, in the solvent, is and a system where Uij = 0, whereas ΔGel is defined to be the free-energy difference between a system where and one where . Although the division of ΔG into ΔG = ΔGvdw + ΔGel is not unique, these energies are well defined and consistent with our force field choice. All nonbonded and bonded interactions between solute atoms or between solvent atoms were those defined in the force field.30
Three methods were used to estimate ΔGvdw and ΔGel from the same simulation windows: thermodynamic integration (TI), free-energy perturbation (FEP), and the Bennett acceptance ratio (BAR) method. We here briefly review these methods.
In TI the free-energy difference (ΔGij) between ensembles i and j is computed by approximate quadrature of the exact expression
| (3) |
where λ is a coupling parameter used to connect U (0), which is the potential energy function of ensemble i, and U (1), which is the potential energy function of ensemble j. 〈dU (λ)/dλ〉λ is the average value of dU (λ)/dλ over the canonical ensemble defined by U (λ).
In FEP, ΔGij can be computed from the similarly exact expression
| (4) |
where β = 1/(kBT), where kB is Boltzmann’s constant and T is the temperature. This formula requires overlap between the sampling of states i and j.
In the BAR method overlap between states i and j is optimized. ΔGij is computed by first solving the equation
| (5) |
numerically for C where n0 and n1 are the numbers of samples taken from samples i and j respectively, and
| (6) |
where Q0 and Q1 are the partition functions in sample windows i and j, respectively. If n0 = n1, then ΔGij can finally be obtained from
| (7) |
The BAR method optimizes the weighted sampling and frequently converges more quickly than either TI or FEP.38
Simulations were run at a series of λ values between 0 and 1 chosen so that adjacent states had good overlap. ΔGij was then computed by summing the free energy differences between adjacent states.
As discussed above, U (0) and U (1) are constrained to be the potential energy functions in ensembles i and j, respectively, but U (λ)’s dependence on λ can be freely chosen to improve computational efficiency. One choice for U (λ) is the simple linear ramp:
| (8) |
and this was the functional form we chose for our calculations of ΔGel. However, this is not an efficient choice for computing ΔGvdw because the resulting integrals contain a well-known pole at λ = 0.39,40 In the present study, we adopted
| (9) |
with α = 0.5 to compute ΔGvdw.
Free energy calculations
For all of the peptides harmonic constraints with force constants of 10 kcal/(mol Å2) were placed on the heavy atoms to maintain the peptides in their extended conformations, and ΔGel, ΔGvdw, and ΔG were computed with the methods discussed above. For the computations of ΔGel, λ space was divided into 20 equally sized windows, whereas for computations of ΔGvdw 50 equally sized windows were required. For each window, 1 ns of equilibration was performed, followed by 5 ns of production MD, from which the free energy differences between adjacent λ values were computed with the methods outlined above, and the total free energies were computed by summing these differences. These calculations were then repeated for peptides of lengths n = 1, 2, 3, 4, 6 without positional constraints on the peptides, allowing them to explore natural ensembles of conformations.
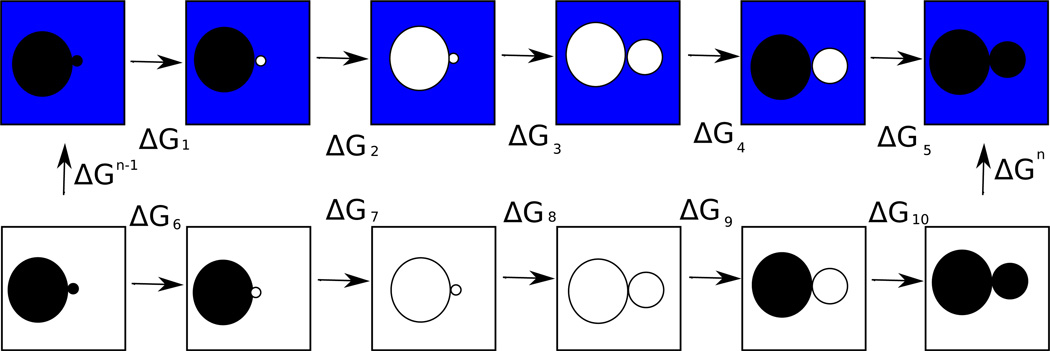
To confirm that the above calculations were converged, we also estimated the changes (ΔΔGel, ΔΔGvdw, and ΔΔG) in ΔGel, ΔGvdw, and ΔG between a peptide of length N and one of length N − 1 by “alchemically” transforming a peptide of length N − 1 into one of length N. These free energy differences could be computed by following the free energy cycle in Figure 2, but in the interests of computational efficiency we made two approximations: we assumed that the peptide adopted the same distribution of conformations in vacuum and solvent, and we assumed that the energy of charging the first N − 1 residues in the presence of the uncharged cap was equal to the energy of charging them in the presence of the uncharged residue N (implying that ΔG2 + ΔG4 − ΔG7 − ΔG9 = 0). The agreement between our alchemical results and those obtained from our direct calculations (Figure 5) indicates that these were reasonable assumptions for these calculations. First, we computed
| (10) |
where was defined by an equation of the form of Eq. 8 except that here λ = 1 corresponded to the initial state, λ = 0 corresponded to the final state, and the summation of the Uij was only taken over pairs of atoms where one member of the pair was in the solute and the other member was in the solvent. If the peptide adopted the same distribution of conformations in vacuum and solvent, then . Next, we computed
| (11) |
where was defined by summing Uij only over pairs of atoms where one member of the pair was in the solute and the other member was in the solvent. Once again, if the peptide adopts the same distribution of conformations in vacuum and solvent, then . Finally, we computed
| (12) |
where was defined by an equation of the form of Eq. 8 except that the summation of the Uij was only taken over pairs of atoms where one member of the pair was in the solute and the other member was in the solvent.
Figure 2.
A free energy cycle that could be used to compute the change (ΔΔG) in solvation energy between a peptide of length N and one of length N − 1. A blue background indicates that a molecule is in explicit solvent, while a white background indicates that it is in vacuum. The large circles represent the first N − 1 residues of an alanine peptide, the small circles represent the cap on the peptide of length N − 1, and the medium-sized circle represents the N’th residue of the peptide of length N. A black circle means that the atoms in question are charged, and a white circle means that they are uncharged.
Figure 5.
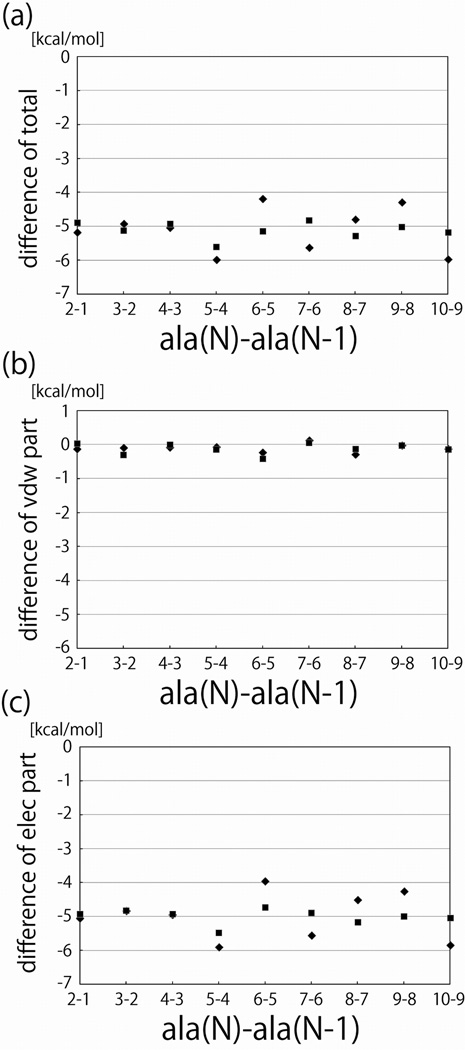
The differences between the solvation free energies of peptides of length n and those of length n − 1 plotted as functions of n. Squares represent the results of alchemical free energy calculations, and diamonds represent the differences between the free energy estimates computed by thermodynamic integration. a. The total solvation free energy. b. The van der Waal’s (cavity-formation) component of the solvation free energy. c. The electrostatic component of the solvation free energy.
Once these energies were obtained, we could obtain , and ΔΔG = ΔΔGel + ΔΔGvdw.
Intramolecular van der Waal’s energies
To investigate the contributions of intramolecular forces to the collapses of these alanine peptides, we computed the average intramolecular vdw energies for both the extended and flexible alanine peptides with 6 alanine residues. For a single conformation,
| (13) |
where the summation was taken over nonbonded pairs in the peptide.
We also broke this energy into attractive and repulsive terms, where and were defined for a single peptide conformation as
| (14) |
and
| (15) |
where the summations were taken over the nonbonded pairs in the peptide. The averages of these energies, and , were then computed by averaging and over the conformations assumed by the peptides during the simulations.
Results
To verify that our results were reasonably converged, we computed all of our solvation free energies with the three methods, TI, FEP, and the BAR method, described in the Methods. For all of the results presented here, these three methods were in good agreement. For example, for the fixed extended peptide with 3 alanine residues, the estimates of ΔGel given by TI, FEP, and the BAR method were −24.18, −24.17, and −24.19 kcal/mol, respectively, and for ΔGvdw, these methods gave 0.94, 1.04, and 0.99 kcal/mol, respectively. Because all of these methods were in agreement we only present the results of TI here.
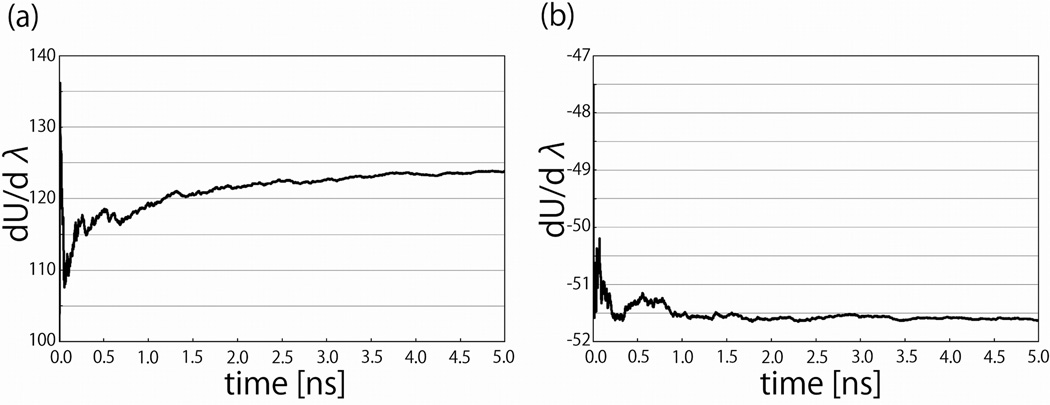
Figure 3 illustrates one reason why computing ΔGvdw required more windows than computing ΔGel. The pointwise estimates of dUvdw (λ)/dλ near the peak converged considerably more slowly than the estimates of dUel (λ)/dλ. In this figure the cumulative running estimates of dUvdw (0.2)/dλ and dUel (0.5)/dλ are shown as functions of simulation sampling time. The depiction of λ = 0.2 was illustrative because this point was particularly difficult to converge, while the choice of λ = 0.5 was arbitrary, as dUel (λ)/dλ converged essentially equally well at all values of λ. The large fluctuations in the running averages at the beginnings of these plots reflect the large variances of the underlying estimates. In these regions of the plots not enough estimates of the energies have been obtained to obtain converged estimates of the means. The estimates of dUvdw (0.2)/dλ had a variance of 960 (kcal/mol)2 and an autocorrelation time estimated from a plot of the autocorrelation function (data not shown) of about 8.0 ps, implying an approximate error in our estimate of the mean of about 1.2 kcal/mol. The estimates of dUel (0.5)/dλ had a variance of 93 (kcal/mol)2 and an autocorrelation time estimated from a plot of the autocorrelation function (data not shown) of about 3.5 ps, implying an approximate error in our estimate of the mean of about 0.3 kcal/mol. The greater difficulty in obtaining converged estimates of dUvdw (0.2)/dλ is therefore attributable primarily to the larger variance of the samples, combined with a small increase in autocorrelation time.
Figure 3.
The cumulative running estimates of the integrands (a. dU (0.2)/dλ for the van der Waal’s (cavity-formation) and b. dU (0.5)/dλ for the electrostatic solvation free energy calculations) of the thermodynamic integration free energy calculations as functions of simulation time for the extended peptide with 10 alanine residues.
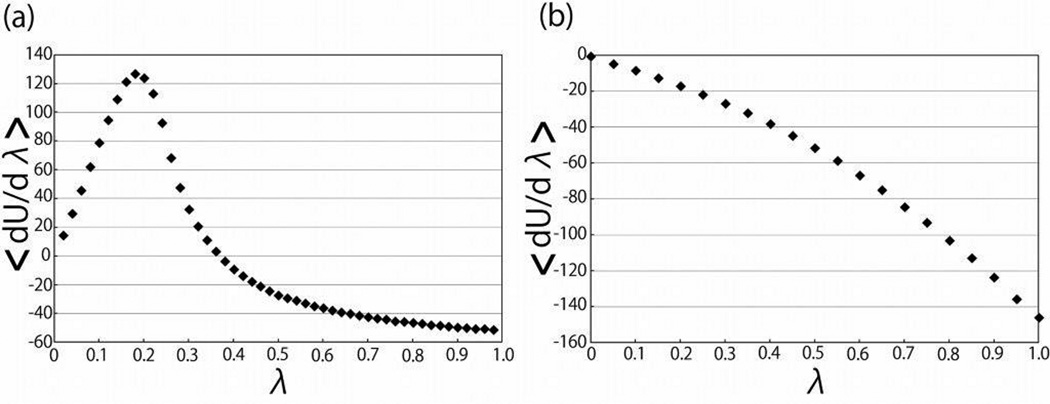
In Figure 4, 〈dUel (λ)/dλ〉 and 〈dUvdw (λ)/dλ〉 are plotted as functions of λ for the extended peptide with 10 alanine residues. The near linearity (small concavity) of the plot of 〈dUel (λ)/dλ〉 as a function of λ is typical for these curves and demonstrates why the LRT has been successful at predicting ΔGel.3,8,9,41 In contrast, the curve of 〈dUvdw (λ)/dλ〉 is sharply peaked, preventing the use of the LRT. To obtain good estimates of ΔGvdw many windows are necessary to accurately sample this peak. The smoothness of these curves is one indication that the calculations were reasonably well converged, but pointwise convergence of the integrand is also necessary to obtain reliable estimates of free energy changes.
Figure 4.
The integrands (〈dU (λ)/dλ〉 for a. the van der Waal’s (cavity-formation) and b. the electrostatic solvation free energy calculations) of the thermodynamic integration free energy calculations as functions of λ for the extended peptide with 10 alanine residues.
In Figure 5 ΔΔGel, ΔΔGvdw, and ΔΔG computed by alchemically changing peptides of lengths n − 1 into peptides of lengths n and the corresponding differences between the absolute solvation free energies for the extended peptides are shown as functions of n. That ΔGel, ΔGvdw, and ΔG were linear in n is evident from this figure because ΔΔGel, ΔΔGvdw, and ΔΔG were independent of n. The agreement between the results of the alchemical transformations and those obtained by taking differences between absolute solvation free energies is another indication that our free energy estimates were converged.
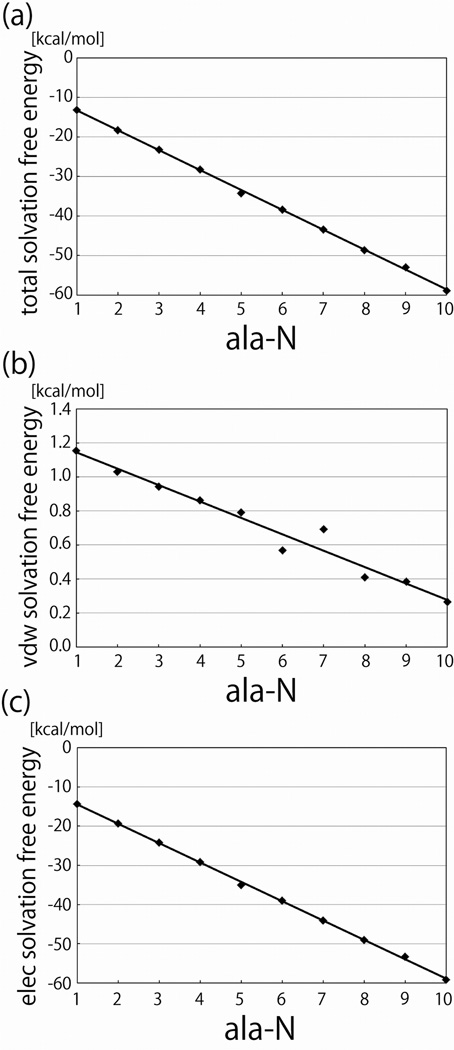
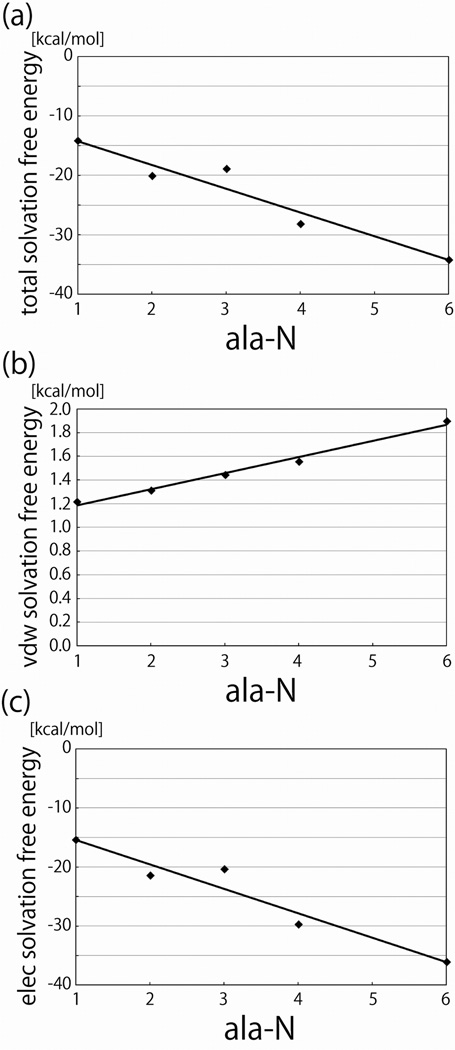
In Figure 6, ΔGel, ΔGvdw, and ΔG for the fixed extended peptides are plotted as functions of n, and Figure 7 shows the same data for the flexible peptides. All of these free energies were linear in n. For both the flexible and fixed alanine peptides γel and γ were negative, and for the fixed extended peptides γvdw was negative. The value of γvdw found here for the fixed extended peptides is similar to that obtained in our previous work,25 taking into account the surface area differences between oligo-gly and oligo-ala. Some of the difference between the values in the two studies can perhaps be attributed to less extensive sampling and correspondingly worse convergence in our previous study. The finding that γvdw is negative for the extended peptides contradicts other studies and some theoretical expectations.2,13,15–23 In particular, a negative γvdw is difficult to reconcile with the notion that ΔGvdw favors states with small surface areas (for a given volume) and thus drives the collapse. In the present case, the attractive interactions between the water and the peptides overwhelms the interface-formation penalty, leading to a negative γvdw. Similarly when we studied the solvation free energy of extended glycine oligomers we also found that ΔG, ΔGel, and ΔGvdw were linear in n.25 These quantities are therefore apparently linear in n, regardless of the presence of the side chain for this type of system.
Figure 6.
Solvation free energies of the extended alanine peptides plotted as functions of the number (N) of residues in the peptide. a. The total solvation free energy. b. The van der Waal’s (cavity-formation) component of the solvation free energy. c. The electrostatic component of the solvation free energy.
Figure 7.
Solvation free energies of the flexible alanine peptides plotted as functions of the number (n) of residues in the peptide. a. The total solvation free energy. b. The van der Waal’s (cavity-formation) component of the solvation free energy. c. The electrostatic component of the solvation free energy.
A possible resolution of our findings of a negative γvdw with expectations of a positive value is suggested by comparing our results for our fixed (constrained) peptides to our analogous results for flexible peptides. As seen from Figure 7, when we measured ΔGvdw for the flexible peptides, which could sample natural ensembles of compact conformations, γvdw was positive. Because most larger proteins do not form extended conformations in solution, that γvdw may be positive for most proteins does not contradict either the results presented here or the results in our previous studies. The idea that ΔGvdw drives collapse by favoring conformations with small surface areas may therefore generally, although not universally, hold for proteins. Regardless, the results presented here indicate that ΔGvdw as defined in this study does not behave as expected for the classical hydrophobic effect.42,43
A potential alternative resolution of the seeming contradiction that longer peptides and proteins collapse despite potentially having a negative γvdw is that the sign of γvdw is not important, as long as γvdw is small, because the collapse is driven by intramolecular interactions. To begin to investigate this hypothesis, we computed , and for our peptide with 6 alanine residues with and without positional constraints (Table 1). Both , and are larger in magnitude for the flexible peptide, as would be expected simply because the atoms in the peptide are, on average, closer together, but ’s increase in magnitude is larger than that of , causing the flexible peptide’s to be more favorable than that of the extended peptide. This observation is consistent with the hypothesis that changes in favor protein collapse. However, of the extended peptide differs from that of the flexible peptide by only 7.26 kcal/mol, and the two energies have standard deviations of 1.56 and 2.63 kcal/mol, respectively. Many of the conformations assumed by the extended peptide have that are less favorable than those of many of the conformations assumed by the flexible peptides. The large fluctuations in these energies may call into question the simple idea that the collapse of the protein is driven by changes in .
Table 1.
The intramolecular van der Waal’s energy and its repulsive and attractive components for both a flexible peptide with 6 alanine residues and a similar peptide constrained to maintain an extended conformation.
| flexible | extended | |
|---|---|---|
| (kcal/mol) | −0.7 | 6.6 |
| (kcal/mol) | 61.0 | 51.2 |
| (kcal/mol) | −61.7 | −44.7 |
Conclusions
In this article, we computed ΔG, ΔGel, and ΔGvdw for a series of 10 alanine peptides ranging in length from 1 to 10 alanine residues. The calculations were performed both with fixed, extended conformations of the peptides and again for some of the peptides without positional constraints. We verified that our free energy estimates were converged by computing them with three different methods, TI, FEP, and the BAR method, which all gave consistent answers. All of ΔGel, ΔGvdw, and ΔG were linear in n, and both γel and γ were negative for both fixed and flexible peptides. Surprisingly, we found that γvdw was negative for the extended peptides. Apparently the favorable interactions between the water and the peptides were more important than the cost of forming a dry bubble. This result contradicts the expectations of theory and simulation results on small molecules and model systems, which predict that ΔGvdw should increase with surface area, and thus n.2,13,15–23
The calculations on flexible peptides, however, may resolve this apparent contradiction. When the peptides were not constrained and allowed to collapse, γvdw was positive. Because most longer peptides and proteins in solvent rarely assume extended conformations but rather assume collapsed or globular conformations, the assumption that γvdw should be positive may be true for most proteins. Our findings are therefore not inconsistent with ΔGvdw being the driving force behind the initial collapse during protein folding.
An alternative hypothesis of protein folding is that the initial collapse is driven by intramolecular interactions.28 As we demonstrate above, the flexible peptide with 6 residues had a more favorable than the extended form. However, the fluctuations in these energies were large, potentially casting doubt on the idea that drives the initial collapse during folding. The contribution of intramolecular energies to collapse merits further investigation.
Systematic changes in ΔG with surface area can help explain the initial collapse of the protein during folding. Our finding of a negative γ indicates the well known fact that water is a marginally good solvent for protein oligomers and favors transfer from the gas phase to water. We did not anticipate that γvdw would be negative for extended and positive for collapsed (flexible) oligomers. Perhaps these results should not have been unexpected because, barring large compensating energy terms, if γvdw were large and negative then proteins would be extended in solution and if it were large and positive then they would immediately collapse. The need to counterbalance large cavity-formation free energies would place strong constraints on biological systems. If this hypothesis is true, then the sign of γvdw is less important than that it is small. We will further examine the pronounced conformational dependence of γvdw in future studies.
Acknowledgement
The Robert A.Welch Foundation (H-0037), the National Science Foundation (CHE-1152876) and the National Institutes of Health (GM-037657) are thanked for partial support of this work. This research was performed in part using the Molecular Science Computing Facility in the William R. Wiley Environmental Molecular Sciences Laboratory, located at the Pacific Northwest National Laboratory and in part using the Extreme Science and Engineering Discovery Environment (XSEDE), which is supported by National Science Foundation grant number OCI-1053575.
References
- 1.Babu CS, Tembe BL. The Role of Solvent Models in Stabilizing Nonclassical Ions. J. Chem. Sci. 1987;98:235–240. [Google Scholar]
- 2.Baldwin R. Energetics of Protein Folding. J. Mol. Biol. 2007;371:283–301. doi: 10.1016/j.jmb.2007.05.078. [DOI] [PubMed] [Google Scholar]
- 3.Cramer CJ, Truhlar DG. Implicit Solvation Models: Equilibria, Structure, Spectra, and Dynamics. Chem. Revs. 1999;99:2161–2200. doi: 10.1021/cr960149m. [DOI] [PubMed] [Google Scholar]
- 4.Grochowski P, Trylska J. Continuum Molecular Electrostatics, Salt effects, and Counterion Binding–A Review of the Poisson–Boltzmann Theory and its Modifications. Biopolymers. 2008;89:93–113. doi: 10.1002/bip.20877. [DOI] [PubMed] [Google Scholar]
- 5.Bashford D, Case DA. Generalized Born Models of Macromolecular Solvation Effects. Ann. Rev. Phys. Chem. 2000;51:129–152. doi: 10.1146/annurev.physchem.51.1.129. [DOI] [PubMed] [Google Scholar]
- 6.Lounnas V, Pettitt BM, Phillips GNA., Jr Global Model of the Protein-Solvent Interface. Biophys. J. 1994;66:601–614. doi: 10.1016/s0006-3495(94)80835-5. [DOI] [PMC free article] [PubMed] [Google Scholar]
- 7.Makarov V, Pettitt BM, Feig M. Solvation and Hydration of Proteins and Nucleic Acids: A Theoretical View of Simulation and Experiment. Acc. Chem. Res. 2002;35:376–384. doi: 10.1021/ar0100273. [DOI] [PubMed] [Google Scholar]
- 8.Lin B, Pettitt BM. Electrostatic Solvation Free Energy of Amino Acid Side Chain Analogs: Implications for the Validity of Electrostatic Linear Response in Water. J. Comput. Chem. 2011;32:878–885. doi: 10.1002/jcc.21668. [DOI] [PubMed] [Google Scholar]
- 9.Levy RM, Gallicchio E. Computer Simulations with Explicit Solvent: Recent Progress in the Thermodynamic Decomposition of Free Energies and in Modeling Electrostatic Effects. Ann. Rev. Phys. Chem. 1998;49:531–567. doi: 10.1146/annurev.physchem.49.1.531. [DOI] [PubMed] [Google Scholar]
- 10.Born M. Volumes and Heats of Hydration of Ions. Z. Phys. 1920;1:45–48. [Google Scholar]
- 11.Tanford C. The Electrostatic Free Energy of Globular Protein Ions in Aqueous Salt Solution. J. Phys. Chem. 1955;59:788–793. [Google Scholar]
- 12.Gilson MK, Rashin A, Fine R, Honig B. On the Calculation of Electrostatic Interactions in Proteins. J. Mol. Biol. 1985;184:503–516. doi: 10.1016/0022-2836(85)90297-9. [DOI] [PubMed] [Google Scholar]
- 13.Lee B. The Physical Origin of the Low Solubility of Nonpolar Solutes in Water. Biopolymers. 1985;24:813–823. doi: 10.1002/bip.360240507. [DOI] [PubMed] [Google Scholar]
- 14.Ashbaugh HS, Kaler EW, Paulaitis ME. A “Universal” Surface Area Correlation for Molecular Hydrophobic Phenomena. J. Am. Chem. Soc. 1999;121:9243–9244. [Google Scholar]
- 15.Lum K, Chandler D, Weeks JD. Hydrophobicity at Small and Large Length Scales. J. Phys. Chem. B. 1999;103:4570–4577. [Google Scholar]
- 16.Huang DM, Chandler D. The Hydrophobic Effect and the Influence of Solute-Solvent Attractions. J. Phys. Chem. B. 2002;106:2047–2053. [Google Scholar]
- 17.Pratt LR. Molecular Theory of Hydrophobic Effects: “She is too Mean to have her Name Repeated”. Ann. Rev. Phys. Chem. 2002;53:409–436. doi: 10.1146/annurev.physchem.53.090401.093500. [DOI] [PubMed] [Google Scholar]
- 18.Chandler D. Interfaces and the Driving Force of Hydrophobic Assembly. Nature. 2005;437:640–647. doi: 10.1038/nature04162. [DOI] [PubMed] [Google Scholar]
- 19.Ghosh T, Kalra A, Garde S. On the Salt-Induced Stabilization of Pair and Many-Body Hydrophobic Interactions. J. Phys. Chem. B. 2005;109:642–651. doi: 10.1021/jp0475638. [DOI] [PubMed] [Google Scholar]
- 20.Rajamani S, Truskett TM, Garde S. Hydrophobic Hydration From Small to Large Lengthscales: Understanding and Manipulating the Crossover. Proc. Natl. Acad. Sci. USA. 2005;102:9475–9480. doi: 10.1073/pnas.0504089102. [DOI] [PMC free article] [PubMed] [Google Scholar]
- 21.Meyer EE, Rosenberg KJ, Israelachvili J. Inaugural Article: Recent Progress in Understanding Hydrophobic Interactions. Proc. Natl. Acad. Sci. USA. 2006;103:15739–15746. doi: 10.1073/pnas.0606422103. [DOI] [PMC free article] [PubMed] [Google Scholar]
- 22.Tomonari S, Hideo S. Integral Equation Study of Hydrophobic Interaction: A Comparison Between the Simple Point Charge Model for Water and a Lennard-Jones Model for Solvent. J. Chem. Phys. 2007;126:144508. doi: 10.1063/1.2718520. [DOI] [PubMed] [Google Scholar]
- 23.Ball P. Water as an Active Constituent in Cell Biology. Chem. Revs. 2008;108:74–108. doi: 10.1021/cr068037a. [DOI] [PubMed] [Google Scholar]
- 24.Ikeguchi M, Nakamura S, Shimizu K. Molecular Dynamics Study on Hydrophobic Effects in Aqueous Urea Solutions. J. Am. Chem. Soc. 123:677–682. doi: 10.1021/ja002064f. [DOI] [PubMed] [Google Scholar]
- 25.Hu CY, Kokubo H, Lynch GC, Bolen DW, Pettitt BM. Backbone Additivity in the Transfer Model of Protein Solvation. Protein Sci. 2010;19:1011–1022. doi: 10.1002/pro.378. [DOI] [PMC free article] [PubMed] [Google Scholar]
- 26.Kokubo H, Hu CY, Pettitt BM. Peptide Conformational Preferences in Osmolyte Solutions: Transfer Free Energies of Decaalanine. J. Am. Chem. Soc. 2011;133:1849–1858. doi: 10.1021/ja1078128. [DOI] [PMC free article] [PubMed] [Google Scholar]
- 27.Gallicchio E, Kubo MM, Levy RM. Enthalpy-Entropy and Cavity Decomposition of Alkane Hydration Free Energies: Numerical Results and Implications for Theories of Hydrophobic Solvation. J. Phys. Chem. B. 2000;104:6271–6285. [Google Scholar]
- 28.Rose GD, Fleming PJ, Banavar JR, Maritan A. A Backbone-Based Theory of Protein Folding. Proc. Natl. Acad. Sci. USA. 2006;103:16623–16633. doi: 10.1073/pnas.0606843103. [DOI] [PMC free article] [PubMed] [Google Scholar]
- 29.Case DA, et al. Amber 12. San Francisco: University of California; 2012. [Google Scholar]
- 30.Duan Y, Wu C, Chowdhury S, Lee MC, Xiong G, Zhang W, Yang R, Cieplak P, Luo R, Lee T, Caldwell J, Wang J, Kollman P. A Point-Charge Force Field for Molecular Mechanics Simulations of Proteins Based on Condensed-Phase Quantum Mechanical Calculations. J. Comput. Chem. 2003;24:1999–2012. doi: 10.1002/jcc.10349. [DOI] [PubMed] [Google Scholar]
- 31.Jorgensen WL. Comparison of Simple Potential Functions for Simulating Liquid Water. J. Chem. Phys. 1983;79:926–935. [Google Scholar]
- 32.Best RB, Buchete N-V, Hummer G. Are Current Molecular Dynamics Force Fields too Helical? Biophys. J. 2008;95:L07–L09. doi: 10.1529/biophysj.108.132696. [DOI] [PMC free article] [PubMed] [Google Scholar]
- 33.Best RB, Mittal J, Feig M, MacKerell AD., Jr Inclusion of Many-Body Effects in the Additive CHARMM Protein CMAP Potential Results in Enhanced Cooperativity of α-Helix and β-Hairpin Formation. Biophys. J. 2012;103:1045–1051. doi: 10.1016/j.bpj.2012.07.042. [DOI] [PMC free article] [PubMed] [Google Scholar]
- 34.Beauchamp KA, Lin Y-S, Das R, Pande VS. Are Protein Force Fields Getting Better? A Systematic Benchmark on 524 diverse NMR Measurements. J. Chem. Theory Comput. 2012;8:1409–1414. doi: 10.1021/ct2007814. [DOI] [PMC free article] [PubMed] [Google Scholar]
- 35.Cino EA, Choy W-Y, Karttunen M. Comparison of Secondary Structure Formation Using 10 Different Force Fields in Microsecond Molecular Dynamics Simulations. J. Chem. Theory Comput. 2012;8:2725–2740. doi: 10.1021/ct300323g. [DOI] [PMC free article] [PubMed] [Google Scholar]
- 36.Schrödinger LLC. The PyMOL Molecular Graphics System, Version 1.3r1. 2010 [Google Scholar]
- 37.Labute P. Protonate3D: Assignment of Ionization States and Hydrogen Coordinates to Macromolecular Structures. Proteins. 2009;75:187–205. doi: 10.1002/prot.22234. [DOI] [PMC free article] [PubMed] [Google Scholar]
- 38.Shirts M, Pande V. Comparison of Efficiency and Bias of Free Energies Computed by Exponential Averaging, the Bennett Acceptance Ratio, and Thermodynamic Integration. J. Chem. Phys. 2005;122:144107. doi: 10.1063/1.1873592. [DOI] [PubMed] [Google Scholar]
- 39.Beutler TC, Mark AE, van Schaik RC, Gerber PR, van Gunsteren WF. Avoiding Singularities and Numerical Instabilities in Free-Energy Calculations Based on Molecular Simulations. Chem. Phys. Lett. 1994;222:529–539. [Google Scholar]
- 40.Zacharias M, Straatsma TP, McCammon JA. Separation-Shifted Scaling, a New Scaling Method for Lennard-Jones Interactions in Thermodynamic Integration. J. Chem. Phys. 1994;100:9025–9031. [Google Scholar]
- 41.Åqvist J, Hansson T. On the Validity of Electrostatic Linear Response in Polar Solvents. J. Phys. Chem. 1996;100:9512–9521. [Google Scholar]
- 42.Kauzmann W. Some factors in the interpretation of protein denaturation. Adv. Protein Chem. 1959;14:1–63. doi: 10.1016/s0065-3233(08)60608-7. [DOI] [PubMed] [Google Scholar]
- 43.Tanford C. Contribution of hydrophobic interactions to the stability of the globular conformation of proteins. J. Am. Chem. Soc. 1962;84:4240–4247. [Google Scholar]


