

Abstract
Bone marrow macrophages (BMMs) share common progenitors with osteoclasts and are critical components of bone–tumor microenvironment; however, their function in prostate tumor growth in the skeleton has not been explored. BMMs are the major source of inflammatory factors and proteases, including cysteine protease cathepsin K (CTSK). In this study, utilizing mice deficient in CTSK, we demonstrate the critical involvement of this potent collagenase in tumor progression in bone. We present the evidence that tumor growth and progression in the bone are impaired in the absence of CTSK. Most importantly, we show for the first time that BMM-supplied CTSK may be involved in CCL2- and COX-2-driven pathways that contribute to tumor progression in bone. Together, our data unravel novel roles for CTSK in macrophage-regulated processes, and provide evidence for close interplay between inflammatory, osteolytic and tumor cell-driven events in the bone–tumor microenvironment.
Keywords: cathepsin K, macrophages, osteoclasts, bone metastasis, prostate cancer, inflammation
INTRODUCTION
Bone is a primary site of metastasis from prostate cancer and most patients with advanced disease experience complications from bone lesions that are incurable.1,2 Although most skeletal metastases in prostate cancer patients appear osteoblastic, these lesions are clearly associated with an increase in osteoclastic activity.1–3 Consistent with the high-turnover state of the bone, the serum and urine markers of bone resorption are frequently elevated in patients with metastatic disease.2,4,5 Mature, bone-resorbing osteoclasts secrete high levels of proteases, particularly one potent collagenase, cysteine protease cathepsin K (CTSK). CTSK deficiency leads to pycnodysostosis in humans and osteopetrosis in mice, conditions underlining the key role of this enzyme in bone resorption.6,7 In prostate and breast cancers, the expression of CTSK is much higher in bone metastases than in the corresponding primary tumors.8,9 We have previously demonstrated that both expression and activity of CTSK correlate positively with osteoclast recruitment and differentiation, and they increase with tumor progression in a SCID-hu model of prostate cancer bone metastasis.10 We have also shown that in addition to osteoclasts, bone marrow macrophages (BMMs) are the major CTSK-expressing cells in bone tumors.10
Macrophages are mediators of inflammatory processes suggested to play distinct functions within the tumor microenviron-ment.11,12 In cancers of breast and prostate, both of which exhibit a significant propensity to develop skeletal lesions, a high density of tumor-associated macrophages correlates positively with poor prognosis.13,14 In contrast, experimental macrophage depletion in mice via homozygous mutation in colony stimulating factor (CSF-1) gene, reduces tumor progression and ablates metastasis.15 BMMs are thought to share common hematopoietic progenitors with osteoclasts;16–18 however, in contrast to the osteoclasts, their involvement in tumor progression in the bone has been under-investigated. BMMs express a number of proteases, including CTSK and other members of the cysteine cathepsin (CTS) family, particularly CTSs B (CTSB) and S (CTSS), activity of which appears to be critical for macrophage invasion and tumor growth.10,19 They have also been shown to express macrophage chemoattractant protein-1 (CCL2) and cyclooxygenase-2 (COX-2), two of the osteoclastogenesis-related genes implicated in bone resorption.20–23 Specifically, interaction of CCL2 with its receptor CCR2 on tumor cells and macrophages is known to be one of the key events in breast and prostate cancer metastases.21,24 A blockade of both tumor- and macrophage-derived CCL2 inhibited macrophage and osteoclast recruitment,21,25 abolished metastasis and prolonged survival of breast and prostate tumor-bearing mice.24–26 Similarly, use of COX-2 inhibitors was shown to reduce tumor growth and improve the efficacy of androgen withdrawal in mice,27 decrease prostate-specific antigen velocity in prostate cancer patients after radical prostatectomy/radiation therapy,28 and to reduce the risk of bone metastasis from breast cancer.29,30
Our previous studies have suggested that overexpression of CTSK concurrent with secretion of pro-inflammatory cytokines (that is, interleukin-6, −8) may represent a possible mechanism by which this protease contributes to tumor progression in the bone.10 This is in line with work by Asagiri et al.,31 who demonstrated CTSK involvement in TLR9-induced cytokine secretion by bone marrow dendritic cells, and suggested its key function in autoimmune and inflammatory diseases. Herein, utilizing X-ray, fluorescence and histological analyses, we demonstrate that progression of prostate tumors in the bone is significantly reduced in CTSK-deficient mice (CTSK KO). Tumor growth and bone osteolysis in wild type (WT) mice correlate with increasing CTSK levels, higher numbers of macrophages and overexpression of COX-2 and CCL2. BMMs deficient in CTSK have impaired ability to invade through collagen I matrix and produce reduced levels of pro-inflammatory factors when interacting with tumor cells. Collectively, these data confirm CTSK as a critical factor in osteoclast-driven bone osteolysis and establish the importance of this potent collagenase in macrophage-regulated inflammatory processes that drive prostate tumor progression in the bone.
RESULTS
Bone degradation and intraosseous tumor growth are impaired in CTSK KO mice
Our previous studies utilizing an experimental SCID-hu intrabone model of bone metastasis suggested that stromal-derived CTSK may be an important factor in colonization and growth of tumors in the skeleton.10 Here, we utilized CTSK KO mice to validate the contribution of host CTSK to tumor-induced bone destruction and progression in the bone. DsRed-expressing PC3 cells were injected intratibially into WT and CTSK KO mice and tumor growth and bone degradation were assessed at 2, 4 and 6 weeks post injection. The initial assessment of tumor growth was performed using whole-body and ex vivo fluorescence analyses. Intraosseous tumors were detectable in both the WT and CTSK KO mice as early as 2 weeks post injection (Figures 1a and b). At 6 weeks, significantly higher integrated fluorescence intensity values were observed for WT mice, suggesting larger tumor size as compared with CTSK KO mice (Figure 1c).
Figure 1.

PC3 bone lesions are smaller in CTSK KO mice. FVB/N/N5 Rag-1 −/−/ CTSK+/+ (WT) and FVB/N/N5 Rag-1 −/−/ CTSK−/− (CTSK KO) mice were injected intratibially with PC3-DsRed cells and imaged at 2,4 and 6 weeks post injection. Tumors were implanted in the right tibiae, and left tibiae were PBS controls. (a) 600 nm RFP fluorescence superimposed over white light whole-body image; (b) ex vivo X-ray and fluorescence images of tumor-bearing WT and KO tibiae; (c) Box and whisker plot showing integrated intensity values calculated for each tumor-bearing tibia based on the RFP values. The data for each time point are representative of at least six mice. Results were analyzed by Mann–Whitney test; P<0.05 indicates significantly larger values of tumor fluorescence in WTas compared with CTSK KO mice, corresponding to larger tumors.
This observable increase in fluorescence correlated with obvious radiographic changes, indicative of accelerated bone resorption in WT mice (Figure 1b). To validate these findings, we performed histological analyses and measured the area of each tibia occupied by the tumor. Our results confirmed significant reduction in tumor growth and bone resorption in CTSK KO mice as compared with WT mice. At the 6-week time point the majority of the tibia area in the WT mice was taken over by the tumor and extensive bone osteolysis was observed in contrast to much smaller tumors in CTSK KO mice (Figure 2). Interestingly, no significant differences in size were found in tumors implanted subcutaneously into WT and CTSK KO mice (Supplementary Figure 2). This suggests that the importance of CTSK in tumor progression is not a general phenomenon, and it may be restricted to areas rich in collagen I such as bone.
Figure 2.

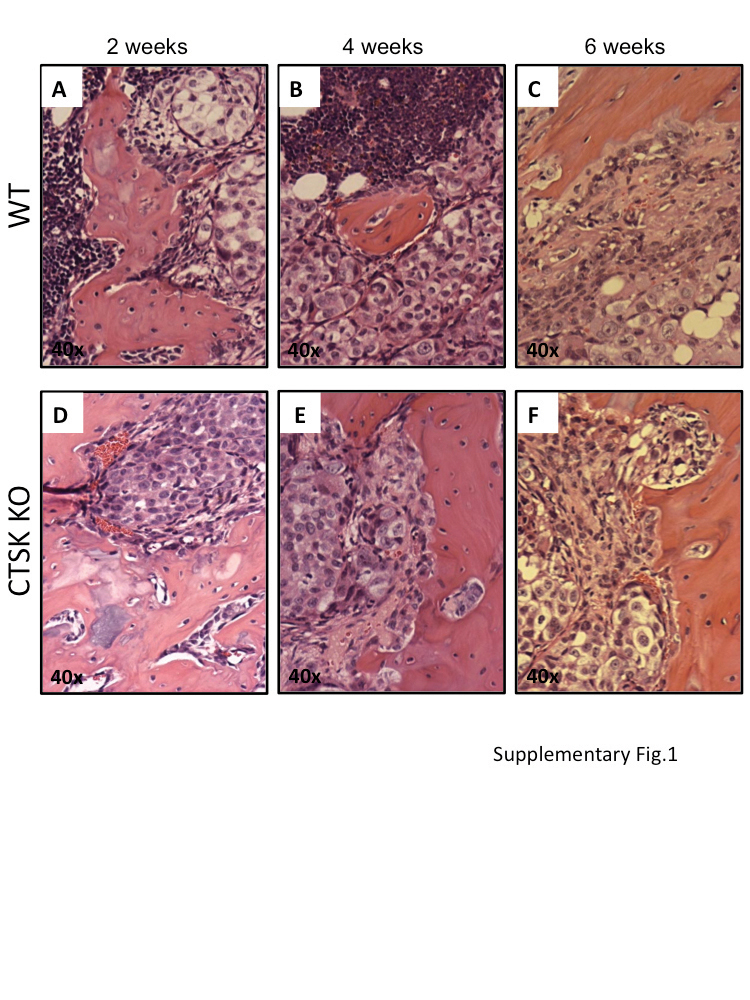
Histological changes reflect slower tumor progression and delayed bone resorption in CTSK-deficient mice. (a–f) Histological analysis of control and tumor-bearing tibia from WT (a–c) and CTSK KO (d–f) mice at 2, 4 and 6 weeks post tumor cell implantation (n>6 mice/group/time point). Composites of multiple × 5 images were used to show entire cross-sections of control and tumor-bearing tibia. Areas occupied by tumor are marked by dotted line. Magnified ( × 40) images of representative sections of tumor area are shown in Supplementary Figure 1. (g) Box and whisker plot showing percentage of tissue occupied by tumors at 2, 4 and 6 weeks. Ratios were calculated by the Axiovision (Zeiss) software based on the measurement of the corresponding areas in µm2. The data for each time point are representative of at least six mice. Results were analyzed by Mann–Whitney test; P = 0.003 indicates reduced tumor growth in CTSK KO mice.
CTSK deficiency leads to increased numbers of osteoclasts at the tumor–bone interface
As osteoclasts are the predominant cells responsible for bone degradation and a major source of CTSK, we first performed tartrate-resistant acid phosphatase (TRAcP) staining to determine if impaired bone–tumor growth and reduced bone degradation in CTSK KO tumors may be due to the reduced osteoclast numbers at the bone–tumor interface. Interestingly, osteoclast numbers were higher in CTSK KO tumors as compared with their WT counterparts (Figures 3a and b). The disparity in numbers of TRAcP-positive cells between CTSK KO and WT bone–tumor microenvironments was mirrored by the differences in levels of TRAcP transcripts (Figure 3c). This result is in agreement with previous reports of increased activity and expression of TRAcP messenger RNA in the long bones of CTSK-deficient mice.32,33 Osteoclast recruitment to tumor–bone interface and resulting bone loss in the WT tumor microenvironment correlated with increasing levels of CTSK (Figure 3d). Approximately 5-fold upregulation of host CTSK transcript levels was observed at 6 weeks after tumor implantation into WT mice. In contrast, only background levels of CTSK transcripts were detected in bone tumors from CTSK KO mice despite the high osteoclast numbers (Supplementary Figure 3A). A possibility of cross-reactivity of murine CTSK probes with human prostate carcinoma cell lines was excluded by performing a comparative reverse-transcriptase PCR (RT–PCR) analysis in WT murine macrophages vs human PC3, DU145 and C4-2B cells (Supplementary Figure 3B). Collectively, these data demonstrated that CTSK expression in the bone–tumor microenvironment is host-derived.
Figure 3.

Osteoclast numbers and TRAcP expression are increased in bone tumors in the absence of CTSK. (a) TRAcP staining (purple) illustrating recruitment of osteoclasts to bone–tumor interface; osteoclasts indicated by red arrows. The images for each time point are representative of at least six mice. (b) Box and whisker plots representing the number of TRAcP-positive osteoclasts in WT (black) and CTSK KO (white) tumor-bearing tibiae at 2, 4 and 6 weeks post tumor cell implantation. Results were analyzed by Mann–Whitney test; P<0.05 indicates significance. (c) TaqMan RT–PCR results for murine TRAcP in WT (black) and CTSK KO (white) tumors. TRAcP expression was normalized to two housekeeping genes, GUSB and HPRT1, and expressed as mean±s.d. Significant differences in the osteoclast numbers are found between WT and CTSK KO microenvironments. (d) TaqMan RT–PCR analysis of host CTSK levels in control and tumor-bearing tibiae of WT mice. Robust CTSK upregulation is observable in 6-week tumors, consistent with accelerated bone resorption. Data were normalized to GUSB and HPRT1 and are the mean of three biological replicates (that is, RNA from three mice)±s.d.
CTSK localizes to BMMs in prostate bone tumors
We next performed immunohistochemical analyses to explore the localization of CTSK in the bone–tumor microenvironment. In line with our previous findings from the SCID-hu model,10 host CTSK was localized predominantly to bone-resorbing osteoclasts (Figure 4a, top panels), which underlines the importance of this potent collagenase in osteolysis. In addition to osteoclasts, a strong CTSK expression was observed in stromal cells resembling the macrophages (Figure 4a, bottom panels). The identity of CTSK-positive cells was confirmed by double immunofluorescence analyses for CTSK and TRAcP (osteoclast marker; Figures 4e – h), and CTSK and F4/80 (macrophage marker; Figures 4j – m). This result confirmed our previous finding that macrophages are the major CTSK-expressing stromal cells in experimental PC3 bone tumors.10 The localization of CTSK to macrophages was further validated in DU145, C4-2B and MDA PCa 2b tumors, which were generated in experimental SCID-hu model according to previously described methods.10,34 All analyzed tumors demonstrated strong presence of CTSK-positive macrophages, as confirmed by co-localization of CTSK with macrophage marker CD68 (Figure 5). Collectively, these results suggest that CTSK-expressing macrophages represent a viable component of the bone–tumor microenvironment, and they may be involved in colonization and growth of cancer cells in the skeleton.
Figure 4.

CTSK localizes to osteoclasts and macrophages in PC3 bone tumors. (a) Immunohistochemical analysis of CTSK expression in 6-week tumors. CTSK localizes to osteoclasts (a, top panels; blue arrowheads; left panel, × 20; right panel, × 40), and macrophages (a, bottom panels; orange arrows; left panel, × 20; right panel, × 40); (b) CTSK KO tumor demonstrating negative staining for CTSK; (c) CTSK immunostaining in WT control tibia; osteoclasts, blue arrowheads, × 10; (d) CTSK immunostaining in CTSK KO control tibia; no CTSK immunoreactivity, × 10; (e–h) double immunofluorescence staining for CTSK (red, e) and TRAcP (green, f) showing CTSK expression in osteoclasts (yellow, g, h), (g) red and green fluorescence merged with DIC (differential interference contrast) image; (h) Red and green fluorescence merged with DIC and DAPI (4′,6-diamidino-2-phenylindole; nuclear dye; blue). (j–m) Double immunofluorescence staining for CTSK (red, j) and F4/80 (green, k) showing CTSK expression in macrophages (yellow, l, m), (l) red and green fluorescence merged with DIC; (m) red and green fluorescence merged with DIC and DAPI (nuclei, blue); bar, 20µm; (i and n) H&E (Hematoxylin & Eosin) images of corresponding tumor sections, × 40.
Figure 5.

Strong CTSK presence is detected in macrophages within DU145, C4-2B and MDA PCa 2b tumors. Double immunolabeling for CTSK (red, a, g, and m) and CD68 (green, b, h, and n) in DU145 (a–f), C4-2B (g–l), and MDA PCa 2b (m–s) tumors. Yellow fluorescence indicates co-localization (orange arrows, c, i and o); fluorescence images merged with DIC and DAPI (nuclei) are shown in panels (d), (j) and (p); H&E images of corresponding tumor sections are shown in panels (e, k and r); NovaRed immunostaining demonstrating CTSK expression in macrophages (orange arrows) is shown in panels (f, l and s); × 40 images; (t and u) no primary antibody control shown for DU145 tumor (t, fluorescence merged with DIC; u, fluorescence merged with DIC and DAPI); (v) CTSK immunostaining in control bone; blue arrowheads indicate osteoclasts; (x) no primary antibody control, × 40 images.
BMM numbers are reduced in bone tumors from CTSK KO mice The increased numbers of osteoclasts in CTSK KO mice indicate the existence of a potential compensatory mechanism to overcome the deficiency in this major bone-degrading enzyme. As osteoclasts and macrophages are derived from the same lineage,35–37 we speculated that the increased commitment of the CTSK KO cells to osteoclastogenesis may be negatively affecting their ability to differentiate into macrophages. To test this, we isolated mononuclear bone marrow cells from the WT and CTSK KO mice and cultured them in the presence of M-CSF to induce macrophage differentiation, or in the presence of M-CSF and receptor activator of NFκB ligand to induce osteoclastogenesis.36,37 In line with our in vivo observations, CTSK KO cells were more efficient in forming large multinuclear TRAcP-positive cells (Supplementary Figures 4D, H, J) than their WT counterparts (Supplementary Figures 4C, G, I). This is in agreement with previous literature reports demonstrating that CTSK-deficient mice have higher osteoclast numbers and their osteoclast surface is increased, but their ability to resorb bone is impaired.38,39 Therefore, despite the osteoclast abundance, the size of prostate tumor–bone lesions in CTSK KO mice was reduced (Figure 2). Interestingly, when mononuclear cells were stimulated with M-CSF, fewer BMMs were formed from the CTSK KO cell population (Supplementary Figures 4A, B, E, F).
Macrophage infiltration is reduced in the absence of CTSK and correlates with lower levels of inflammation
To assess if the observed differences in macrophage numbers translate into the in vivo tumor microenvironment we performed immunohistochemical analyses of F4/80 expression. In agreement with our in vitro findings, higher numbers of F4/80-positive macrophages were detected in WT as compared with CTSK KO bone–tumor tissues (Figures 6a and b). In addition, increased levels of F4/80 transcripts were detected in WT bone tumors by TaqMan RT–PCR (Figure 6b). As macrophages represent one of the predominant sources of proteases and inflammatory factors in the bone microenvironment and their presence has been linked to tumor invasiveness and aggressiveness,11,19,40 we hypothesized that expression of proteases and inflammatory factors will be lower in CTSK-deficient tumors due to fewer number of macrophages interacting with the tumor cells. To test this, we performed TaqMan RT–PCR analyses of two major macrophage-derived proteases, CTSB and CTSS, and have found a more than6-fold increase in CTSB in WT bone tumors and more than 4-fold increase in CTSK KO bone tumors as compared with control bones (Figure 6c). Modest, approximately 2–3-fold increases in CTSS levels were found in both the WT and CTSK-deficient hosts.
Figure 6.

Fewer macrophages and lower levels of inflammatory factors are detected in tumors from CTSK KO mice. (a) F4/80 (macrophage marker) immunostaining of tumor-bearing tibia sections from WTand CTSK KO mice. Left panels: NovaRed (brownish-red) F4/80 staining; × 20 images; right panels: immunofluorescence labeling (F4/80, red fluorescence; DAPI, blue); bar, 20µm; arrows indicate macrophages. (b) Left panel: Vertical scatter plot of F4/80-positive macrophages/field in tumor sections derived from WT and CTSK KO mice (four tumor sections/ group; four fields/section). Data were analyzed by Mann–Whitney test; P<0.001 indicates high significance. Right panel: TaqMan RT–PCR results for murine F4/80 in WTand CTSK KO tumors. F4/80 expression was normalized to two housekeeping genes: GUSB and HPRT1. Data are shown as mean of three biological replicates (RNA from three mice) ± s.d. Significant differences in F4/80 levels are found between WT and CTSK KO microenvironments. (c) Host genes upregulated in response to tumor challenge. TaqMan RT–PCR results for COX-2, CCL2, CTSB and CTSS. Data are normalized to GUSB and HPRT1 and shown as fold increase in tumor-bearing tibiae relative to corresponding control tibiae from the same mouse. Results represent a mean of three biological replicates ± s.d. Values P<0.001, and P<0.05 indicate significance.
To assess the levels of inflammatory factors, we first performed TaqMan Array 96 Mouse Inflammation RT–PCR analyses, which revealed several upregulated genes in WT bone tumors (Supplementary Figure 5), with two of the highest being COX-2 and CCL2, the osteoclastogenesis- and inflammation-related factors implicated in prostate cancer.20–22,41 We have validated the results of the array with RT–PCR analyses using COX-2- and CCL2-specific probes, and have demonstrated a more than 22-fold increase in COX-2, and a 17-fold increase in CCL2 gene transcripts in WT bone tumors relative to control bones (Figure 6c). An increase in COX-2 and CCL2 gene expression was also observed in CTSK-deficient tumors but the levels of these factors were much lower, likely due to the fewer numbers of macrophages.
CTSK KO macrophages are less invasive than WT cells
The ability to invade surrounding matrix is another key factor affecting macrophage infiltration into the tumor microenviron-ment.11–13 As CTSK KO BMMs are deficient in the major collagen I-degrading protease, we speculated that their invasion through collagen I matrix would be impaired. An invasion assay using Transwell inserts coated with collagen I revealed significantly fewer CTSK KO BMMs invading the matrix as compared with WT cells (Figures 7a – c). To confirm this finding and to further assess the importance of CTSK in macrophage-tumor cell interactions, we performed 3D invasion assay using Cell Tracker Orange-labeled BMMs and PC3-EGFP cells (Figure 7d). In agreement with the results of a Transwell assay, WT BMMs traveled a farther distance through collagen I matrix (101.2±8.1 µm) than the CTSK KO cells(39.3±16.1 µm), suggestive of increased invasiveness (Figures 7e – g). Both the WT and the CTSK KO BMMs increased invasion of the tumor cells through collagen I (Figure 7k). Interestingly, interaction of PC3 cells with WT BMMs occurred at distances closer to PC3 origin (43.6±6.5 µm), while these tumor cells had to travel slightly longer distance (52.7±7.5 µm) to interact with less invasive CTSK KO cells (Figures 7h – k). This further confirms that WT cells are more efficient in invading collagen I matrix, and thus reach the tumor cells more efficiently.
Figure 7.

Macrophage invasion is impaired in the absence of CTSK. BMM invasion through collagen I. Micrographs of Diff-Quik stained invasion filters for WT (a) and CTSK KO (b) BMMs. (c) Quantification results showing numbers of invaded cells. Data are shown as number of invaded cells/field±s.d. (mean of 6 fields) and are representative of three experiments. (d) Cartoon of 3D invasion assay through collagen I. Cell Tracker Orange-labeled BMMs (red) are seeded on the bottom of the dish, overlayed with collagen I, and PC3-EGFP (green) cells are seeded on top. Cells are allowed to invade for 48h and distance traveled by each cell type is measured as described in Materials and methods using Volocity software. The 3D reconstruction of Z-stack optical images of: WT BMM culture (e), CTSK KO BMM culture (f), PC3 culture (h), co-culture of PC3 cells with WT BMM (i), co-culture of PC3 cells with CTSK KO BMM (j). The WT BMMs are more invasive than CTSK KO cells (g; 101.2µm vs 39.3 µm). The PC3 invasion was increased by both the WT and the CTSK KO BMMs (k). The interaction of WT BMMs with PC3 cells occurred closer to PC3 origin (43.6 µm) than interaction of CTSK KO BMMs (52.7 µm), further confirming impaired CTSK KO invasiveness.
Interaction of BMMs with prostate tumor cells results in upregulation of CTSB, COX-2 and CCR2/CCL2 axis
Our data above demonstrated increased levels of macrophage CTSs and inflammatory molecules such as COX-2 and CCL2 in WT bone tumors at the gene level in vivo. Therefore, we wanted to investigate whether the interactions of tumor cells with BMMs have any role in expression and secretion of these factors. An indirect co-culture of PC3 cells and BMMs that allows secreted factors to be shared between the two cell types resulted in robust upregulation of COX-2 in WT and CTSK KO macrophages, with higher levels observed for WT cells (Figures 8a and b). As CCL2 was a highly upregulated gene in WT bone tumors, and this cytokine is known to be secreted by both tumor cells and macrophages, we next examined the expression of the CCL2 receptor, CCR2, in WT and CTSK KO BMMs. There were no significant differences in the CCR2 protein levels between WT and CTSK KO cells, while only a modest increase in CCR2 expression was observed in WT BMMs interacting with the tumor cells. However, the secretion of the CCR2 ligand, CCL2, was highly increased in WT BMM–PC3 co-cultures (Figures 8c and d), a result correlating with an observed increase in CCL2 levels in WT bone tumors in vivo. To further validate and better quantify this finding, we performed CCL2 ELISA assays on cell culture supernatants from WT and CTSK KO BMMs interacting with PC3 (Figure 8e and Supplementary Table 1) and human ARCaP(M) and murine RM-1 cells (Figure 8f and Supplementary Table 1), two additional prostate carcinoma cell lines shown previously to grow in bone.42,43 The three cell lines robustly induced WT BMM-derived CCL2 levels in transwell co-cultures (Figures 8e and f). In addition, expression of the macrophage protease CTSB was significantly increased when WT BMMs interacted with PC3 cells (Figures 8a and b), while CTSB secretion by WT BMMs was induced in the presence of PC3 cells (Figures 8c and d), and ARCaP(M) and RM-1 cells (Supplementary Figures 7A, B), results further supporting the in vivo findings.
Figure 8.

Interaction of WT BMMs with prostate tumor cells leads to upregulation of BMM-derived COX-2, CTSB and CCR2/CCL2 axis. WT and CTSK KO BMMs were cultured alone (A) or in a transwell system (T) with PC3 (a–e), ARCaP(M) or RM-1 cells (f). (a–d) PC3 lysates and media were collected for immunoblot analyses of intracellular: (a) COX-2 (top), CCR2 (middle) and CTSB (bottom), and secreted (c) CCL2 (top) and CTSB (bottom). Samples were loaded based on DNA in cell lysates. β-actin was used as a loading control. Data are representative of three experiments. Densitometric analysis of intracellular (b) COX-2, CCR2 and CTSB and secreted (d) mouse CCL2 and CTSB normalized to β-actin in corresponding cell lysates. Black bars: BMM alone, gray bars: BMM in transwell co-culture. Data are expressed as % control (BMM alone) of arbitrary units per square millimeter, and are representative of at least three experiments. (e, f) CCL2 ELISA assay results for WT and CTSK KO BMMs grown in a transwell system with PC3 cells (e) and ARCaP(M) and RM-1 cells (f). Media samples from three replicate wells/condition were diluted based on DNA concentrations in cell lysates. Supernatant volume corresponding to 100 ng DNA in cell lysates was used in each well and assayed in duplicate. Data are expressed in pg/ml±s.d.; P-values of 0.05* and 0.001** are considered statistically significant.
Interestingly, the effects of BMM–PC3 interactions were observable in tumor cells as well. Specifically, expression of COX-2 and the intracellular and secreted levels of CTSB were increased in PC3 cells stimulated with either WT or CTSK KO BMMs (Figure 9). CTSB secretion was also robustly increased in RM-1 cells interacting with BMMs (Supplementary Figures 7C, D). CCR2 levels did not change significantly with treatment (Figure 9b); however, the secretion of the CCR2 ligand, CCL2, was significantly increased in PC3 cells interacting with WT BMMs (Figures 9c and d), and ARCaP(M) and RM-1 cells (Supplementary Figures 7C, D). This suggests there may be a paracrine interaction between tumor cell-derived CCL2 and CCR2 expressed by macrophages. One way in which tumor- and macrophage-derived COX-2 and CCL2 can contribute to tumor growth is regulation of angiogenesis.12,44,45 Indeed, our examination of tumors from WT and CTSK KO mice revealed fewer and smaller vessels under CTSK-null conditions (Supplementary Figure 6), which corresponded to lower levels of vascular endothelial growth factor (Supplementary Figure 5). This result suggests that macrophage-derived CTSK may potentially be contributing to tumor progression in the bone by regulating COX-2-and CCL2-induced angiogenic events.
Figure 9.

Interaction of PC3 cells with WT BMMs results in upregulation of tumor cell-derived COX-2, CTSB and CCR2/CCL2 axis. PC3 cells were cultured alone or in a transwell system with WT or CTSK KO BMMs. Lysates and media were collected for immunoblot analyses of intracellular (a) COX-2 (top), CCR2 (middle) and CTSB (bottom), and secreted (c) CCL2 (top) and CTSB (bottom). Samples were loaded based on DNA in cell lysates. β-actin was used as a loading control. Data are representative of three experiments. Densitometric analysis of intracellular (b) COX-2, CCR2 and CTSB, and secreted (d) human CCL2 and CTSB normalized to β-actin in corresponding cell lystates. Data are expressed as % control (PC3 alone) of arbitrary units per square millimeter and are representative of at least three experiments. P-values of 0.05* and 0.001** are considered statistically significant.
DISCUSSION
Tumor establishment in the bone and development of skeletal lesions require tumor cell interactions with bone resident cells and bone-derived factors. Osteoclasts and macrophages are critical components of the bone–tumor microenvironment that are thought to share common hematopoietic progenitors. There is extensive literature focusing on the involvement of osteoclasts in prostate cancer bone metastases; however, the role of BMMs in this process has not been explored. Both osteoclasts and macrophages are major sources of proteases in the bone.46,47 The key proteolytic enzyme in the osteoclast is the cysteine protease CTSK.6,33,48 The major proteases supplied by macrophages are CTSs B, S and L;19,49,50 however, these cells are also known to express CTSK.10,51–53
Herein, utilizing an intratibial model of intraosseous tumor growth, we investigated the involvement of osteoclast- and macrophage-derived CTSK in prostate tumor progression in the bone. This is a widely used model designed to specifically study tumor–bone interactions, and tumor growth and expansion in the bone microenvironment. The bone resorption and tumor growth are significantly reduced in CTSK-deficient mice, while increasing levels of CTSK in WT prostate bone tumors correlate with accelerated tumor progression and bone degradation. It is noteworthy that increased bone turnover with activation of both osteoclasts and osteoblasts are well-recognized hallmarks of metastatic prostate cancer.2,54,55 The present study focuses primarily on the osteolytic component of these events in the bone, and we recognize that it does not fully recapitulate clinical bone metastasis. Future studies utilizing truly osteoblastic prostate cancer cell lines are needed to examine the role of CTSK-driven osteolytic processes in osteoblastic response. Nonetheless, osteoclast activation is tightly linked to skeletal complications in prostate cancer, osteoclasts are targeted therapeutically in metastatic disease,54,56 and our study is first to utilize CTSK-deficient mice to validate the role of osteoclast CTSK in tumor-induced bone resorption.
We acknowledge that use of CTSK-null animals in this study has limitations. The CTSK deficiency results in osteopetrotic phenotype, which is manifested by increased trabeculation of the bone marrow space and changed morphology of the osteoclasts.7 Consequently, this model does not allow for full quantitative comparison of the tumor-associated cortical and trabecular bone volumes between WT and CTSK-null mice. Nevertheless, this is still the best available tool for pre-clinical examination of the effect of CTSK deficiency on colonization and growth of the tumor in the bone as none of the currently available CTSK inhibitors are effective against murine CTSK.57,58 This is due to the fact that there are significant species–specific differences in key amino acid residues involved in substrate–inhibitor recognition between humans and rodents.57,59
Under the clinical setting, the new generation of CTSK inhibitors is showing promise as a potential treatment option for bone metastases.58,60 Specifically, recent clinical trials in metastatic breast cancer patients treated with Merck CTSK inhibitor odanacatib demonstrated significant reductions in urine bone markers with treatment.61 An attractive aspect of CTSK inhibition is that it reduces proteolysis of the organic component of the bone matrix but does not interfere with osteoclast survival.62–64 This potentially allows rebuilding of lost bone while restoring normal bone remodeling, possibly an advantage over existing bone-targeted treatments.58 Given the findings of the present study, inhibiting CTSK may not only affect the osteoclast function, but also interfere with macrophage-regulated pathways. Macrophages influence multiple aspects of tumor progression and metastasis, and represent a significant portion of a leukocytic infiltrate in prostate and other cancers.65 We have shown that the macrophage abundance is greater in bone tumors from WT mice, and it correlates with accelerated tumor growth. One important axis critical for macrophage recruitment into tumor microenvironment is CCL2 signaling through the CCR2 chemokine receptor.24,66 CCL2 has been reported to promote tumor growth in the bone through recruitment of macrophages and osteoclasts and mediating tumor-induced osteoclastogenesis.21,67 Our results herein suggest the existence of paracrine signaling between tumor cell and macrophage-supplied CCL2/CCR2 axes. This is in line with recent reports that a blockade of both tumor- and macrophage-derived CCL2 abolishes metastasis and prolongs survival of breast and prostate tumor-bearing mice.24–26
The increased expression of pro-inflammatory cytokines such as CCL2 is often co-incident with upregulation of proteases, most likely to increase ECM degradation and promote invasiveness.68,69 In many cases, cytokines and chemokines require proteolytic activation to perform their function in the tumor microenvironment.70,71 Herein, we demonstrate that CCL2 levels increase with expression of macrophage-supplied CTSK, and this CCL2 overexpression correlates with an increase in levels of macrophage- and tumor-derived CTSB. Interestingly, together with upregulation of CCL2 and CTSK, there is an increase in expression of COX-2, another tumor- and macrophage-supplied factor implicated in osteoclastogenesis and tumor aggressiveness.22,23 CCL2 has been previously shown to stimulate macrophage COX-2 expression in colon cancer,72 and infiltration of COX-2 expressing macrophages was reported to increase vascular endothelial growth factor levels and induce angiogenesis and tumor growth.44 Results of our study revealed lower levels of vascular endothelial growth factor and impaired angiogenesis under CTSK-deficient conditions, suggesting potential cross-talk between CTSK, CCL2 and COX-2-driven events in tumor progression in bone. Whether CTSK proteolytically regulates CCL2 and COX-2 activity in the tumor microenvironment remains to be determined. Catalytic activation of COX-2 by cysteine proteases has been previously suggested to have a role in inflammatory prostaglandin synthesis.73
In this study we provided evidence for close interplay between inflammatory, osteolytic and tumor cell-driven events in the bone–tumor microenvironment. We demonstrated critical involvement of cysteine protease CTSK in osteoclast, macrophage and tumor cell interactions, which collectively contribute to colonization and growth of prostate tumors in the bone. Most importantly, we have shown, for the first time that BMM-supplied CTSK may be involved in CCL2- and COX-2-driven pathways in the bone microenvironment. Currently, osteoclast-targeting agents such as bisphosphonates and anti-receptor activator of NFκB ligand antibody, denosumab, are the primary therapeutic approaches for the treatment of skeletal complications from prostate cancer.2,54,56,74 These agents have demonstrated considerable beneficial effects in reducing risk for skeletal events and diminishing skeletal complications in metastatic prostate cancer patients, but have not been shown thus far to have significant effect on survival. Results presented herein suggest that tumor progression in bone may involve multidirectional interactions between tumor cell-, macrophage- and osteoclast-associated pathways. Tumor- and macrophage-supplied CCL2 is currently targeted in advanced breast cancer24 and its inhibition was shown to prolong survival in prostate cancer-bearing mice.25,26 COX-2 inhibitors were shown to improve the efficacy of androgen withdrawal in prostate cancer patients and to reduce the risk of bone metastasis from breast cancer.27,29,30 The blockade of macrophage recruitment/response pathways by targeting CSF1R in combination with chemotherapy was recently shown to reduce metastasis and improve survival in mammary tumor-bearing mice.75 This provides a compelling case for designing therapies for metastatic disease that simultaneously target macrophage and osteoclast pathways in combination with cytotoxic therapies against tumor cells.
MATERIALS AND METHODS
Materials
Dulbecco’s modified Eagle’s medium, RPMI-1640 medium, TRAcP staining kit, and other chemicals, unless otherwise stated, were obtained from Sigma (St. Louis, MO, USA). HyClone fetal bovine serum (FBS) was from ThermoFisher (Pittsburg, PA, USA). T-Medium, Trypsin–EDTA, collagenase, Alexa Fluor 488- and Alexa Fluor 564–conjugated donkey anti-mouse and anti-rabbit IgG, Lipofectamine 2000 and Gentamicin (G418) were from Invitrogen (Carlsbad, CA, USA). PureCol collagen type I was from Advanced Biomatrix (San Diego, CA, USA). Monoclonal anti-CTSK antibodies were from Novocastra (Newcastle, UK). Rabbit anti-human/mouse COX-2, rat monoclonal F4/80 and CD34, rabbit anti-human/mouse CCR2, rabbit anti-human/mouse CTSK were from Abcam (Cambridge, MA, USA) and monoclonal anti-TRAcP antibodies were from Zymed Laboratories (San Francisco, CA, USA); Quantikine Mouse CCL2/JE/macrophage chemoat-tractant protein-1 ELISA, mouse anti-human CCL2 and goat anti-mouse CCL2 were from R&D Systems (Minneapolis, MN, USA), and rat anti-mouse CD31 antibodies were from BD Pharmingen (San Jose, CA, USA). Rabbit anti-human/mouse β-actin antibodies were from Novus Biologicals (Littleton, CO, USA) and rabbit polyclonal CTSB antibodies were produced in the laboratory of Dr Bonnie Sloane (WSU) as previously described.76 RNeasy Mini Kits were from Qiagen (Valencia, CA, USA). Immunoblotting ‘western lightning’ detection kits were from Amersham Pharmacia Biotechnologies (Piscataway, NJ, USA). Z-Fix was from Anatech, Ltd (Battle Creek, MI, USA). ImmPRESS Anti-Rat IgG Peroxidase Polymer Detection kit, NovaRED kit for peroxidase and Mouse on Mouse (M.O.M) Texas Red Avidin DCS and Fluorescein kits were purchased from Vector Laboratories (Burlingame, CA, USA).
Cell lines
PC3, an androgen-independent osteolytic cell line derived from a bone metastasis of a high-grade adenocarcinoma,77 DU145, an androgen- independent osteolytic cell line derived from a brain metastasis,78 and MDA PCa 2b, an androgen-independent adenocarcinoma cell line derived from bone metastasis79 were purchased from American Type Culture Collection (Manassas, VA, USA). The ARCaP(M), an androgen-repressed metastatic prostate cancer cells M (‘Mesenchymal’ Clone)42 were purchased from Novicure Biotechnology (Birmingham, AL, USA). The human prostate cancer C4-2B cell line was kindly provided by Dr Leland W K Chung, Emory University, Atlanta, Georgia and the murine RM-1 prostate carcinoma cell line80 was a kind gift from Dr Timothy Thompson (MD Anderson, Houston, TX, USA). The PC3-DsRed and PC3-EGFP cell lines were established by stable transfection with pDsRed2-N1 and pEGFP-N1 vectors (Clontech Laboratories, Palo Alto, CA, USA), containing the neomycin-resistant gene. Transfection was performed using Lipofectamine 2000 and pooled populations of stable cells were selected, expanded and maintained in medium supplemented with 400µg/ml of G418. PC3, DU145 and RM-1 cells were cultured in Dulbecco’s modified Eagle’s medium supplemented with 10% FBS (PC3, DU145) and 10 mM HEPES (RM-1). C4-2B were grown in RPMI-1640 medium with 10% FBS, MDA PCa 2b cells in F12K ( + ) medium with 20% FBS79 and ARCaP(M) cells in T-medium with 5% FBS.42 Cells were maintained in a 37 °C humidified incubator ventilated with 5% CO2. Primary mouse bone marrow stromal cells and primary BMMs were isolated from femurs and tibiae of 6- to 8-week-old CTSK-null (FVB/N/N5 Cat K −/− (CTSK KO)) mice and WT (FVB/ N/N5 Cat K+/+ (WT)) mice as previously described.10,19,81 The L929 conditioned media was used as the source of mouse CSF-1.82
Animals
All experiments involving mice were performed in accordance with the protocol approved by the institutional Animal Investigation Committee of Wayne State University and NIH guidelines. In vivo xenograft studies were performed in 8- to 10-week-old male mice in the FVB/N background with homozygous null mutation in the Rag-1 gene (FVB/N/N5, Rag-1 −/−, Cat K+/+(WT)) and the CTSK gene (FVB/N/N5, Rag-1−/−, Cat K−/− (CTSK KO)). Breeding pairs for all strains were kindly provided by Dr Lisa Coussens (UCSF, San Francisco, CA, USA) and were bred in-house.
Intratibial injections of prostate cancer cells
Intratibial tumor injections were performed under isoflurane inhalational anesthesia according to the previously published procedures.83 Briefly, a 26-gauge needle was inserted through the skin overlying the knee and the patullar ligament into diaphysis of the tibia (~3–5 mm). A cell preparation containing 5 × 10⁵ of PC3-DsRed cells in PBS (20 µl, right tibia), or the PBS alone (control, 20 µl, left tibia) was injected into the bone marrow. At 2, 4 and 6 weeks post injection mice were anesthetized, shaved and whole-body fluorescence and X-ray images were obtained using a Kodak IS4000MM multimodal imager (Kodak, Rochester, NY, USA). Following whole-body imaging, mice were euthanized and control and tumor-bearing tibiae were removed and imaged ex vivo. A total of 37 WT and 35 CTSK mice were used for this study. Approximately one-third of the tibiae samples from each group were fixed in Z-fix, decalcified and embedded in paraffin. Remaining samples were snap-frozen in liquid nitrogen, powderized using a tissue pulverizer, and stored at − 80 °C for RNA and protein analyses. In addition to intratibial implantation, a separate set of mice (6 WT and 6 CTSK KO) was injected with PC3-DsRed cells subcutaneously to control for the effects of the bone microenvironment.
Bone histomorphometry and osteoclast quantification
The 5 µm longitudinal sections from tibiae of WT and CTSK KO mice were deparaffinized, and stained with hematoxylin and eosin as described previously.10 Digital images were captured under × 5 magnifications using a Zeiss Axiophot microscope with CCD camera (Carl Zeiss AG, Göttingen, Germany). The entire area of each tibia was reconstructed from the × 5 images. The ImageJ software (National Institutes of Health, Bethesda, MD, USA) was used to calculate the percentage of the area occupied by the tumor in entire histological section by measuring the corresponding areas in mm.2 For determination of osteoclast numbers in each tumor-bearing tibia, the TRAcP staining was performed on deparaffinized and rehydrated histological sections according to the manufacturer’s instructions (Sigma). Numbers of TRAcP-positive cells were determined in entire histological section (N = 5 for each group and time point) and represented as Box and whisker plots.
Fluorescence analysis of tumor burden
Whole-body fluorescence images from WT and CTSK KO mice were obtained at 2, 4 and 6 weeks after tumor cell injections using Kodak Multimodal Small Animal Imager. Fluorescence intensity was determined using the MetaMorph Software (Molecular Devices, Woburn, MA, USA). Specifically, tiff images obtained with Kodak Imager were color separated from background highlighting RFP signal from each tumor. Subsequently, the integrated fluorescence intensity values corresponding to the arithmetic sum of all intensity values for every pixel in the identified region were calculated for each tumor-bearing tibia.
Immunohistochemistry and immunofluorescence analyses
Corresponding sections of control and tumor-bearing tibiae from WT and CTSK KO mice were analyzed by immunohistochemistry for expression and localization of proteins of the macrophage marker F4/80 (rat monoclonal, 1:200), CD31 (rat monoclonal, 1:200), CTSK (rabbit polyclonal, 1:200) and CD34 (rabbit polyclonal, 1:200). ImmPRESS Anti-Rat and Anti-Rabbit IgG Peroxidase Polymer Detection systems along with a NovaRED kit as a substrate were used for the peroxidase-mediated reaction. For double immunofluorescence analyses of CTSK (rabbit polyclonal, 1:200) and TRAcP (mouse monoclonal, 1:50) or CTSK (rabbit polyclonal, 1:200) and F4/80 (rat monoclonal 1:200), Texas Red Avidin DCS (red) and Fluorescein (green) M.O.M kits were used (Vector Laboratories). Fluorescent images were captured with a Zeiss LSM 510 META NLO confocal microscope using × 40 oil immersion lens. For CTSK immunostaining, CTSK KO tissues were used as controls. For all other staining, controls were run in the absence of primary antibodies.
Tissue samples from SCID-hu model
Archived paraffin embedded sections of DU145, C4-2B and MDA PCa 2b bone tumors were generated in SCID-hu model of bone metastasis as previously described.34 Serial sections (4 µm) were cut, deparaffinized, rehydrated and stained with antibodies against CTSK (rabbit polyclonal, 1:200) and macrophage marker CD68 (Dako North America; Carpinteria, CA, USA; clone KP-1, ready to use). Alexa Fluor 488 (green) donkey-anti mouse, and Alexa Fluor 564 (red) donkey anti-rabbit antibodies were used as secondary reagents for double-immunolabeling, and NovaRed staining was used for immunohistochemical analyses.
RNA isolation and TaqMan RT–PCR analyses
RNA from powderized control and tumor-bearing tibiae was isolated using RNeasy Mini Kit according to the manufacturer’s instructions. The complementery DNA was prepared from 2 µg of total RNA using High-Capacity complementery DNA Reverse Transcription kit (Applied Biosys-tems). TaqMan Array 96–well Fast Plates (Mouse Inflammation) were used for the initial analysis. Reactions were run in Applied Biosystems StepOnePlus system using TaqMan Fast Universal PCR Master Mix and 50 ng of complementery DNA/well. For the initial screening three biological replicates of each sample were pooled together and the assays were run in duplicate. Results for mouse COX-2 and CCL2 were then validated with TaqMan Individual Gene Expression assays using three separate biological replicates and the following probes: COX-2 (Mm00478374) and CCL2 (Mm00441242). Additional individual assays were run in triplicate for the following genes: CTSK (Mm00484039), CTSS (Mm01255859), CTSB (Mm01310506), TRAcP (Mm00475698) and F4/80 (Mm00802529). All data were normalized to beta-glucuronidase (GUSB) and hypoxanthine phosphoribosyltransferase (HPRT1) and expressed as fold changes in tumor–bone relative to control bone from the same mouse. DataAssist Software (Applied Biosystems) was used for all analyses.
BMM invasion assays
Primary BMMs (150000cells) were seeded in serum-free media on BD (Franklin Lakes, NJ, USA) cell culture inserts (8µm pore size) coated with collagen I (1 mg/ml) and allowed to invade toward media supplemented with 10% FBS for 18 h. Invading cells were visualized using a Zeiss Axiophot microscope, and the cells were counted using ImageJ software. Data were collected from at least three independent experiments performed in triplicate. For 3D invasion assays, BMMs were stained using Cell Tracker Orange (Invitrogen), seeded on the bottom of cell culture dish and overlayed with collagen I matrix (3 mg/ml). EGFP-expressing PC3 cells were seeded on top of collagen I in Dulbecco’s modified Eagle’s medium medium containing 10% FBS. Cells were allowed to invade for 48 h. Optical sections were taken using a Zeiss LSM 510 META NLO microscope (Carl Zeiss AG, Göttingen, Germany) with × 40 dipping lenses and 3D images were reconstructed using Volocity software (PerkinElmer, Waltham, MA, USA).
BMM co-cultures with tumor cells
Indirect co-cultures of BMMs (3.5 × 10⁵ cells; bottom) and PC3 tumor cells (2 × 10⁵ cells; top) were set up using Costar Transwell Inserts (0.4µm pore size). Cells were cultured for 48 h and then serum-starved for additional 12 h. Lysates were re-suspended in SME buffer, media were concentrated through 5K Millipore centrifugal filters, and all samples were stored at − 80 °C for future use.
Immunoblot and ELISA analyses
Lysate and media samples were loaded based on DNA concentrations in the corresponding lysates and proteins were electrophoresed on 12 or 15% SDS–PAGE gels, transferred to polyvinylidene fluoride membrane (PVDF) and immunoblotted for COX-2 (1:1000), CCL2 (1:500). CTSB (1:3000), CCR2 (1:1000) and β-actin (1:5000). All horseradish peroxidase-labeled secondary antibodies were used at 1:10 000. Quantification and analyses of bands were performed using a Luminescent Image Analyzer LAS-1000 Plus (Fujifilm, Stamford, CT, USA) and expressed as arbitrary units per square millimeter. For ELISA assays, media from three replicate wells per condition were diluted based on DNA concentrations in cell lysates, such that amount of cell culture supernatants in each assay well corresponded to 100ng of DNA in lysates. Assays were run in duplicate according to the manufacturer’s instructions (R&D Systems). Optical density of each well was determined at 450 nm with correction wavelength set to 540 nm using a TECAN-Infinite M200 PRO plate reader. The data were analyzed based on the standard curve values using a four parameter logistic (4-PL) curve-fit.
Statistical analyses
Data were presented as mean±s.d. and statistically analyzed using student T-test. For three or more groups, one-way analysis of variance was used. Box and whisker plots were used and Mann–Whitney tests applied for data following non-parametric distribution.
Supplementary Material
ACKNOWLEDGEMENTS
We gratefully acknowledge Dr Lisa Coussens (UCSF, CA) for providing breeding pairs of immuno-deficient (FVB/N/N5, Rag-1 −/−, Cat K+/+(WT)) and (FVB/N/N5, Rag-1 −/−, Cat K−/− (CTSK KO)) mice, as well as immuno-competent (FVB/N/N5 Cat K+/+(WT)) and (FVB/N/N5 Cat K−/−(CTSK KO)) mice used in this study. We also thank Dr Bonnie Sloane for providing CTSB antibodies, Dr Kamiar Moin and the Microscopy, Imaging and Cytometry Resources Core for assistance with confocal and conventional light microscopy analyses, and Dr Karin list for critical review of this manuscript. Grant support was provided by DOD PC074031, DOD PC030325, Wayne State University start-up fund and MICR: P30 CA 22453.
Footnotes
CONFLICT OF INTEREST
The authors declare no conflict of interest.
REFERENCES
- 1.Kingsley LA, Fournier PG, Chirgwin JM, Guise TA. Molecular biology of bone metastasis. Mol Cancer Ther. 2007;6:2609–2617. doi: 10.1158/1535-7163.MCT-07-0234. [DOI] [PubMed] [Google Scholar]
- 2.Lee RJ, Saylor PJ, Smith MR. Treatment and prevention of bone complications from prostate cancer. Bone. 2011;48:88–95. doi: 10.1016/j.bone.2010.05.038. [DOI] [PMC free article] [PubMed] [Google Scholar]
- 3.Roato I, D’Amelio P, Gorassini E, Grimaldi A, Bonello L, Fiori C, et al. Osteoclasts are active in bone forming metastases of prostate cancer patients. PLoS One. 2008;3:e3627. doi: 10.1371/journal.pone.0003627. [DOI] [PMC free article] [PubMed] [Google Scholar]
- 4.Chao TY, Wu YY, Janckila AJ. Tartrate-resistant acid phosphatase isoform 5b (TRACP 5b) as a serum maker for cancer with bone metastasis. Clin Chim Acta. 2010;411:1553–1564. doi: 10.1016/j.cca.2010.06.027. [DOI] [PubMed] [Google Scholar]
- 5.Smith MR, Cook RJ, Coleman R, Brown J, Lipton A, Major P, et al. Predictors of skeletal complications in men with hormone-refractory metastatic prostate cancer. Urology. 2007;70:315–319. doi: 10.1016/j.urology.2007.03.071. [DOI] [PMC free article] [PubMed] [Google Scholar]
- 6.Gelb BD, Shi GP, Chapman HA, Desnick RJ. Pycnodysostosis, a lysosomal disease caused by cathepsin K deficiency. Science. 1996;273:1236–1238. doi: 10.1126/science.273.5279.1236. [DOI] [PubMed] [Google Scholar]
- 7.Saftig P, Hunziker E, Wehmeyer O, Jones S, Boyde A, Rommerskirch W, et al. Impaired osteoclastic bone resorption leads to osteopetrosis in cathepsin-K-deficient mice. Proc Natl Acad Sci USA. 1998;95:13453–13458. doi: 10.1073/pnas.95.23.13453. [DOI] [PMC free article] [PubMed] [Google Scholar]
- 8.Brubaker KD, Vessella RL, True LD, Thomas R, Corey E, Cathepsin K. mRNA and protein expression in prostate cancer progression. J Bone Miner Res. 2003;18:222–230. doi: 10.1359/jbmr.2003.18.2.222. [DOI] [PubMed] [Google Scholar]
- 9.Littlewood-Evans AJ, Bilbe G, Bowler WB, Farley D, Wlodarski B, Kokubo T, et al. The osteoclast-associated protease cathepsin K is expressed in human breast carcinoma. Cancer Res. 1997;57:5386–5390. [PubMed] [Google Scholar]
- 10.Podgorski I, Linebaugh BE, Koblinski JE, Rudy DL, Herroon MK, Olive MB, et al. Bone marrow-derived cathepsin K cleaves SPARC in bone metastasis. Am J Pathol. 2009;175:1255–1269. doi: 10.2353/ajpath.2009.080906. [DOI] [PMC free article] [PubMed] [Google Scholar]
- 11.Pollard JW. Tumour-educated macrophages promote tumour progression and metastasis. Nat Rev Cancer. 2004;4:71–78. doi: 10.1038/nrc1256. [DOI] [PubMed] [Google Scholar]
- 12.Porta C, Subhra Kumar B, Larghi P, Rubino L, Mancino A, Sica A. Tumor promotion by tumor-associated macrophages. Adv Exp Med Biol. 2007;604:67–86. doi: 10.1007/978-0-387-69116-9_5. [DOI] [PubMed] [Google Scholar]
- 13.Condeelis J, Pollard JW. Macrophages: obligate partners for tumor cell migration, invasion, and metastasis. Cell. 2006;124:263–266. doi: 10.1016/j.cell.2006.01.007. [DOI] [PubMed] [Google Scholar]
- 14.Nonomura N, Takayama H, Nakayama M, Nakai Y, Kawashima A, Mukai M, et al. Infiltration of tumour-associated macrophages in prostate biopsy specimens is predictive of disease progression after hormonal therapy for prostate cancer. BJU Int. 2011;107:1918–1922. doi: 10.1111/j.1464-410X.2010.09804.x. [DOI] [PubMed] [Google Scholar]
- 15.Lin EY, Nguyen AV, Russell RG, Pollard JW. Colony-stimulating factor 1 promotes progression of mammary tumors to malignancy. J Exp Med. 2001;193:727–740. doi: 10.1084/jem.193.6.727. [DOI] [PMC free article] [PubMed] [Google Scholar]
- 16.Scheven BA, Visser JW, Nijweide PJ. In vitro osteoclast generation from different bone marrow fractions, including a highly enriched haematopoietic stem cell population. Nature. 1986;321:79–81. doi: 10.1038/321079a0. [DOI] [PubMed] [Google Scholar]
- 17.Takeshita S, Kaji K, Kudo A. Identification and characterization of the new osteoclast progenitor with macrophage phenotypes being able to differentiate into mature osteoclasts. J Bone Miner Res. 2000;15:1477–1488. doi: 10.1359/jbmr.2000.15.8.1477. [DOI] [PubMed] [Google Scholar]
- 18.Bar-Shavit Z. The osteoclast: a multinucleated, hematopoietic-origin, bone-resorbing osteoimmune cell. J Cell Biochem. 2007;102:1130–1139. doi: 10.1002/jcb.21553. [DOI] [PubMed] [Google Scholar]
- 19.Gocheva V, Wang HW, Gadea BB, Shree T, Hunter KE, Garfall AL, et al. IL-4 induces cathepsin protease activity in tumor-associated macrophages to promote cancer growth and invasion. Genes Dev. 2010;24:241–255. doi: 10.1101/gad.1874010. [DOI] [PMC free article] [PubMed] [Google Scholar]
- 20.Miyamoto K, Ninomiya K, Sonoda KH, Miyauchi Y, Hoshi H, Iwasaki R, et al. MCP-1 expressed by osteoclasts stimulates osteoclastogenesis in an autocrine/paracrine manner. Biochem. Biophys Res Commun. 2009;383:373–377. doi: 10.1016/j.bbrc.2009.04.020. [DOI] [PubMed] [Google Scholar]
- 21.Mizutani K, Sud S, McGregor NA, Martinovski G, Rice BT, Craig MJ, et al. The chemokine CCL2 increases prostate tumor growth and bone metastasis through macrophage and osteoclast recruitment. Neoplasia. 2009;11:1235–1242. doi: 10.1593/neo.09988. [DOI] [PMC free article] [PubMed] [Google Scholar]
- 22.Kawashima M, Fujikawa Y, Itonaga I, Takita C, Tsumura H. The effect of selective cyclooxygenase-2 inhibitor on human osteoclast precursors to influence osteo-clastogenesis in vitro . Mod Rheumatol. 2009;19:192–198. doi: 10.1007/s10165-008-0149-6. [DOI] [PubMed] [Google Scholar]
- 23.Yoon DS, Yoo JH, Kim YH, Paik S, Han CD, Lee JW. The effects of COX-2 inhibitor during osteogenic differentiation of bone marrow-derived human mesenchymal stem cells. Stem Cells Dev. 2010;19:1523–1533. doi: 10.1089/scd.2009.0393. [DOI] [PubMed] [Google Scholar]
- 24.Qian BZ, Li J, Zhang H, Kitamura T, Zhang J, Campion LR, et al. CCL2 recruits inflammatory monocytes to facilitate breast-tumour metastasis. Nature. 2011 doi: 10.1038/nature10138. [DOI] [PMC free article] [PubMed] [Google Scholar]
- 25.Zhang J, Patel L, Pienta KJ. CC chemokine ligand 2 (CCL2) promotes prostate cancer tumorigenesis and metastasis. Cytokine Growth Factor Rev. 2010;21:41–48. doi: 10.1016/j.cytogfr.2009.11.009. [DOI] [PMC free article] [PubMed] [Google Scholar]
- 26.Loberg RD, Ying C, Craig M, Yan L, Snyder LA, Pienta KJ. CCL2 as an important mediator of prostate cancer growth in vivo through the regulation of macrophage infiltration. Neoplasia. 2007;9:556–562. doi: 10.1593/neo.07307. [DOI] [PMC free article] [PubMed] [Google Scholar]
- 27.Abedinpour P, Baron VT, Welsh J, Borgstrom P. Regression of prostate tumors upon combination of hormone ablation therapy and celecoxib in vivo . Prostate. 2011;71:813–823. doi: 10.1002/pros.21297. [DOI] [PMC free article] [PubMed] [Google Scholar]
- 28.Smith MR, Manola J, Kaufman DS, Oh WK, Bubley GJ, Kantoff PW. Celecoxib versus placebo for men with prostate cancer and a rising serum prostate-specific antigen after radical prostatectomy and/or radiation therapy. J Clin Oncol. 2006;24:2723–2728. doi: 10.1200/JCO.2005.03.7804. [DOI] [PubMed] [Google Scholar]
- 29.Valsecchi ME, Pomerantz SC, Jaslow R, Tester W. Reduced risk of bone metastasis for patients with breast cancer who use COX-2 inhibitors. Clin Breast Cancer. 2009;9:225–230. doi: 10.3816/CBC.2009.n.038. [DOI] [PubMed] [Google Scholar]
- 30.Singh B, Berry JA, Shoher A, Ayers GD, Wei C, Lucci A. COX-2 involvement in breast cancer metastasis to bone. Oncogene. 2007;26:3789–3796. doi: 10.1038/sj.onc.1210154. [DOI] [PubMed] [Google Scholar]
- 31.Asagiri M, Hirai T, Kunigami T, Kamano S, Gober HJ, Okamoto K, et al. Cathepsin K-dependent toll-like receptor 9 signaling revealed in experimental arthritis. Science. 2008;319:624–627. doi: 10.1126/science.1150110. [DOI] [PubMed] [Google Scholar]
- 32.Zenger S, Hollberg K, Ljusberg J, Norgard M, Ek-Rylander B, Kiviranta R, et al. Proteolytic processing and polarized secretion of tartrate-resistant acid phos-phatase is altered in a subpopulation of metaphyseal osteoclasts in cathepsin K-deficient mice. Bone. 2007;41:820–832. doi: 10.1016/j.bone.2007.07.010. [DOI] [PubMed] [Google Scholar]
- 33.Kiviranta R, Morko J, Uusitalo H, Aro HT, Vuorio E, Rantakokko J. Accelerated turnover of metaphyseal trabecular bone in mice overexpressing cathepsin K. J Bone Miner Res. 2001;16:1444–1452. doi: 10.1359/jbmr.2001.16.8.1444. [DOI] [PubMed] [Google Scholar]
- 34.Podgorski I, Linebaugh BE, Sameni M, Jedeszko C, Bhagat S, Cher ML, et al. Bone microenvironment modulates expression and activity of cathepsin B in prostate cancer. Neoplasia. 2005;7:207–223. doi: 10.1593/neo.04349. [DOI] [PMC free article] [PubMed] [Google Scholar]
- 35.Teitelbaum SL. Bone resorption by osteoclasts. Science. 2000;289:1504–1508. doi: 10.1126/science.289.5484.1504. [DOI] [PubMed] [Google Scholar]
- 36.Boyce BF, Yao Z, Xing L. Osteoclasts have multiple roles in bone in addition to bone resorption. Crit Rev Eukaryot Gene Expr. 2009;19:171–180. doi: 10.1615/critreveukargeneexpr.v19.i3.10. [DOI] [PMC free article] [PubMed] [Google Scholar]
- 37.Lean JM, Matsuo K, Fox SW, Fuller K, Gibson FM, Draycott G, et al. Osteoclast lineage commitment of bone marrow precursors through expression of membrane-bound TRANCE. Bone. 2000;27:29–40. doi: 10.1016/s8756-3282(00)00306-9. [DOI] [PubMed] [Google Scholar]
- 38.Kiviranta R, Morko J, Alatalo SL, NicAmhlaoibh R, Risteli J, Laitala-Leinonen T, et al. Impaired bone resorption in cathepsin K-deficient mice is partially compensated for by enhanced osteoclastogenesis and increased expression of other proteases via an increased RANKL/OPG ratio. Bone. 2005;36:159–172. doi: 10.1016/j.bone.2004.09.020. [DOI] [PubMed] [Google Scholar]
- 39.Wilson SR, Peters C, Saftig P, Bromme D. Cathepsin K activity-dependent regulation of osteoclast actin ring formation and bone resorption. J Biol Chem. 2009;284:2584–2592. doi: 10.1074/jbc.M805280200. [DOI] [PMC free article] [PubMed] [Google Scholar]
- 40.Mantovani A, Allavena P, Sica A, Balkwill F. Cancer-related inflammation. Nature. 2008;454:436–444. doi: 10.1038/nature07205. [DOI] [PubMed] [Google Scholar]
- 41.Shiirevnyamba A, Takahashi T, Shan H, Ogawa H, Yano S, Kanayama H, et al. Enhancement of osteoclastogenic activity in osteolytic prostate cancer cells by physical contact with osteoblasts. Br J Cancer. 2011;104:505–513. doi: 10.1038/sj.bjc.6606070. [DOI] [PMC free article] [PubMed] [Google Scholar]
- 42.Zhau HE, Odero-Marah V, Lue HW, Nomura T, Wang R, Chu G, et al. Epithelial to mesenchymal transition (EMT) in human prostate cancer: lessons learned from ARCaP model. Clin. Exp Metastasis. 2008;25:601–610. doi: 10.1007/s10585-008-9183-1. [DOI] [PMC free article] [PubMed] [Google Scholar]
- 43.McCabe NP, Madajka M, Vasanji A, Byzova TV. Intraosseous injection of RM1 murine prostate cancer cells promotes rapid osteolysis and periosteal bone deposition. Clin Exp Metastasis. 2008;25:581–590. doi: 10.1007/s10585-008-9175-1. [DOI] [PMC free article] [PubMed] [Google Scholar]
- 44.Nakao S, Kuwano T, Tsutsumi-Miyahara C, Ueda S, Kimura YN, Hamano S, et al. Infiltration of COX-2-expressing macrophages is a prerequisite for IL-1 beta-induced neovascularization and tumor growth. J Clin Invest. 2005;115:2979–2991. doi: 10.1172/JCI23298. [DOI] [PMC free article] [PubMed] [Google Scholar]
- 45.Conti I, Rollins BJ. CCL2 (monocyte chemoattractant protein-1) and cancer. Semin Cancer Biol. 2004;14:149–154. doi: 10.1016/j.semcancer.2003.10.009. [DOI] [PubMed] [Google Scholar]
- 46.Wilson TJ, Singh RK. Proteases as modulators of tumor-stromal interaction: primary tumors to bone metastases. Biochim Biophys Acta. 2008;1785:85–95. doi: 10.1016/j.bbcan.2007.11.001. [DOI] [PMC free article] [PubMed] [Google Scholar]
- 47.Lynch CC. Matrix metalloproteinases as master regulators of the vicious cycle of bone metastasis. Bone. 2011;48:44–53. doi: 10.1016/j.bone.2010.06.007. [DOI] [PubMed] [Google Scholar]
- 48.Saftig P, Hunziker E, Everts V, Jones S, Boyde A, Wehmeyer O, et al. Functions of cathepsin K in bone resorption Lessons from cathepsin K deficient mice. Adv Exp Med Biol. 2000;477:293–303. doi: 10.1007/0-306-46826-3_32. [DOI] [PubMed] [Google Scholar]
- 49.Mason SD, Joyce JA. Proteolytic networks in cancer. Trends Cell Biol. 2011;21:228–237. doi: 10.1016/j.tcb.2010.12.002. [DOI] [PMC free article] [PubMed] [Google Scholar]
- 50.Reddy VY, Zhang QY, Weiss SJ. Pericellular mobilization of the tissue-destructive cysteine proteinases, cathepsins B, L, and S, by human monocyte-derived macrophages. Proc Natl Acad Sci USA. 1995;92:3849–3853. doi: 10.1073/pnas.92.9.3849. [DOI] [PMC free article] [PubMed] [Google Scholar]
- 51.Chapman HA, Riese RJ, Shi GP. Emerging roles for cysteine proteases in human biology. Annu Rev Physiol. 1997;59:63–88. doi: 10.1146/annurev.physiol.59.1.63. [DOI] [PubMed] [Google Scholar]
- 52.Punturieri A, Filippov S, Allen E, Caras I, Murray R, Reddy V, et al. Regulation of elastinolytic cysteine proteinase activity in normal and cathepsin K-deficient human macrophages. J Exp Med. 2000;192:789–799. doi: 10.1084/jem.192.6.789. [DOI] [PMC free article] [PubMed] [Google Scholar]
- 53.Buhling F, Reisenauer A, Gerber A, Kruger S, Weber E, Bromme D, et al. Cathepsin K–a marker of macrophage differentiation? J Pathol. 2001;195:375–382. doi: 10.1002/path.959. [DOI] [PubMed] [Google Scholar]
- 54.Saylor PJ, Lee RJ, Smith MR. Emerging therapies to prevent skeletal morbidity in men with prostate cancer. J Clin Oncol. 2011;29:3705–3714. doi: 10.1200/JCO.2010.34.4994. [DOI] [PMC free article] [PubMed] [Google Scholar]
- 55.Cook RJ, Coleman R, Brown J, Lipton A, Major P, Hei YJ, et al. Markers of bone metabolism and survival in men with hormone-refractory metastatic prostate cancer. Clin Cancer Res. 2006;12:3361–3367. doi: 10.1158/1078-0432.CCR-06-0269. [DOI] [PubMed] [Google Scholar]
- 56.Smith MR. Osteoclast targeted therapy for prostate cancer: bisphosphonates and beyond. Urol Oncol. 2008;26:420–425. doi: 10.1016/j.urolonc.2007.11.004. [DOI] [PMC free article] [PubMed] [Google Scholar]
- 57.Desmarais S, Masse F, Percival MD. Pharmacological inhibitors to identify roles of cathepsin K in cell-based studies: a comparison of available tools. Biol Chem. 2009;390:941–948. doi: 10.1515/BC.2009.092. [DOI] [PubMed] [Google Scholar]
- 58.Podgorski I. Future of anticathepsin K drugs: dual therapy for atherosclerosis and skeletal disease? Future Med Chem. 2009;1:21–34. doi: 10.4155/fmc.09.4. [DOI] [PMC free article] [PubMed] [Google Scholar]
- 59.Marquis RW, Ru Y, LoCastro SM, Zeng J, Yamashita DS, Oh HJ, et al. Azepanone-based inhibitors of human and rat cathepsin K. J Med Chem. 2001;44:1380–1395. doi: 10.1021/jm000481x. [DOI] [PubMed] [Google Scholar]
- 60.Bromme D, Lecaille F. Cathepsin K inhibitors for osteoporosis and potential off-target effects. Expert Opin Investig Drugs. 2009;18:585–600. doi: 10.1517/13543780902832661. [DOI] [PMC free article] [PubMed] [Google Scholar]
- 61.Jensen AB, Wynne C, Ramirez G, He W, Song Y, Berd Y, et al. The cathepsin K inhibitor odanacatib suppresses bone resorption in women with breast cancer and established bone metastases: results of a 4-week, double-blind, randomized, controlled trial. Clin Breast Cancer. 2010;10:452–458. doi: 10.3816/CBC.2010.n.059. [DOI] [PubMed] [Google Scholar]
- 62.Kumar S, Dare L, Vasko-Moser JA, James IE, Blake SM, Rickard DJ, et al. A highly potent inhibitor of cathepsin K (relacatib) reduces biomarkers of bone resorption both in vitro and in an acute model of elevated bone turnover in vivo in monkeys. Bone. 2007;40:122–131. doi: 10.1016/j.bone.2006.07.015. [DOI] [PubMed] [Google Scholar]
- 63.Palermo C, Joyce JA. Cysteine cathepsin proteases as pharmacological targets in cancer. Trends Pharmacol Sci. 2008;29:22–28. doi: 10.1016/j.tips.2007.10.011. [DOI] [PubMed] [Google Scholar]
- 64.Robichaud J, Black WC, Therien M, Paquet J, Oballa RM, Bayly CI, et al. Identification of a nonbasic, nitrile-containing cathepsin K inhibitor (MK-1256) that is efficacious in a monkey model of osteoporosis. J Med Chem. 2008;51:6410–6420. doi: 10.1021/jm800610j. [DOI] [PubMed] [Google Scholar]
- 65.Bingle L, Brown NJ, Lewis CE. The role of tumour-associated macrophages in tumour progression: implications for new anticancer therapies. J Pathol. 2002;196:254–265. doi: 10.1002/path.1027. [DOI] [PubMed] [Google Scholar]
- 66.New DC, Wong YH. CC chemokine receptor-coupled signalling pathways. Sheng Wu Hua Xue Yu Sheng Wu Wu Li Xue Bao (Shanghai) 2003;35:779–788. [PubMed] [Google Scholar]
- 67.Lu Y, Cai Z, Xiao G, Keller ET, Mizokami A, Yao Z, et al. Monocyte chemotactic protein-1 mediates prostate cancer-induced bone resorption. Cancer Res. 2007;67:3646–3653. doi: 10.1158/0008-5472.CAN-06-1210. [DOI] [PubMed] [Google Scholar]
- 68.Galvez BG, Genis L, Matias-Roman S, Oblander SA, Tryggvason K, Apte SS, et al. Membrane type 1-matrix metalloproteinase is regulated by chemokines mono-cyte-chemoattractant protein-1/ccl2 and interleukin-8/CXCL8 in endothelial cells during angiogenesis. J Biol Chem. 2005;280:1292–1298. doi: 10.1074/jbc.M408673200. [DOI] [PubMed] [Google Scholar]
- 69.Cross AK, Woodroofe MN. Chemokine modulation of matrix metalloproteinase and TIMP production in adult rat brain microglia and a human microglial cell line in vitro . Glia. 1999;28:183–189. [PubMed] [Google Scholar]
- 70.McQuibban GA, Gong JH, Wong JP, Wallace JL, Clark-Lewis I, Overall CM. Matrix metalloproteinase processing of monocyte chemoattractant proteins generates CC chemokine receptor antagonists with anti-inflammatory properties in vivo . Blood. 2002;100:1160–1167. [PubMed] [Google Scholar]
- 71.Wolf M, Albrecht S, Marki C. Proteolytic processing of chemokines: implications in physiological and pathological conditions. Int J Biochem Cell Biol. 2008;40:1185–1198. doi: 10.1016/j.biocel.2007.12.009. [DOI] [PubMed] [Google Scholar]
- 72.Tanaka S, Tatsuguchi A, Futagami S, Gudis K, Wada K, Seo T, et al. Monocyte chemoattractant protein 1 and macrophage cyclooxygenase 2 expression in colonic adenoma. Gut. 2006;55:54–61. doi: 10.1136/gut.2004.059824. [DOI] [PMC free article] [PubMed] [Google Scholar]
- 73.Mancini A, Jovanovic DV, He QW Di, Battista JA. Site-specific proteolysis of cyclooxygenase-2: a putative step in inflammatory prostaglandin E(2) biosynthesis. J Cell Biochem. 2007;101:425–441. doi: 10.1002/jcb.21191. [DOI] [PubMed] [Google Scholar]
- 74.Lee RJ, Saylor PJ, Smith MR. Contemporary therapeutic approaches targeting bone complications in prostate cancer. Clin Genitourin Cancer. 2010;8:29–36. doi: 10.3816/CGC.2010.n.005. [DOI] [PMC free article] [PubMed] [Google Scholar]
- 75.DeNardo DG, Brennan DJ, Rexhepaj E, Ruffell B, Shiao SL, Madden SF. Leukocyte complexity predicts breast cancer sorvival and functionally regulates response to chemotherapy. Cancer Discovery. 2011;1:54–67. doi: 10.1158/2159-8274.CD-10-0028. [DOI] [PMC free article] [PubMed] [Google Scholar]
- 76.Moin K, Day NA, Sameni M, Hasnain S, Hirama T, Sloane BF. Human tumour cathepsin B. Comparison with normal liver cathepsin B. Biochem J. 1992;285(Pt 2):427–434. doi: 10.1042/bj2850427. [DOI] [PMC free article] [PubMed] [Google Scholar]
- 77.Kaighn ME, Narayan KS, Ohnuki Y, Lechner JF, Jones LW. Establishment and characterization of a human prostatic carcinoma cell line (PC-3) Invest Urol. 1979;17:16–23. [PubMed] [Google Scholar]
- 78.Stone KR, Mickey DD, Wunderli H, Mickey GH, Paulson DF. Isolation of a human prostate carcinoma cell line (DU 145) Int J Cancer. 1978;21:274–281. doi: 10.1002/ijc.2910210305. [DOI] [PubMed] [Google Scholar]
- 79.Navone NM, Olive M, Ozen M, Davis R, Troncoso P, Tu SM, et al. Establishment of two human prostate cancer cell lines derived from a single bone metastasis. Clin Cancer Res. 1997;3:2493–2500. [PubMed] [Google Scholar]
- 80.Baley PA, Yoshida K, Qian W, Sehgal I, Thompson TC. Progression to androgen insensitivity in a novel in vitro mouse model for prostate cancer. J Steroid Biochem Mol Biol. 1995;52:403–413. doi: 10.1016/0960-0760(95)00001-g. [DOI] [PubMed] [Google Scholar]
- 81.Goswami S, Sahai E, Wyckoff JB, Cammer M, Cox D, Pixley FJ, et al. Macrophages promote the invasion of breast carcinoma cells via a colony-stimulating factor-1/epidermal growth factor paracrine loop. Cancer Res. 2005;65:5278–5283. doi: 10.1158/0008-5472.CAN-04-1853. [DOI] [PubMed] [Google Scholar]
- 82.Weischenfeldt J, Porse B. Bone marrow-derived macrophages (BMM): isolation and applications. CSH Protoc. 2008;2008 doi: 10.1101/pdb.prot5080. pdb prot5080. [DOI] [PubMed] [Google Scholar]
- 83.Andersen C, Bagi CM, Adams SW. Intra-tibial injection of human prostate cancer cell line CWR22 elicits osteoblastic response in immunodeficient rats. J Musculoskelet Neuronal Interact. 2003;3:148–155. [PubMed] [Google Scholar]
Associated Data
This section collects any data citations, data availability statements, or supplementary materials included in this article.