

Abstract
Motor neurons are progressively and predominantly degenerated in ALS, which is not only induced by multiple intrinsic pathways but also significantly influenced by the neighboring glial cells. In particular, astrocytes derived from the SOD1 mutant mouse model of ALS or from human familial or sporadic ALS patient brain tissue directly induce motor neuron death in culture; however, the mechanisms of pathological astroglial secretion remain unclear. Here we investigated abnormal calcium homeostasis and altered exocytosis in SOD1G93A astrocytes. We found that purinergic stimulation induces excess calcium release from the ER stores in SOD1G93A astrocytes, which results from the abnormal ER calcium accumulation and is independent of clearance mechanisms. Furthermore, pharmacological studies suggested that store-operated calcium entry (SOCE), a calcium refilling mechanism responsive to ER calcium depletion, is enhanced in SOD1G93A astrocytes. We found that oxidant-induced increased S-glutathionylation and calcium-independent puncta formation of the ER calcium sensor STIM1 underlies the abnormal SOCE response in SOD1G93A astrocytes. Enhanced SOCE contributes to ER calcium overload in SOD1G93A astrocytes and excess calcium release from the ER during ATP stimulation. In addition, ER calcium release induces elevated ATP release from SOD1G93A astrocytes, which can be inhibited by the overexpression of dominant-negative SNARE. Selective inhibition of exocytosis in SOD1G93A astrocytes significantly prevents astrocyte-mediated toxicity to motor neurons and delays disease onset in SOD1G93A mice. Our results characterize a novel mechanism responsible for calcium dysregulation in SOD1G93A astrocytes and provide the first in vivo evidence that astrocyte exocytosis contributes to the pathogenesis of ALS.
Introduction
Amyotrophic lateral sclerosis (ALS) is a typical motor neuron disease, in which the upper and lower motor neurons are progressively and predominantly degenerated. Although 90% of ALS is sporadic, studies from the inherited forms of ALS have provided much of our current understanding of the disease pathogenesis (Robberecht and Philips, 2013). Accumulating evidence from transgenic SOD1 mutant models have suggested that motor neuron degeneration is not only induced by multiple intrinsic pathways but also significantly influenced by the neighboring glial cells (Ilieva et al., 2009). Pathological analysis of genetically chimeric mice, in which the SOD1 mutant is selectively excised from different CNS cell types, demonstrated that various glial cells significantly promote disease progression (Boillée et al., 2006; Yamanaka et al., 2008; Kang et al., 2013). Moreover, astrocytes derived from the mouse SOD1 mutant model or from human familial and sporadic ALS patient brain tissue secrete toxic factors that directly induce cell death of either primary or embryonic stem (ES) cell-derived motor neurons (Di Giorgio et al., 2007; Nagai et al., 2007; Marchetto et al., 2008; Haidet-Phillips et al., 2011). These results suggest a primary pathogenic role of astrocytes in ALS.
In adult mammalian CNS, astrocytes form tripartite synapses with presynaptic and postsynaptic neuronal terminals and actively modulate neuronal/synaptic functions by releasing glutamate, ATP, and d-serine (Halassa et al., 2007; Barres, 2008; Woo et al., 2012). Although many mechanisms have been found to mediate astrocyte secretion, vesicular exocytotic release dependent on soluble N-ethylmaleimide-sensitive factor attached protein (SNARE) represents a major pathway for astrocyte secretion (Bezzi et al., 2004; Zhang et al., 2004; Pascual et al., 2005). SNARE-dependent exocytotic secretion in astrocytes can be regulated by elevated intracellular calcium levels (Jourdain et al., 2007; Liu et al., 2011), although the detailed mechanisms are still under investigation (Agulhon et al., 2008; Hamilton and Attwell, 2010). SNARE-dependent vesicular release from astrocytes is involved in regulating synaptic strength (Jourdain et al., 2007), sleep homeostasis (Halassa et al., 2009), ischemic injury (Hines and Haydon, 2013), and major depression (Cao et al., 2013). Whether SNARE-dependent exocytosis is dysregulated and contributes to astrocyte toxicity in ALS model remains essentially unknown.
Intracellular calcium levels in astrocytes are characteristically elevated in response to physiological and pathological signals, as a unique form of astrocyte excitability (Agulhon et al., 2008). This is primarily mediated by the release of calcium from the endoplasmic reticulum (ER) store after activation of the inositol 1,4,5-trisphosphate (IP3) receptor. However, depletion of calcium from the ER store also activates a calcium refilling mechanism known as store-operated calcium entry (SOCE; Smyth et al., 2010). In this study, we investigate the abnormal calcium homeostasis and altered exocytosis in SOD1G93A astrocytes. We characterize the molecular mechanisms responsible for calcium dysregulation in SOD1G93A astrocytes and demonstrate that astrocyte exocytosis significantly contributes to SOD1G93A astrocyte-mediated toxicity to motor neurons in ALS.
Materials and Methods
Reagents.
All reagents were from Sigma, unless otherwise noted. YFP–STIM1 construct was a gift from Dr. Tobius Mayer (Stanford University, Stanford, CA; Addgene plasmid 18857). pDsRed2–Mito (Clontech) was a gift from Dr. Christos Chinopoulos (Department of Medical Biochemistry, Semmelweis University, Budapest, Hungary).
Animals.
SOD1G93A+ transgenic [B6SJL–Tg(SOD1–G93A)1Gur/J], SOD1WT+ transgenic [B6.Cg–Tg(SOD1)2Gur/J], and F1 hybrid wild-type (WT) (B6SJLF1/J) mice were obtained from The Jackson Laboratory. SOD1G93A mice were first bred with TetO–dominant-negative SNARE (dnSNARE) mice to generate SOD1G93A+ dnSNARE+ mice. SOD1G93A+ dnSNARE+ mice were then bred with glial fibrillary acidic protein (GFAP)–tetracycline-controlled transactivator protein (tTA) mice to generate SOD1G93A+ dnSNARE+ tTA+ triple transgenic mice. Doxycycline (Dox; 40 mg/kg) was supplemented in the diet during breeding to suppress dnSNARE expression and allow normal development but was removed once the mice were weaned at P21. Mice of both genders were used in all experiments. Care and treatment of animals in all procedures strictly followed the National Institutes of Health Guide for the Care and Use of Laboratory Animals and the Guidelines for the Use of Animals in Neuroscience Research and were approved by the Animal Care and Use Committee of Tufts University and Weill Medical College of Cornell University. We adhered to Institutional Animal Care and Use Committee recommendations for euthanasia of end-stage SOD1G93A mice.
Primary astrocyte cultures.
Spinal cords were removed from adult mice (P60), unless otherwise noted. Spinal cords were briefly washed in PBS and passed through mesh filters (75 μm) with a glass pestle. Tissue homogenate was centrifuged at 1500 × g for 5 min and cultured in 25 mm2 tissue culture flasks with a total of 5 ml of culture medium comprising DMEM with 10% fetal bovine serum and antibiotic/antimycotic solution (Invitrogen). Medium was changed the following day and subsequently every 3–4 d. After 1 week in culture, microglia were removed by shaking the flasks at 250 rpm overnight at 37°C. Astrocytes attached to the bottom of flasks were trypsinized and plated on glass coverslips for live-cell imaging or on tissue culture-coated plates for biochemical assays. Cells were typically used within 1 week of replating. Cells were confirmed as astrocytes by immunofluorescence labeling with an antibody against GFAP. For neonatal (P0–P3) astrocyte cultures, cortices or spinal cords were dissected, and the meninges were removed from the cortices or spinal cords under the dissecting microscope. The tissue was then minced with a razor blade and trypsinized (0.05% trypsin; Sigma-Aldrich) for 10 min in a 37°C water bath and then dissociated gently by trituration with a fire-polished Pasteur pipette. Dissociated cells were filtered through a 70 μm strainer to collect clear astrocyte cell suspension. Immunostaining with cell type-specific markers (GFAP/Iba1/Olig2/NeuN) revealed that the spinal or cortical astrocyte cultures had minimal contamination of other cell types in the CNS (<5%; data not shown). For setting up astrocyte motor neuron cocultures, 50,000 astrocytes per well were directly seeded on eight-well culture slides (BD Biosciences).
Calcium imaging and analyses.
Astrocytes were loaded with 4 μm Fluo4 (Invitrogen) in loading buffer containing the following (in mm): 156 NaCl, 3 KCl, 2 MgSO4, 1.25 KH2PO4, 2 CaCl2, 10 glucose, and 10 HEPES, pH 7.35. Pluronic-F127 (0.005%; Invitrogen) was supplemented for efficient Fluo4 dispersion. Cells were incubated with the dye for 30 min at room temperature and washed three times with imaging buffer (same as loading buffer except with additional 1 mm EGTA but no CaCl2). For mitochondrial membrane potential measurements, cells were loaded with tetramethylrhodamine (TMRM; 20 nm) in the same manner as with Fluo4 loading, with the exception that there was no Pluronic-F127 added, and cells were washed and imaged in loading buffer. Live-cell imaging was performed on a Leica TCS SP5 spectral confocal microscope using a water-immersion 20× [0.7 numerical aperture (NA)] lens. The objective lens, stage, and perfusion lines were heated to 37°C. During the recordings, cells were perfused with reagents to release intracellular calcium stores [20 μm ATP or 1 μm thapsigargin (TG)] and/or 1 μm trifluorocabonylcyanide phenyhydrazone (FCCP; a mitochondria uncoupler). For SOCE, 2 mm CaCl2 containing buffer was perfused during depletion of intracellular calcium stores with TG or ATP. To determine involvement of TRPC channels, 2 mm SrCl2 was substituted for CaCl2 during SOCE perfusion. Changes in Fluo4 fluorescence were analyzed with MetaMorph (Molecular Devices). For cytosolic calcium changes, Fluo4 fluorescence was normalized to initial fluorescence value and plotted against time. Peak fluorescence, time-to-peak, and clearance time (time between peak and half of the peak fluorescence on the decay curve) were assessed for each plot. Clearance rate was also examined by the rate of fluorescence decay fitted to an exponential decay equation, expressed as (fluorescence change/s) × 100. SOCE was determined by the difference between the peak calcium entered and baseline after ER calcium depletion. For each experiment, at least four coverslips prepared from three or more independent spinal cords were analyzed.
Immunocytochemistry and labeling of mitochondria and ER.
Astrocytes were stained with 50 nm MitoTracker Red and 1 μm ERTracker Green (Invitrogen) in culture medium for 30 min at 37°C. Z-stack images were obtained using the Leica TCS SP5 spectral confocal microscope. Fluorescence intensity of MitoTracker Red and ERTracker Green after threshold in whole cells was quantified by MetaMorph. Colocalization of the two fluorescent probes was assessed by the colocalization function of MetaMorph. For immunocytochemistry, astrocytes were fixed with 4% paraformaldehyde (PFA; 10 min), followed by three washes in PBS. Cells were permeabilized with 0.1% Triton X-100 (10 min), blocked with buffer containing 10% normal goat serum and 1% bovine serum albumin in PBS (30 min). Primary antibodies were applied in blocking buffer (overnight 4°C) and washed three times in PBS before secondary antibody application (1:500, 1 h). Cells were washed three times in PBS. All steps were performed at room temperature besides the primary antibody application.
Mitochondrial swelling assays.
Spinal cord astrocytes were transfected with mitoDsRed plasmid with Lipofectamine 2000 (Invitrogen). A swelling experiment was conducted 48 h after transfection. Cells were perfused with 100 μm ATP to induce ER calcium release, while mitoDsRed fluorescence was monitored by live-cell imaging on the confocal microscope using the 40× or 63× lens. Alamethicin was added at the end of experiment to cause maximal swelling. Mitochondrial swelling was measured by the thinness ratio (TR) technique (Gerencser et al., 2008). Briefly, the TR technique measures changes in average mitochondrial diameters using algorithms in the Image Analyst MKII software (Image Analyst Software). To calculate TR, for each time point, the mean-intensity image was projected and spatially filtered with high- and low-frequency bandpass spatial filters, and the absolute value of pixels was determined. The TR was calculated as the ratio of the average fluorescence intensity in the high-frequency over the low-frequency bandpass filtered image. Baseline normalized TR is given as δTR = (TR − TR0)/TR0. Mitochondrial swelling causes the loss of high spatial frequency image details and therefore a decrease in the TR value. For example, mastoparan or alamethicin yields δTR of ∼0.6–0.7 (Gerencser et al., 2008).
RNA extraction and quantitative real-time PCR.
Total RNA was extracted from astrocytes using the RNAqueous for the PCR kit following the instructions of the manufacturer (Invitrogen). Quantitative real-time PCR was performed using the SYBR Green RNA master kit according to the protocol of the manufacturer (Roche Applied Science). The relative expression ratio of each target gene was calculated based on PCR efficiency and the cross-point deviation of the mutant sample to the control and was expressed in comparison with a reference gene, β-actin, based on the Plaffl's method (Pfaffl, 2001). The primers used for calreticulin included the following: forward, TGGACGGAGATGCCTGGACCAA; reverse, AGCCGCCCCCACAGTCGATA.
ATP measurement.
ATP released from astrocytes plated on 24-well plates (5000–10,000 cells per well) was measured with the ENLITEN ATP assay (Promega). Cells were washed twice with DMEM and incubated in DMEM for 30 min at 37°C. Secreted ATP was measured from the conditioned medium before and after application of 5 μm TG for 1 min. An equal volume of medium was mixed with the luciferin/luciferase reagent, and bioluminescence was detected with the OPTOCOMP1 luminometer (MGM Instruments). Luminescence values were converted to femtomoles of ATP based on a standard curve. ATP released was normalized by either number of cells or baseline ATP in the medium. For cortical cells, cell number was estimated by calcein fluorescence. Cells were incubated with calcein (1 μm) for 30 min at 37°C, washed with PBS, and lysed with RIPA buffer. Calcein fluorescence measured on the spectrophotometer at excitation/emission wavelength of 495/516 nm on the SpectraMAX spectrophotometer (Molecular Devices).
Glutathione measurement.
Glutathione content in whole cells was measured with monochlorbimane (MCB; Invitrogen). Astrocytes were loaded with 40 μm MCB and 1 μm calcein for 30 min at 37°C. Cells were washed with PBS. MCB and calcein fluorescence was measured with excitation/emission of 355/460 and 495/516 nm, respectively, on the SpectraMAX spectrophotometer.
Spinal cord fractionation.
Spinal cords extracted from P60 mice were homogenized in buffer containing the following (in mm): 225 mannitol, 75 sucrose, 5 Tris-HCl, pH 7.4, 0.1 EGTA, 50 N-ethylmaleimide (NEM), and protease inhibitors (Roche) using a glass homogenizer/Teflon pestle. Homogenates were centrifuged at 1000 × g to remove nuclei and debris. The pellet was resuspended in half of the starting volume to repeat the homogenization/centrifugation again. The combined supernatant was centrifuged at 10,000 × g to enrich heavy membrane fractions. The supernatant was centrifuged at 100,000 × g to enrich microsomes/ER membranes. Membrane fractions were resuspended in the isolation buffer. Protein concentration in each fraction was determined by the DC Protein Assay (Bio-Rad). An equal amount of protein was loaded in each lane for non-reducing SDS-PAGE for analysis.
Immunoprecipitation.
P2 astrocytes were treated with 100 μm buthionine sulfoximine (BSO; for nontransgenic WT cells), 10 or 100 μm butyl-hydroxyanisole (BHA; for mutant SOD1 cells), or respective vehicle controls overnight. Cells were lysed in RIPA buffer containing protease inhibitors and 50 mm NEM on ice for 20 min. Debris was removed by centrifugation at 2000 rpm for 5 min. Protein A-agarose beads were conjugated with a monoclonal STIM1 antibody (BD Biosciences Transduction Laboratories) at room temperature for 2 h. Cell lysate was added to the antibody-conjugated beads overnight at 4°C. Beads were washed three times in lysis buffer, and proteins were eluted by heating at 65°C for 10 min in Laemmli's buffer without reducing agents. During brief centrifugation, eluates were subjected to SDS-PAGE for analysis.
Immunoblot.
Proteins were separated on 4–12% Bis-Tris NOVEX gels with 3-(N-morpholino)-propanesulfonic acid buffer under native nonreducing conditions, according to the instructions of the manufacturer (Invitrogen). Proteins were transferred to PVDF membranes and blocked in 5% milk in Tris-buffered saline with 0.01% Tween 20 (TBS-T). Primary antibodies were applied in blocking buffer overnight at 4°C. Membranes washed with TBS-T three times were incubated with appropriate HRP-conjugated secondary antibodies at room temperature for 1 h. After three washes in TBS-T, protein bands were visualized with enhanced chemiluminescence substrates (Thermo Fisher Scientific). Primary antibodies used were as follows: anti-STIM1 (polyclonal; Cell Signaling Technology), anti-STIM1 (monoclonal; BD Biosciences Transduction Laboratories), anti-GSH (Virogen), and calreticulin (Affinity Bioreagents). Independent reducing Western blots were performed to verify the immunoreactivity of the anti-STIM1 antibody against monomeric denatured STIM1.
Differentiation and purification of motor neurons from mouse ES cells.
Mouse ES cells (a kind gift from Dr. Kevin Eggan, Harvard University, Cambridge, MA) were derived from Hb9-driven eGFP transgenic mice. Mouse ES cells were differentiated into motor neurons through methods described previously (Di Giorgio et al., 2007; Nagai et al., 2007). Briefly, ES cells were grown on top of mouse embryonic fibroblasts to 70–80% confluence in ES cell medium (knock-out DMEM, 10% fetal calf serum, 5% knock-out serum, 1% Glutamax, 1% nonessential amino acids, 1% penicillin/streptomycin, 0.14% 2-mercaptoethanol, and 1000 U of leukemia inhibitory factor). ES cells were then dissociated to induce the formation of embryoid bodies (EBs) in EB medium (DMEM/F-12, 10% knock-out serum, 1% Glutamax, 1% penicillin/streptomycin, and 0.1% 2-mercaptoethanol). To differentiate EBs into motor neurons, retinoic acid (final concentration of 0.1 μm) and smoothened agonist (final concentration of 1 μm) were added into the medium for 5 d. Differentiated motor neurons were further purified through fluorescence-activated cell sorting based on the eGFP fluorescence, driven by Hb9 promoter activation during differentiation. Purified eGFP+ motor neurons were plated on a confluent astrocyte layer (35,000 per well) or directly (50,000 per well) on poly-d-lysine-coated eight-well culture slides (BD Biosciences) in motor neuron culture medium (DMEM/F-12, 5% horse serum, 1% Glutamax, 2% B27, 1% N-2 supplement, 1% penicillin/streptomycin, 10 ng/ml GDNF, 10 ng/ml CNTF, and 10 ng/ml BDNF). Half of the motor neuron medium was replaced with fresh medium supplemented with growth factors every day. For BHA treatment, fresh medium replenished with 1 or 10 μm BHA was added into the coculture daily for up to 10 d.
Preparation of astrocyte conditioned medium.
Astrocyte conditioned medium (ACM) was prepared from confluent astrocytes in 24-well dishes. Normal motor neuron culture medium was conditioned with confluent cortical astrocytes for 6 d to prepare the ACM. Medium was centrifuged at 500 × g for 10 min to remove cell debris. The medium was then supplemented with 4.5 mg/ml d-glucose, 1× penicillin/streptomycin, and trophic factors (10 ng/ml GDNF, 10 ng/ml CNTF, and 10 ng/ml BDNF) to keep consistent with normal motor neuron culture condition. Medium was not replaced once treated with ACM to avoid dilution.
In vitro quantification of motor neurons.
Mosaic images from the entire culture well were acquired at multiple time points [7–21 d in vitro (DIV)] and used to calculate the percentage of eGFP+ surviving motor neurons. Images taken from three to five wells per condition were quantified. Although SOD1G93A+ dnSNARE+ tTA+ astrocytes are also eGFP+ as a result of dnSNARE induction, eGFP fluorescence from SOD1G93A+ dnSNARE+ tTA+ astrocytes did not interfere with motor neuron quantification, because the glial monolayers are not in the same focal plane as the neuronal layers during image acquisition. The distinct neuronal morphology of ES-derived eGFP+ motor neurons (ESMNs) was also used as a criterion for identification of motor neurons. For quantitative measurement of motor neuron neurite length in cultures, confocal images were analyzed with Imaris Software (Bitplane) using the filament tracing tool. The local contrast threshold was set up to detect processes, as thin as 2 μm, arising from cell bodies with 20 μm diameter. Disconnected segments with a >5 μm gap were ignored. For each cell, the sum of the filaments determined from each individual cell in Imaris software was recorded as the total neurite length and was plotted in GraphPad Prism.
In vitro astrocyte FM1-43 imaging.
FM1-43 imaging was performed using the Leica TCS SP2 confocal scanning unit attached to a Leica DMIRE2 microscope. Briefly, spinal cord astrocyte cultures (P0–P3 pups) were prepared from WT, SOD1G93A+, dnSNARE+ tTA+, and SOD1G93A+ dnSNARE+ tTA+ mice. At day 7, spinal astrocyte culture grown on the coverslip was incubated at room temperature in HBSS, pH 7.3, containing 3 μm FM1-43 lipophilic styryl dye (Invitrogen). After a 10 min loading period, the coverslip was placed in calcium-free HBSS and washed three times at room temperature. The astrocyte culture coverslip was then quickly transferred to a glass-bottom dish with HBSS (MatTek) and mounted on the microscope. Dye-loaded astrocytes were visualized with a 20× objective (0.7 NA). Fluorescence images were obtained using a krypton/argon laser at 488 nm, which emitted light at a range of 610–700 nm. After 1 min baseline acquisition, images were acquired every 60 s for 20 min. FM1-43 imaging was analyzed with Leica TCS SP2 software. All values are expressed as mean ± SEM.
Immunohistochemistry and in vivo quantification of motor neurons.
Mice (P100) were perfused with 4% PFA, and the spinal cords were dissected, fixed in 4% PFA, and cryoprotected with 30% sucrose solution. Thin spinal cord sections (20 μm) were prepared using a cryostat (Thermo Fisher Scientific). Sections were then incubated with blocking solution (0.2% Triton X-100, 5% goat serum, and 1% BSA) for 30 min, followed by overnight incubation with the primary antibodies GFAP (1:500), choline acetyltransferase (ChAT; 1:100), or NeuN (1:500) at 4°C. After overnight incubation, sections were washed three times with PBS, and the immunostaining signal was detected with Alexa Fluor-555-conjugated goat anti-rabbit or anti-mouse secondary (1:2000) antibodies (Jackson ImmunoResearch). Confocal images were captured by the Nikon A1R confocal microscope using NIS-elements software under a 20× lens (for NeuN and ChAT staining) and a 60× lens (for GFAP staining) (Nikon Instruments). NeuN+ cells above a certain particle size (800 pixel2) with the circularity between 0 and 1, as determined in NIH Image J, were counted from the images.
Determination of disease onset and end stage.
Early disease onset was determined by the loss of 10% grip strength, as described previously (Yamanaka et al., 2008). Because of the variability of hindlimb grip strength, we focused on the measurement of forelimb grip strength, which is highly consistent (Yamanaka et al., 2008). We measured the forelimb grip strength of mice weekly, using the grip-strength meter (model 1027 DSM; Columbus Instruments), between 60 and 120 d of age. We first calculated the average of three peak grip-strength values as the baseline for forelimb grip strength for each mouse. We then assessed the 10% decreased value based on the baseline and compared it with the measured grip-strength data to determine the age at which the grip strength equals a 10% decrease of baseline value. The weight was measured once a week, starting at P60 until end stage. Late disease onset was determined by the loss of 10% weight, as described previously (Yamanaka et al., 2008). Disease end stage was determined by a delayed (30 s) righting reflex (Solomon et al., 2011). We started to analyze the righting reflex at 100 d of age. Both the measurement of grip strength and weight was performed in a complete blind manner.
Statistical analyses.
Student's t test or one-way ANOVA, followed by either Dunn's or Bonferroni's test, were used to determine statistical significance. The log-rank analysis was used to determine the significance for Kaplan–Meier curves. p < 0.05 was considered to be statistically significant. All experiments were performed a minimum of three times. Results were presented as mean ± SD, unless otherwise stated.
Results
Abnormal cytosolic calcium handling in astrocytes from SOD1G93A+ mice
Because intracellular calcium levels are important in the regulation of cell secretion processes, we studied calcium dynamics in SOD1G93A astrocytes. We cultured primary astrocytes from adult spinal cord of SOD1G93A+ and littermate nontransgenic (WT) mice at 60 d (presymptomatic stage) and 90 d (early symptomatic stage) of age. In SOD1G93A spinal cord, although astrogliosis is detectable at 60 d of age, it is significantly increased at 90 d (Ringer et al., 2009). Astrocyte cultures were immunoreactive for GFAP and were devoid of CD11b-positive microglial cells, and morphology did not differ between SOD1G93A and WT astrocytes (data not shown).
Gq-protein-coupled receptor activation on the plasma membrane is a major mechanism for the elevation of intracellular calcium levels in astrocytes, resulting from ER calcium release (Agulhon et al., 2008). Intracellular calcium dynamics was evaluated by live-cell imaging using the fluorescent dye Fluo4, in response to purinergic receptor activation by ATP, which results in IP3 production at the plasma membrane and activation of the IP3 receptor on the ER. We stimulated astrocytes with ATP in calcium-free perfusion medium to focus specifically on the handling of intracellular calcium stores (Fig. 1A). ATP stimulation led to a higher release of ER calcium in SOD1G93A spinal cord-derived astrocytes compared with WT cells, indicated by the larger F/F0 peak (Fig. 1B, Table 1). In addition, Fluo4 fluorescence reached peak faster in SOD1G93A+ astrocytes than nontransgenic WT astrocytes (Fig. 1B, Table 1). Cytosolic calcium clearance rates were similar in SOD1G93A+ and WT astrocytes, as indicated by the time taken for the fluorescence to decline to half of the peak value (Table 1). In contrast, ATP stimulation of ER calcium release in adult spinal cord astrocytes from transgenic mice expressing WT human SOD1 did not evidence differences in peak amplitude relative to astrocytes from their nontransgenic littermate controls (data not shown). Stimulation with BzATP, a nonhydrolyzable form of ATP, showed similar ER calcium release as ATP in SOD1G93A+ and WT astrocytes (data not shown). Enhanced ATP-induced ER calcium release was also observed in SOD1G93A+ astrocytes derived from neonatal cortices (Fig. 1C, Table 1) and in astrocytes derived from 90-d-old spinal cords (Table 1), suggesting a general phenomenon affecting SOD1G93A+ astrocytes in cortex and spinal cord and at different disease stages. We focused on the 60-d-old spinal cord astrocytes in subsequent experiments, because we deemed that astrocytes at this time point are less likely to be affected by remodeling of the spinal cord cytoarchitecture in the SOD1G93A model.
Figure 1.

Dysregulation of intracellular calcium signaling in SOD1G93A+ astrocytes. A, Pseudocolored Fluo4 fluorescence images in spinal cord astrocytes show a prominent rise in intracellular calcium by 30 s during stimulation with 20 μm ATP that is cleared by 180 s. Scale bars, 20 μm. B, Average traces of Fluo4 fluorescence changes in mutant and WT astrocytes from adult mice spinal cords stimulated with 20 μm ATP in calcium-free imaging medium, followed by 1 μm FCCP to dissipate mitochondrial membrane potential. C, Average traces of Fluo4 fluorescence changes in SOD1G93A+ and WT astrocytes derived from P2 mice cortices stimulated with 20 μm ATP. D, Cells were pretreated with an RyR inhibitor, dantrolene (25 μm), for 10 min before imaging. Average traces of Fluo4 fluorescence changes in SOD1G93A+ and WT astrocytes stimulated with 20 μm ATP in the presence of dantrolene. Error bars indicate SEM.
Table 1.
Cytosolic calcium dynamics parameters
| 20 μm ATP, spinal cord, P60 |
20 μm ATP, spinal cord, P90 |
20 μm ATP, cortex, P2 |
1 μm FCCP → 20 μm ATP, spinal cord, P60 |
1 μm TG, spinal cord, P60 |
25 μm dantrolene/20 μm ATP, spinal cord, P60 |
|||||||
|---|---|---|---|---|---|---|---|---|---|---|---|---|
| WT (n = 27) | G93A (n = 29) | WT (n = 48) | G93A (n = 44) | WT (n = 20) | G93A (n = 31) | WT (n = 12) | G93A (n = 13) | WT (n = 19) | G93A (n = 37) | WT (n = 24) | G93A (n = 20) | |
| Peak F/F0 | 3.03 ± 0.21 | 4.34 ± 0.23* | 3.56 ± 0.18 | 6.09 ± 0.49* | 3.24 ± 0.32 | 5.13 ± 0.24* | 3.89 ± 0.38 | 5.34 ± 0.42* | 2.07 ± 0.22 | 3.04 ± 0.24* | 4.19 ± 0.50 | 6.01 ± 0.75 |
| Time-to-peak (s) | 49.9 ± 2.0 | 39.4 ± 2.5* | 34.3 ± 2.6 | 26.5 ± 2.6* | 43 ± 2.4 | 26 ± 0.9* | 44.3 ± 3.2 | 37.8 ± 1.9 | 69.5 ± 7.2 | 66.8 ± 5.5 | 40 ± 5.4 | 25.8 ± 6.2* |
| ½ peak time (s) | 56.7 ± 13.7 | 53.6 ± 5.1 | 40.1 ± 3.2 | 41.9 ± 2.9 | 22 ± 0.5 | 21 ± 1.4 | 36.3 ± 5.8 | 29.4 ± 2.8 | 77.3 ± 13.5 | 84.3 ± 9.7 | n.d. | n.d. |
| Clearance rate | 0.83 ± 0.09 | 1.1 ± 0.09 | 1.3 ± 0.1 | 1.6 ± 0.2 | n.d. | n.d. | n.d. | n.d. | 0.28 ± 0.03 | 0.35 ± 0.02 | n.d. | n.d. |
Parameters of cytosolic calcium changes during ER and mitochondrial calcium release in spinal cord and cortical astrocytes were determined from Fluo4 fluorescence plots (for images and traces, see Fig. 1). See Materials and Methods for determination of each parameter.
*p < 0.05 by Student's t test. Error indicates SEM, and n denotes total number of astrocytes analyzed from at least four coverslips, derived from at least three independent spinal cord preparations. n.d., Not determined.
An initial calcium release from the ER can cause additional calcium discharge through ryanodine receptors (RyRs) by a mechanism known as calcium-induced calcium release (CICR). To test whether excess RyR-mediated CICR contributed to excess ER calcium release in SOD1G93A+ astrocytes, we pretreated cells with the RyR inhibitor dantrolene (25 μm) and then induced ER calcium release by ATP. In the presence of dantrolene, cells displayed loss of synchronicity and presence of oscillations in ER calcium release. Nevertheless, ER calcium release was still faster and higher in SOD1G93A+ cells compared with WT (Fig. 1D, Table 1), suggesting that CICR does not contribute to excess ER calcium release in SOD1G93A+ astrocytes.
Mitochondrial calcium uptake does not contribute to excess cytosolic calcium release by ATP in SOD1G93A+ astrocytes
Mitochondria play a critical role in regulating cytosolic calcium dynamics by actively taking up calcium in the matrix. Calcium transport into the mitochondrial matrix is driven by membrane potential (ΔΨm) and the mitochondrial calcium uniporter activity (Patron et al., 2013). Mitochondrial dysfunction and mitochondrial calcium uptake defects were described extensively in SOD1 models of ALS (Kawamata and Manfredi, 2010; Carri and Cozzolino, 2011), and mitochondrial dysfunction has been suggested in mutant SOD1 astrocytes (Cassina et al., 2008). For these reasons, we wanted to determine whether mitochondrial bioenergetic defects were present in SOD1G93A+ astrocytes.
Because ΔΨm is the driving force for mitochondrial calcium uptake, we first estimated ΔΨm with the potential sensitive dye TMRM and found that SOD1G93A+ astrocytes did not show a decrease in ΔΨm (data not shown), suggesting that the mitochondria of these cells are bioenergetically competent. We also estimated the levels of cytochrome oxidase subunit I (COXI) in astrocytes by immunocytochemistry, because decreased levels of cytochrome oxidase, a crucial enzyme involved in mitochondrial bioenergetics, have been implicated in SOD1 models of ALS (Mattiazzi et al., 2002; Son et al., 2007, 2008). We found similar levels of COXI in WT and SOD1G93A+ astrocytes (Fig. 2A). Together, these results demonstrated that mutant SOD1 astrocyte mitochondria are bioenergetically competent and do not show mitochondrial respiratory chain abnormalities.
Figure 2.
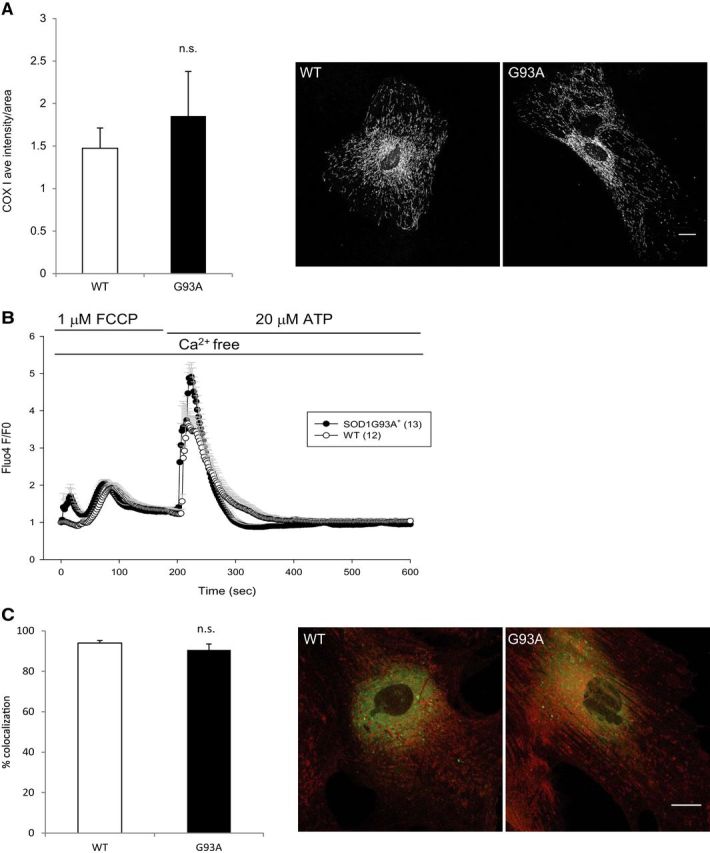
Lack of mitochondrial involvement in the abnormal intracellular calcium signaling in SOD1G93A+ astrocytes. A, Average intensity of COXI immunostaining in SOD1G93A+ and WT astrocytes. The right images are representative COXI immunostaining in SOD1G93A+ and WT astrocytes. B, Average traces of Fluo4 fluorescence changes in SOD1G93A+ and WT astrocytes stimulated with 1 μm FCCP and then 20 μm ATP in calcium-free imaging medium. Despite blockage of mitochondrial calcium buffering, ATP stimulation leads to larger ER calcium release in SOD1G93A+ astrocytes. C, The extent of ER–mitochondrial contact sites were assessed by quantification of colocalization of Mitotracker and ERtracker in SOD1G93A+ and WT astrocytes. Images are representative labeling of ER (green), mitochondria (red), and colocalization of the two organelles (yellow). Scale bars, 20 μm. All error bars indicate SEM, and n.s. indicates a lack of statistical significance, as determined by the Student's t test.
Next, we wanted to assess specifically whether mitochondrial calcium uptake contributed to abnormal cytosolic calcium handling in SOD1G93A+ astrocytes. We perfused the astrocytes with a mitochondrial uncoupler, FCCP (1 μm), before ATP stimulation. FCCP, by dissipating the membrane potential, allows release of already accumulated mitochondrial calcium, and the levels of FCCP-induced mitochondrial calcium release (measured by Fluo4 fluorescence increase; Fig. 2B) were similar in SOD1G93A+ and WT astrocytes. The subsequent ATP-induced calcium release from the ER was still significantly higher in SOD1G93A+ than in WT astrocytes (Fig. 2B, Table 1). We also noticed that, in the ATP stimulation experiments of Figure 1B, after Fluo4 fluorescence returned to prestimulation levels, FCCP induced similar amounts of calcium release from mitochondria of mutant and WT astrocytes (Fig. 1B). These results suggest that SOD1G93A+ astrocyte mitochondria take up similar amounts of calcium as WT cells, and therefore the mitochondrial component of cytosolic calcium clearance is not the reason for excess ATP-induced ER calcium release in SOD1G93A+ astrocytes.
Another contribution of mitochondria to cytosolic calcium is associated with the opening of a calcium-induced permeability transition pore, which causes mitochondrial swelling and release of mitochondrial calcium stores (Bernardi and von Stockum, 2012). This permeability transition event could potentially contribute to increasing cytosolic calcium. Therefore, to test whether the differences in ATP-induced calcium release between SOD1G93A+ and WT astrocytes were associated with mitochondrial permeability transition, we measured mitochondrial swelling by the TR technique (Gerencser et al., 2008) after stimulation with ATP. We did not observe mitochondrial swelling during ATP stimulation, as revealed by a δTR of <0.05, suggesting that mitochondrial permeability transition did not occur in WT or SOD1G93A+ astrocytes under ATP stimulation, and therefore mitochondrial permeability transition could not be the cause of excess ATP-induced cytosolic calcium.
Mitochondria and ER are tightly associated in the transfer of calcium (Rizzuto et al., 2009). Mitochondrial and ER membrane contact sites and the distance between the two organelles can dictate calcium entry into mitochondria and thus potentially affect cytosolic calcium levels, if calcium diffuses in the cytosol instead of entering into mitochondria directly. To test whether there were abnormal ER–mitochondria contact sites that could influence ER–mitochondrial calcium transfer in SOD1G93A+ astrocytes, we assessed the colocalization of mitochondria and ER by labeling them with the vital fluorescent dyes MitoTracker Red and ERTracker Green, respectively. We did not observe a statistically significant difference in ER–mitochondria colocalization in SOD1G93A+ and WT astrocytes (Fig. 2C), suggesting that the distance between the calcium regulating organelles in astrocytes are not altered by mutant SOD1.
In summary, all of the above results demonstrate (1) that astroglial mitochondrial calcium uptake plays a minor role in regulating cytosolic calcium levels and (2) that abnormalities in bioenergetics, mitochondrial distribution relative to the ER, and mitochondrial permeability transition do not contribute to enhanced ER calcium release during ATP stimulation in SOD1G93A+ astrocytes.
Increased ER calcium stores in SOD1G93A+ astrocytes
To determine whether the enhanced ER calcium release in SOD1G93A+ astrocytes was attributable to increased ER calcium stores, we measured cytosolic calcium changes after perfusion with the irreversible sarcoplasmic reticulum Ca2+ ATPase (SERCA) pump inhibitor TG (1 μm), which causes a receptor-independent leakage of ER calcium. SOD1G93A+ astrocytes released higher amounts of calcium in response to TG (Fig. 3A), indicating that the pool of releasable calcium was higher in SOD1G93A+ than in WT astrocytes. Compared with the cytosolic calcium responses to ATP, TG caused a slower calcium rise, followed by a slower calcium clearance (Fig. 3A, Table 1). From this result, we inferred that ER uptake is a major component of cytosolic calcium clearance in astrocytes. After TG treatment, the cytosolic calcium clearance rate was similar in SOD1G93A+ and WT astrocytes. This, together with the relatively minor contribution of mitochondria (Fig. 2), suggests that increased ER calcium stores are the primary cause of enhanced ER calcium release in SOD1G93A+ astrocytes.
Figure 3.
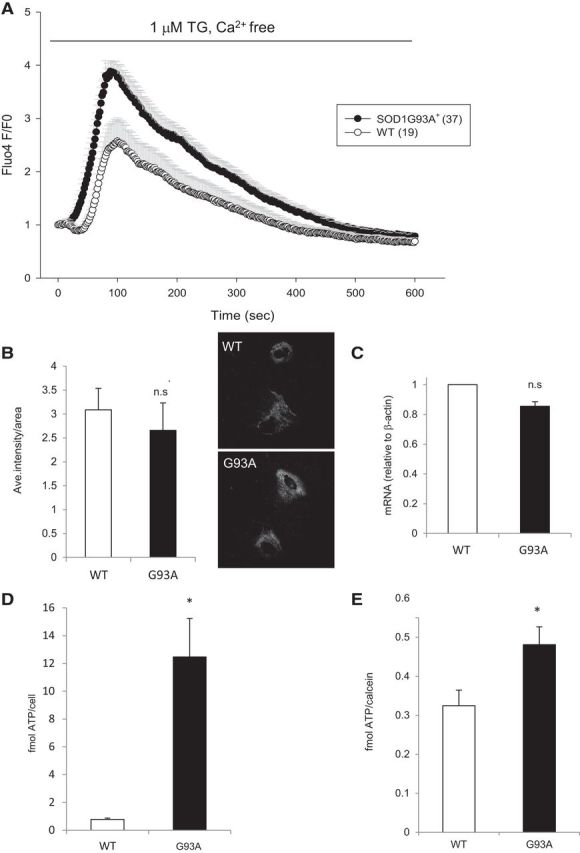
Increased calcium load in the ER of mutant SOD1G93A+ astrocytes. A, Average traces of Fluo4 fluorescence changes in SOD1G93A+ and WT astrocytes treated with 1 μm TG to release ER calcium in a non-receptor-mediated manner. B, Quantification of average intensity of calreticulin immunostaining. The right images show representative calreticulin staining in WT and SOD1G93A+ astrocytes. C, Quantification of calreticulin mRNA levels from WT and SOD1G93A+ astrocytes. D, Secreted ATP levels detected in conditioned medium from adult spinal cord astrocytes during 5 μm TG stimulation. ATP levels were normalized by cell number plated. n = 4 (WT) and 5 (mutant) wells. E, Calcium-induced secretion of ATP from cortical astrocytes during 5 μm TG stimulation. ATP was normalized by cell number estimated by calcein. n = 14 (WT) and 15 (mutant) wells. All error bars are SEM. * denotes statistical significance (p < 0.05) and no significance (n.s) by Student's t test.
To assess whether SOD1G93A+ astrocytes had a larger ER volume, which could explain increased calcium stores, we stained the ER with the fluorescent dye ERTracker Green and quantified the ER content. ER fluorescence intensity normalized by cell area showed that it was not increased in SOD1G93A+ astrocytes compared with WT astrocytes (data not shown). In addition, immunofluorescence of the ER calcium binding protein calreticulin (Fig. 3B), as well as the quantification of calreticulin mRNA by quantitative real-time PCR (Fig. 3C) did not show significant differences between SOD1G93A+ and WT astrocytes. These results indicate that there is no difference in the ER mass between SOD1G93A+ and WT astrocytes and that the capacity to bind calcium in the ER is not affected by mutant SOD1.
Together, these results suggest that excessive ER calcium release during ATP stimulation in SOD1G93A+ astrocytes is attributable to ER calcium overload rather than decreased cytosolic calcium clearance mechanisms, increased ER volume, or increased calreticulin expression.
Enhanced ATP secretion in response to ER calcium release in SOD1G93A+ astrocytes
ER calcium release into the cytosol activates calcium-dependent processes with multiple signaling targets, including exocytosis (Jourdain et al., 2007; Liu et al., 2011; Zorec et al., 2012). Secretion of small molecules could directly affect the synaptic milieu and cause motor neuron toxicity. Thus, we measured ATP released in the medium as an indication of calcium-induced secretion. When ER calcium release was induced with 5 μm TG, increased ATP was found in the medium of SOD1G93A+ astrocytes relative to the amount present before stimulation, in both adult spinal cord and neonatal cortical astrocytes (Fig. 3D,E). This result suggests that ER calcium release enhances exocytosis from SOD1G93A+ astrocytes.
SOCE dysregulation in SOD1G93A+ astrocytes
SOCE entails a calcium influx mechanism through plasma membrane calcium channels in response to the depletion of ER calcium (Smyth et al., 2010), which occurs in many cell types, including astrocytes (Pivneva et al., 2008; Li et al., 2009). The mechanisms of SOCE activation involve the complex coordination of ER and plasma membrane resident proteins, which has been well characterized (Smyth et al., 2010). SOCE activation begins in the ER, in which STIM1, a calcium sensor with an EF-hand domain in the ER lumen, detects a decrease in ER calcium levels. When the level of ER calcium becomes low, STIM1 goes through a conformational change that leads to its oligomerization and movement toward the plasma membrane, in which the ER and plasma membranes form puncta. In the puncta, the cytosolic portion of STIM1 interacts with Orai channels on the plasma membrane, which allows extracellular calcium to enter into the cytosol and transferred into the ER by the SERCA pump. Once calcium is refilled into the ER, STIM1 senses the increased calcium and the STIM1–Orai1 puncta dissociate.
Because SOD1G93A+ astrocytes had ER calcium overload, we hypothesized that their SOCE regulation may be altered. SOCE was monitored in spinal cord astrocytes during depletion of ER calcium by TG, followed by perfusion with 2 mm calcium. The resulting SOCE was higher in SOD1G93A+ than in WT astrocytes (Fig. 4A, Table 2), suggesting that SOCE is enhanced and likely to contribute to elevated ER calcium stores in SOD1G93A+ astrocytes.
Figure 4.
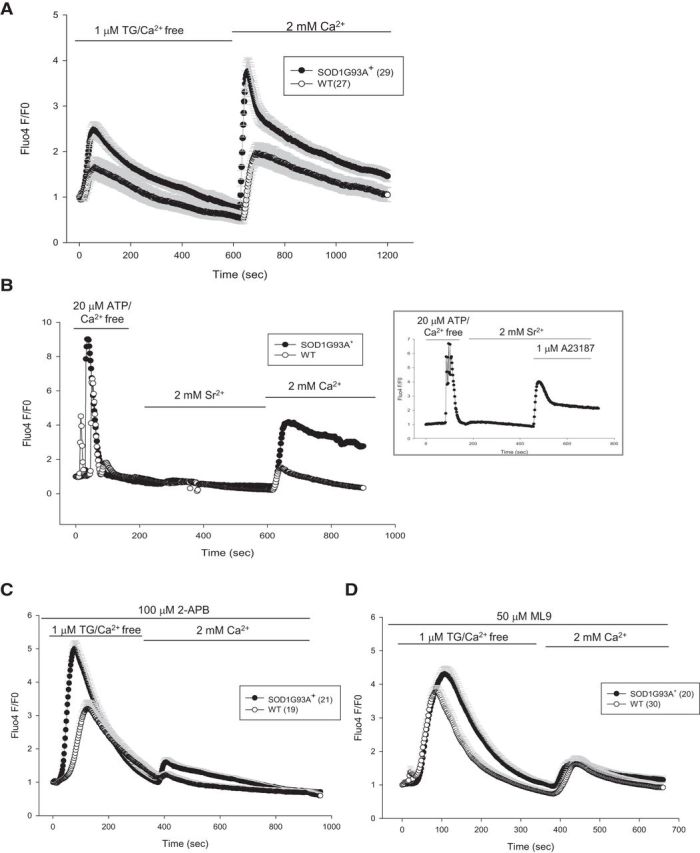
ER calcium-independent, abnormal SOCE in SOD1G93A+ astrocytes. A, SOCE in astrocytes was induced by ER calcium depletion with 1 μm TG in calcium-free medium, followed by perfusion with 2 mm calcium containing medium. The peak of SOCE and rate of entry are higher in SOD1G93A+ astrocytes. B, SOCE induced by 20 μm ATP/calcium-free medium to deplete ER calcium, but instead of 2 mm calcium, 2 mm strontium was used to discriminate between Orai and TRPC channels. At the end of the experiment, 2 mm calcium was perfused. The graph in the inset shows the same experiment, but 1 μm calcium ionophore A23187 was perfused at the end to show that Fluo4 fluorescence responds to strontium. C, Average traces of SOCE in astrocytes pretreated with the SOCE inhibitor 2-APB (100 μm) for 10 min. D, Cells were pretreated with another SOCE inhibitor, ML-9 (50 μm, 10 min), before imaging. All error bars are SEM.
Table 2.
Pharmacological modulation of cytosolic calcium dynamics
| Duration | SOCE (2 mm Ca2+) |
Peak F/F0 (1 μm TG) |
|||
|---|---|---|---|---|---|
| WT | G93A | WT | G93A | ||
| No pretreatment | 0 | 1.29 ± 0.12 (35) | 1.83 ± 0.16* (38) | 2.07 ± 0.22 (19) | 3.04 ± 0.24* (37) |
| 100 μm 2-APB | 10 min | 0.09 ± 0.04 (19) | 0.65 ± 0.15* (21) | n.d. | n.d. |
| 50 μm ML-9 | 10 min | 0.88 ± 0.12 (30) | 0.60 ± 0.08 (20) | n.d. | n.d. |
| 100 μm BSO | 4 h | 3.06 ± 0.47 (14) | 3.01 ± 0.74 (14) | 5.37 ± 0.67 (14) | 3.82 ± 0.71 (14) |
| 1 mm GSHEE | 4 h | 1.67 ± 0.36 (14) | 1.32 ± 0.35 (16) | n.d. | n.d. |
SOCE defined as the difference between calcium influx peak (F/F0) and baseline during ER calcium depletion by TG (1 μm).
*p < 0.05 by Student's t test, G93A SOD1 versus WT astrocytes. Error indicates SEM. Number of astrocytes analyzed per condition is indicated in parentheses. Astrocytes from at least four coverslips from at least three independent spinal cord preparations were analyzed. n.d., Not determined.
The calcium current (ICRAC) underlying SOCE is well characterized in many cell types (Parekh and Putney, 2005), but little is known about the relative involvement of the interaction between STIM1 and Orai or TRPC channels in mediating SOCE in astrocytes (Parpura et al., 2011). These two types of channels can be functionally distinguished on the basis of their cation selectivity, because TRPC, but not Orai, are also permeable to strontium and barium. When extracellular calcium was substituted with strontium, we did not detect Fluo4 fluorescence increase in either control or SOD1G93A+ astrocytes (Fig. 4B), suggesting that TRPC channels are not active. The cells were then perfused with calcium, confirming enhanced SOCE in SOD1G93A+ astrocytes. To validate the sensitivity of Fluo4 to strontium, cells were permeabilized with the ionophore A23187 that allowed entry of the ion in the cell and the expected fluorescent response (Fig. 4B, inset). These data indicate that SOCE is mediated through Orai but not TRPC channels in astrocytes.
To further characterize STIM1–Orai function in astrocytes, we tested the effects of the known SOCE inhibitors 1-aminoethoxy-diphenylborate (2-APB) and 1-(5-chloronaphthalene-1-sulfonyl homopiperazine HCl (ML-9) (DeHaven et al., 2008; Smyth et al., 2008). Pretreatment with 100 μm 2-APB, which inhibits SOCE by preventing both the ER-plasma membrane puncta formation and Orai channel activation (DeHaven et al., 2008), reduced SOCE almost completely in WT astrocytes (Fig. 4C, Table 2). However, in SOD1G93A+ astrocytes, SOCE inhibition by 2-APB was incomplete, allowing a significant SOCE response, compared with WT cells (Fig. 4C, Table 2). This difference indicated the existence of a 2-APB-insensitive SOCE component and abnormal calcium entry in SOD1G93A+ astrocytes and not a difference in affinity for the inhibitor, because 100 μm is a saturating dose of 2-APB in both SOD1G93A+ and WT astrocytes (i.e., the same level of inhibition was obtained with 50 or 100 μm 2-APB; data not shown). Conversely, pretreatment with ML-9 (50 μm), which inhibits calcium store-independent STIM1 puncta formation (Smyth et al., 2008), resulted in ∼50% decrease of SOCE in both WT and SOD1G93A+ astrocytes (Fig. 4D, Table 2). These results suggested that the enhanced SOCE response observed in SOD1G93A+ astrocytes (Fig. 4A) could be caused by calcium-independent STIM1 puncta formation and unregulated calcium entry.
Because SOD1G93A+ astrocytes showed a 2-APB-insensitive calcium entry, we assessed the localization of STIM1 in astrocytes using recombinant EYFP–STIM1. STIM1 distribution in SOD1G93A+ astrocytes at baseline, without the depletion of ER calcium store, was characterized by the presence of large protein aggregates (Fig. 5A), which closely resembled the distribution of EF-hand mutant STIM1 close to the plasma membrane (Smyth et al., 2008). The EF-hand domain of STIM1 contains calcium-binding residues that sense ER calcium depletion and regulate STIM1 localization near the plasma membrane. Thus, mutations in the STIM1 calcium-binding residues render the protein constitutively active, causing calcium store-independent calcium entry (Smyth et al., 2008). Therefore, our results showing calcium store-independent STIM1 localization near the plasma membrane in SOD1G93A+ astrocytes suggested that these cells could be exposed to constitutively increased calcium entry and consequent ER calcium overload.
Figure 5.
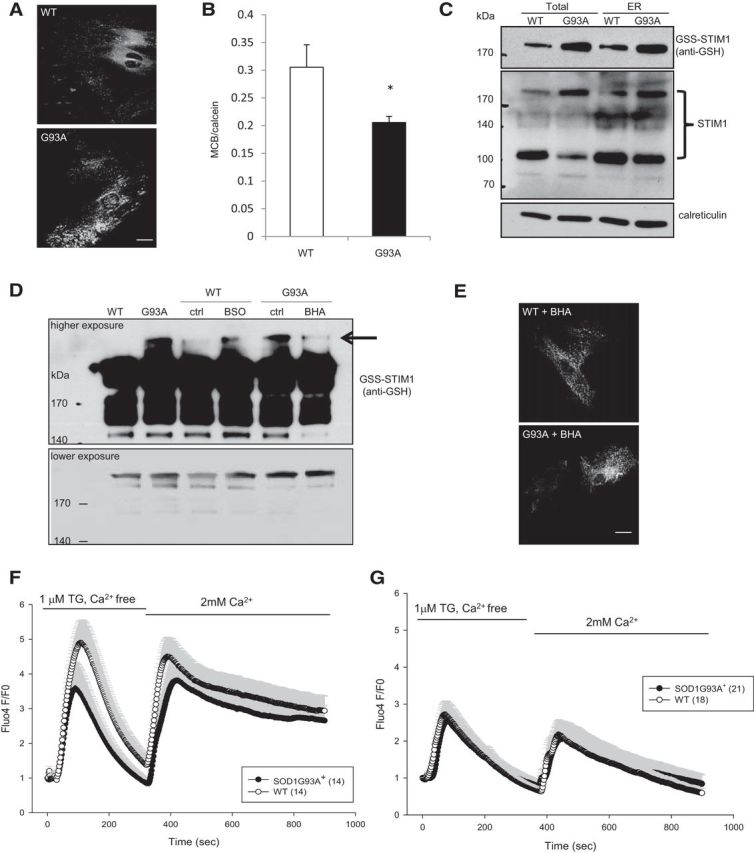
Glutathionylated STIM1 underlies abnormal SOCE in SOD1G93A+ astrocytes. A, WT and SOD1G93A+ astrocytes were transfected with YFP–STIM1 and fixed 48 h later. STIM1 localization was assessed under unstimulated conditions. Large clusters of YFP–STIM1 were observed in SOD1G93A+ astrocytes. B, Glutathione levels in spinal cord astrocytes determined by MCB and normalized to calcein fluorescence. C, ER/microsomes were enriched by fractionation from spinal cords of 60-d-old SOD1G93A+ and WT mice. Equal amounts of proteins from the postnuclear supernatant (TOTAL) and ER/microsome (ER) fractions were analyzed by nonreducing SDS-PAGE and Western blot. The middle panel shows multiple bands detected by the STIM1 antibody, including a monomeric species ∼100 kDa and higher-molecular-weight oligomers ∼200 kDa. The blots were reprobed with the anti-GSH antibody that confirmed the identity of the oligomeric STIM1 to be glutathionylated (top). Calreticulin was used as an ER marker (bottom). D, P2 cortical astrocytes were treated with 100 μm BSO (for WT cells) and 100 μm BHA (for mutant cells) for 18 h. Whole-cell homogenates were prepared in the presence of 50 mm NEM and used for immunoprecipitation with monoclonal anti-STIM1 antibodies. Immunoprecipitation samples were analyzed by nonreducing SDS-PAGE/Western blot using the anti-GSH antibody. Many forms of glutathionylated STIM1 was observed. The top and bottom panels show a representative blot, at high and low exposures, respectively. Oxidant-induced high-molecular-weight STIM1 oligomers (arrow) were detected in SOD1G93A+ astrocytes but not in WT cells. The level of these oxidant-induced STIM1 oligomers can be modified by pro-oxidant (BSO) and anti-oxidant BHA in WT and mutant astrocytes, respectively. ctrl, Control.E, Representative imagesof WT and SOD1G93A+of WT and SOD1G93A+ astrocytes transfected with YFP–STIM1, treated with 100 μm BHA (18 h). Cells were fixed 48 h after transfection to assess YFP–STIM1 localization. F, Cells were treated with 100 μm BSO for 4 h before imaging. BSO increased accumulation of ER calcium in WT cells, and SOCE was enhanced to levels similar to mutant cells. G, SOCE in cells treated with cell-permeable GSH (GSHEE; 1 mm) for 4 h. Mutant astrocytes SOCE normalized to WT SOCE levels when treated with GSH. All error bars are SEM. *p < 0.05 by Student's t test.
STIM1 S-glutathionylation is responsible for abnormal SOCE in SOD1G93A+ astrocytes
Together, our findings indicated that, in mutant astrocytes, ER calcium overload is caused by dysregulation of STIM1. Because SOD1G93A+ astrocytes do not harbor STIM1 mutations, we hypothesized that there could be posttranslational modifications of STIM1 leading to dysregulation of calcium entry. S-glutathionylation is a reversible posttranslational modification that occurs in response to oxidative stress to protect proteins from permanent oxidative damage. It was shown that mutant SOD1 causes oxidative stress in astrocytes (Cassina et al., 2008), and SOD1G93A mice have increased protein glutathionylation in the spinal cord (Poon et al., 2005). STIM1 glutathionylation in the ER intraluminal domain was shown to induce the protein to interact with Orai1 in a calcium-independent manner, resulting in constitutive calcium entry (Hawkins et al., 2010). Thus, STIM1 glutathionylation may underlie the constitutively active calcium entry and ER calcium overload in SOD1G93A+ astrocytes. In support of this hypothesis, measurements of glutathione showed reduced levels in adult SOD1G93A+ spinal cord astrocytes compared with those in WT cells (Fig. 5B).
To determine whether STIM1 is a target of S-glutathionylation induced by oxidative stress in SOD1G93A mice in vivo, we examined glutathionylated STIM1 in ER/microsomal fractions from spinal cords of P60 mice by nonreducing Western blots, using an antibody against glutathionylated proteins. In SOD1G93A+ ER, we found increased levels of a glutathionylated protein with high molecular weight (Fig. 5C, top), consistent with STIM1 oligomers, which were confirmed by reprobing the native Western blots with an anti-STIM1 antibody (Fig. 5C, middle). Independent reducing Western blots were performed using the same rabbit polyclonal anti-STIM1 antibody, which detected the expected monomeric denatured STIM1 of ∼70 kDa (data not shown).
In an alternative approach, we investigated STIM1 glutathionylation specifically in astrocytes. We immunoprecipitated STIM1 from P2 cortical astrocytes and detected a number of S-glutathionylated STIM1 species using an anti-GSH antibody, suggesting the presence of multimeric glutathionylated STIM1 (Fig. 5D, higher and lower exposures). Notably, in SOD1G93A+ astrocytes, but not in WT astrocytes, we detected a band with an estimated size of ∼240 kDa (based on a curve built according to the migration of molecular weight markers) that corresponded to a previously identified oxidant-induced glutathionylated STIM1 (Hawkins et al., 2010; Fig. 5D, lanes 1 and 2, higher exposure).
To test whether alteration in the GSH/glutathione disulfide (GSSG) ratio can modify STIM1 glutathionylation, we treated SOD1G93A+ astrocytes with the antioxidant BHA (100 μm, 18 h) and WT cells with the glutathione depleting agent BSO (100 μm, 18 h) before immunoprecipitation. We found that treatment with BHA in mutant astrocytes caused a decrease in the levels of the oxidant-induced high-molecular-weight species (Fig. 5D, high exposure, arrow), whereas BSO treatment in WT cells increased glutathionylation of STIM1 (Fig. 5D, lanes 4–7, high exposure). Together, this evidence indicates that glutathionylation of STIM1 is more abundant in SOD1G93A cells.
We then examined the functional effects of modulating glutathionylation of STIM1 on SOCE in spinal cord astrocytes. Treatment with BHA (100 μm, for 18 h) reversed STIM1–YFP clustering in SOD1G93A+ astrocytes, and the STIM1–YFP distribution appeared similar to that of WT astrocytes (Fig. 5E). Depletion of glutathione with BSO in WT astrocytes increased SOCE and ER calcium load to levels similar to those of SOD1G93A+ astrocytes treated with BSO (Fig. 5F, Table 2). Conversely, SOD1G93A+ astrocytes treated with the cell-permeable glutathione ethyl ester (GSHEE) normalized SOCE to WT levels (Fig. 5G, Table 2).
Together, these results suggest that mutant SOD1 causes STIM1 glutathionylation in astrocytes, probably by altering the redox state of the cells. This posttranslational modification of STIM1 causes constitutively active Orai channels, resulting in calcium entry dysregulation and ER calcium overload.
Selective inhibition of exocytosis in SOD1G93A+ astrocytes prevents astrocyte-mediated toxicity to motor neurons
We next tested whether inhibition of exocytosis in SOD1G93A+ astrocytes could attenuate toxicity to motor neurons. Previous studies had shown that selective inhibition of astroglial exocytosis could be achieved in cultured astrocytes and Dox regulated Tet on/off transgenic (GFAP–tTA and TetO–eGFP/dnSNARE) mice by expression of the cytosolic portion of the SNARE protein synaptobrevin 2 (Zhang et al., 2004; Pascual et al., 2005). When overexpressed, this protein acts as a dnSNARE and suppresses endogenous vesicular SNARE function (Zhang et al., 2004), although it does not affect afferent-induced intracellular calcium responses (Halassa et al., 2009). We generated SOD1G93A+ dnSNARE+ tTA+ mice, in which the dnSNARE protein is exclusively expressed in SOD1G93A+ astrocytes in the absence of Dox (Pascual et al., 2005; Halassa et al., 2009). We first examined the effect of dnSNARE overexpression on exocytosis in cultured SOD1G93A+ spinal astrocytes using the FM1-43 dye assay. As shown in Figure 6A, FM1-43 dye fluorescence rapidly decreased in WT spinal astrocytes within the first 6 min of the assay, indicating functional exocytosis in these astrocytes. Interestingly, FM1-43 dye fluorescence was gradually but steadily reduced in SOD1G93A+ spinal astrocytes, although the fluorescence eventually decreases to the same levels observed in WT astrocytes, suggesting that SOD1G93A expression alters the dynamics of exocytosis in astrocytes. In addition, we observed essentially unchanged FM1-43 dye fluorescence in dnSNARE+ tTA+ and SOD1G93A+ dnSNARE+ tTA+ spinal astrocytes during the assay (Fig. 6A), confirming that expression of dnSNARE effectively suppresses exocytosis from astrocytes. Furthermore, we found that TG-stimulated ATP secretion was lower in SOD1G93A+ dnSNARE+ tTA+ spinal astrocytes obtained at 50 d of age compared with SOD1G93A+ astrocytes (Fig. 6B), indicating that SNARE-dependent exocytosis plays a significant role in ATP secretion from SOD1G93A astrocytes. It also provides additional evidence that expression of dnSNARE effectively inhibits exocytosis in SOD1G93A astrocytes.
Figure 6.

Selective inhibition of exocytosis in SOD1G93A+ astrocytes reduces toxicity to motor neurons. A, FM1-43 fluorescence changes in WT, SOD1G93A+, dnSNARE+ tTA+, and SOD1G93A+ dnSNARE+ tTA+ spinal astrocytes. B, Quantification of ATP secreted from WT (n = 26), SOD1G93A+ (n = 26), and SOD1G93A+ dnSNARE+ tTA+ (n = 30) spinal cord astrocytes (P55). *p < 0.05 by one-way ANOVA with Dunn's test. C, Representative images of ESMNs cocultured with primary astrocytes prepared from WT, SOD1G93A+, or SOD1G93A+ dnSNARE+ tTA+ mice. Scale bar, 40 μm. D, Percentage of surviving eGFP+ ESMNs cocultured with spinal astrocytes from different genotypes. E, Percentage of surviving eGFP+ ESMNs cocultured with cortical astrocytes. F, Quantification of motor neuron neurite length in cocultures with spinal astrocytes. A total of 12–15 cells per group were quantified. G, Representative images of ESMNs cocultured with SOD1G93A+ cortical astrocytes treated with 1 or 10 μm BHA. Scale bar, 40 μm. H, Quantification of surviving motor neurons in cocultures treated with BHA. Total number of quantified ESMNs at the beginning of the coculture (day 1) is >1000 per group from four to five independent coculture wells, in triplicate experiments. *,#p < 0.05, ##p < 0.01, ***p < 0.001, by Student's t test.
We then assessed whether inhibition of exocytosis in SOD1G93A+ astrocytes affects toxicity to motor neurons in culture. To obtain a sufficient number of motor neurons, we differentiated ES cells derived from homeobox Hb9-driven eGFP transgenic mice and purified ESMNs as described previously (Di Giorgio et al., 2007; Nagai et al., 2007). These motor neurons have been shown previously to display properties highly similar to primary spinal motor neurons (Di Giorgio et al., 2007), and we also confirmed that these ESMNs express typical motor neuron markers, including choline acetyltransferase (ChAT) and microtubule-associated protein 1b (data not shown). Representative fields of purified ESMNs cocultured on top of spinal or cortical astrocytes derived from WT, SOD1G93A+, or SOD1G93A+ dnSNARE+ tTA+ mice are shown in Figure 6C. Although SOD1G93A+ dnSNARE+ tTA+ astrocytes are also eGFP+, because the astrocyte monolayer is not in the same focal plane as motor neurons, eGFP fluorescence from SOD1G93A+ dnSNARE+ tTA+ astrocytes caused no interference with eGFP signals from motor neurons. In addition, the distinct neuronal morphology of ESMNs also helped identify motor neurons during quantification. The percentage (33 ± 1.9%) of surviving motor neurons cocultured with SOD1G93A+ spinal astrocytes was significantly lower (p < 0.05) than the percentage (57 ± 8.8%) of surviving motor neurons cocultured with WT spinal astrocytes at 14 DIV (Fig. 6D); however, the percentage (60 ± 6.7%, 14 DIV) of surviving motor neurons cocultured with SOD1G93A+ dnSNARE+ tTA+ spinal astrocytes was comparable with that of WT cocultures (n = 1050–1246 neurons from 4–5 independent experiments) at 7 or 14 DIV. Similarly, motor neuron death was attenuated in cocultures with SOD1G93A+ dnSNARE+ tTA+ cortical astrocytes at 14 and 21 DIV (Fig. 6E). There was no significant difference in the survival of motor neurons cocultured with spinal dnSNARE+ tTA+ (inhibition of basal exocytosis) or WT astrocytes (61.2 ± 17.1 vs 66 ± 13.2%, 14 DIV; data not shown). Furthermore, motor neurons cocultured with SOD1G93A+ dnSNARE+ tTA+ spinal astrocytes had longer neurites compared with motor neurons cocultured with SOD1G93A+ astrocytes (Fig. 6F), suggesting that they maintained better structural integrity. Because the antioxidant BHA significantly decreased oxidant-induced glutathionylation of STIM1 (Fig. 5D), we determined whether BHA treatment could improve motor neuron survival in cocultures. We first determined that a dose of up to 10 μm BHA was sufficient to decrease STIM1 glutathionylation in SOD1G93A+ astrocytes and did not cause direct toxicity to motor neurons (data not shown). Therefore, motor neuron cocultures were treated with BHA (1 or 10 μm) for up to 10 d. We found that the percentage of surviving motor neurons in cocultures (23.7 ± 6.9% or 27.7 ± 5.2%) treated with both 1 or 10 μm BHA was significantly higher than that of untreated cocultures (9 ± 3.8%, p = 0.022; Fig. 6G,H). These results suggest that selective inhibition of exocytosis in SOD1G93A+ astrocytes or antioxidant treatment to decrease ER calcium signaling can ameliorate SOD1G93A+ astrocyte-mediated toxicity to motor neurons in culture.
Because inhibition of exocytosis in SOD1G93A+ astrocytes reduced toxicity to motor neurons in cocultures, we wanted to confirm that the protective effect was indeed attributable to a reduction in the secretion of toxic factors. Thus, we collected ACM (conditioned for 6–7 d) from WT, SOD1G93A+, or SOD1G93A+ dnSNARE+ tTA+ cortical astrocytes and used it to culture freshly prepared ESMNs. We calculated the percentage of surviving motor neurons grown in different ACM by counting eGFP+ motor neurons at multiple time points (3–14 DIV). As shown in Figure 7, ESMNs treated with ACM from SOD1G93A+ dnSNARE+ tTA+ astrocytes had similar survival to motor neurons in WT ACM at 7 and 14 DIV, although the percentage of surviving motor neurons in SOD1G93A+ ACM was significantly lower (p < 0.05, n = 293–508 from 3–5 independent experiments). This result further suggested that inhibition of exocytosis in SOD1G93A+ astrocytes attenuates motor neuron death by reducing secretion of toxic factors.
Figure 7.

ACM from SOD1G93A+ dnSNARE+ tTA+ astrocytes induces less ESMN death. A, Representative images of eGFP+ ESMNs treated with ACM from astrocytes with different genotypes. Scale bar, 40 μm. B, Percentage of surviving eGFP+ ESMNs treated with ACM collected from astrocytes with different genotypes. Total number of quantified ESMNs at the beginning of the treatment (day 1) is >200 per group from three to five independent experiments. *p < 0.05 by Student's t test.
Selective inhibition of exocytosis in SOD1G93A+ astrocytes significantly delays disease onset of SOD1G93A mice
We next investigated whether selective inhibition of exocytosis in SOD1G93A+ astrocytes affects disease phenotypes in the SOD1G93A mice. Because tTA expression alone (tTA+) does not affect the phenotype of SOD1G93A mice (data not shown) and dnSNARE protein is not induced in dnSNARE+ mice without tTA, we grouped the littermate offspring from our breeding as follows: group 1, SOD1G93A+ dnSNARE+ tTA+; group 2, SOD1G93A− dnSNARE+ tTA+; group 3, all SOD1G93A+ mice; and group 4, all SOD1G93A− controls. Because in dnSNARE+ tTA+ mice (group 2) there is no motor neuron-associated phenotype (Pascual et al., 2005; Halassa et al., 2009), only groups 1, 3, and 4 were analyzed in this study.
Because previous analysis of SOD1G93A mice indicated that the pathological changes appear as early as P30 (Alves et al., 2011; van Zundert et al., 2012), we decided to activate the expression of dnSNARE right after weaning, thereby providing a wider window to observe phenotypical alterations. By P60, eGFP/dnSNARE expression was fully induced in GFAP+ astrocytes in the spinal cord of SOD1G93A+ dnSNARE+ tTA+ mice (Fig. 8A). Previous quantifications showed eGFP/dnSNARE induction in >80% of spinal cord astrocytes (Foley et al., 2011). Using loss of 10% forelimb grip strength as an early clinical sign of disease onset (Yamanaka et al., 2008), we found a significant (p < 0.004) delay in SOD1G93A+ dnSNARE+ tTA+ mice (103.1 ± 2.6, n = 15) compared with their SOD1G93A+ littermates (93.7 ± 1.1, n = 14; Fig. 8B,C). Similarly, the loss of 10% of body weight, an indication of late disease onset (Yamanaka et al., 2008), was also significantly delayed (p < 0.03) in SOD1G93A+ dnSNARE+ tTA+ mice (128.8 ± 3.2, n = 12, because three mice were killed earlier for immunohistochemical studies) compared with littermate SOD1G93A+ mice (119.3 ± 2.6, n = 14; Fig. 8D,E). We also examined the number of motor neurons in the spinal cord of SOD1G93A+ dnSNARE+ tTA+ mice during early disease stage (P90–P100) by NeuN staining. Although ChAT is a selective motor neuron marker, we found inconsistent ChAT immunostaining results, even after tested and optimized ChAT immunostaining with several antibodies. In contrast, NeuN staining consistently gave a clear labeling of all the spinal neurons. To overcome the ChAT staining inconsistency, we identified motor neurons based on both NeuN immunostaining and neuronal size, using a macro function in the NIH Image J program, and validated this approach with ChAT immunostaining. As shown in the example in Figure 8F, ChAT+ neurons are highly overlaid with motor neurons identified based on the size-filtered image derived from the NeuN immunostaining. Based on this validation, we are confident that our analysis quantifies primarily motor neurons. Representative images of NeuN staining and size-filtered images from each genotype are shown in Figure 8G. Subsequent quantification found a significantly higher number of motor neurons in the ventral horn of the spinal cord of SOD1G93A+ dnSNARE+ tTA+ mice compared with SOD1G93A+ mice (p = 0.011, 18–24 sections from 3 mice per group; Fig. 8H).
Figure 8.
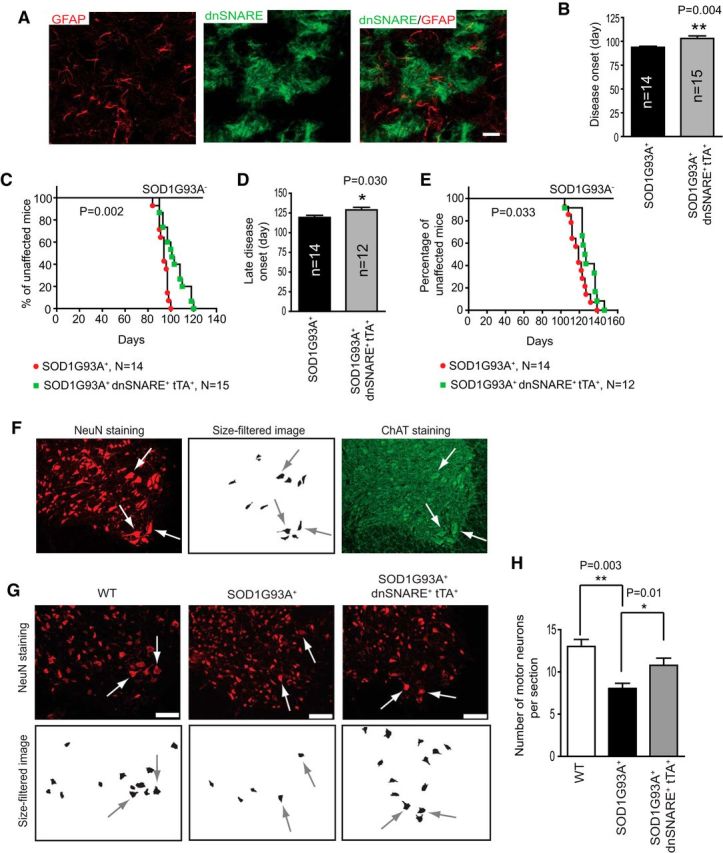
Inhibition of astrocyte exocytosis significantly delays early and late disease onset in SOD1G93A mice. A, Representative images of eGFP/dnSNARE expression in SOD1G93A+ dnSNARE+ tTA+ mouse spinal cord. Scale bar, 25 μm. B–E, Early disease onset, determined by the loss of 10% forelimb grip strength (B, C) and late disease onset, determined by the 10% overall weight loss (D, E) in SOD1G93A+ and SOD1G93A+ dnSNARE+ tTA+ mice. The log-Rank statistical analysis was used to determine the significance of disease early and late onset Kaplan–Meier curves. F, Representative images of NeuN+ staining, overlaid size-filtered NeuN+, and ChAT+ staining of motor neurons in mouse spinal cord ventral horn. G, Illustration of motor neurons by NeuN staining in spinal cord ventral horn of different genotypes. Scale bar, 100 μm. H, Quantitative analysis of motor neuron numbers in ventral spinal cord in WT, SOD1G93A+, and SOD1G93A+ dnSNARE+ tTA+ mice at P90–P100. n = 180–240 cells from 3–4 mice per group. *p < 0.05, **p < 0.01 by Student's t test.
We continued to monitor disease progression and survival of SOD1G93A+ dnSNARE+ tTA+ mice. All SOD1G93A+ mice were killed when mice reached end stage, as defined by the delayed (30 s) righting reflex test (Solomon et al., 2011). The rate of disease progression (time from early onset to end stage) was not significantly different in the SOD1G93A+ dnSNARE+ tTA+ mice compared with SOD1G93A+ mice (Fig. 9A,B). The late disease progression phase (between late-onset to end stage) was accelerated slightly, but not significantly, in SOD1G93A+ dnSNARE+ tTA+ mice (Fig. 9C). The overall survival in SOD1G93A+ dnSNARE+ tTA+ and SOD1G93A+ mice was not significantly different (Fig. 9D,E). At end stage, a similar loss of spinal motor neurons was found in SOD1G93A+ dnSNARE+ tTA+ and SOD1G93A+ mice (Fig. 9F). These results show that selective inhibition of exocytosis in SOD1G93A+ astrocytes, despite not having a protective effect on disease progression and survival in SOD1G93A+ mice, is able to delay disease onset, providing the first in vivo evidence that astrocyte exocytosis contributes to the pathogenesis of ALS.
Figure 9.
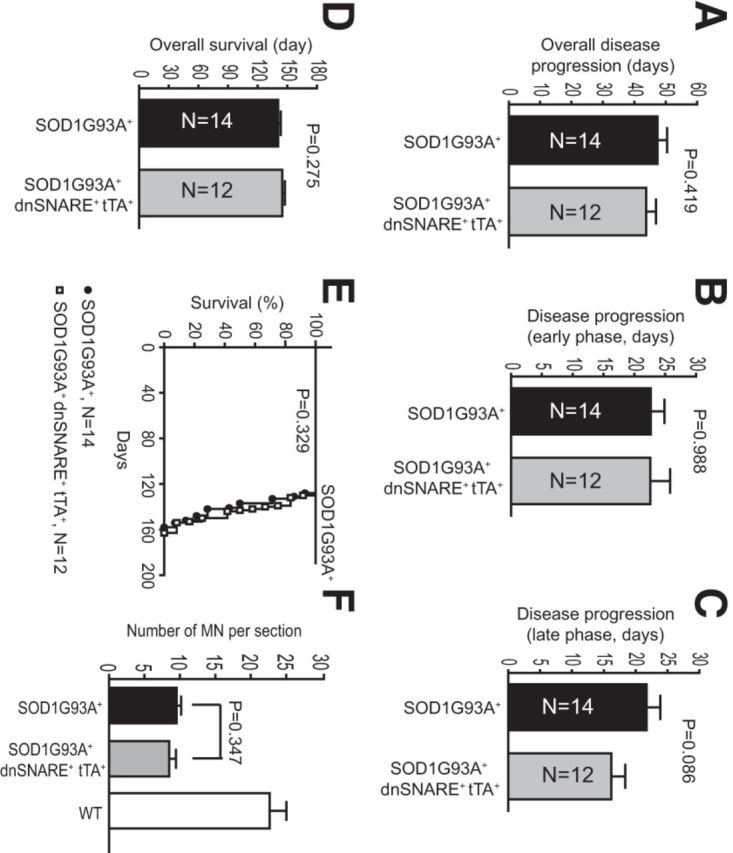
Disease progression is not altered in SOD1G93A+ dnSNARE+ tTA+ mice. A–C, Similar overall (A), early (B), and late (C) disease progression was found in SOD1G93A+ and SOD1G93A+ dnSNARE+ tTA+ mice. D, E, Overall survival time of SOD1G93A+ and SOD1G93A+ dnSNARE+ tTA+ mice. The log-rank statistical analysis was used to determine the significance of overall survival Kaplan–Meier curves. F, Quantitative analysis of motor neuron numbers in ventral spinal cord in WT, SOD1G93A+, and SOD1G93A+ dnSNARE+ tTA+ mice. n = 90–150 cells from 3 mice per group. p = 0.347 by Student's t test.
Discussion
Although astrocytes derived from the mouse SOD1 mutant model of ALS or from human familial or sporadic ALS patient brain tissue directly induce motor neuron cell death in culture (Di Giorgio et al., 2007; Nagai et al., 2007; Marchetto et al., 2008; Haidet-Phillips et al., 2011), the mechanisms of pathological astroglial secretion remain unclear. Our current study characterized the molecular mechanisms responsible for calcium dysregulation in mutant SOD1G93A astrocytes. We found that oxidative stress induces S-glutathionylation of the ER resident calcium sensor STIM1 protein and causes enhanced SOCE and ER calcium overload, which leads to excess ER calcium release and altered secretion from SOD1G93A astrocytes. By using genetic tools that selectively inhibit astroglial exocytosis, we further demonstrated that SNARE-dependent exocytosis in astrocytes significantly contributes to SOD1G93A+ astrocyte-mediated toxicity to motor neurons in culture and in vivo. These results represent the initial steps in the characterization of the biochemical and molecular basis of abnormal cell secretion in ALS astrocytes and provide the first in vivo evidence that astrocyte exocytosis contributes to the pathogenesis of SOD1G93A model of ALS.
Intracellular calcium homeostasis is finely regulated at multiple levels in astrocytes. In particular, depletion of the ER calcium store activates the SOCE mechanism through the coordinated interaction of the ER calcium sensor STIM1 protein and plasma membrane calcium channel protein Orai1 (Smyth et al., 2008, 2010; Parpura et al., 2011). Our current results suggest that the mechanisms underlining aberrant ER calcium filling in mutant SOD1G93A+ astrocytes involve enhanced S-glutathionylation of STIM1. S-glutathionylation is a reversible posttranslational modification in response to oxidative stress, which protects proteins from permanent oxidative damage. S-glutathionylation has been observed widely in a number of pathological conditions affecting different tissues, such as diabetes, cancer, and cardiovascular and neurodegenerative diseases (for review, see Mieyal et al., 2008). Previous studies have shown that mutant SOD1 causes oxidative stress in astrocytes (Cassina et al., 2008), and SOD1G93A+ mice have increased protein glutathionylation in the spinal cord (Poon et al., 2005). Here, we found increased STIM1 glutathionylation in SOD1G93A+ astrocytes. Because STIM1 glutathionylation in the ER intraluminal domain was shown to induce its interaction with plasma membrane Orai1 in a calcium-independent manner and result in constitutive calcium entry (Hawkins et al., 2010), STIM1 glutathionylation may underlie constitutively active calcium entry and ER calcium overload in SOD1G93A+ astrocytes. This dysregulation of calcium entry results in abnormally elevated cytosolic calcium levels in SOD1G93A+ astrocytes during release of ER calcium.
Enhanced STIM1 glutathionylation likely results from the oxidative environment of the ER, in which H2O2 is constantly produced as a byproduct of protein folding. In addition, although the GSH/GSSG ratio is above 10:1 in the cytosol, this ratio is in the range of 1:1 or 3:1 in the ER as a result of the preferential export of GSH (not GSSG) out of the ER lumen (Hwang et al., 1992). Importantly, potential mutant SOD1 protein misfolding and aggregation also alter ER redox state and increase peroxide production, which is known to rapidly oxidize GSH into GSSG. Several other sources of oxidative stress have been implicated in mutant SOD1 model of ALS, including NADPH oxidase (Wu et al., 2006); (Marden et al., 2007) and inducible nitric oxide synthase (Cassina et al., 2002, 2008). The exact sources for the oxidative modification of the STIM1 protein remain to be investigated. There are several different chemical reactions leading to protein S-glutathionylation, including thionylation and S-nitrosylation, depending on the donor of the GSH that modifies the cysteines involved. Here, we showed that BHA, a general antioxidant that increases GSH content, decreased SOD1G93A+ astrocyte toxicity to motor neurons (Fig. 6H). Characterization of the exact chemical mechanisms of STIM1 glutathionylation in SOD1G93A+ astrocytes will provide more selective targets for pharmacological intervention.
Elevation of intracellular cytosolic calcium levels is critical in mediating important astrocyte functions in the CNS. Although the exact mechanisms are still under investigation (Agulhon et al., 2008), a number of studies have shown that calcium-dependent exocytotic release of active factors is a potential major mechanism for astrocytes to modulate synaptic functions (Bowser and Khakh, 2007; Jourdain et al., 2007; Liu et al., 2011; Zorec et al., 2012). Exocytotic release of glutamate and ATP has also been implicated in mouse models of ischemic injury (Hines and Haydon, 2013), Alzheimer's disease (Rossi et al., 2005), and major depression (Cao et al., 2013). Our results showing increased ATP release and delayed FM1-43 dye release kinetics suggest that exocytosis is altered in SOD1G93A+ astrocytes. By selectively inhibiting exocytosis from SOD1G93A+ astrocytes, we showed that SNARE-dependent exocytosis significantly contributes to SOD1G93A astrocyte-dependent toxicity to motor neurons. Interestingly, selective inhibition of basal astroglial exocytosis in dnSNARE+ tTA+ mice does not induce motor neuron cell death in culture and has no effect on grip strength or other motor neuron-associated phenotypes in vivo (data not shown). This indicates that inhibition of basal exocytosis in WT astrocytes does not affect survival of motor neurons or cause motor neuron-associated phenotypes. In addition, the identity of astrocyte-dependent toxic factors remains elusive, despite the general agreement that these toxic factors are soluble and secreted from astrocytes (Di Giorgio et al., 2007; Nagai et al., 2007). Because the selective inhibition of astrocyte exocytosis using the dnSNARE mice significantly prevents SOD1G93A astrocyte-dependent motor neuron cell death, our results may potentially provide new clues to identify these secreted toxic factors from SOD1G93A+ astrocytes.
Although we observed significantly delayed disease onset in SOD1G93A+ dnSNARE+ tTA+ mice, we found no significant difference in overall disease progression. The SOD1G93A mice are considered a fast progressing ALS mouse model, typically with a 30–60 d disease progression period, depending on the mouse genetic background. Therefore, it is likely that the relatively fast disease progression dampened the protective effect of selective inhibition of the astroglial exocytosis on progression once the mice approached disease end stage. In addition, although SNARE-dependent exocytosis represents one of the major secretory pathways in astrocytes, other secretion mechanisms, including TREK-1 and bestrophin channels (Woo et al., 2012), volume-regulated anion channels (Kimelberg et al., 2006), connexin hemichannels (Cotrina et al., 1998), and pannexon channels (Garré et al., 2010), may also contribute to SOD1G93A+ astrocyte toxicity in ALS. Moreover, secretion of inflammatory factors from microglia could become more dominant as the disease progresses toward end stage (Ilieva et al., 2009). Therefore, the protective effect of selective inhibition of astroglial exocytosis on disease phenotypes in the SOD1G93A model may become less evident as the disease progresses.
In summary, we characterized a mechanism for abnormal calcium signaling in SOD1G93A+ astrocytes and found that astrocyte exocytosis significantly contributes to SOD1G93A astrocyte-dependent toxicity to motor neurons. These results provide new mechanistic insights in the alterations of astrocytes that contribute to the pathogenesis of ALS.
Footnotes
This work was supported by National Institutes of Health Grant NS051419 and NS062055 (G.M.), R01NS037585 (P.G.H.), and MH099554 (Y.Y.), The Packard Center for ALS Research (Y.Y., G.M.), and The Muscular Dystrophy Association (G.M., H.K.). We thank Dr. Christos Chinopolous and Dr. Anatoly Starkov for technical and advice on calcium imaging experiments and analyses. We thank Dr. Kevin Eggan for providing mouse ES cells and the Tufts Center for Neuroscience Research for providing valuable core facilities.
The authors declare no competing financial interests.
References
- Agulhon C, Petravicz J, McMullen AB, Sweger EJ, Minton SK, Taves SR, Casper KB, Fiacco TA, McCarthy KD. What is the role of astrocyte calcium in neurophysiology? Neuron. 2008;59:932–946. doi: 10.1016/j.neuron.2008.09.004. [DOI] [PMC free article] [PubMed] [Google Scholar]
- Alves CJ, de Santana LP, dos Santos AJ, de Oliveira GP, Duobles T, Scorisa JM, Martins RS, Maximino JR, Chadi G. Early motor and electrophysiological changes in transgenic mouse model of amyotrophic lateral sclerosis and gender differences on clinical outcome. Brain Res. 2011;1394:90–104. doi: 10.1016/j.brainres.2011.02.060. [DOI] [PubMed] [Google Scholar]
- Barres BA. The mystery and magic of glia: a perspective on their roles in health and disease. Neuron. 2008;60:430–440. doi: 10.1016/j.neuron.2008.10.013. [DOI] [PubMed] [Google Scholar]
- Bernardi P, von Stockum S. The permeability transition pore as a Ca2+ release channel: new answers to an old question. Cell Calcium. 2012;52:22–27. doi: 10.1016/j.ceca.2012.03.004. [DOI] [PMC free article] [PubMed] [Google Scholar]
- Bezzi P, Gundersen V, Galbete JL, Seifert G, Steinhäuser C, Pilati E, Volterra A. Astrocytes contain a vesicular compartment that is competent for regulated exocytosis of glutamate. Nat Neurosci. 2004;7:613–620. doi: 10.1038/nn1246. [DOI] [PubMed] [Google Scholar]
- Boillée S, Yamanaka K, Lobsiger CS, Copeland NG, Jenkins NA, Kassiotis G, Kollias G, Cleveland DW. Onset and progression in inherited ALS determined by motor neurons and microglia. Science. 2006;312:1389–1392. doi: 10.1126/science.1123511. [DOI] [PubMed] [Google Scholar]
- Bowser DN, Khakh BS. Two forms of single-vesicle astrocyte exocytosis imaged with total internal reflection fluorescence microscopy. Proc Natl Acad Sci U S A. 2007;104:4212–4217. doi: 10.1073/pnas.0607625104. [DOI] [PMC free article] [PubMed] [Google Scholar]
- Cao X, Li LP, Wang Q, Wu Q, Hu HH, Zhang M, Fang YY, Zhang J, Li SJ, Xiong WC, Yan HC, Gao YB, Liu JH, Li XW, Sun LR, Zeng YN, Zhu XH, Gao TM. Astrocyte-derived ATP modulates depressive-like behaviors. Nat Med. 2013;19:773–777. doi: 10.1038/nm.3162. [DOI] [PubMed] [Google Scholar]
- Carri MT, Cozzolino M. SOD1 and mitochondria in ALS: a dangerous liaison. J Bioenerg Biomembr. 2011;43:593–599. doi: 10.1007/s10863-011-9394-z. [DOI] [PubMed] [Google Scholar]
- Cassina P, Peluffo H, Pehar M, Martinez-Palma L, Ressia A, Beckman JS, Estévez AG, Barbeito L. Peroxynitrite triggers a phenotypic transformation in spinal cord astrocytes that induces motor neuron apoptosis. J Neurosci Res. 2002;67:21–29. doi: 10.1002/jnr.10107. [DOI] [PubMed] [Google Scholar]
- Cassina P, Cassina A, Pehar M, Castellanos R, Gandelman M, de León A, Robinson KM, Mason RP, Beckman JS, Barbeito L, Radi R. Mitochondrial dysfunction in SOD1G93A-bearing astrocytes promotes motor neuron degeneration: prevention by mitochondrial-targeted antioxidants. J Neurosci. 2008;28:4115–4122. doi: 10.1523/JNEUROSCI.5308-07.2008. [DOI] [PMC free article] [PubMed] [Google Scholar]
- Cotrina ML, Lin JH, Alves-Rodrigues A, Liu S, Li J, Azmi-Ghadimi H, Kang J, Naus CC, Nedergaard M. Connexins regulate calcium signaling by controlling ATP release. Proc Natl Acad Sci U S A. 1998;95:15735–15740. doi: 10.1073/pnas.95.26.15735. [DOI] [PMC free article] [PubMed] [Google Scholar]
- DeHaven WI, Smyth JT, Boyles RR, Bird GS, Putney JW., Jr Complex actions of 2-aminoethyldiphenyl borate on store-operated calcium entry. J Biol Chem. 2008;283:19265–19273. doi: 10.1074/jbc.M801535200. [DOI] [PMC free article] [PubMed] [Google Scholar]
- Di Giorgio FP, Carrasco MA, Siao MC, Maniatis T, Eggan K. Non-cell autonomous effect of glia on motor neurons in an embryonic stem cell-based ALS model. Nat Neurosci. 2007;10:608–614. doi: 10.1038/nn1885. [DOI] [PMC free article] [PubMed] [Google Scholar]
- Foley JC, McIver SR, Haydon PG. Gliotransmission modulates baseline mechanical nociception. Mol Pain. 2011;7:93. doi: 10.1186/1744-8069-7-93. [DOI] [PMC free article] [PubMed] [Google Scholar]
- Garré JM, Retamal MA, Cassina P, Barbeito L, Bukauskas FF, Sáez JC, Bennett MV, Abudara V. FGF-1 induces ATP release from spinal astrocytes in culture and opens pannexin and connexin hemichannels. Proc Natl Acad Sci U S A. 2010;107:22659–22664. doi: 10.1073/pnas.1013793107. [DOI] [PMC free article] [PubMed] [Google Scholar]
- Gerencser AA, Doczi J, Töröcsik B, Bossy-Wetzel E, Adam-Vizi V. Mitochondrial swelling measurement in situ by optimized spatial filtering: astrocyte-neuron differences. Biophys J. 2008;95:2583–2598. doi: 10.1529/biophysj.107.118620. [DOI] [PMC free article] [PubMed] [Google Scholar]
- Haidet-Phillips AM, Hester ME, Miranda CJ, Meyer K, Braun L, Frakes A, Song S, Likhite S, Murtha MJ, Foust KD, Rao M, Eagle A, Kammesheidt A, Christensen A, Mendell JR, Burghes AH, Kaspar BK. Astrocytes from familial and sporadic ALS patients are toxic to motor neurons. Nat Biotechnol. 2011;29:824–828. doi: 10.1038/nbt.1957. [DOI] [PMC free article] [PubMed] [Google Scholar]
- Halassa MM, Fellin T, Haydon PG. The tripartite synapse: roles for gliotransmission in health and disease. Trends Mol Med. 2007;13:54–63. doi: 10.1016/j.molmed.2006.12.005. [DOI] [PubMed] [Google Scholar]
- Halassa MM, Florian C, Fellin T, Munoz JR, Lee SY, Abel T, Haydon PG, Frank MG. Astrocytic modulation of sleep homeostasis and cognitive consequences of sleep loss. Neuron. 2009;61:213–219. doi: 10.1016/j.neuron.2008.11.024. [DOI] [PMC free article] [PubMed] [Google Scholar]
- Hamilton NB, Attwell D. Do astrocytes really exocytose neurotransmitters? Nat Rev Neurosci. 2010;11:227–238. doi: 10.1038/nrn2803. [DOI] [PubMed] [Google Scholar]
- Hawkins BJ, Irrinki KM, Mallilankaraman K, Lien YC, Wang Y, Bhanumathy CD, Subbiah R, Ritchie MF, Soboloff J, Baba Y, Kurosaki T, Joseph SK, Gill DL, Madesh M. S-glutathionylation activates STIM1 and alters mitochondrial homeostasis. J Cell Biol. 2010;190:391–405. doi: 10.1083/jcb.201004152. [DOI] [PMC free article] [PubMed] [Google Scholar]
- Hines DJ, Haydon PG. Inhibition of a SNARE-sensitive pathway in astrocytes attenuates damage following stroke. J Neurosci. 2013;33:4234–4240. doi: 10.1523/JNEUROSCI.5495-12.2013. [DOI] [PMC free article] [PubMed] [Google Scholar]
- Hwang C, Sinskey AJ, Lodish HF. Oxidized redox state of glutathione in the endoplasmic reticulum. Science. 1992;257:1496–1502. doi: 10.1126/science.1523409. [DOI] [PubMed] [Google Scholar]
- Ilieva H, Polymenidou M, Cleveland DW. Non-cell autonomous toxicity in neurodegenerative disorders: ALS and beyond. J Cell Biol. 2009;187:761–772. doi: 10.1083/jcb.200908164. [DOI] [PMC free article] [PubMed] [Google Scholar]
- Jourdain P, Bergersen LH, Bhaukaurally K, Bezzi P, Santello M, Domercq M, Matute C, Tonello F, Gundersen V, Volterra A. Glutamate exocytosis from astrocytes controls synaptic strength. Nat Neurosci. 2007;10:331–339. doi: 10.1038/nn1849. [DOI] [PubMed] [Google Scholar]
- Kang SH, Li Y, Fukaya M, Lorenzini I, Cleveland DW, Ostrow LW, Rothstein JD, Bergles DE. Degeneration and impaired regeneration of gray matter oligodendrocytes in amyotrophic lateral sclerosis. Nat Neurosci. 2013;16:571–579. doi: 10.1038/nn.3357. [DOI] [PMC free article] [PubMed] [Google Scholar]
- Kawamata H, Manfredi G. Mitochondrial dysfunction and intracellular calcium dysregulation in ALS. Mech Ageing Dev. 2010;131:517–526. doi: 10.1016/j.mad.2010.05.003. [DOI] [PMC free article] [PubMed] [Google Scholar]
- Kimelberg HK, Macvicar BA, Sontheimer H. Anion channels in astrocytes: biophysics, pharmacology, and function. Glia. 2006;54:747–757. doi: 10.1002/glia.20423. [DOI] [PMC free article] [PubMed] [Google Scholar]
- Li D, Hérault K, Oheim M, Ropert N. FM dyes enter via a store-operated calcium channel and modify calcium signaling of cultured astrocytes. Proc Natl Acad Sci U S A. 2009;106:21960–21965. doi: 10.1073/pnas.0909109106. [DOI] [PMC free article] [PubMed] [Google Scholar]
- Liu T, Sun L, Xiong Y, Shang S, Guo N, Teng S, Wang Y, Liu B, Wang C, Wang L, Zheng L, Zhang CX, Han W, Zhou Z. Calcium triggers exocytosis from two types of organelles in a single astrocyte. J Neurosci. 2011;31:10593–10601. doi: 10.1523/JNEUROSCI.6401-10.2011. [DOI] [PMC free article] [PubMed] [Google Scholar]
- Marchetto MC, Muotri AR, Mu Y, Smith AM, Cezar GG, Gage FH. Non-cell-autonomous effect of human SOD1 G37R astrocytes on motor neurons derived from human embryonic stem cells. Cell Stem Cell. 2008;3:649–657. doi: 10.1016/j.stem.2008.10.001. [DOI] [PubMed] [Google Scholar]
- Marden JJ, Harraz MM, Williams AJ, Nelson K, Luo M, Paulson H, Engelhardt JF. Redox modifier genes in amyotrophic lateral sclerosis in mice. J Clin Invest. 2007;117:2913–2919. doi: 10.1172/JCI31265. [DOI] [PMC free article] [PubMed] [Google Scholar]
- Mattiazzi M, D'Aurelio M, Gajewski CD, Martushova K, Kiaei M, Beal MF, Manfredi G. Mutated human SOD1 causes dysfunction of oxidative phosphorylation in mitochondria of transgenic mice. J Biol Chem. 2002;277:29626–29633. doi: 10.1074/jbc.M203065200. [DOI] [PubMed] [Google Scholar]
- Mieyal JJ, Gallogly MM, Qanungo S, Sabens EA, Shelton MD. Molecular mechanisms and clinical implications of reversible protein S-glutathionylation. Antioxid Redox Signal. 2008;10:1941–1988. doi: 10.1089/ars.2008.2089. [DOI] [PMC free article] [PubMed] [Google Scholar]
- Nagai M, Re DB, Nagata T, Chalazonitis A, Jessell TM, Wichterle H, Przedborski S. Astrocytes expressing ALS-linked mutated SOD1 release factors selectively toxic to motor neurons. Nat Neurosci. 2007;10:615–622. doi: 10.1038/nn1876. [DOI] [PMC free article] [PubMed] [Google Scholar]
- Parekh AB, Putney JW., Jr Store-operated calcium channels. Physiol Rev. 2005;85:757–810. doi: 10.1152/physrev.00057.2003. [DOI] [PubMed] [Google Scholar]
- Parpura V, Grubišić V, Verkhratsky A. Ca2+ sources for the exocytotic release of glutamate from astrocytes. Biochim Biophys Acta. 2011;1813:984–991. doi: 10.1016/j.bbamcr.2010.11.006. [DOI] [PubMed] [Google Scholar]
- Pascual O, Casper KB, Kubera C, Zhang J, Revilla-Sanchez R, Sul JY, Takano H, Moss SJ, McCarthy K, Haydon PG. Astrocytic purinergic signaling coordinates synaptic networks. Science. 2005;310:113–116. doi: 10.1126/science.1116916. [DOI] [PubMed] [Google Scholar]
- Patron M, Raffaello A, Granatiero V, Tosatto A, Merli G, De Stefani D, Wright L, Pallafacchina G, Terrin A, Mammucari C, Rizzuto R. The mitochondrial calcium uniporter (MCU): molecular identity and physiological roles. J Biol Chem. 2013;288:10750–10758. doi: 10.1074/jbc.R112.420752. [DOI] [PMC free article] [PubMed] [Google Scholar]
- Pfaffl MW. A new mathematical model for relative quantification in real-time RT-PCR. Nucleic Acids Res. 2001;29:e45. doi: 10.1093/nar/29.9.e45. [DOI] [PMC free article] [PubMed] [Google Scholar]
- Pivneva T, Haas B, Reyes-Haro D, Laube G, Veh RW, Nolte C, Skibo G, Kettenmann H. Store-operated Ca2+ entry in astrocytes: different spatial arrangement of endoplasmic reticulum explains functional diversity in vitro and in situ. Cell Calcium. 2008;43:591–601. doi: 10.1016/j.ceca.2007.10.004. [DOI] [PubMed] [Google Scholar]
- Poon HF, Hensley K, Thongboonkerd V, Merchant ML, Lynn BC, Pierce WM, Klein JB, Calabrese V, Butterfield DA. Redox proteomics analysis of oxidatively modified proteins in G93A-SOD1 transgenic mice—a model of familial amyotrophic lateral sclerosis. Free Radic Biol Med. 2005;39:453–462. doi: 10.1016/j.freeradbiomed.2005.03.030. [DOI] [PubMed] [Google Scholar]
- Ringer C, Weihe E, Schütz B. Pre-symptomatic alterations in subcellular betaCGRP distribution in motor neurons precede astrogliosis in ALS mice. Neurobiol Dis. 2009;35:286–295. doi: 10.1016/j.nbd.2009.05.011. [DOI] [PubMed] [Google Scholar]
- Rizzuto R, Marchi S, Bonora M, Aguiari P, Bononi A, De Stefani D, Giorgi C, Leo S, Rimessi A, Siviero R, Zecchini E, Pinton P. Ca2+ transfer from the ER to mitochondria: when, how and why. Biochim Biophys Acta. 2009;1787:1342–1351. doi: 10.1016/j.bbabio.2009.03.015. [DOI] [PMC free article] [PubMed] [Google Scholar]
- Robberecht W, Philips T. The changing scene of amyotrophic lateral sclerosis. Nat Rev Neurosci. 2013;14:248–264. doi: 10.1038/nrn3430. [DOI] [PubMed] [Google Scholar]
- Rossi D, Brambilla L, Valori CF, Crugnola A, Giaccone G, Capobianco R, Mangieri M, Kingston AE, Bloc A, Bezzi P, Volterra A. Defective tumor necrosis factor-alpha-dependent control of astrocyte glutamate release in a transgenic mouse model of Alzheimer disease. J Biol Chem. 2005;280:42088–42096. doi: 10.1074/jbc.M504124200. [DOI] [PubMed] [Google Scholar]
- Smyth JT, Dehaven WI, Bird GS, Putney JW., Jr Ca2+-store-dependent and -independent reversal of Stim1 localization and function. J Cell Sci. 2008;121:762–772. doi: 10.1242/jcs.023903. [DOI] [PMC free article] [PubMed] [Google Scholar]
- Smyth JT, Hwang SY, Tomita T, DeHaven WI, Mercer JC, Putney JW. Activation and regulation of store-operated calcium entry. J Cell Mol Med. 2010;14:2337–2349. doi: 10.1111/j.1582-4934.2010.01168.x. [DOI] [PMC free article] [PubMed] [Google Scholar]
- Solomon JA, Tarnopolsky MA, Hamadeh MJ. One universal common endpoint in mouse models of amyotrophic lateral sclerosis. PLoS One. 2011;6:e20582. doi: 10.1371/journal.pone.0020582. [DOI] [PMC free article] [PubMed] [Google Scholar]
- Son M, Puttaparthi K, Kawamata H, Rajendran B, Boyer PJ, Manfredi G, Elliott JL. Overexpression of CCS in G93A-SOD1 mice leads to accelerated neurological deficits with severe mitochondrial pathology. Proc Natl Acad Sci U S A. 2007;104:6072–6077. doi: 10.1073/pnas.0610923104. [DOI] [PMC free article] [PubMed] [Google Scholar]
- Son M, Leary SC, Romain N, Pierrel F, Winge DR, Haller RG, Elliott JL. Isolated cytochrome c oxidase deficiency in G93A SOD1 mice over-expressing CCS protein. J Biol Chem. 2008;283:12267–12275. doi: 10.1074/jbc.M708523200. [DOI] [PMC free article] [PubMed] [Google Scholar]
- van Zundert B, Izaurieta P, Fritz E, Alvarez FJ. Early pathogenesis in the adult-onset neurodegenerative disease amyotrophic lateral sclerosis. J Cell Biochem. 2012;113:3301–3312. doi: 10.1002/jcb.24234. [DOI] [PMC free article] [PubMed] [Google Scholar]
- Woo DH, Han KS, Shim JW, Yoon BE, Kim E, Bae JY, Oh SJ, Hwang EM, Marmorstein AD, Bae YC, Park JY, Lee CJ. TREK-1 and Best1 channels mediate fast and slow glutamate release in astrocytes upon GPCR activation. Cell. 2012;151:25–40. doi: 10.1016/j.cell.2012.09.005. [DOI] [PubMed] [Google Scholar]
- Wu DC, Ré DB, Nagai M, Ischiropoulos H, Przedborski S. The inflammatory NADPH oxidase enzyme modulates motor neuron degeneration in amyotrophic lateral sclerosis mice. Proc Natl Acad Sci U S A. 2006;103:12132–12137. doi: 10.1073/pnas.0603670103. [DOI] [PMC free article] [PubMed] [Google Scholar]
- Yamanaka K, Chun SJ, Boillee S, Fujimori-Tonou N, Yamashita H, Gutmann DH, Takahashi R, Misawa H, Cleveland DW. Astrocytes as determinants of disease progression in inherited amyotrophic lateral sclerosis. Nat Neurosci. 2008;11:251–253. doi: 10.1038/nn2047. [DOI] [PMC free article] [PubMed] [Google Scholar]
- Zhang Q, Pangrsic T, Kreft M, Krzan M, Li N, Sul JY, Halassa M, Van Bockstaele E, Zorec R, Haydon PG. Fusion-related release of glutamate from astrocytes. J Biol Chem. 2004;279:12724–12733. doi: 10.1074/jbc.M312845200. [DOI] [PubMed] [Google Scholar]
- Zorec R, Araque A, Carmignoto G, Haydon PG, Verkhratsky A, Parpura V. Astroglial excitability and gliotransmission: an appraisal of Ca2+ as a signalling route. ASN Neuro. 2012;4.pii:e000804. doi: 10.1042/AN20110061. [DOI] [PMC free article] [PubMed] [Google Scholar]