Abstract
Phage and their bacterial hosts are the most diverse and abundant biological entities in the oceans, where their interactions have a major impact on marine ecology and ecosystem function. The structure of interaction networks for natural phage–bacteria communities offers insight into their coevolutionary origin. At small phylogenetic scales, observed communities typically show a nested structure, in which both hosts and phages can be ranked by their range of resistance and infectivity, respectively. A qualitatively different multi-scale structure is seen at larger phylogenetic scales; a natural assemblage sampled from the Atlantic Ocean displays large-scale modularity and local nestedness within each module. Here, we show that such ‘nested-modular’ interaction networks can be produced by a simple model of host–phage coevolution in which infection depends on genetic matching. Negative frequency-dependent selection causes diversification of hosts (to escape phages) and phages (to track their evolving hosts). This creates a diverse community of bacteria and phage, maintained by kill-the-winner ecological dynamics. When the resulting communities are visualized as bipartite networks of who infects whom, they show the nested-modular structure characteristic of the Atlantic sample. The statistical significance and strength of this observation varies depending on whether the interaction networks take into account the density of the interacting strains, with implications for interpretation of interaction networks constructed by different methods. Our results suggest that the apparently complex community structures associated with marine bacteria and phage may arise from relatively simple coevolutionary origins.
Keywords: phage–bacteria infection networks, coevolution, relaxed lock-and-key, nestedness, modularity, phage
1. Introduction
Bacteriophage and their bacterial hosts are the most abundant and diverse replicating entities in the oceans, playing central roles in marine ecology and ecosystem processes [1–7]. Fast replication and high mutation rates mean that bacteria and phage can evolve—and coevolve—rapidly [8–11], suggesting that coevolution will influence both ecological dynamics and ecosystem processes. Yet, the basic mode of bacteria–phage coevolution is unclear. Experimental studies have demonstrated adaptation of resistance and infectivity ranges over just a few generations of laboratory coevolution [8,9,12,13], often interpreted as a coevolutionary ‘arms race’ in which hosts evolve to expand their range of resistance, while phages evolve to expand their host range. Unconstrained arms races are predicted to result in low diversity [14], with a single dominant host/phage strain, or perhaps two dominant host types if there is a trade-off between resistance and resource competition [8]. However, the short time intervals involved mean that the experimental coevolution data can be ambiguous and may sometimes also be consistent with a ‘fluctuating selection’ mode of coevolution in which infection is highly specific, so that hosts are more resistant to contemporary phages than ancestral or future strains [15]. Fluctuating selection dynamics are consistent with aquatic viral ecology models predicting kill-the-winner dynamics [16,17], whereby the most successful hosts (in terms of resource competition) are prevented from becoming dominant by increased viral predation. In kill-the-winner ecological dynamics, density-dependent predation by specialized viruses imposes negative frequency-dependent selection pressure on hosts, favouring rare phenotypes. Such dynamics are believed to support the maintenance of diverse communities of marine bacteria and phage [18,19]. Recent genomic studies give empirical support for high natural diversity of marine bacteria and phage, with high specificity of infection and rapid coevolution [11,18,20,21]. Thus, despite much progress in experimental coevolution and marine microbial genomics, substantial uncertainties remain about the basic mode of phage–bacteria coevolution.
A complementary source of data about coevolution lies in the structure of natural phage–bacteria communities. Some recent data compilations have depicted phage–bacteria communities as bipartite networks representing which phage strains were observed to infect which bacteria strains [22–24]. Statistical analyses of these ‘phage–bacteria infection networks’ (most often given in the form of binary matrices of presence(1)–absence(0) of pairwise infection) have so far focused on the matrix metrics of ‘nestedness’ and ‘modularity’ (see inset in figure 1). Nestedness is a measure of the extent to which the non-zero elements of each row (or column) in the matrix are a subset of the non-zero elements in the subsequent rows (or columns). In a perfectly nested matrix, the entries in each row (column) are a strict subset of the entries in the next row (column); thus, each row (column) is nested inside the next row (column). In terms of phage–bacteria interaction, nestedness relates to the differentiation of strains along a gradient from specialist (small range) to generalist (large range). Here ‘range’ refers, for bacteria, to the number of phage strains against which it is resistant, and, for phages, to the number of bacterial strains it can infect. A perfectly nested pattern is one in which the hosts and phages are each ranked along the specialist–generalist gradient such that the specialist strategies are subsets of the more generalized strategies. A modular network structure occurs when nodes can be partitioned into subsets such that most connections occur within rather than between the different subsets. For bacteria and phage, modularity can be interpreted as a specialized interaction structure, without transitivity (i.e. where strains cannot be ranked by increasing range), in which distinct clusters of phage strains preferentially infect distinct clusters of bacterial strains.
Figure 1.
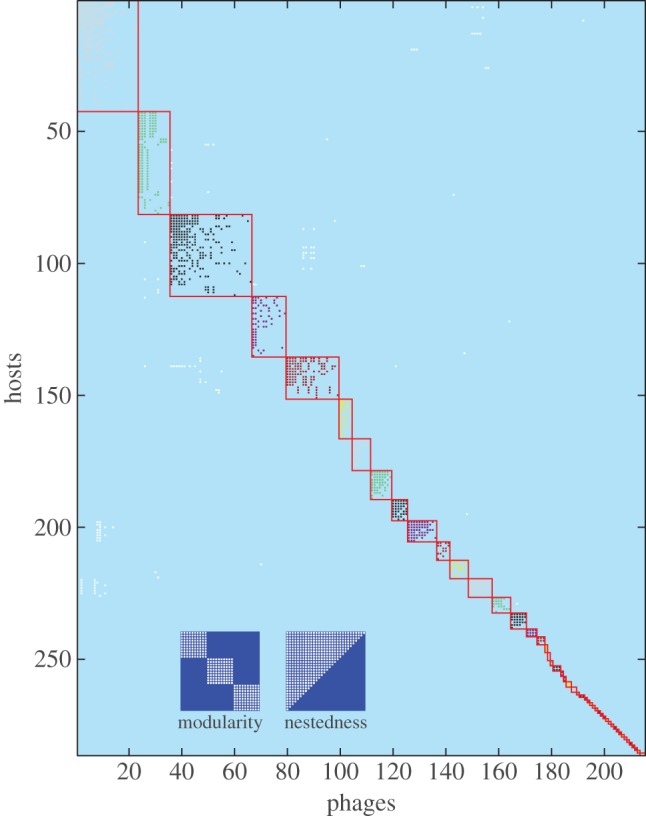
Nested-modular interaction structure of 215 phage strains and 286 bacteria strains sampled from the Atlantic Ocean (adapted from [23]). The plot shows which phage strains can infect which host strains from the dataset presented by Moebus & Nattkemper [25]. Flores et al. [23] re-sorted the interaction matrix to maximize modularity and within-module nestedness. Here, we additionally highlight identified modules by shading; interactions falling outside any module are shown in white. We also add two inset schematics illustrating perfectly modular and perfectly nested matrix structures.
Assuming that natural interactions between phage and bacteria are ultimately the product of coevolution, phage–bacteria interaction network structures may offer insight into the coevolutionary processes that produced them. At small phylogenetic scales, these networks typically show higher than expected nestedness and lower than expected modularity [22]. High nestedness is consistent with an arms race mode of coevolution, where hosts and phages evolve to increase their range of resistance/infectivity. However, the largest reported cross-infection assay involved 774 bacterial strains and 298 phage strains isolated from multiple geographically dispersed sites across the Atlantic Ocean [25]. Although no explicit genotyping was conducted in this study, it is likely that this dataset spans a broad phylogenetic scale. Reanalysis of interactions between 286 host strains and 215 phage strains from this dataset [23] found that the resulting network showed large-scale modularity, with local nestedness within each module. This is visualized in figure 1, in which bacteria (rows) and phage (columns) were ordered (following [23]) to maximize statistical modularity and within-module nestedness. Here, we highlight the identified modules by shading; interactions falling outside any identified module are shown in white. We also add two inset schematics illustrating perfectly modular and perfectly nested matrix structures. It is difficult to explain this ‘nested-modular’ pattern as the result solely of arms race coevolution; the lack of global nestedness and the presence of distinct modules suggests that some additional mechanism is needed. While models of coevolution based on high specificity of infection often predict diversification [14]—and might thus be invoked to explain formation of distinct modules—such models do not explain the presence of within-module nestedness.
Here, we explore a simple model of coevolution based on genetic matching [26–28], which we dub the ‘relaxed lock-and-key model’. The model is mechanistically justified by reference to coadaptation of (for example) phage tail-fibres and host surface receptors [29]. We show that relaxed lock-and-key coevolution is sufficient to produce the core structural features of observed phage–bacteria communities: stable high diversity of bacteria and phage, modularity at large phylogenetic scales and nestedness at small phylogenetic scales. Furthermore, we show that the strength and statistical significance of the observed nested-modular pattern depends on how the interaction networks are formed. Here, we contrast interaction networks based on the potential adsorption rate of each phage strain on each host strain with interaction networks based on the actual infection rate measured in an ecological context. Our findings highlight difficulties with comparison of interaction networks constructed by these different methods.
In §2, we present the relaxed lock-and-key coevolution model in the ecological context of a multi-strain chemostat. This is followed by presentation of results showing the co-diversification of bacteria and phage, the construction of associated adsorption rate and infection rate interaction networks and analyses of network properties over time. Finally, we discuss the relevance of the relaxed lock-and-key model for understanding natural phage–bacteria communities.
2. Model
We model bacteria–phage coevolution by adding mutation to numerical simulations of a multi-strain chemostat. Later we describe the ecological model, the coevolutionary model (including how the infection rate is calculated for a given pair of bacteria and phage strains), and methods used to analyse phage–bacteria interaction networks. A description of the parameters used is given in table 1. The model has been analysed previously [27,28]; model sensitivity to key parameters is given in [28]. It is derived from a similar model [26] (with the principal difference being in how the evolutionary dynamics are evaluated), which in turn derives from an earlier single-strain ecological model of bacteria–phage growth in a chemostat [30].
Table 1.
Model parameters and variable definitions. Variables can change during a simulation. Numerical values are parameters fixed for the duration of a simulation. Range values are deterministically calculated from other variables/parameters.
| symbol | description | value | unit |
|---|---|---|---|
| R | resource concentration | variable | μg ml−1 |
| Ni | density of host strain i | variable | cells ml−1 |
| Vj | density of phage strain j | variable | virions ml−1 |
| Ninit | initial host density | 4.6×10⁴ | cells ml−1 |
| Vinit | initial phage density | 8.1×10⁵ | virions ml−1 |
| ω | chemostat dilution rate | 0.0033 | min−1 |
| R0 | resource supply concentration | 2.2 | μg ml−1 |
| ɛ | resource conversion rate | 2.6×10⁻⁶ | μg cell−1 |
| γ | maximum resource uptake rate | 0.0123 | μg min−1 |
| K | half-saturation constant | 4 | μg ml−1 |
| δi | growth scaling for host hi | range [δmin,δmax] | scalar |
| δmin | minimum growth scaling factor | 0.8 | scalar |
| δmax | maximum growth scaling factor | 1.2 | scalar |
| ϕ | maximum adsorption rate | 0.104×10⁻⁸ | ml(min virion)−1 |
| θij | adsorption scaling for vj on hi | range [0,ϕ] | scalar |
| β | burst size | 71 | virions cell−1 |
| hi | genotype of bacteria i | range [0,1] | scalar |
| vj | genotype of phage j | range [0,1] | scalar |
 |
resistance phenotype of bacteria i | range [0,1] | scalar |
 |
infection phenotype of phage j | range [0,1] | scalar |
| hinit | initial bacteria genotype | 0.2 | scalar |
| vinit | initial phage genotype | 0.2 | scalar |
| S | specificity of phage | 100 | scalar |
| μN | host mutation rate | 10−6 | cell−1 |
| μV | phage mutation rate | 10−5 | virion−1 |
| σN | s.d. of host mutation range | 0.01 | scalar |
| σV | s.d. of phage mutation range | 0.01 | scalar |
| MN | bacterial mutation size | random variable | scalar |
| MV | phage mutation size | random variable | scalar |
| Δt | integration time step | 10 | min |
| T | simulation duration | 5×10⁷ | min |
| ρ | resolution of genotype diversity | 0.001 | scalar |
| L | chemostat volume | 1 | ml |
2.1. Multi-strain chemostat model
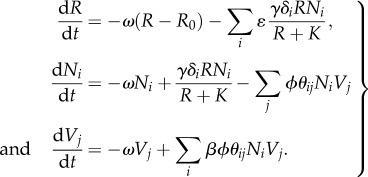
The ecological model represents the interactions between multiple strains of bacteria and phage in a single-resource chemostat. Resource concentration R and densities of the ith strain of bacteria Ni and the jth strain of phage Vj are governed by the system of equations as follows:
 |
2.1 |
Resource concentration is affected by the chemostat washout rate ω, the supply concentration R0, and uptake by all bacterial strains. Bacterial resource uptake is governed by Monod kinetics [31] with half-saturation rate K and maximum uptake rate γ, adjusted for each bacterial strain i by a genetically encoded scaling coefficient δi. Bacterial strain density is a function of washout, population growth and lysis. Resource uptake is converted directly into bacterial population growth via resource conversion constant ɛ. Each bacterial strain is potentially susceptible to infection by every strain of phage, depending on genetic match. Phage strain density is determined by washout and the sum of production on all available hosts. Adsorption of phage j to host i is the product of the maximum adsorption rate ϕ and a scaling coefficient θij. Every adsorption event leads to infection and instantaneous cell lysis (we assume no latent period) creating new phages with burst size β.
2.2. Relaxed lock-and-key coevolution model
We model evolution in the multi-strain ecological model by adding a mutation process that introduces new variants of existing bacteria and phage strains. Uncompetitive strains are eventually removed by chemostat dilution. Thus, we have a simple model in which bacteria and phage phenotypes can evolve by natural selection. We do not separate the evolutionary and ecological time scales, but instead assume a fixed probability of mutation per new cell/phage and allow evolutionary dynamics to play out in our numerical simulations. We ran our simulations for 5 × 10⁷ min, sufficient for the dynamics to reach a quasi-stable equilibrium. This time scale is chosen to allow a relatively slow evolutionary dynamic in the context of faster ecological dynamics and is not intended to accurately reflect analogous time scales in natural systems.
Bacterial h and phage v genotypes are modelled as single values in the range [0,1] (binned at resolution ρ = 0.001). Bacteria and phage have mutation rates μN and μV, respectively, applied stochastically for each new cell/phage. Mutation creates a single cell/phage with a genotype created by adding a normal deviate to the parental genotype, with standard deviation (mutation range) of σN or σV for bacteria and phage, respectively. If the density of any population falls below 1 cell ml−1 or 1 virion ml−1 (possible because of the continuous nature of the mathematical abstraction), that population is assumed to be lost and is removed from the system. Any simulations where genotypes reached the edges of the permitted range [0,1] were discarded; however, parameters were chosen to ensure that this did not occur.
The relaxed lock-and-key coevolution model is created by enforcing a dependence of the adsorption rate on the genetic similarity of host and phage. The relative adsorption rate θij of phage j on host i is given by
| 2.2 |
where  is the bacterial resistance strategy for the ith host encoded by genotype hi,
  is the phage infectivity strategy for the jth phage encoded by genotype vj and S represents infection specificity. This function has Gaussian form, with specificity governing the width of the infection curve, i.e. high specificity indicates narrow host range, while low specificity indicates wide host range. Hence the closer the numerical values of strategies
  and
and  are, the greater the rate of adsorption between host i and phage j.
Bacterial genotype also specifies a growth-rate scaling trait δ, where each bacterial genotype hi maps to a growth rate δi. Here, we impose a simple growth rate fitness landscape with a singular peak of δmax = 1.2 at h = 0.5, falling linearly to a minimum of δmin = 0.8 at the edges of the range (i.e. for h = 0 and h = 1). The growth rate trait δ is a coefficient that affects population growth rate by scaling the rate of resource uptake by bacteria (see equation (2.1)). It is important to note that there are no inherent differences in bacterial resistance (that is, all bacteria have the same size of range of resistance); thus, there are no costs of resistance and no explicit trade-offs between growth rate and infection rate. Ecological trade-offs between bacterial growth and susceptibility to infection can emerge [28], but these depend on the density and composition of the contemporary phage and bacterial communities.
2.3. Infection network analysis
Interactions between bacteria and phage strains (i.e. who infects whom) can be represented as a network [24]. Such networks are bipartite graphs with interactions between two types of node (bacteria and phage). We use two forms of interaction network to visualize our model phage–bacteria communities. The first type is formed from the adsorption rate ϕθ ij of phage j on host i, which gives a pairwise interaction matrix for all strains present in the community irrespective of their abundance. The second type of interaction network is formed from the actual infection rates for phage j on host i in the current ecological context, calculated as ϕθijNiVj from the adsorption rate and the current densities of each strain, giving a more ecologically relevant measure of interaction.
As both adsorption rate and infection rate are quantitative metrics, we create binary interaction matrices by applying threshold filters. The resulting binary matrices consist of 1s where the pairwise interaction is strong and 0s elsewhere. The binary matrices can be analysed using standard metrics for nestedness and modularity. They can also be compared with reported interaction networks, which are typically given in binary form. We used the package BiWeb [32], which uses the LP-BRIM algorithm to find the partition that best maximizes Barber's modularity (Qb) for bipartite networks [33,34]. Since the LP-BRIM sorting algorithm is sensitive to initialization, we repeated the modularity assessment five times for each measurement, taking the maximum score returned. We measured nestedness using the deterministic NODF (nestedness metric based on overlap and decreasing fill) algorithm [35], which returns a score in the range [0,100] (where 100 indicates a perfectly nested structure). NODF normalizes for matrix size, allowing matrices of differing sizes to be compared.
To quantify the statistical significance of the nestedness (NODF) and modularity (Barber's Qb) scores measured for a particular binary matrix, we calculate statistical significance p as the likelihood of achieving a score greater than or equal to the score for the input matrix in a sample of M matrices from a null distribution of random matrices. Where this method returns p = 0 we conservatively assign p < 1/M. We use a null model in which matrix size (number of rows and columns) and fill (number of 1s) are conserved, but where adjacency (position of 1s) is randomly reassigned. Thus, we maintain the numbers of host and phage strains, and the total number of host–phage interactions, but reassign the pattern of who infects whom. We estimate the null distribution using a sample of M matrices generated using a stochastic algorithm with pseudo-random numbers. For significance of NODF scores, we create the sample in two sets, adding matrices to both sets until the mean NODF scores for both sets converge within a tolerance bound of 0.01. The sample used to estimate the null distribution is then formed as the union of both sets. Thus for NODF, the sample size M varies according to how many null matrices are needed to achieve convergence of the means, with a minimum sample of 500 null matrices computed in each case. This method gives reliable estimation of the underlying distribution while retaining computational efficiency. For the modularity scores, we used M = 100, assigning each null matrix the highest Barber's modularity score from five random initializations of the LP-BRIM algorithm. A free software package including these methods is currently in preparation [36].
3. Results
In previous work [28], we have shown that, in the absence of phage, resource limitation leads to competitive exclusion of slow-growing bacteria by fast-growing bacteria. Faster growing populations draw down resource concentration to a limiting level at which slower growing populations cannot be sustained against losses from washout and are lost from the community. Thus, in the absence of phage, bacteria evolve to the fastest growing genotype permitted by the simple unimodal growth rate fitness landscape (here located at h = 0.5; see §2.2). In the presence of phage, host evolution is affected by the additional coevolutionary selection pressures imposed by phage predation.
The relaxed lock-and-key coevolution model robustly produces diversification of bacteria and phage. Figure 2 shows a simulation run initialized with a single bacterial strain and perfect-match phage strain (with h = v = 0.2). In the first stage (until t ≈ 0.5 × 10⁷ min), bacteria evolve to increase growth rates, while phage evolve to track their hosts through genotypic space. Once the bacteria reach the maximum growth rate genotype at h = 0.5, they can no longer improve fitness by increasing growth rate (and would remain at this fitness peak indefinitely in the absence of phage [28]). However, phage create a strong selective pressure for host diversification owing to density-dependent predation, which favours host mutants with a lower genetic match to dominant phage strains. This causes an evolutionary branching event to occur between t ≈ 0.6 × 10⁷ min and t ≈ 1.1 × 10⁷ min. Further evolutionary branching events occur until t ≈ 2.5 × 10⁷ min. After this period of coevolutionary diversification, the distribution of strains settles down to a quasi-stable state for the remainder of the simulation. At this stage, there are five clearly identifiable clusters of similar genotypes for both bacteria and phage, where each cluster (hereafter, ‘species’) represents an ecologically similar (but genetically diverse) sub-population. Each phage species is attracted towards its two flanking host species, while each host species is repelled by its flanking phage species; this process of attraction and repulsion sometimes results in transient oscillatory dynamics (this effect is clearly seen for t ≈ 2 − 3 × 10⁷ min).
Figure 2.
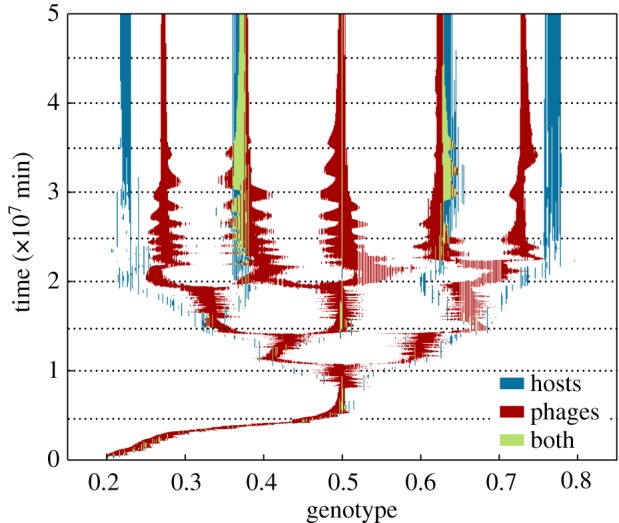
Coevolutionary diversification of bacteria and phage strains with the relaxed lock-and-key model. Plot shows phage–bacteria community composition over time for a simulation run initialized with a single host strain and perfectly matched phage (initial genotypes h = v = 0.2). Genotypes with non-zero density for bacteria, phage or both bacteria and phage are highlighted. The fastest growing bacteria genotype is located at h = 0.5. The cross-section of the community at time t = 3.5 × 10⁷ is examined in figure 3. Horizontal dotted lines indicate time points for which interaction matrices are presented in figures 4 and 5.
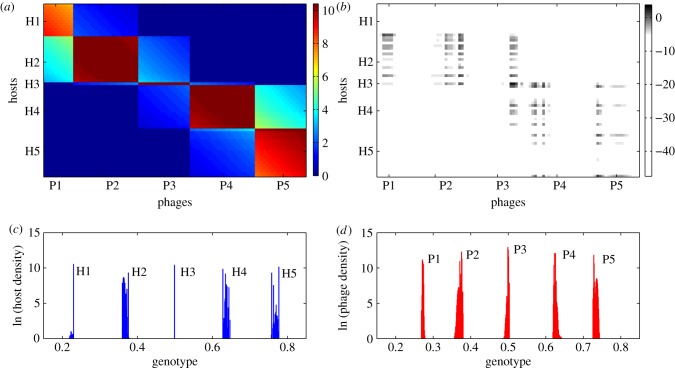
Figure 3 visualizes the community structure for a time slice from the simulation taken at t = 3.5 × 10⁷ min. There are 64 bacterial strains and 97 phage strains present in the community. Densities of the different strains vary widely and are unevenly distributed, but five clearly identifiable species of similar genotypes in both the bacteria (figure 3c) and phage (figure 3d) populations are visible. For ease of reference, we label the host species H1–H5 and the phage species P1–P5.
Figure 3.
Snapshot of phage–bacteria community structure and interaction during the case study simulation (measured at t = 3.5 × 10⁷ min). (a) Adsorption rate matrix plot showing pairwise adsorption rate (ϕθij, values scaled × 10−10) for each host (i) and phage (j) strain present in the current community. (b) Infection rate matrix plot showing actual infection rate in the context of the community (ln|ϕθijNiVj|) for each host–phage pair. (c) Current density of all bacterial genotypes (ln|Ni|). (d) Current density of all phage genotypes (ln|Vj|). For ease of reference, labels H1–H5 and P1–P5 are manually attached to identify bacteria and phage ‘species’, respectively.
We visualize interactions between phage and bacterial strains by plotting the (density-independent) adsorption rate matrix (figure 3a) and the (density-weighted) infection rate matrix (figure 3b). These matrices represent a snapshot of the coevolving interactions between phage and bacteria—note that the matrices include all strains that are present, but do not cover the whole genetic space (i.e. absent strains are not plotted). Each host species interacts strongly with a single phage species, as indicated by the modular structure apparent in the adsorption rate matrix (e.g. P1 is specialized on H1, P2 on H2, and so on). However, there are also weaker interactions with adjacent phage species (e.g. H2 is also weakly affected by P1 and P3). The infection rate matrix gives a different view of the community; whereas the adsorption rate shows a potential interaction, the infection rate shows the interaction in terms of actual mortality of the host caused by the phage in the ecological interaction. The infection rate matrix shows that most of the potential interactions shown in the adsorption rate matrix are ecologically insignificant, since only a few strains in each species are present at sufficient density for a strong interaction to occur. Also there is a many–many interaction structure, with each bacterial strain infected by multiple phage strains, and each phage infecting multiple bacteria. Interestingly, the infection rate matrix also suggests a degree of modularity, though module membership appears different from that seen in the adsorption rate matrix.
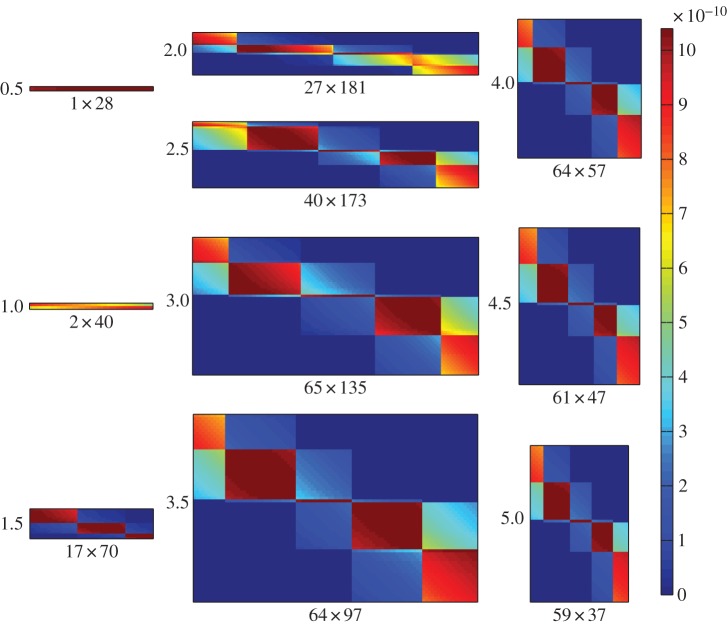
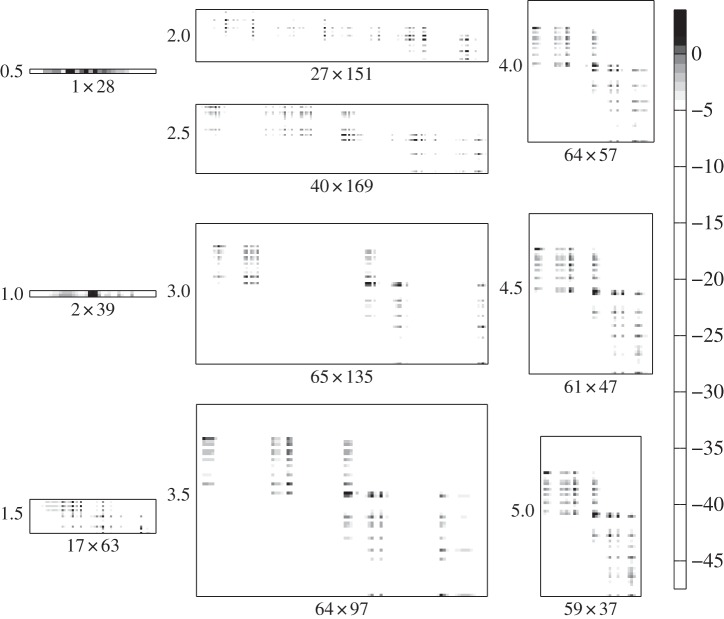
Figures 4 and 5 show how the adsorption rate and infection rate interaction networks, respectively, change over time as bacteria and phage coevolve. Initially, there is low diversity and the matrices are small, but over time matrix size increases as hosts and phages diversify. At later time points, matrix size reduces somewhat, reflecting an overall drop in diversity as competition excludes weaker strains and the system converges to a quasi-stable state. Matrix sizes show trends in strain diversity, with host diversity rising to a stable level of around 60–65 strains and phage diversity initially rising, then falling, during the course of the simulation. This trend is reflected at smaller scale in the sizes of the modules in the adsorption rate matrix. Modular interaction structure is always apparent in the adsorption rate matrix, though the number of modules varies over time. Structure in the infection rate matrix is harder to discern visually, though some modularity seems to be apparent at later time points.
Figure 4.
Coevolutionary formation of the adsorption rate interaction network over time. Shading shows pairwise interaction strength (ϕθij) for bacterial strains (rows) and phage strains (columns). Network size (number of bacterial strains × number of phage strains) is shown as the x-axis label for each plot; time point (×107 min) is shown as the y-axis label. Plots show time points corresponding to the dotted gridlines shown in figure 2, with time increasing down each column, from top left to bottom right.
Figure 5.
Coevolutionary formation of the infection rate interaction network over time. Greyscale shows pairwise interaction strength (ln|ϕθijNiVj|) for bacterial strains (rows) and phage strains (columns). Network size (number of bacterial strains × number of phage strains) is shown as the x-axis label for each plot; time point (×107 min) is shown as the y-axis label. Plots show time points corresponding to the dotted gridlines shown in figure 2, with time increasing down each column, from top left to bottom right.
We converted our quantitative interaction matrices into binary matrices using a threshold filter (see §2.3), to give matrices suitable for comparison with reported phage–bacteria interaction networks [22,23]. The resulting binary networks are a coarse-grained representation of the underlying data, but can be used with the LP-BRIM and NODF algorithms to quantify modularity and nestedness, respectively. Figure 6 shows the effect of different thresholds. The size and fill of the resulting binary matrix depends on the threshold used. The importance of choosing an appropriate threshold is well illustrated by the adsorption rate matrices, where choosing too low or too high a threshold results in binary matrices that do not capture the modular structure apparent in the raw data; setting too low a threshold gives overlapping modules, setting too high a threshold may result in loss of some modules. For the remainder of the analysis, we use an adsorption rate threshold of 0.8ϕ and an infection rate threshold of 0.0083 cells (ml min)−1, which typically gave good agreement with visual interpretation of the raw data. The results presented below for adsorption rate matrices are weakly sensitive (but qualitatively robust) to the choice of threshold (data not shown). Results for infection rate matrices are robust to choice of threshold.
Figure 6.
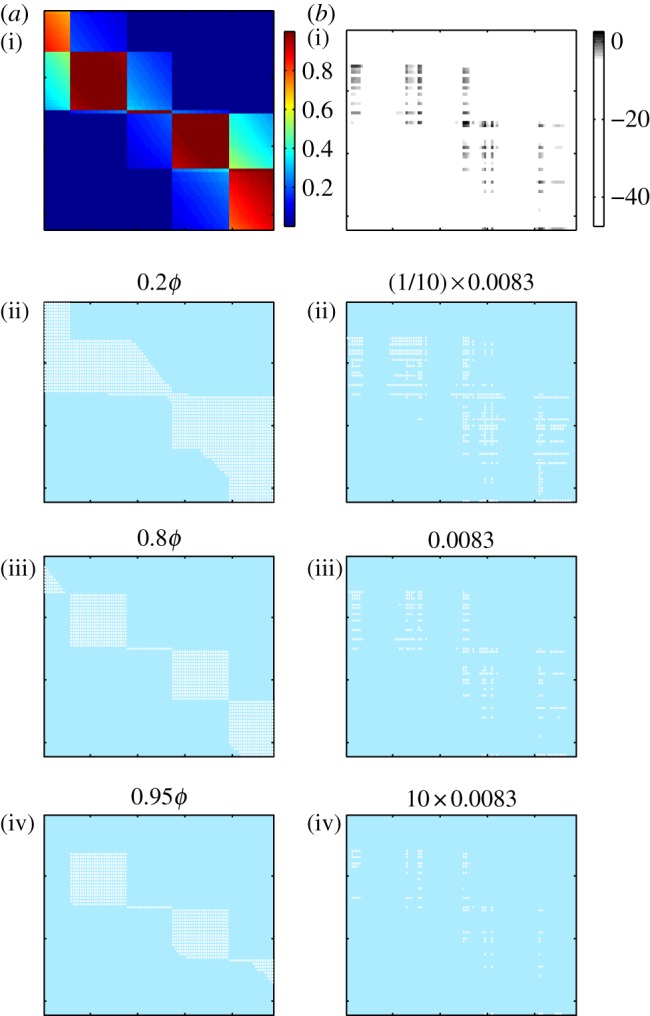
Effect of the choice of filter threshold on the binary representation of interaction matrices. (a(i),b(i)) shows the raw (unfiltered) matrix data for pairwise adsorption rates (a) and infection rates (b). (a(ii)–(iv),b(ii)–(iv)) show binary matrices formed by filtering raw data with different thresholds. Threshold values of 0.8ϕ for adsorption rates and 0.0083 cells (ml min)−1 for infection rates were used for all subsequent analyses.
The order of rows and columns in the binary matrices can be permuted without changing the underlying network structure. Figure 7 shows binary networks formed from the adsorption rate and infection rate matrices for the time slice (t = 3.5 × 10⁷ min), as shown in figure 3. Different row and column re-orderings are applied in each panel. Figure 7a(ii),b(ii) shows a random re-ordering that removes the phylogenetic ordering that arises from model formulation (whereby hosts and phages are ordered by genotype), thus representing how unsorted results of an experimental infection assay might appear. Figure 7a(iii),b(iii) is sorted to maximize modularity using the LP-BRIM algorithm, with identified modules highlighted by shading. Figure 7a(iv),b(iv) is sorted to maximize nestedness using the NODF algorithm.
Figure 7.
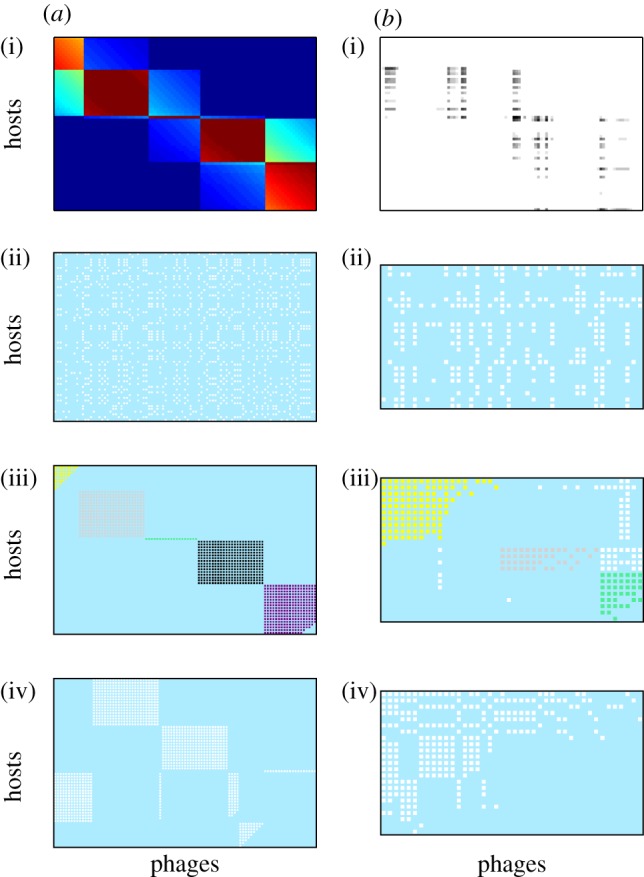
Comparison of binary interaction networks formed by applying a threshold filter to (a) adsorption rate and (b) infection rate matrices, for a snapshot of the system at t = 3.5 × 10⁷ min, arranged with host strains on rows and phage strains in columns. (a(i),b(i)) Quantitative interaction data; (a(ii)–(iv),b(ii)–(iv)) binary matrices formed using a threshold filter of the quantitative data, sorted for (a(ii),b(ii)) random permutation, (a(iii),b(iii)) maximization of modularity and (a(iv),b(iv)) maximization of nestedness.
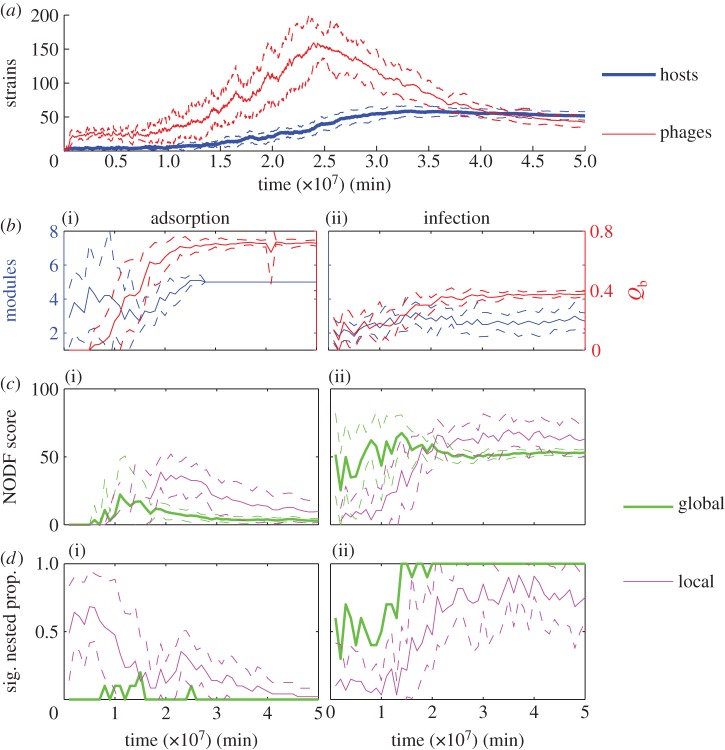
For the same case study, we used binary interaction matrices to study the temporal dynamics of nestedness (from the NODF algorithm) and modularity (using Barber's modularity score returned by the LP-BRIM algorithm). Figure 8 shows the mean values across an ensemble of 10 simulations with identical parameters. The ensemble runs differ only in the pseudo-random numbers used in the stochastic mutation process. This stochastic variation leads to different timing and order of evolutionary branching events, but the quasi-steady state reached is similar in all simulations (data not shown). Host strain diversity rises over time before levelling off, while phage strain diversity is highest during the diversification phase and decreases as quasi-steady state is approached.
Figure 8.
Time series of matrix metrics for nestedness and modularity of binary interaction networks during coevolutionary simulations. Data shown are mean values (solid lines) ± 1 s.d. (dashed lines) from an ensemble of 10 simulation runs with identical parameters but different stochastic mutations. (a) Number of bacterial and phage strains. The following panels show metrics for adsorption rate matrices (b(i)–d(i)) and infection rate matrices (b(ii)–d(ii)). (b(i)(ii)) Number of modules detected (left axis) and Barber's modularity score Qb (right axis). (c(i)(ii)) NODF nestedness score of the whole network (global) and mean within-module NODF nestedness score (local) in each simulation. (d(i)(ii)) Proportion of NODF nestedness scores in each simulation that were statistically significant at a level of p < 0.05 for the whole network (global) and within-module (local).
Figure 8b(i)(ii) shows that the interaction structure shown by adsorption rate matrices converges on five clearly identifiable modules that are well detected by the LP-BRIM algorithm. Module identification is less reliable early in the simulation, when the algorithm sometimes produces false positives (e.g. by identifying ‘modules within modules’), giving large variances in module number early in the simulations. Fewer modules are detected in the infection rate matrices and there is greater variance in the number detected throughout the simulations. Barber's modularity metric is significantly higher for the adsorption rate matrices than for the infection rate matrices throughout the simulations, confirming the visual suggestion (figure 3) of a stronger modular structure for this form of interaction. We also performed significance tests against Barber's modularity for the adsorption rate and infection rate matrices for all simulations at t = 2.5 × 10⁷ min and t = 5 × 10⁷ min, finding that modularity for all matrices tested was significant at a level of p < 0.01.
Figure 8c(i)(ii),d(i)(ii) shows time series for nestedness (measured by NODF) and statistical significance of nestedness (here we assume statistical significance at a level of p < 0.05). Global nestedness of the whole adsorption rate matrix is typically low and rarely statistically significant. By contrast, global nestedness of the whole infection rate matrix is relatively higher and (after the initial diversification phase of the coevolutionary dynamics) almost always statistically significant.
For each simulation, we also calculated nestedness for the modules identified by the LP-BRIM algorithm. Figure 8c(i)(ii),d(i)(ii) shows the mean within-module NODF score across all modules detected in a particular simulation, as well as the proportion of modules which were statistically nested. Mean within-module nestedness is typically higher than global nestedness for both forms of interaction matrix. Mean within-module nestedness of adsorption rate matrices is typically low and statistically insignificant for most of the time series, but rises and shows a higher frequency of statistical significance approaching the mid-point of the simulation runs, when phage diversity is the highest. Visual inspection of the adsorption rate matrices showed that a large proportion of identified modules were completely filled (all 1s). These cases give NODF = 0 at a significance level of p = 1. For the remaining minority of non-filled modules, mean within-module nestedness was typically strong and statisticially significant. Mean within-module nestedness of infection rate matrices is typically high and in most cases statistically significant.
Overall, there is a mixed signal from our statistical comparison of binary interaction networks formed from adsorption rates and from infection rates. Both forms of interaction network show a multi-scale nested-modular interaction structure to some extent. For adsorption rate matrices, global modularity is very strong while within-module nestedness is often weak and statistically insignificant; however, there is a minority of modules which are strongly and significantly nested during the middle section of the simulations when phage diversity is highest. For infection rate matrices, global modularity is weaker, but identified modules are typically significantly nested. Interestingly, the infection rate matrices are also typically significantly globally nested.
4. Discussion
Here, we have shown that a parsimonious ‘relaxed lock-and-key’ coevolution model based on genetic matching is sufficient to reproduce several core structural features of observed natural communities of bacteria and phage. Negative frequency-dependent selection from phage drives host diversification, which is then mirrored by phage diversification to track their hosts. At steady state, a diverse community of hosts and phages is maintained by kill-the-winner ecological dynamics. Two forms of phage–bacteria interaction network representing the coevolved communities show similar multi-scale structural patterns to those observed for natural communities; modularity at large phylogenetic scales and nestedness at smaller scales.
We have aimed with our theoretical study to show that a very simple coevolutionary model can produce nested-modular structures and have selected the chemostat formalism as one of the simplest models in which coevolutionary dynamics can be studied. We do not rule out the possibility that other processes, including spatial structure or multiple resources, might affect observed natural patterns. However, such processes lie beyond the scope of our current study, which aims to show what might occur as a result of coevolution alone, in the absence of any other (possibly confounding) additional processes. We believe that the most useful models are often the simplest and argue that the use of the chemostat formalism does not affect the generality of our results.
An important caveat is that there is currently only a single dataset [23,25] showing the macroscale nested-modular interaction structure that the relaxed lock-and-key model produces. Thus, it is possible that we are over-estimating the importance of this dataset and hence misjudging the capability of the relaxed lock-and-key model to explain natural community structures. However, there are multiple observations of stable high diversity in natural phage–bacteria communities (e.g. [3,5,18,20]), as well as many examples of nested interaction networks at smaller phylogenetic scales [22]. At larger phylogenetic scales, there are good arguments to support the specificity of infection needed to produce a modular network structure; for example, phage target particular receptors which may only be present in a small number of bacterial lineages, limiting their potential host range [18,29]. Thus, we cautiously suggest that the nested-modular structure should be robust at large phylogenetic scales and propose that additional large-scale cross-infection studies would be a fruitful area for further research.
In the adsorption rate matrices, the nested-modular pattern is most clearly observed when the system is still in the transient diversification phase, i.e. before the system reaches an evolutionary steady state and while the species in the system are still adapting. This section of the coevolutionary dynamics is also where the phage diversity is highest. Since the adsorption rate network includes interactions irrespective of the density of the bacteria–phage strains involved, it probably includes many interactions between low-density strains which are in process of being out-competed and excluded from the system by fitter mutants. This may have implications for observations of natural communities, where overlapping ecological and evolutionary time scales for bacteria and phage [10,11] imply that many natural communities may not be at evolutionary steady state. We hypothesize that nested-modular structures in density-independent interaction networks will be most obvious when overall adaptation rates within the community are high; for example, in communities adapting to a changed or dynamic environment.
A note of caution must be raised about the methodological grounding for comparisons of model output to empirical observations. The two forms of interaction network that we studied (based either on adsorption rates or on infection rates) showed different statistical features. In this study, adsorption rate networks showed higher global modularity and lower within-module nestedness, whereas infection rate networks showed lower global modularity and higher within-module nestedness. While both forms of interaction network studied here showed broadly similar multi-scale structure, in general the fit to empirical data will depend both on which form of model network was chosen and also on the method by which the empirical network was produced. With theoretical models, all information is accessible—thus our model networks accurately reflect the full diversity of the model community. However, methods for the more difficult task of constructing interaction networks for natural communities inevitably introduce different kinds of bias into the network structure that is output. A common experimental method for determining interaction networks for natural phage–bacteria communities appears to be to collect a sample from the natural environment, isolate as many strains as possible, then use a plaque assay to test for infection of each potential host by each phage. However, sampling inevitably carries a bias towards collecting only the more numerous strains, of which only a small fraction will be cultivable [37,38]. Thus, while empirical studies reporting natural interaction networks may aim to present a complete record of all strains present in the community (i.e. to produce something similar to our model adsorption rate networks), they may actually (without any failure of the experimental method) be presenting networks more akin to our infection rate networks, which include only interactions between abundant strains. Thus, it is not clear which of our binary interaction networks should be compared with the networks reported for natural communities.
Another methodological issue surrounds the comparison of weighted and binary interaction networks; here, we have converted quantitative networks to binary networks to aid comparison with empirical data. Infectivity assays commonly measure only the presence or the absence of infection, rather than the messier rate/affinity data that indicate the quantitative strength of interactions, which are harder to measure [24,39,40]. Thus, empirical data are often given in binary form and analysed using statistical tools developed for binary matrices. Conversion of quantitative data into binary form loses information and inevitably introduces bias that will accentuate some features and mask others. A challenge for empirical researchers is to develop methods for measuring interaction strengths between phage and bacterial strains, rather than just the presence or the absence of interaction [40]. A challenge for theoretical researchers is to develop better statistical tools for analysing the weighted phage–bacteria interaction networks that will thereby be produced.
The original kill-the-winner model of aquatic virus ecology [16] describes one-to-one interactions between viruses and bacteria, such that no cross-infections occur. In that scenario, specialized infection leads to negative density-dependent predation from viruses, which favours rare bacteria phenotypes and acts to maintain diversity. This contradicts available data for real phage–bacteria systems [22,23]. The relaxed lock-and-key model allows for cross-infection based on genetic similarity, while producing a stable diverse community maintained by kill-the-winner dynamics. Observations of natural kill-the-winner dynamics [19] are thus consistent with the relaxed lock-and-key model. We note that several alternative coevolution models are unlikely to capture nested-modular interaction structures and kill-the-winner ecological dynamics. Gene-for-gene genetic models are consistent with arms race dynamics [41] and transitive range expansion, but do not permit stable high diversity without the addition of explicit trade-offs [14] (and even then diversity is typically limited to dimorphism [8]). Matching-alleles genetic models can drive diversification [14,41], but do not produce the modular structure or within-module nestedness.
There remain other mechanisms that will affect the interactions between bacteria and phage and several of these could potentially produce high diversity and nested-modular network structures. The relaxed lock-and-key model is perhaps most easily interpreted as representing coevolution of phage tail-fibres and bacterial cell-surface receptors. However, the real infection process is multi-stepped and coevolution may occur at different stages, including initial adsorption to extracellular surface receptors [42] and also subsequent intracellular defence mechanisms [29,43–46]. Additionally, our model does not take into account non-mutational processes of genetic variation, such as gene loss and horizontal gene transfer [18,40], or the possible role of environmental heterogeneity and/or spatial localization [23]. Any of these factors can affect natural community structures and could in principle have produced the patterns created here by coevolution. The strength of the relaxed lock-and-key model is by appeal to Occam's razor; it offers a parsimonious and sufficient explanation of multiple observed phenomena.
Acknowledgements
We would like to thank Richard Boyle and two anonymous reviewers for their comments that have helped improve this article.
Funding statement
S.J.B. and H.T.P.W. acknowledge financial support from the University of Exeter.
References
- 1.Fuhrman JA. 1999. Marine viruses and their biogeochemical and ecological effects. Nature 399, 541–548. ( 10.1038/21119) [DOI] [PubMed] [Google Scholar]
- 2.Wilhelm SW, Suttle CA. 1999. Viruses and nutrient cycles in the sea. Bioscience 49, 781–788. ( 10.2307/1313569) [DOI] [Google Scholar]
- 3.Weinbauer MG. 2004. Ecology of prokaryotic viruses. FEMS Microbiol. Rev. 28, 127–181. ( 10.1016/j.femsre.2003.08.001) [DOI] [PubMed] [Google Scholar]
- 4.Suttle CA. 2005. Viruses in the sea. Nature 437, 356–361. ( 10.1038/nature04160) [DOI] [PubMed] [Google Scholar]
- 5.Suttle CA. 2007. Marine viruses—major players in the global ecosystem. Nat. Rev. Microbiol. 5, 801–812. ( 10.1038/nrmicro1750) [DOI] [PubMed] [Google Scholar]
- 6.Brussaard CP, et al. 2008. Global-scale processes with a nanoscale drive: the role of marine viruses. ISME J. 2, 575–578. ( 10.1038/ismej.2008.31) [DOI] [PubMed] [Google Scholar]
- 7.Weitz JS, Wilhelm SW. 2012. Ocean viruses and their effects on microbial communities and biogeochemical cycles. F1000 Biol. Rep. 4, 17 ( 10.3410/B4-17) [DOI] [PMC free article] [PubMed] [Google Scholar]
- 8.Bohannan BJM, Lenski RE. 2003. Linking genetic change to community evolution: insights from studies of bacteria and bacteriophage. Ecol. Lett. 3, 362–377. ( 10.1046/j.1461-0248.2000.00161.x) [DOI] [Google Scholar]
- 9.Buckling A, Rainey PB. 2002. Antagonistic coevolution between a bacterium and a bacteriophage. Proc. R. Soc. Lond. B 269, 931–936. ( 10.1098/rspb.2001.1945) [DOI] [PMC free article] [PubMed] [Google Scholar]
- 10.Lennon JT, Martiny JB. 2008. Rapid evolution buffers ecosystem impacts of viruses in a microbial food web. Ecol. Lett. 11, 1178–1188. [DOI] [PubMed] [Google Scholar]
- 11.Marston MF, Pierciey FJ, Shepard A, Gearin G, Qi J, Yandava C, Schuster SC, Henn MR, Martiny JBH. 2012. Rapid diversification of coevolving marine Synechococcus and a virus. Proc. Natl Acad. Sci. USA 109, 4544–4549. ( 10.1073/pnas.1120310109) [DOI] [PMC free article] [PubMed] [Google Scholar]
- 12.Brockhurst MA, Morgan AD, Fenton A, Buckling A. 2007. Experimental coevolution with bacteria and phage: the Pseudomonas fluorescens—Φ2 model system. Infect. Genet. Evol. 7, 547–552. ( 10.1016/j.meegid.2007.01.005) [DOI] [PubMed] [Google Scholar]
- 13.Forde SE, Thompson JN, Holt RD, Bohannan BJ. 2008. Coevolution drives temporal changes in fitness and diversity across environments in a bacteria–bacteriophage interaction. Evolution 62, 1830–1839. [DOI] [PubMed] [Google Scholar]
- 14.Agrawal A, Lively CM. 2002. Infection genetics: gene-for-gene versus matching-alleles models and all points in between. Evol. Ecol. Res. 4, 79–90. [Google Scholar]
- 15.Gandon S, Buckling A, Decaestecker E, Day T. 2008. Host–parasite coevolution and patterns of adaptation across time and space. J. Evol. Biol. 21, 1861–1866. ( 10.1111/j.1420-9101.2008.01598.x) [DOI] [PubMed] [Google Scholar]
- 16.Thingstad TF. 2000. Elements of a theory for the mechanisms controlling abundance, diversity, and biogeochemical role of lytic bacterial viruses in aquatic systems. Limnol. Oceanogr. 45, 1320–1328. ( 10.4319/lo.2000.45.6.1320) [DOI] [Google Scholar]
- 17.Winter C, Bouvier T, Weinbauer MG, Thingstad TF. 2010. Trade-offs between competition and defense specialists among unicellular planktonic organisms: the ‘killing the winner’ hypothesis revisited. Microbiol. Mol. Biol. Rev. 74, 42–57. ( 10.1128/MMBR.00034-09) [DOI] [PMC free article] [PubMed] [Google Scholar]
- 18.Rodriguez-Valera F, Martin-Cuadrado AB, Beltran Rodriguez-Brito LP, Thingstad TF, Forest Rohwer AM. 2009. Explaining microbial population genomics through phage predation. Nat. Rev. Microbiol. 7, 828–836. ( 10.1038/nrmicro2235) [DOI] [PubMed] [Google Scholar]
- 19.Rodriguez-Brito B, et al. 2010. Viral and microbial community dynamics in four aquatic environments. ISME J. 4, 739–751. ( 10.1038/ismej.2010.1) [DOI] [PubMed] [Google Scholar]
- 20.Avrani S, Wurtzel O, Sharon I, Sorek R, Lindell D. 2011. Genomic island variability facilitates Prochlorococcus-virus coexistence. Nature 474, 604–608. ( 10.1038/nature10172) [DOI] [PubMed] [Google Scholar]
- 21.Zhao Y, et al. 2013. Abundant SAR11 viruses in the ocean. Nature 494, 357–360. ( 10.1038/nature11921) [DOI] [PubMed] [Google Scholar]
- 22.Flores CO, Meyer JR, Valverde S, Farr L, Weitz JS. 2011. Statistical structure of host–phage interactions. Proc. Natl Acad. Sci. USA 108, E288–E297. ( 10.1073/pnas.1101595108) [DOI] [PMC free article] [PubMed] [Google Scholar]
- 23.Flores CO, Valverde S, Weitz JS. 2013. Multi-scale structure and geographic drivers of cross-infection within marine bacteria and phages. ISME J. 7, 520–532. ( 10.1038/ismej.2012.135) [DOI] [PMC free article] [PubMed] [Google Scholar]
- 24.Weitz JS, Poisot T, Meyer JR, Flores CO, Valverde S, Sullivan MB, Hochberg ME. 2013. Phage–bacteria infection networks. Trends Microbiol. 21, 82–91. ( 10.1016/j.tim.2012.11.003) [DOI] [PubMed] [Google Scholar]
- 25.Moebus K, Nattkemper H. 1981. Bacteriophage sensitivity patterns among bacteria isolated from marine waters. Helgoländer Meeresuntersuchungen 34, 375–385. ( 10.1007/BF02074130) [DOI] [Google Scholar]
- 26.Weitz JS, Hartman H, Levin SA. 2005. Coevolutionary arms races between bacteria and bacteriophage. Proc. Natl Acad. Sci. USA 102, 9535–9540. ( 10.1073/pnas.0504062102) [DOI] [PMC free article] [PubMed] [Google Scholar]
- 27.Williams HTP. 2012. Coevolving parasites improve host evolutionary search on structured landscapes. In Artificial Life 13: Proc. of the Thirteenth Int. Conf. on the Simulation and Synthesis of Living Systems (eds Adami C, Bryson DM, Ofria C, Pennock RT.), pp. 129–136. Cambridge, MA: MIT Press. [Google Scholar]
- 28.Williams HTP. 2013. Phage-induced diversification improves host evolvability. BMC Evol. Biol 13, 17 ( 10.1186/1471-2148-13-17) [DOI] [PMC free article] [PubMed] [Google Scholar]
- 29.Labrie SJ, Samson JE, Moineau S. 2010. Bacteriophage resistance mechanisms. Nat. Rev. Microbiol. 8, 317–327. ( 10.1038/nrmicro2315) [DOI] [PubMed] [Google Scholar]
- 30.Levin BR, Stewart FM, Chao L. 1977. Resource-limited growth, competition, and predation: a model and experimental studies with bacteria and bacteriophage. Am. Nat. 111, 3–24. ( 10.1086/283134) [DOI] [Google Scholar]
- 31.Monod J. 1949. The growth of bacterial cultures. Annu. Rev Microbiol. 3, 371–394. ( 10.1146/annurev.mi.03.100149.002103) [DOI] [Google Scholar]
- 32.Poisot T, Flores C. 2012. BiWeb See http://github.com/tpoisot/BiWeb.
- 33.Barber MJ. 2007. Modularity and community detection in bipartite networks. Phys. Rev. E 76, 066102 ( 10.1103/PhysRevE.76.066102) [DOI] [PubMed] [Google Scholar]
- 34.Liu X, Murata T. 2009. Community detection in large-scale bipartite networks. In Proc. Web Intelligence and Intelligent Agent Technologies 2009 (WI-IAT'09), Milan, Italy, 15–18 September 2009, vol. 1, pp. 50–57. Piscataway, NJ: IEEE.
- 35.Almeida-Neto M, Guimaraes P, Guimarães PR, Loyola RD, Ulrich W. 2008. A consistent metric for nestedness analysis in ecological systems: reconciling concept and measurement. Oikos 117, 1227–1239. ( 10.1111/j.0030-1299.2008.16644.x) [DOI] [Google Scholar]
- 36.Beckett SJ, Williams HTP. 2013. FALCON See http://github.com/sjbeckett/FALCON.
- 37.Edwards RA, Rohwer F. 2005. Viral metagenomics. Nat. Rev. Microbiol. 3, 504–510. ( 10.1038/nrmicro1163) [DOI] [PubMed] [Google Scholar]
- 38.Stewart EJ. 2012. Growing unculturable bacteria. J. Bacteriol. 194, 4151–4160. ( 10.1128/JB.00345-12) [DOI] [PMC free article] [PubMed] [Google Scholar]
- 39.Jover LF, Cortez MH, Weitz JS. 2013. Mechanisms of multi-strain coexistence in host–phage systems with nested infection networks. J. Theor. Biol. 332, 65–77. ( 10.1016/j.jtbi.2013.04.011) [DOI] [PubMed] [Google Scholar]
- 40.Koskella B, Meaden S. 2013. Understanding bacteriophage specificity in natural microbial communities. Viruses 5, 806–823. ( 10.3390/v5030806) [DOI] [PMC free article] [PubMed] [Google Scholar]
- 41.Quigley BJ, López DG, Buckling A, McKane AJ, Brown SP. 2012. The mode of host–parasite interaction shapes coevolutionary dynamics and the fate of host cooperation. Proc. R. Soc. B 279, 3742–3748. ( 10.1098/rspb.2012.0769) [DOI] [PMC free article] [PubMed] [Google Scholar]
- 42.Scanlan PD, Hall AR, Lopez-Pascua LDC, Buckling A. 2011. Genetic basis of infectivity evolution in a bacteriophage. Mol. Ecol. 20, 981–989. ( 10.1111/j.1365-294X.2010.04903.x) [DOI] [PubMed] [Google Scholar]
- 43.Barrangou R, Fremaux C, Deveau H, Richards M, Boyaval P, Moineau S, Romero DA, Horvath P. 2007. CRISPR provides acquired resistance against viruses in prokaryotes. Science 315, 1709–1712. ( 10.1126/science.1138140) [DOI] [PubMed] [Google Scholar]
- 44.Stern A, Sorek R. 2011. The phage–host arms race: shaping the evolution of microbes. Bioessays 33, 43–51. ( 10.1002/bies.201000071) [DOI] [PMC free article] [PubMed] [Google Scholar]
- 45.Weinberger AD, Wolf YI, Lobkovsky AE, Gilmore MS, Koonin EV. 2012. Viral diversity threshold for adaptive immunity in prokaryotes. mBio 3, e00456–12 ( 10.1128/mBio.00456-12) [DOI] [PMC free article] [PubMed] [Google Scholar]
- 46.Seed KD, Lazinski DW, Calderwood SB, Camilli A. 2013. A bacteriophage encodes its own CRISPR/Cas adaptive response to evade host innate immunity. Nature 494, 489–491. ( 10.1038/nature11927) [DOI] [PMC free article] [PubMed] [Google Scholar]


