

Abstract
Lectin affinity chromatography (LAC) can provide a valuable front-end enrichment strategy for the study of N-glycoproteins and has been used to characterize a broad range eukaryotic N-glycoproteomes. Moreover, studies with mammalian systems have suggested that the use of multiple lectins with different affinities can be particularly effective. A multi-lectin approach has also been reported to provide a significant benefit for the analysis of plant N-glycoproteins; however, it has yet to be determined whether certain lectins, or combinations of lectins are optimal for plant N-glycoproteome profiling; or whether specific lectins show preferential association with particular N-glycosylation sites or N-glycan structures. We describe here a comparative study of three mannose-binding lectins, concanavalin A, snowdrop lectin, and lentil lectin, to profile the N-glycoproteome of mature green stage tomato (Solanum lycopersicum) fruit pericarp. Through coupling lectin affinity chromatography with a shotgun proteomics strategy, we identified 448 putative N-glycoproteins, whereas a parallel lectin affinity chromatography plus hydrophilic interaction chromatography analysis revealed 318 putative N-glycosylation sites on 230 N-glycoproteins, of which 100 overlapped with the shotgun analysis, as well as 17 N-glycan structures. The use of multiple lectins substantially increased N-glycoproteome coverage and although there were no discernible differences in the structures of N-glycans, or the charge, isoelectric point (pI) or hydrophobicity of the glycopeptides that differentially bound to each lectin, differences were observed in the amino acid frequency at the −1 and +1 subsites of the N-glycosylation sites. We also demonstrated an alternative and complementary in planta recombinant expression strategy, followed by affinity MS analysis, to identify the putative N-glycan structures of glycoproteins whose abundance is too low to be readily determined by a shotgun approach, and/or combined with deglycosylation for predicted deamidated sites, using a xyloglucan-specific endoglucanase inhibitor protein as an example.
N-glycosylation is one of the most heterogeneous and common post-translational modifications of eukaryotic proteins and one that affects many aspects of protein targeting, enzymatic properties, stability and intermolecular interactions (1–3). There is therefore considerable interest in developing robust and sensitive high throughput analytical pipelines to isolate and structurally characterize N-glycoprotein populations (2, 4–8), allowing glycoprotein identification and analysis of the glycosylation site occupancy and N-glycan structure. To this end, lectin affinity chromatography (LAC)1 is increasingly popular: specifically, various lectins are known to have different binding affinities for N-glycans and so the selective binding of N-glycoproteins in complex protein extracts to these lectins and their subsequent release allows a critical enrichment step before sequencing and glycan analysis by MS (9).
As a refinement of this approach, the use of multiple lectin affinity chromatography (MLAC) in yeast and animal studies (4, 6, 10), using different proteomic platforms, has been shown to increase the numbers of isolated N-glycoproteins or N-glycopeptides. Collectively, these studies of taxonomically diverse eukaryotic N-glycoproteomes suggest a general conservation of the glycosylation site (N-X-S/T, where X can be any amino acid except proline), as well as conserved features of three-dimensional protein structure (4, 6, 10). Although there have been several studies to determine the structural basis of the binding specificity of specific lectins to yeast and animal N-glycoproteins (11), larger scale N-glycoproteomic analyses have typically not attempted to determine whether a particular combination of lectins provides optimal enrichment, or whether specific features, such as N-glycan structure or amino acid sequence at and around the N-glycosylation site, are associated with different lectins. Therefore, systematic comparative studies are essential to determine whether particular lectins can be optimal for specific tissues, organs, and organisms.
LAC has also been used in plant N-glycoprotein analyses to enrich for populations of cell wall localized proteins (8, 12, 13) and a recent report (13) described the application of MLAC to map substantial numbers of N-glycosylation sites in a range of key experimental model organisms, included the plant Arabidopsis thaliana. Using a LTQ-Orbitrap Velos mass spectrometer, the authors identified 2186 unique N-glycosylation sites in proteins extracted from five different arabidopsis organs (13), which represents a substantial increase in the number of identified N-glycosylation sites that have resulted from previous plant N-glycoprotein studies. However, the particular analytical platform that was used did not allow the structural characterization of the N-glycans or N-glycopeptides (13). Indeed, certain features of N-glycopeptides, such as poor fragmentation, heterogeneity and a large dynamic range in most complex mixtures often limits the structural analysis of N-glycans in high throughput systematic analyses (2). It is also important to note that the structures of plant N-glycans differ from those of animals and yeast, as exemplified by the presence of β-1, 2-xylose and α-1, 3-fucose and the complete absence of multiantennary N-glycans and sialic acid in plant N-glycoproteins (1, 14). Therefore, assumptions that are made with regard to the lectin binding of animal and yeast proteins do not necessarily apply to those from plants. Consequently, there is a need to investigate the structural basis of lectin binding to plant N-glycoproteins. Moreover, the limitations of typical shotgun based profiling approaches in identifying and characterizing low abundance N-glycoproteins in complex protein extracts need to be addressed to allow more comprehensive plant N-glycoproteome profiling.
In the present study we address both these issues using mature green stage tomato (Solanum lycopersicum) fruit pericarp as an experimental model to carry out a comparative analysis of N-glycoproteins associated with each of three mannose-binding lectins: concanavalin A (ConA), snowdrop lectin (GNA), and lentil lectin (LCH). Fruit development is associated with substantial cell wall metabolism and the expression of many wall localized N-glycoproteins (8) and tomato in particular represents an excellent model for studies of fleshy fruits and cell wall N-glycoproteins (15). We established an MLAC analytical pipeline that included shotgun proteomic profiling and deglycosylation and deamidation analysis, to allow the determination of N-glycoprotein protein identity, N-glycosylation site and N-glycan structures. This information was then used to establish whether a combination of lectins is indeed advantageous for the study of plant N-glycoproteomes, and to assess whether any of these structural characteristics result in predictable preferential binding to specific lectins. From these studies it became evident that large dynamic range of N-glycoprotein abundance was a significant limiting factor in the structural determination of the tomato, and that there was a bias toward the detection of highly abundant N-glycopeptides. We therefore evaluated the use of an in planta recombinant expression strategy, combined with affinity purification MS (AP-MS), as a means to characterize the N-glycan structures of glycoproteins whose abundance is too low to be readily determined via the primary shotgun pipeline, using a tomato xyloglucan-specific endoglucanase inhibitor protein (XEGIP) as a test case.
EXPERIMENTAL PROCEDURES
Plant Materials
Tomato (cultivar M82) plants were grown in a greenhouse in Ithaca, New York (16-h of light and 8-h of dark cycle). Fruits were harvested at the mature green (MG) stage when fruits reached full size, but were still green, with no visible signs of ripening. Fruit pericarp tissue from three MG tomato fruits from three different plants was pooled and flash frozen in liquid nitrogen.
Protein Extraction
Protein extraction was carried out as previously described (8) with minor modifications. Briefly, 15 g (fresh weight) of frozen pericarp tissue was powdered in liquid nitrogen with a pestle and mortar and then homogenized further with a Powergen hand homogenizer (Fisher Scientific, Ottawa, Canada) for 15 s in three volumes of extraction buffer (25 mm Tris, pH 7.0, 0.2 m CaCl2, 0.5 m NaCl, polyvinylpolypyrrolidone (1 g/10 g fresh weight) and 20 μl/g fresh weight of protease inhibitor mixture (Sigma-Aldrich, St. Louis, MO). The resulting suspension was shaken for 2 h at 4 °C, centrifuged at 16,000 × g at 4 °C for 30 min and the supernatant collected for subsequent enrichment of N-glycoproteins by lectin affinity chromatography. Protein concentration was determined using the BCATM Assay Kit (Pierce; Rockford IL) with BSA as a standard.
Multi Lectin Affinity Chromatography
Three different mannose-binding lectins were used for N-glycoprotein enrichment: concanavalin A (ConA), Galanthus nivalis agglutinin (GNA) and Lens culinaris agglutinin (LCH). Five milliliter cartridges of resin covalently bound to one of each of the three lectins (Qiagen, Hilden, Germany) were pre-equilibrated with binding buffer (20 mm Tris-HCl pH 7.0, 0.5 m NaCl, 1 mm CaCl2, 1 mm MnCl2, and 1 mm MgCl2), at a flow rate of 0.08 ml/min, and the column washed with ten column volumes of binding buffer. The supernatants from the crude protein extracts described above were loaded onto each of the columns with a peristaltic pump, unbound proteins washed off the column with ten column volumes of binding buffer, or until the absorbance at 280 nm returned to the baseline value. The bound proteins were eluted using an AKTA Explorer liquid chromatography system (GE Healthcare, Piscataway, NJ) with five column volumes of elution buffer (same composition as the binding buffer but additionally, 0.5 m with respect to α-methyl-d-mannopyranoside (Calbiochem, La Jolla, CA)) at a flow rate of 0.75 ml/min, monitoring the absorbance of the eluent at 280 nm. The protein-containing fraction was concentrated and the eluting buffer was exchanged for 100 mm ammonium bicarbonate, using a 5 kDa cutoff centrifugal concentrator (Amicon Ultra-15, Millipore, Billerica, MA) and then lyophilized. The lyophilized samples were then dissolved in a minimal volume of 8 m urea in 100 mm ammonium bicarbonate. To visualize the protein composition of the crude extract, as well as the enriched fractions, aliquots (10 μg protein) were mixed with 5× Laemmli buffer, fractionated on 12% Tris-glycine SDS-PAGE gels (TGXTM gels, Bio-Rad; Hercules, CA) and stained with SYPRO ruby (Invitrogen, Grand Island, NY).
Trypsin Digestion
Trypsin digestions were carried out as previously described (8, 12) with slight modifications. Briefly, the samples dissolved in 8 m urea in 100 mm ammonium bicarbonate (100 μg protein) were reduced with 10 mm DTT for 1 h and alkylated with 25 mm iodoacetamide in the dark for 30 min, both steps at room temperature, and diluted to a final concentration of 1 m urea with 100 mm ammonium bicarbonate. Proteins were digested with trypsin (Trypsin Gold, Mass Spectrometry Grade, Promega, Madison, WI) at a 1:20 w/w trypsin: protein ratio for 16 h at 37 °C.
N-glycopeptides Enrichment
For enrichment of N-glycopeptides, the pool of tryptic peptides were manually passed through a porous graphite carbon (PGC) cartridge (Thermo Scientific, Bellefonte, PA, USA) with a syringe. The PGC cartridge was prepared by sequentially passing through 1 ml 1 m NaOH, 2 ml water, 1 ml 30% acetic acid, 2 ml water, 1 ml elution solvent (50% acetonitrile, 0.1% formic acid [v/v] in water), and 1 ml wash solvent (5% acetonitrile, 0.1% formic acid [v/v] in water). The pH of the trypsinized samples was adjusted to 5.0 with 0.1% trifluoroacetic acid (TFA) and loaded onto the PGC cartridge. Subsequently, 1 ml wash solvent was passed through the column and the flow through containing the nonglycosylated peptides was recovered and desalted with a C18 solid phase extraction cartridge (Waters, Milford, MA). The bound N-glycopeptides were eluted with 1 ml elution solvent. The flow through and bound fractions were dried using a SpeedVac (Thermo Savant, Holbrook, NY) for shotgun analysis or N-glycosylation analysis in the case of the bound fraction.
Peptide Fractionation for Shotgun Proteomics
PGC flow through and bound fractions were additionally fractionated using high pH reverse phase (hpRP) chromatography using an Akta Explorer FPLC equipped with a Frac 950 fraction collector and UV detector (GE Healthcare). Tryptic peptides were reconstituted in buffer A (20 mm ammonium formate, pH 9.5 in water), and loaded onto a Resource RPC 3 ml column (GE Healthcare) with 20 mm ammonium formate, pH 9.5 as buffer A and 80% acetonitrile (ACN)/20 mm ammonium formate as buffer B. The LC was performed using a gradient from 10–45% of buffer B in 30 min, at a flow rate of 200 μl/min. Twenty-four fractions were collected from each sample (PGC flow through and bound fractions), of which five were pooled based on the UV absorbance at 214 nm, then dried for subsequent nanoLC-MS/MS analysis.
Enrichment of Glycopeptides by HILIC and Deglycosylation
The tryptic peptides of glycoproteins (i.e. the PGC bound fraction) were subjected to hydrophilic interaction chromatography (HILIC) to partition glycopeptides and nonglycopeptides. HILIC was carried out using a Dionex UltiMate 3000 high performance LC system with a built-in microfraction collection option in its autosampler and UV detection (Thermo-Dionex, Sunnyvale, CA). The tryptic peptides were reconstituted in 80% ACN containing 0.25% trifluoroacetic acid for ion pair normal phase separation (16) and loaded onto a Polyhydroxyethyl ATM column (5 μm, 2.1 × 200 mm, 200 Å, PolyLC, MD) with 10% ACN as eluent A and 90% ACN as eluent B. The LC was performed using a gradient from 90 to 40% eluent B in 30 min at a flow rate of 200 μl/min. Forty four fractions were collected at 1 min intervals, pooled into 31 fractions, dried and reconstituted in 100 μl of 0.5% formic acid for screening glycopeptides-containing fractions by nanoLC-MS/MS on a 4000 Qtrap operating in the precursor ion (PI) scan-triggered, information dependent analysis (IDA) mode. A quarter (25 μl) of the reconstituted fractions containing glycopeptides was further treated with 50 mU of PNGase A at 37 °C for 16 h in 100 mm sodium citrate/sodium phosphate monobasic pH 5.0. The PNGase A treated samples were passed through Omix C18 tips, and reconstituted in 25 μl of 0.2% FA before high resolution MS and MS/MS analysis in LTQ Orbitrap Velos.
NanoLC-MS/MS Analyses
High pH RPLC fractions on PGC bound samples and the 5 pooled HILIC fractions treated with PNGase A were analyzed by nanoLC-MS/MS analysis using a LTQ-Orbitrap Velos (Thermo-Fisher Scientific, San Jose, CA) mass spectrometer equipped with a “CorConneX” nano ion source (CorSolutions LLC, Ithaca, NY). The Orbitrap was interfaced with an UltiMate 3000 RSLC system (Dionex, Sunnyvale, CA). Each reconstituted fraction (5 μl) was injected onto a PepMap C18 trap column (5 μm, 300 μm × 5 mm, Dionex) at 20 μl/min flow rate for loading, and then separated on a PepMap C-18 RP nano column (3 μm, 75 μm × 15 cm), utilizing a 60 min gradient from 5% to 40% ACN in 0.1% formic acid at 300 nl/min. The eluted peptides were detected by the Orbitrap through the nano ion source containing a 10-μm analyte emitter (NewObjective, Woburn, MA). The Orbitrap Velos was operated in positive ion mode with nanospray voltage set at 1.5 kV and source temperature at 275 °C. The calibrants were either the background polysiloxane ion signal at m/z 445.120025 as an internal calibrant, or the Ultramark 1621 external calibrant for the Fourier Transform (FT) mass analyzer. The instrument was operated in parallel data-dependent acquisition (DDA) mode using the FT mass analyzer for one survey MS scan at a resolution of 60,000 (fwhm at m/z 400) for the mass range of m/z 375–1800 for precursor ions, followed by MS/MS scans of the top 7 most intense peaks with multiple charged ions above a threshold ion count of 7500 in both LTQ mass analyzer and HCD-based FT mass analyzer at 7500 resolution. Dynamic exclusion parameters were set at repeat count 1 with a 25 s repeat duration, exclusion list size of 500, 45 s exclusion duration, and ±10 ppm exclusion mass width. Collision induced dissociation (CID) parameters were set at the following values: isolation width 2.0 m/z, normalized collision energy 35%, activation Q at 0.25, and activation time 10 ms. The activation time is 0.1 ms for HCD analysis. All data were acquired with Xcalibur 2.1 software (Thermo-Fisher Scientific).
The nanoLC-MS/MS analysis for characterization of glycosylation sites was performed on an UltiMate3000 nanoLC system (Dionex, Sunnyvale, CA) coupled with a hybrid triple quadrupole linear ion trap mass spectrometer, the 4000 Q Trap (AB SCIEX, Framingham, MA). The tryptic peptides in each HILIC fraction (5 μl) were injected with an autosampler onto a PepMap C18 trap column (5 μm, 300 μm × 5 mm, Dionex) with 0.1% FA at 20 μl/min for 1 min, then separated on a PepMap C18 RP nano column (3 μm, 75 μm × 15 cm, Dionex) using a 60-min gradient of 10% to 35% ACN in 0.1% FA at 300 nl/min, followed by a 3-min ramp to 95% ACN-0.1% formic acid and a 5-min hold at 95% ACN-0.1% FA. MS data acquisition was performed using Analyst 1.4.2 software (AB Sciex, Foster City, CA) for PI scan-triggered IDA analysis. The precursor ion scan of the oxonium ion (HexNAc+ at m/z 204.08) was monitored using a step size of 0.2 Da across a mass range of m/z 500–1600 and the parameters were set as reported previously (18). For IDA analysis, each precursor ion scan was followed by one enhanced resolution scan and the two highest intensity ions with multiple charge states were selected for MS/MS using rolling collision energy that was set based on the charge state and m/z value of each ion.
Data Analysis and Interpretation
All of the DDA raw data from the Orbitrap were converted into MGF files using Proteome Discoverer 1.3 (PD1.3, Thermo). The subsequent searches were carried out using Mascot Daemon (version 2.3, Matrix Science, Boston, MA) with the following search parameters: semitryptic protease specificity, one missed cleavage allowed, 20 ppm precursor mass tolerance, 0.8 Da for CID and 0.05 Da for HCD fragment ion mass tolerance with a fixed modification of cysteine carbamidomethylation, and variable modifications of methionine oxidation and asparagine and glutamine deamidation. Mass spectra were used to search a translated custom unigene database (ftp://ted.bti.cornell.edu/pub/tomato_454_unigene) derived from tomato RNA-Seq data generated with 454 reads (454 pyrosequencing; GS FLX, Roche, Indianapolis, IN) from different tomato tissues (fruit, leaves, pollen, styles). The RNA-Seq database combined with the SGN expressed sequence tag (EST) collection (http://solgenomics.net/bulk/input.pl?mode = ftp) are described in detail in Lopez-Casado et al., (19). Spectral data were also searched against a version of the tomato database described above in which the sequences were reversed, and the resulting matches used to estimate false-positive rates. Only peptides that matched with a MASCOT score above the 95% confidence interval threshold (p < 0.05, MASCOT score ≥ 44) were considered for protein identification. In cases where the protein was identified by a single peptide match, the threshold was set at a 99% confidence interval (MASCOT score ≥51). These MASCOT scores resulted in a false-positive identification rate of 4.56% at the peptide level. Only proteins containing at least one unique peptide (a sequence that had not been previously assigned to a different protein) were considered. The N to D deamidation found in the N-X-S/T motif, where X is any amino acid except proline, was required for identification of N-glycosylation sites. For those identified sites from initial database search, the raw MS/MS spectra were manually inspected and identifications of the peptide with deamidation were confirmed. For peptides containing multiple N-X-S/T motifs, the sites of modification were also manually inspected and validated based on MS/MS fragment ions.
Determination of XEGIP N-glycan Structures and Endogenous Glycopeptides
The full-length open reading frame of XEGIP (Genbank accession AAN87262) was amplified by PCR using primers containing att recombination sites (forward, 5′-ggggacaagtttgtacaaaaaagcaggcttcatggcttcttctaattgtttacatgc-3′ and reverse, 5′-ggggaccactttgtacaagaaagctgggtcatcaattgaagtgaaattaaaattgtca-3′), iProofTM high-fidelity DNA polymerase (Bio-Rad) and a ripe stage tomato fruit cDNA library as template, generated in the HybriZAP-2.1 vector system (Stratagene, La Jolla, CA). The PCR products were gel purified and then cloned into the pDONR221 vector by overnight incubation in the presence of Gateway BP clonase (Invitrogen) at 25 °C, according to the manufacturer's instructions. The positive entry clones were then introduced into pYL436 destination vector, thereby forming an in-frame C-terminal fusion with a TAP tag (20). Transient expression of the recombinant protein in Nicotiana benthamiana leaves with A. tumefaciens was performed as described previously (21) except that strain GV2260 was used. After a 72 h incubation under constant illumination at 25 °C, 30 g of infiltrated N. benthamiana leaves were collected, powdered in liquid nitrogen using a pestle and mortar, suspended in three volumes of extraction buffer (50 mm Tris-HCl pH 7.5, 150 mm NaCl, 10% glycerol, 0.1% Triton X-100, 1 mm PMSF, and 20 μl protease inhibitor mixture [Bio-Rad] per 1 g of fresh tissue;), and homogenized for 30 s using a Powered homogenizer (Fisher Scientis, Ottawa, Canada) (8). The resulting suspension was filtered through four layers of Miracloth (Calbiochem, La Jolla, CA) and centrifuged at 15,000 × g for 30 min at 4 °C. The supernatant was incubated with 500 μl of IgG beads (GE Healthcare) that had previously been washed with extraction buffer, for 2 h at 4 °C with gentle rotation. After centrifugation at 1500 × g for 3 min at 4 °C, the IgG beads were recovered and washed three times with 10 ml of washing buffer (50 mm Tris-HCl pH 7.5, 150 mm NaCl, 10% glycerol, 0.1% Triton X-100). The recombinant XEGIP was eluted from the beads with acidic buffer (glycine-HCl pH 3.0, 0.1% Triton X-100, and 150 mm NaCl).
The purified recombinant XEGIP was fractionated on 12% Tris-glycine SDS-PAGE gels (TGXTM gels, Bio-Rad) and stained with Coomassie brilliant blue R-250 (Calbiochem, Darmstadt, Germany). The XEGIP protein band was excised from the gel and digested with trypsin, as described above. The resulting in-gel extracted tryptic peptides were subjected to PI scan-triggered IDA analysis in 4000 Q Trap as described above.
Bioinformatic Analysis
All identified proteins were first screened for the predicted presence of an N-terminal endoplasmic reticulum (ER) targeting signal peptide (SP), using the Signal P 4.1 program (20), because it is required for the cotranslational translocation of the N-glycoproteins into the ER, where the N-glycans are first added (23). Those with a predicted SP were analyzed for the presence of predicted N-glycosylation sites using the NetGlyc 1.0 server (http://www.cbs.dtu.dk/services/NetNGlyc/). N-glycoproteins were grouped into families using the Pfam data base (24) and functionally classified according to Jamet at al., (25). PSORT (26) and Target P (27) were used to determine the predicted subcellular locations of the identified proteins, and the TMHMM Server v. 2.0 (28) and SOSUI (29) were used to predict transmembrane domains. WebLogo 3 (30) was used to create relative frequency plots of the N-glycosylation sequon (N-X-S/T) in the identified N-glycopeptides.
RESULTS
Workflow and Experimental Design
The main objective of this study was to determine whether the use of multiple lectins can substantially increase plant N-glycoproteome coverage and whether there is any bias to the structures of N-glycans or different biochemical properties of glycoproteins that differentially bind to each lectin. We established an analytical workflow (Fig. 1) to compare the efficacy of 3 mannose-binding lectins (ConA, GNA and LCH) as a means to identify glycoproteins from mature green (MG) stage tomato fruit pericarp. The workflow started with ∼300 μg of N-glycoproteins being isolated using each lectin from 15 g (fresh weight) of mature green (MG) stage tomato fruit pericarp. After tryptic digestion of enriched glycoproteins, the PGC-based fractionation was applied for separation of the nonglycopeptide pool (flow through fraction) from the glycopeptide pool (bound fraction). Aliquots of both fractions were further fractionated using high pH reverse phase (hpRP) chromatography, followed by nanoLC-MS/MS analysis for glycoprotein identification, which served as the protein database for the in silico enzymatic digest that facilitated the identification of glycosylation sites (as described below).
Fig. 1.
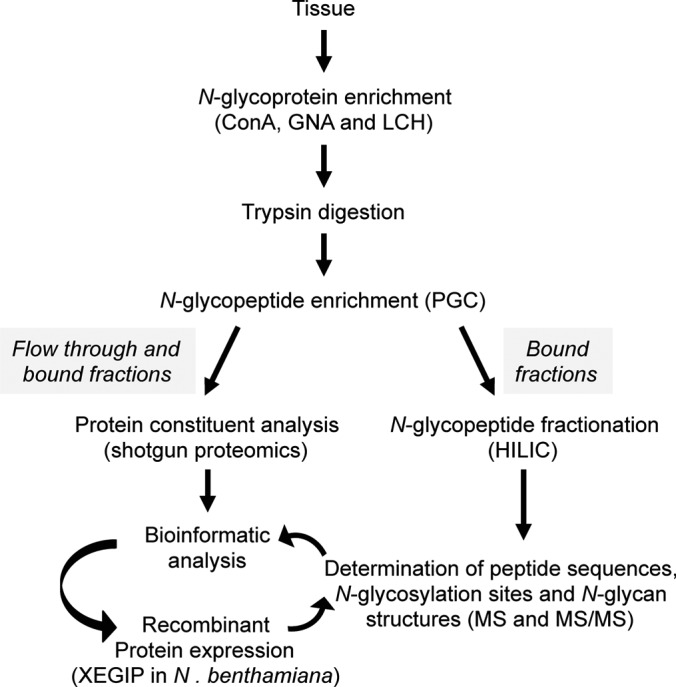
Experimental workflow used in this study. N-glycoproteins from tomato fruit pericarp were bound to three different mannose-binding lectins (Concanavalin A, ConA; Snowdrop lectin, GNA; and Lentil lectin, LCH). After trypsin digestion N-glycopeptides were fractionated using graphitic carbon (PGC) chromatography. Peptides bound to the PGC column, or present in the flow through, were analyzed by shotgun ESI-MS sequencing. Peptides bound to PGC were further fractionated by hydrophilic interaction chromatography (HILIC). Five main fractions were collected and divided into two aliquots for subsequent identification of N-glycosylation sites and analysis of intact N-glycopeptides. After bioinformatics analysis, a low abundant glycoprotein (XEGIP) was selected for recombinant expression in planta followed by purification and MS analysis to determine the N-glycan structures.
In a parallel analysis, PGC bound fractions were further fractionated using ion-pairing HILIC for glycopeptide enrichment [14]. We then incorporated PI scan-driven IDA to selectively identify and structurally characterize the glycopeptides, glycosylation sites, and glycoforms with the assistance of the in silico tool for all HILIC fractions. The identified glycopeptides and occupancy of each glycosylation site were determined after treatment of five pooled HILIC fractions with PNGase A and subsequent MS/MS analysis on a high resolution instrument capable of distinguishing between peptides incorporating an Asp (glycoform) or an Asn (native amide) (31). In addition, comparative bioinformatic analysis was performed for the data acquired from the shotgun proteomic and direct glycosylation analysis approaches on three different lectins samples. Finally, we used the AP-MS approach to successfully characterize a low abundance glycoprotein (XEGIP), for which a glycopeptide was not identified by our precursor ion scan analysis, but rather only nonglycosylated peptides via the shotgun approach.
Multiple Lectin Affinity Chromatography and Shotgun Proteomics
Samples of each of the three lectin binding N-glycoprotein extracts were also fractionated by SDS-PAGE and visualized by SYPRO ruby staining (Fig. 2A) before trypsin digestion. Although the composition of the total applied protein and flow through samples for the three lectins were not readily distinguishable by this analysis (Fig. 2A, where the ConA flow through is shown), substantial differences were seen in the banding patterns associated with glycoproteins that bound to each lectin, indicating diversity in the binding affinities among the three lectins.
Fig. 2.
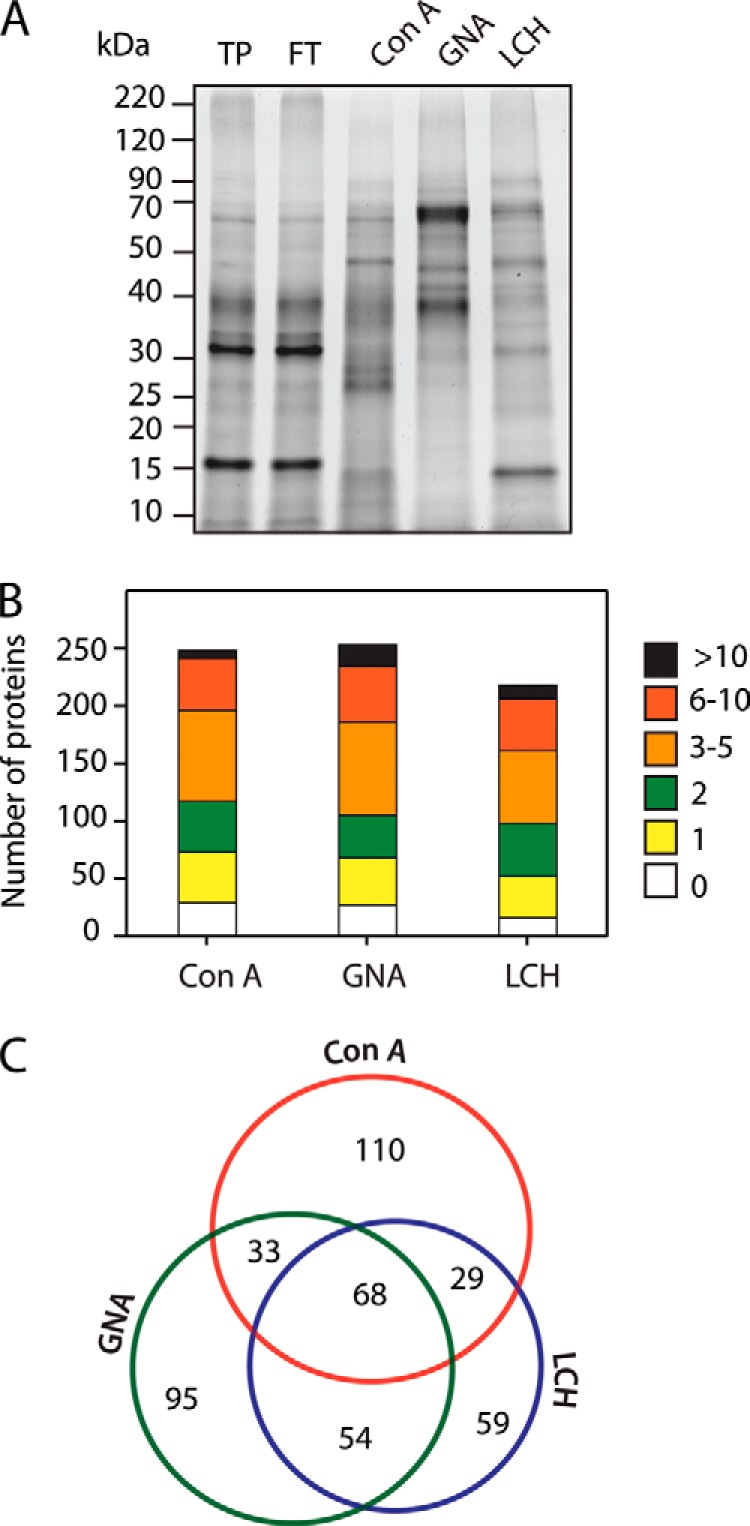
Lectin affinity enrichment and identification of N-glycoproteins from tomato fruit pericarp. A, SYPRO ruby stained SDS-PAGE gel of proteins bound to each lectin (ConA, GNA, and LCH). B, identification of glycoproteins using a shotgun MS/MS approach. The numbers of predicted N-glycosylation sites in each of the lectin binding glycoprotein fractions are indicated. C, Venn diagram of the glycoproteins identified through shotgun sequencing associated with each of the three lectins.
After the enrichment of N-glycoproteins by MLAC and trypsin digestion, the next step in our workflow was the enrichment of N-glycopeptides by PGC chromatography (Fig. 1). In addition, we analyzed both unbound and bound peptide fractions by shotgun MS/MS to obtain a broad overview of the respective protein populations. Most of the peptides were identified in the bound fraction (peptides attached to PGC) and only 7% in the flow through fractions (unbound peptide), except in the case of the ConA fractions where 38% were identified in the unbound fraction (supplemental Fig. S1). To match the mass spectra with corresponding gene sequences and identify the proteins, we used two tomato databases: one derived from RNA-seq data to give a large unigene set and the Sol Genomics Network database (http://solgenomics.net), as described under “Experimental Procedures”. Only proteins with a predicted N-terminal ER targeting signal peptide (SP; determined using Signal P 4.1, www.cbs.dtu.dk/services/SignalP) were considered further in this study because an SP is required for the cotranslational translocation of nascent proteins into the ER before N-glycosylation (23). MS/MS analysis using an LTQ-Orbitrap Velos resulted in the identification of 448 putative N-glycoproteins with 240, 251, and 210 putative N-glycoproteins in ConA, GNA, and LCH fractions, respectively (Fig. 2B, 2C, supplemental Table S1). The number of predicted N-glycosylation sites showed no apparent correlation with the lectin used (Fig. 2B) and in all three cases most of the proteins were predicted to have 3–10 N-glycosylation sites, whereas only 12%, 10%, and 8% in the ConA, GNA and LCH fractions, respectively, had no such sites. An apparent complementary nature of the three lectins in the N-glycoproteome analysis is suggested by the observation that only 15% (32) of the proteins were identified in all three lectin binding fractions (Fig. 2C), whereas 25% (ConA), 21% (GNA), and 13% (LCH), were specifically associated with one lectin. Of the identified proteins without a predicted SP, and which therefore likely correspond to nonglycosylated “contaminants,” a large proportion were associated with all or multiple lectins and only 14 (5%), 17 (6%), and 4 (2%) were associated with ConA, GNA, and LCH fractions, respectively (supplemental Fig. S2). Cytoplasmic proteins, such as the ribosomal proteins, proteasome subunits and heat shock proteins that were commonly detected in the shotgun analysis did not show specific affinity to a particular lectin (supplemental Fig. S2, supplemental Table S6).
It should be noted that the protein ID lists from above shotgun analysis were used to generate a small target database (instead of the entire tomato database) facilitating the prediction of the masses of all core peptides containing the N-linked motif through our in-house developed script. Thus the script served as an in silico bioinformatic tool to significantly reduced the number of downstream candidate peptides for discovery screening.
Deamidation Mapping of N-glycosylation Sites in Tomato Fruit Glycoproteins
In addition to identifying glycoproteins through the shotgun approach, a deamidation analysis was performed to identify the glycosylation sites on the associated glycopeptides. This involved treating the samples with PNGase A, which cleaves N-glycans with α-1,3-fucose (Fuc) at the 3-position of the innermost GlcNAc, as is common in plant N-glycans (33, 34). This deglycosylation induces a mass change at the glycosylation site by converting Asn to Asp, which results in a mass shift of 0.9840 Da that can be readily identified by LC-MS/MS analysis (31). However, because spontaneous nonenzymatic deamidation can occur (31, 35), we considered only those cases that also had canonical N-glycosylation N-X-S/T sequons.
In total, 318 putative N-glycosylation sites were identified, corresponding to 230 N-glycoproteins with both predicted N-glycosylation sites and a predicted SP (Fig. 3A, supplemental Table S2). Specifically, we identified 131 N-glycosylation sites in glycopeptides corresponding to 107 N-glycoproteins enriched with ConA, 184 sites corresponding to 134 N-glycoproteins with GNA, and 212 N-glycosylation sites corresponding to 158 N-glycoproteins with LCH (Fig. 3A, supplemental Table S2). Each lectin was associated with a substantial number of glycopeptides that were lectin specific (ConA, 14%; GNA, 16%; LCH, 26%) and only 20% of the glycopeptides were identified with all three lectins (Fig. 3A), further suggesting the value of lectin multiplexing to increase glycoproteome coverage. A comparison of the mean grand average of hydropathicity (GRAVY) index score, isoelectric point (pI), and molecular weight (Mw) of the N-glycopeptides enriched with ConA, GNA, and LCH, showed a similar distribution (Fig. 3B, supplemental Table S3) and a Wilcoxon/Kruskal-Wallis rank sums test indicated no statistically significant correlation between these particular characteristics and the lectin used. Most of the glycopeptides had a low average GRAVY score, consistent with expectations for solvent exposure, and the relatively high proportion of N-glycosylation sites in loop and turn regions on the protein surfaces (4, 13).
Fig. 3.

Evaluation of glycopeptides associated with each of the three lectins used in the study based on deamination analysis. A, Venn diagram showing the number of N-glycopeptides. B, distribution of the average GRAVY score, pI (isoelectric point) and Mw (Molecular weight) of the N-glycopeptides. C, relative frequency plots of the N-glycosylation sequon (N-X-S/T) in the entire population of N-glycopeptides indicated by the deamination analysis. D, relative frequency plots of the N-glycosylation sequon (N-X-S/T) indicating the subsets of N-glycopeptides that were uniquely detected in each of the three lectins.
To determine whether the amino acid sequences of the glycosylation sites influenced the specificity of lectin binding, we compared the position-specific amino acid frequencies of the sequence surrounding the glycosylated Asn in the sequon N-X-S/T, considering six amino acids either side (Fig. 3C and 3D). In all cases, threonine (T) occurred more frequently (1.2-fold) than serine (S) at the second position, consistent with N-glycosylation sites mapped in a taxonomically broad range of eukaryotes (4, 6, 10, 13). Proline (P) was absent in the +2 subsite and rare in the +3 position (0.05%) whereas leucine (L) and glycine (G) were over represented in the +2 subsite. When considering all the N-glycopeptides associated with each lectin, no clear lectin related differences were apparent (Fig. 3C). However, when analysis was performed of those peptides that were unique to each lectin, then some differences were observed. For example, L and then isoleucine (I) and alanine (A) were the most common amino acids at the −1 subsite when considering all glycosites for all three lectins (Fig. 3C), and also for ConA specific glycosites (Fig. 3D), but were not among the most common 4 amino acids with GNA-specific glycopeptides. Differences were similarly seen at the +1 subsite, where GNA- and LCH-specific peptides showed a different frequency of the most common amino acids.
Identification of N-linked Glycosylation Sites and Glycoforms
To assess whether differences in N-glycan structures might explain the binding of distinct populations of glycopeptides to each of the three lectins, we analyzed each HILIC fraction by precursor ion (PI) scan-driven information dependent analysis (IDA) to selectively detect glycan-containing peptide ions containing the characteristic oxonium ion of N-acetylhexosamine (HexNAc) at m/z 204.1. This allowed us to determine glycan composition and structural information, peptide sequence and the glycosylation site. To determine the glycosylation site and glycan compositions, we used the detection of a distinct Y1 ion (with the innermost GlcNAc residue attached to the peptide), which is often one of the most abundant Y type product ions observed in the glycopeptide fragmentation (36–38) and other high m/z Y-type fragment ions, allowing us to readily determine the charge state of the Y1 ion acquired even with the relatively low resolution Q Trap instrument. As a result, we were able to determine the m/z of the predominant Y1 ion along with its charged states, and therefore the mass of the core peptide. The observed peptide mass was then screened against the predicted masses of all peptides containing the N-linked glycosylation consensus motif from the previously identified glycoprotein list using our in silico script. The specifically matched candidate peptide sequence and its predicted y or b ion series were then compared with the existing MS/MS spectrum for confirmation of the correct assignment of peptide sequence and glycosylation site. Finally, once a peptide sequence was assigned and confirmed, the mass of the glycan was determined. The initial glycan composition was assessed using the web-based GlycoMod Tool software (39) and the glycan sequence was then determined by manual analysis of the remaining MS/MS fragment ions. This resulted in the structural characterization of 17 N-glycopeptides from 16 distinct glycoproteins in a single HILIC fraction that had a retention time of 20 min. Most of the identified glycopeptides had a single glycan structure attached, although four had two glycoforms and one had three. Importantly, we observed no particular pattern of glycan size, number or size of side chains, or other aspects of glycan composition that correlated specifically with a particular lectin. The identification of the glycopeptides with their protein accession numbers, glycan sequences for each of the glycosylation sites and variable glycoforms are shown in Table I and supplemental Data S1. As expected, an overwhelming majority of identified glycopeptides had a typical complex type N-glycan comprising a pentose (β 1–2 xylose) and/or deoxyhexose (α-1,3-fucose) linked to the core Man3GlcNAc2. Fig. 4 shows an example of an MS/MS spectrum for the triple-charged precursor (m/z 766.753+), which was identified as the Xyl1Man3GlcNAc2Fuc1 glycoform at the Asn residue of the tryptic peptide FSDKNFTLR, derived from the glycoprotein suberization-associated anionic peroxidase 1 (unigene, TU052308; NCBI accession number, P1500). This MS/MS spectrum provides direct evidence for the complex type N-linked glycosylation on the FSDKNFTLR peptide.
Table I. N-glycan structures and the associated glycopeptides identified with different lectins.
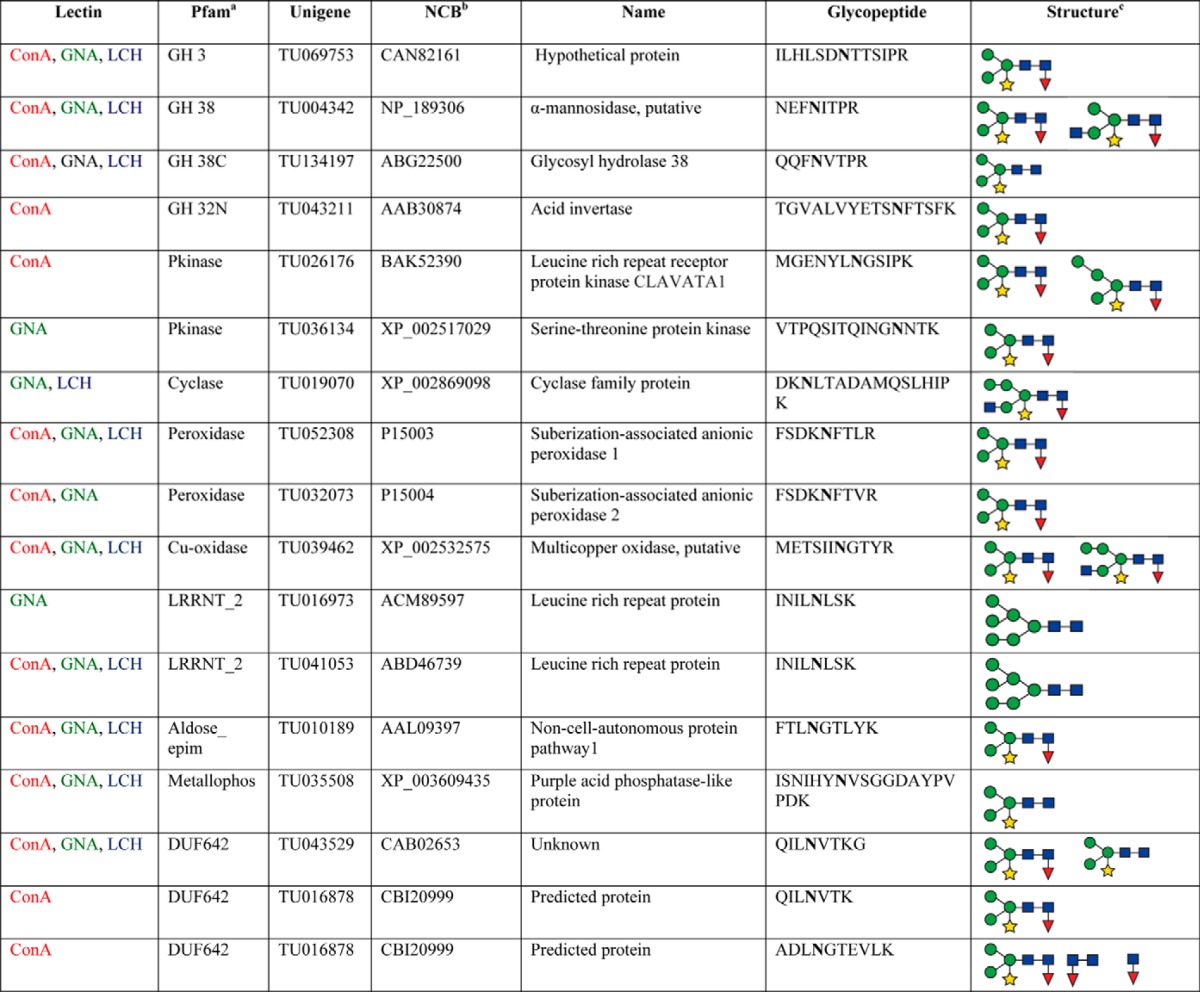
a Protein family (http://pfam.sanger.ac.uk).
b NCBI accession numbers of the proteins identified during the manual interpretation of the N-glycopeptides.
c Glycan structures were determined by manual interpretation of MS/MS spectra as outlined in material and methods.
Fig. 4.

MS/MS spectrum of an m/z 766. 753+ ion identifying the glycopeptide (FSDKNFTLR) from the tomato suberization-associated anionic peroxidase 1 (unigene, TU052308; NCBI accession number, P15003) by the selective PI scan triggered IDA approach. The spectrum revealed a typical “complex type” N-glycan representing a pentose (β 1–2 xylose) and/or deoxyhexose (α 1–3 fucose) linked to the core Man3GlcNAc2 structure.
Characterization of XEGIP N-glycan Structures and Endogenous Glycopeptides
In the PI-IDA analysis, we found many MS/MS spectra for glycopeptides (containing all marker ions of typical glycan), but only ∼10% could be assigned to a peptide sequence and so the number of N-glycopeptides identified was relatively small. This reflects the labile nature of the glycan-peptide linkage and the fragile internal glycan bonds during CID, compared with peptide bonds, which often results in little or ambiguous information concerning peptide sequence. This problem is exacerbated by the low ionization efficiency, large mass, structural complexity and low abundance of N-glycopeptides (40, 41). A potential orthogonal, albeit low throughput, approach to confirm the glycosylation of candidate plant N-glycoproteins, as suggested by Buren et al. (42) is to structurally characterize purified recombinant forms that have been overexpressed in plant hosts. To determine the validity and potential of this approach, we selected a putative N-glycoprotein that we identified through both the deglycosylation/deamidation study (supplemental Table S2) and the shotgun glycoprotein analysis (supplemental Table S1), but whose N-glycopeptide(s) and glycan compositions were not identified in the PI-IDA analysis (Table I). Specifically, we targeted the putative N-glycoprotein xyloglucan-specific endoglucanase inhibitor protein (XEGIP, AAN87262), a tomato protein that has been shown to inhibit the activity of a xyloglucan-specific endoglucanase (XEG) from Aspergillus aculeatus (43). Recombinant XEGIP was transiently expressed in Nicotiana benthamiana leaves as a fusion protein with a C-terminal TAP (tandem affinity purification) tag to facilitate purification. XEGIP has a predicted SP that is putatively cleaved between the residues 23 and 24 and has five predicted N-glycosylation sites (Fig. 5). MS analysis confirmed that the SP is indeed cleaved at the predicted site, as well as the presence of high mannose type N-glycans at four of the five predicted N-glycosylation sites (Table II, supplemental Data S2, supplemental Fig. S4). Considerable heterogeneity in glycan structures at each site was observed, with six glycoforms of ELAN322VTR and VVPIN279TTLLSIDNQGVGGTK, five glycoforms of QTTCANFN423FTSID and four glycoforms of QN25QTSFRPK. We could not determine the presence of an N-glycan at N115TT, presumably because the size of the tryptic peptide that contains this glycosite is too large (60 amino acid residues; supplemental Fig. S3).
Fig. 5.
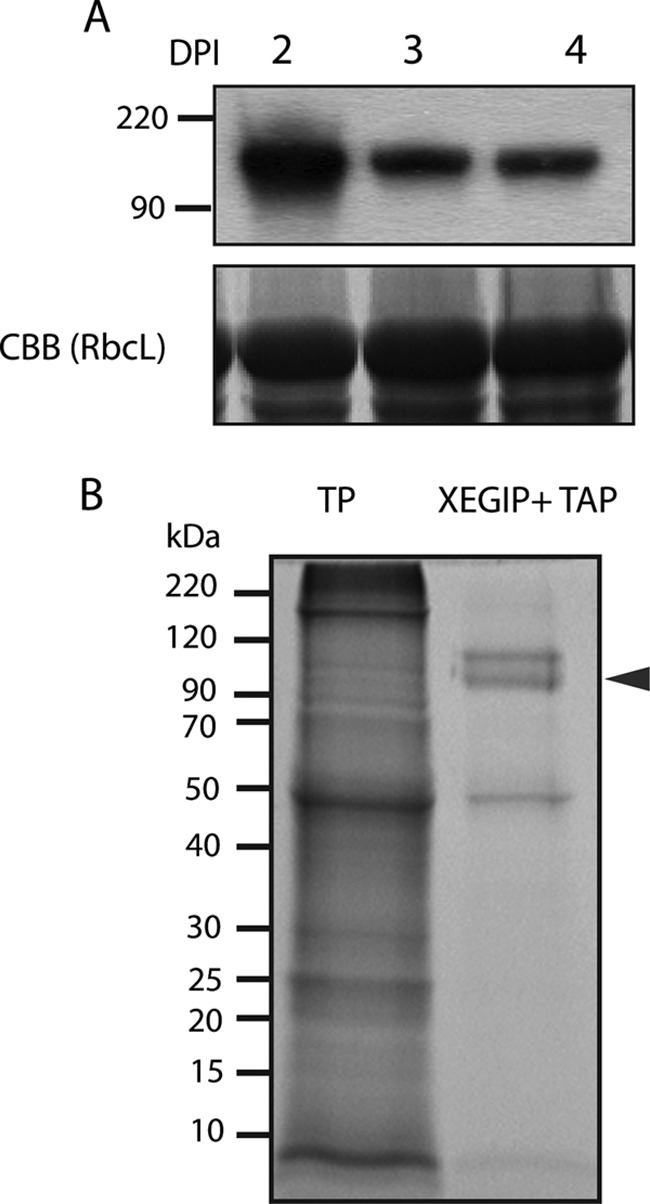
Transient expression and purification of recombinant xyloglucan-specific fungal endoglucanase inhibitor protein (XEGIP). A, Western blot analysis (upper panel) using an anti-myc antiserum of proteins extracted from N. benthamiana leaves transiently expressing recombinant XEGIP fused to a Myc tag. Protein samples were extracted 2, 3, and 4 days post infiltration (DPI). Lower panel shows an image of the RuBisCO large subunit (RbcL) protein in an SDS-PAGE gel stained with Coomassie brilliant blue (CBB), used as a loading control. B, SDS-PAGE gel (stained with CBB) of total protein (TP) from N. benthamiana leaves and a sample of the recombinant XEGIP+TAP after acidic elution from IgG beads, appearing as a double band (arrow).
Table II. N-glycans identified in the recombinant xyloglucan-specific endoglucanase inhibitor protein (XEGIP).
| Peptide sequence | Glycan composition | Mass of glycan | RT (min) | m/z | z | M+H | Peptide+H |
|---|---|---|---|---|---|---|---|
| ELANVTR | (Hex)4(HexNAc)2 | 1054.36 | 10.97 | 928.90 | 2 | 1856.80 | 802.44 |
| ELANVTR | (Hex)5(HexNAc)2 | 1216.36 | 10.97 | 1009.90 | 2 | 2018.80 | 802.44 |
| ELANVTR | (Hex)6(HexNAc)2 | 1378.36 | 10.97 | 1090.90 | 2 | 2180.80 | 802.44 |
| ELANVTR | (Hex)7(HexNAc)2* | 1540.36 | 10.97 | 1171.90 | 2 | 2342.80 | 802.44 |
| ELANVTR | (Hex)8(HexNAc)2* | 1702.36 | 10.97 | 835.60 | 3 | 2504.80 | 802.44 |
| ELANVTR | (Hex)9(HexNAc)2* | 1863.76 | 10.97 | 889.4 | 3 | 2666.20 | 802.44 |
| QNQTSFRPK | (Hex)6(HexNAc)2 | 1378.12 | 11.36 | 822.80 | 3 | 2466.40 | 1088.28 |
| QNQTSFRPK | (Hex)7(HexNAc)2 | 1540.12 | 11.36 | 876.80 | 3 | 2628.40 | 1088.28 |
| QNQTSFRPK | (Hex)8(HexNAc)2* | 1702.12 | 11.36 | 930.80 | 3 | 2790.40 | 1088.28 |
| QNQTSFRPK | (Hex)9(HexNAc)2* | 1540.12 | 11.36 | 984.80 | 3 | 2952.40 | 1088.28 |
| VVPINTTLLSIDNQGVGGTK | (Hex)4(HexNAc)2 | 1054.08 | 21.49 | 1027.40 | 3 | 3080.20 | 2026.12 |
| VVPINTTLLSIDNQGVGGTK | (Hex)5(HexNAc)2 | 1216.08 | 21.49 | 1081.40 | 3 | 3242.20 | 2026.12 |
| VVPINTTLLSIDNQGVGGTK | (Hex)6(HexNAc)2 | 1378.38 | 21.49 | 1135.50 | 3 | 3404.50 | 2026.12 |
| VVPINTTLLSIDNQGVGGTK | (Hex)7(HexNAc)2* | 1540.68 | 21.49 | 1189.60 | 3 | 3566.80 | 2026.12 |
| VVPINTTLLSIDNQGVGGTK | (Hex)8(HexNAc)2* | 1702.68 | 21.49 | 1243.60 | 3 | 3728.80 | 2026.12 |
| VVPINTTLLSIDNQGVGGTK | (Hex)9(HexNAc)2 | 1864.08 | 21.49 | 1297.40 | 3 | 3890.20 | 2026.12 |
| QTTCANFNFTSIDdpaflyk | (Hex)5(HexNAc)2 | 1216.42 | 25.57 | 1190.50 | 3 | 3569.50 | 2353.08 |
| QTTCANFNFTSIDdpaflyk | (Hex)6(HexNAc)2 | 1378.12 | 25.57 | 1244.40 | 3 | 3731.20 | 2353.08 |
| QTTCANFNFTSIDdpaflyk | (Hex)7(HexNAc)2 | 1540.72 | 25.57 | 1298.60 | 3 | 3893.80 | 2353.08 |
| QTTCANFNFTSIDdpaflyk | (Hex)8(HexNAc)2a | 1702.12 | 25.57 | 1352.40 | 3 | 4055.20 | 2353.08 |
| QTTCANFNFTSIDdpaflyk | (Hex)9(HexNAc)2a | 1864.42 | 25.57 | 1406.50 | 3 | 4217.50 | 2353.08 |
a High abundant glycoforms. The N-glycans and glycoforms were identified by nanoLC-PI scan (+204) triggered IDA analysis. Lower case letters in the peptide sequences refer to amino acid residues in the TAP tag fusion.
Functional Annotation and Localization of N-glycoproteins
In total, this MLAC profiling, together with the deglycosylation/deamidation and shotgun analyses, resulted in the identification of 578 N-glycoproteins from the tomato fruit pericarp. Of these, 348 were only identified using shotgun proteomics and 130 only using the deglycosylation strategy, whereas an additional 100 were identified through both strategies. Moreover, a comparison of arabidopsis homologs of the tomato glycoproteins identified in this current study and previous descriptions of arabidopsis N-glycoproteins (12, 44) (supplemental Fig. S3, supplemental Table S4) revealed substantial conservation of glycosylation status.
Given the site of N-glycosylation in the ER, N-glycoproteins would be expected to reside in one of the intracellular compartments or membranes of the secretory pathway (endomembrane system), or in the apoplast. We used PSORT and TargetP to predict the subcellular localization of all 578 putative N-glycoproteins and indeed 523 (90%) were predicted to be localized in the secretory pathway (Fig. 6A). However, some were predicted to be localized in other organelles (7.4% in the chloroplast, 0.3% in the nucleus and 0.5% in the mitochondrion), as well as 1.4% in the cytoplasm (Fig. 6A). Among all the predicted N-glycoproteins, the number of predicted glycosylation sites did not appear to correlate with predicted subcellular localization (Fig. 6A), although proteins with more than 10 such sites were only associated with the secretory pathway. Of the 523 proteins classified as in the secretory pathway, the majority (230; 44%) were predicted to be secreted to the apoplast, whereas the second most common location was the plasma membrane with 108 (21%) proteins having at least two transmembrane domains (Fig. 6B, supplemental Table S5).
Fig. 6.
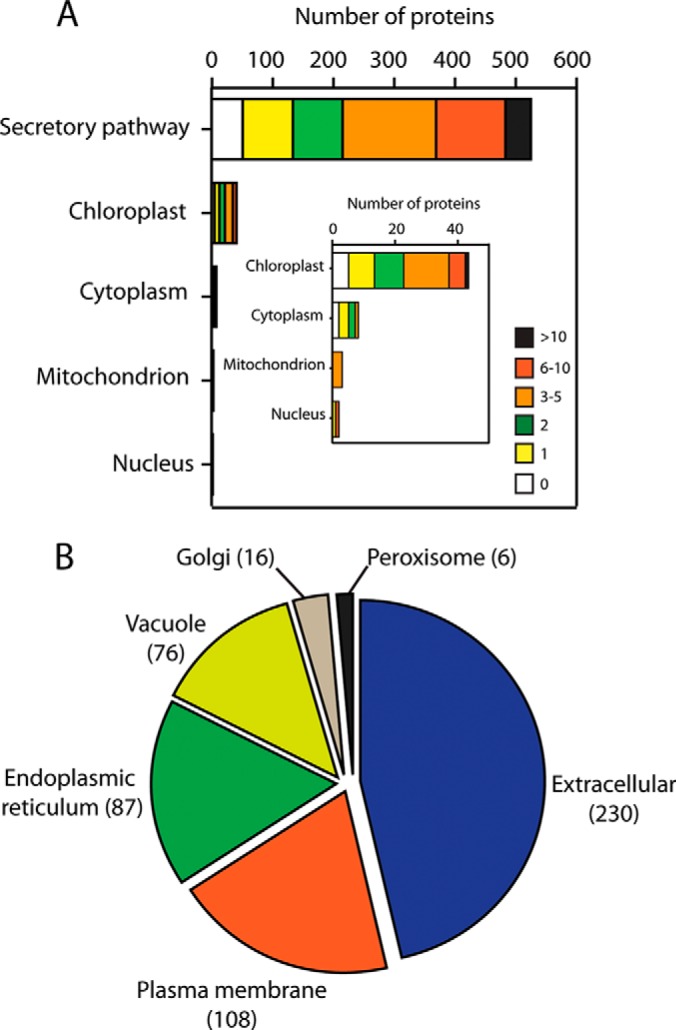
Subcellular location of identified N-glycoproteins. A, the subcellular localizations were predicted with PSORT and TargetP. The numbers of predicted N-glycosylation sites in glycoproteins are indicated. B, predicted subcellular location of identified N-glycoproteins associated with the secretory pathway.
The identified putative N-glycoproteins were grouped into families using Pfam, considering the highest bit score (24), and classified (Fig. 7) according to the functional classes of cell wall proteins proposed by Jamet et al. (25). The predominant functional group was ‘proteins acting carbohydrates’, of which 119 collectively represent 15 glycosyl hydrolase (GH) families, as well as 13 members of carbohydrate esterase family 8 (supplemental Table S4) and polysaccharide lyase family members. Most of these glycoproteins are related in cell wall restructuring and some have been well characterized, such as polygalacturonase (GH28), endo-1,4-β-glucanase (GH9) and xyloglucan endotransglucosylase/hydrolase (GH16) (25, 45, 46). The second largest class of N-glycoproteins (80; 14%) comprised predicted proteases, followed by proteins related to signaling events (73; 13%), oxido-reductases (46; 8%), proteins with protein interaction domains (39; 7%), and proteins related to lipid metabolism (24; 4%). We identified 30 N-glycoproteins with domains of unknown function (supplemental Table S4).
Fig. 7.
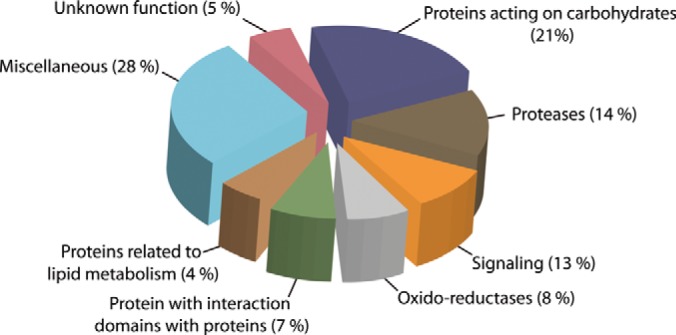
Functional classification of identified N-glycoproteins. N-glycoproteins were grouped into families using the Pfam data base (24) and functionally classified according to Jamet et al. (25).
DISCUSSION
Comparative Analysis of MLAC
To date, the binding properties of ConA, GNA, and LCH have been evaluated using N-glycoproteins or N-glycopeptides derived from a range of eukaryotes, but with the notable exception of plants (47). Moreover, to our knowledge, there have not been any reports of a systematic comparison of glycoprotein populations that have been enriched using different lectins (8, 12, 13, 44, 48). We therefore carried out a detailed comparative analysis of the N-glycoproteins associated with three mannose-binding lectin (ConA, GNA, and LCH), including the main three features of N-glycoproteins: the parent protein sequence, the amino acid residue composition and frequency at and around the N-glycosylation sites and the N-glycan structures associated with each lectin.
The data suggest that MLAC (combined ConA, GNA, and LCH) substantially increases the coverage of the plant N-glycoproteome compared with using single lectins (Fig. 2, supplemental Table S4). Significantly, although ConA is the most commonly used lectin for plant glycoprotein studies, only 54% of the total glycoproteins identified here were detected in the ConA binding fraction. Analysis of the amino acid frequency around the identified N-glycosylation sites (Fig. 3C) revealed a general similarity to previous studies of other model organisms (4, 6, 10, 13), suggesting a broad conservation of the N-glycosylation sequon across the taxonomic range of eukaryotes, spanning yeast and mammals (49). Our data also suggest the value of using multiple, rather than single lectins using the deglycosylation and deamidation analysis (Fig. 3A) and differences were detected in the relative frequencies of certain amino acids at and around the N-glycosylation sequon when considering only the lectin specific glycopeptides (Fig. 3D). We suggest that the disproportionate presence of specific amino acid residues in the −1 or +1 subsites in glycopeptides associated with ConA, GNA, and LCH may reflect one of both of two scenarios. The first is that the residues at these subsites may influence the structural conformation of the glycosylation sites (50) and consequently the accessibility of N-glycan modifying enzymes during protein maturation and N-glycan trimming. This may in turn, result in differences in N-glycan structures at the site variants that then differentially bind to the various lectins. A second explanation is that these sequon variants are associated with the same N-glycan structures, but differences in the structural confirmation of the protein around the N-glycosylation site alter the specificity and/or avidity of the binding to those glycans to the various lectins. It is known that the presence of P at the +1 subsite abolishes N-glycosylation (50, 51), whereas the presence of certain residues at this site can be associated with low or high glycosylation efficiency (52, 53). However, it is not known whether particular amino acid residues are key determinants of interactions with specific lectins.
Although our data clearly support the hypothesis that the differential binding of specific glycopeptides to particular lectins is driven by the unique composition, sequence and structural characteristics of the glycopeptides involved, it should be pointed out that the depth of coverage of the N-glycoproteome reported here is quite low. An alternative possibility is that apparent differential binding is a sampling artifact, although there is no compelling evidence to support this alternate hypothesis. A resolution of these opposing views could be addressed by a rigorous statistical analysis, which would require a much greater depth of coverage of the N-glycoproteome; a fact that, in and of itself, should motivate additional experiments of the type reported here. Additional support for our hypothesis can be amassed by examining the retention of particular glycopeptides known to exhibit specific compositions and structures, a process that is made possible by recent advances in chemical synthesis and NMR characterization (54).
We did not observe particular glycan structural features associated with unique lectins (Table I), although the analysis was based on a relatively small number of N-glycans, reflecting the technical challenges associated with analyses at this scale (2, 40, 41). It is often difficult to obtain reliable information from direct MS analysis of glycopeptides even with relatively enriched glycopeptide samples, because of the labile nature of the glycan-peptide bond and the relatively fragile internal glycan bonds. The high level of fragmentation from glycan moieties and few fragment ions from the core peptide during traditional CID typically results in little, or ambiguous, information concerning peptide sequence, which exacerbates the already difficult process of determining the glycosylation site and glycan sequence. Another particular challenge is the large dynamic range of glycoproteins in biological samples, which means that low abundance glycoproteins are extremely difficult to detect in complex protein mixtures. This is already evident in the broad range of banding intensities using SDS-PAGE (Fig. 2A) and SYPRO ruby staining and the true range is, of course, even greater. To validate the robustness of our analytical pipeline and illustrate the high dynamic range of N-glycoproteins in our tomato fruit glycoprotein extracts, we targeted a putative glycoprotein (XEGIP), which we identified by both shotgun sequencing and deglycosylation and deamidation analysis, but whose glycosylation abundance appeared so low that the constituent glycopeptides were not detected. We expressed XEGIP as a recombinant protein in tobacco leaves, purified the recombinant form and determined the presence and structure of the N-glycans (Table II). We confirmed that the protein is indeed glycosylated and our analysis further showed substantial glycan heterogeneity at the various predicted glycosylation sites. It is possible that at least some of the observed heterogeneity can be caused by artifacts associated with overexpression in a related species. However, earlier reports concerning the characterization of recombinant plant glycoproteins expressed in N. benthamiana and other plant species show similar N-linked oligosaccharides structures to those produced from the native species: high-mannose type N-glycans containing a core Man3HexNAc2 substituted with two to six mannose residues, and complex type N-glycans present at β,1–2 xylose and/or α,1–3 fucose linked to the core (14, 55, 56, 57). Furthermore, we have previously reported a comparative characterization of N-linked glycosylation for HA protein from the H1N1 virus overexpressed in both N. benthamiana and insect cells (18). Overall similar glycosylation patterns were observed for all 5 identified N-linked glycosylation sites in both expression systems, which were similar to the patterns observed here. Thus, there is much empirical evidence to support the notion that the glycosylation of an overexpressed tomato protein accurately reflects the glycosylation status of the native tomato protein. It is noteworthy that only few glycoproteomic studies to date have determined the detailed structures and structural variants of N-glycans from plant N-glycoproteins (5, 58, 59).
MLAC Provides an Overview of the Diversity of Glycoprotein Functions and Subcellular Localizations
Bioinformatic analysis suggests that most (65%) of the N-glycoproteins identified in this study are located in the plant apoplast/cell wall or reside at the cell surface in the plasma membrane (Fig. 6B) and most of these are functionally classified as “proteins acting on carbohydrates” (Fig. 7, supplemental Table 5S). This reflects the substantial cell wall assembly, remodeling and disassembly that is associated with fruit development and ripening and that has been extensively studied in tomato fruit (60–63). Although such studies have provided much information about the expression, regulation activities and endogenous substrates of wall modifying proteins such as polygalacturonase (PG, GH 28; supplemental Table S4), pectin methylesterase (PME, CE8; supplemental Table S4), xyloglucan endotransglucosylase/hydrolases (XTHs) (XTH1 [Q40144], XTH3 [AAS46241], XTH7 [AAS46243], and XTH23 [XP_002274827], supplemental Table S4) and expansins (AAD13631, AAD13632, and AAD13633, supplemental Table S4), almost nothing is known about the nature, extent, dynamics of functional significance of their N-glycosylation. The same applies to the N-glycoproteins that are predicted to localize in the plasma membrane, most of which are classified as having a signaling function (Fig. 7, supplemental Table S5). Several of the N-glycoproteins in this group are annotated as having a protein kinase domain and some are defined as receptor-like kinases (RLKs). Some plants RLKs have recognizable lectin domains and subsets are thought to bind to pectin in the cell wall (64, 65) where they may play a role in biomechanical sensing (66, 67). Several plant receptor kinases have potential N-glycosylation sites and it has been suggested that glycosylation may influence their function, stability, and transportation to the cell surface (66, 68). In this study, we characterized the protein and N-glycan structures of 5 glycopeptides derived from glycoproteins with protein kinase domain (Table I). Among this group, we observed two N-glycoforms of the peptide MGENYLNGSIPK that corresponded to the leucine rich repeat receptor protein kinase CLAVATA1 (BAK52390, Table I). Interestingly, the tomato homolog of CLAVATA1 detected in our study (TU026176, Table I) has an N-glycosylated site, as confirmed by the identification of the glycopeptide MGENYLN415GSIPK, in the predicted extracellular domain (UniProt feature identifier: PRO_0000403352). Thus, we were able to identify both soluble N-glycoproteins, and those that are at the cell surface and have glycans that are likely in intimate contact with the wall matrix.
A growing body of evidence suggests that N-glycoproteins can be located in the chloroplast (69, 70), an organelle that is not part of the canonical secretory pathway. Indeed, proteomic analysis of the arabidopsis chloroplast has provided supporting evidence that there are many proteins (>8% of total chloroplast proteome) with a predicted SP for ER translocation (71). Moreover, proteins such as a carbonic anhydrase (CAH1) from arabidopsis, and both a pyrophosphatase/phosphodiesterase and an α-amylase from rice, have been shown to traffic through the ER to the Golgi apparatus (GA) and then to the chloroplast (72–74). Recently, complete characterization of the structures of the N-glycans of CAH1 showed that blocking the N-glycosylation of this protein disrupts its transport to the chloroplast and enzymatic activity, highlighting the importance of N-glycosylation in its localization (42). Our data further support the existence the chloroplastic location of N-glycoproteins (73, 74, 32); however, experimental evidence is needed to corroborate their subcellular location in vivo. The detection of putative mitochondrial and nuclear N-glycoproteins in our study (Fig. 6) similarly warrants further investigation and underscores the potential value of MLAC as a platform for not only cataloging plant N-glycoproteomes, but also for providing insights into protein trafficking and localization.
Supplementary Material
Footnotes
Author contributions: E.R., S.Z., and J.K.R. designed research; E.R., S.H., K.J.H., and R.W.S. performed research; E.R., S.H., K.J.H., S.Z., R.W.S., T.W.T., and J.K.R. analyzed data; E.R., S.Z., T.W.T., and J.K.R. wrote the paper.
* This work has been supported by grants from the National Science Foundation Plant Genome Program (DBI-0606595), the USDA (1907-21000-37-00D), and the New York State Office of Science, Technology and Academic Research (NYSTAR).
 This article contains supplemental Tables S1 to S6, Figs. S1 to S4 and Data S1 and S2.
1 The abbreviations used are:
- LAC
- Lectin affinity chromatography
- ConA
- concanavalin A
- ER
- endoplasmic reticulum
- GNA
- snowdrop lectin
- GA
- Golgi apparatus
- GH
- glycosyl hydrolase
- HILIC
- hydrophilic interaction chromatography
- LCH
- lentil lectin
- MS
- mass spectrometry
- MLAC
- multiple lectin affinity chromatography
- MG
- mature green MG
- PGC
- porous graphite carbon
- PG
- polygalacturonase
- PME
- pectin methylesterase
- RLKs
- receptor-like kinases
- RP
- reverse phase
- SP
- Signal peptide
- XTHs
- xyloglucan endotransglucosylase/hydrolases
- XEGIP
- xyloglucan-specific endoglucanase inhibitor protein
- PI-IDA
- Precursor ion scanning-triggered information dependent acquisition.
REFERENCES
- 1. Ruiz-May E., Kim S. J., Rose J. K. (2012) The secreted plant N-glycoproteome and associated secretory Front. Plant Sci. 3, 117. [DOI] [PMC free article] [PubMed] [Google Scholar]
- 2. Ruiz-May E., Thannhauser T. W., Zhang S., Rose J. K. (2012) Analytical technologies for identification and characterization of the plant N-glycoproteome. Front. Plant Sci. 3, 150. [DOI] [PMC free article] [PubMed] [Google Scholar]
- 3. Song W., Henquet M. G., Mentink R. A., van Dijk A. J., Cordewener J. H., Bosch D., America A. H., van der Krol A. R. (2011) N-glycoproteomics in plants: perspectives and challenges. J. Proteomics 74, 1463–1474 [DOI] [PubMed] [Google Scholar]
- 4. Zielinska D. F., Gnad F., Wisniewski J. R., Mann M. (2010) Precision mapping of an in vivo N-glycoproteome reveals rigid topological and sequence constraints. Cell 141, 897–907 [DOI] [PubMed] [Google Scholar]
- 5. Halim A., Nilsson J., Ruetschi U., Hesse C., Larson G. (2012) Human urinary glycoproteomics; attachment site specific analysis of N- and O-linked glycosylations by CID and ECD. Mol. Cell. Proteomics 11, M111 013649 [DOI] [PMC free article] [PubMed] [Google Scholar]
- 6. Breidenbach M. A., Palaniappan K. K., Pitcher A. A., Bertozzi C. R. (2012) Mapping yeast N-glycosites with isotopically recoded glycans. Mol. Cell. Proteomics, M111.015339. [DOI] [PMC free article] [PubMed] [Google Scholar]
- 7. Choi E., Loo D., Dennis J. W., O'Leary C. A., Hill M. M. (2011) High-throughput lectin magnetic bead array-coupled tandem mass spectrometry for glycoprotein biomarker discovery. Electrophoresis 32, 3564–3575 [DOI] [PubMed] [Google Scholar]
- 8. Catala C., Howe K. J., Hucko S., Rose J. K., Thannhauser T. W. (2011) Towards characterization of the glycoproteome of tomato (Solanum lycopersicum) fruit using concanavalin A lectin affinity chromatography and LC-MALDI-MS/MS analysis. Proteomics 11, 1530–1544 [DOI] [PubMed] [Google Scholar]
- 9. Nilsson C. L. (2011) Lectin techniques for glycoproteomics. Curr. Proteomics 8, 248–256 [Google Scholar]
- 10. Kaji H., Kamiie J., Kawakami H., Kido K., Yamauchi Y., Shinkawa T., Taoka M., Takahashi N., Isobe T. (2007) Proteomics reveals N-linked glycoprotein diversity in Caenorhabditis elegans and suggests an atypical translocation mechanism for integral membrane proteins. Mol. Cell. Proteomics 6, 2100–2109 [DOI] [PubMed] [Google Scholar]
- 11. Mislovicova D., Katrlik J., Paulovicova E., Gemeiner P., Tkac J. (2012). Comparison of three distinct ELLA protocols for determination of apparent affinity constants between Con A and glycoproteins. Colloids and surfaces. B. Biointerfaces. 94, 163–169 [DOI] [PubMed] [Google Scholar]
- 12. Minic Z., Jamet E., Negroni L., Arsene der Garabedian P., Zivy M., Jouanin L. (2007) A sub-proteome of Arabidopsis thaliana mature stems trapped on Concanavalin A is enriched in cell wall glycoside hydrolases. J. Exp. Bot. 58, 2503–2512 [DOI] [PMC free article] [PubMed] [Google Scholar]
- 13. Zielinska D. F., Gnad F., Schropp K., Wisniewski J. R., Mann M. (2012) Mapping N-glycosylation sites across seven evolutionarily distant species reveals a divergent substrate proteome despite a common core machinery. Mol. Cell 46, 542–548 [DOI] [PubMed] [Google Scholar]
- 14. Nagels B., Van Damme E. J., Pabst M., Callewaert N., Weterings K. (2011) Production of complex multiantennary N-glycans in Nicotiana benthamiana plants. Plant Physiol. 155, 1103–1112 [DOI] [PMC free article] [PubMed] [Google Scholar]
- 15. Tomato Genome Consortium (2012) The tomato genome sequence provides insights into fleshy fruit evolution. Nature 485, 635–641 [DOI] [PMC free article] [PubMed] [Google Scholar]
- 16. Ding W., Nothaft H., Szymanski C. M., Kelly J. (2009) Identification and quantification of glycoproteins using ion-pairing normal-phase liquid chromatography and mass spectrometry. Mol. Cell Prot. 8, 2170–2185 [DOI] [PMC free article] [PubMed] [Google Scholar]
- 17. Varki A., Cummings R. D., Esko J. D., Freeze H. H., Stanley P., Marth J. D., Bertozzi C. R., Hart G. W., Etzler M. E. (2009) Symbol nomenclature for glycan representation. Proteomics 9, 5398–5399 [DOI] [PMC free article] [PubMed] [Google Scholar]
- 18. Zhang S., Sherwood R. W., Yang Y., Fish T., Chen W., McCardle J. A., Jones R. M., Yusibov V., May E. R., Rose J. K., Thannhauser T. W. (2012) Comparative characterization of the glycosylation profiles of an influenza hemagglutinin produced in plant and insect hosts. Proteomics 12, 1269–1288 [DOI] [PMC free article] [PubMed] [Google Scholar]
- 19. Lopez-Casado G., Covey P. A., Bedinger P. A., Mueller L. A., Thannhauser T. W., Zhang S., Fei Z., Giovannoni J. J., Rose J. K. (2012) Enabling proteomic studies with RNA-Seq: The proteome of tomato pollen as a test case. Proteomics 12, 761–774 [DOI] [PubMed] [Google Scholar]
- 20. Rubio V., Shen Y., Saijo Y., Liu Y., Gusmaroli G., Dinesh-Kumar S. P., Deng X. W. (2005) An alternative tandem affinity purification strategy applied to Arabidopsis protein complex isolation. Plant J. 41, 767–778 [DOI] [PubMed] [Google Scholar]
- 21. Sainsbury F., Thuenemann E. C., Lomonossoff G. P. (2009) pEAQ: versatile expression vectors for easy and quick transient expression of heterologous proteins in plants. Plant Biotechnol. J. 7, 682–693 [DOI] [PubMed] [Google Scholar]
- 22. Petersen T. N., Brunak S., von Heijne G., Nielsen H. (2011) SignalP 4.0: discriminating signal peptides from transmembrane regions. Nat. Methods 8, 785–786 [DOI] [PubMed] [Google Scholar]
- 23. Helenius A., Aebi M. (2004) Roles of N-linked glycans in the endoplasmic reticulum. Annu. Rev. Biochem. 73, 1019–1049 [DOI] [PubMed] [Google Scholar]
- 24. Punta M., Coggill P. C., Eberhardt R. Y., Mistry J., Tate J., Boursnell C., Pang N., Forslund K., Ceric G., Clements J., Heger A., Holm L., Sonnhammer E. L., Eddy S. R., Bateman A., Finn R. D. (2011) The Pfam protein families database. Nucleic Acids Res. D290–D301 [DOI] [PMC free article] [PubMed] [Google Scholar]
- 25. Jamet E., Canut H., Boudart G., Pont-Lezica R. F. (2006) Cell wall proteins: a new insight through proteomics. Trends Plant Sci. 11, 33–39 [DOI] [PubMed] [Google Scholar]
- 26. Nakai K., Horton P. (1999) PSORT: a program for detecting sorting signals in proteins and predicting their subcellular localization. Trends Biochem. Sci. 24, 34–36 [DOI] [PubMed] [Google Scholar]
- 27. Emanuelsson O., Brunak S., von Heijne G., Nielsen H. (2007) Locating proteins in the cell using TargetP, SignalP and related tools. Nat. Protoc. 2, 953–971 [DOI] [PubMed] [Google Scholar]
- 28. Krogh A., Larsson B., von Heijne G., Sonnhammer E. L. (2001) Predicting transmembrane protein topology with a hidden Markov model: application to complete genomes. J. Mol. Biol. 305, 567–580 [DOI] [PubMed] [Google Scholar]
- 29. Hirokawa T., Boon-Chieng S., Mitaku S. (1998) SOSUI: classification and secondary structure prediction system for membrane proteins. Bioinformatics 14, 378–379 [DOI] [PubMed] [Google Scholar]
- 30. Schneider T. D., Stephens R. M. (1990) Sequence logos - a new way to display consensus sequences. Nucleic Acids Res. 18, 6097–6100 [DOI] [PMC free article] [PubMed] [Google Scholar]
- 31. Atwood J. A., 3rd, Sahoo S. S., Alvarez-Manilla G., Weatherly D. B., Kolli K., Orlando R., York W. S. (2005) Simple modification of a protein database for mass spectral identification of N-linked glycopeptides. Rapid Commun. Mass Spectrom. 19, 3002–3006 [DOI] [PubMed] [Google Scholar]
- 32. Kitajima A., Asatsuma S., Okada H., Hamada Y., Kaneko K., Nanjo Y., Kawagoe Y., Toyooka K., Matsuoka K., Takeuchi M., Nakano A., Mitsui T. (2009) The rice alpha-amylase glycoprotein is targeted from the golgi apparatus through the secretory pathway to the plastids. Plant Cell 21, 2844–2858 [DOI] [PMC free article] [PubMed] [Google Scholar]
- 33. Leiter H., Mucha J., Staudacher E., Grimm R., Glossl J., Altmann F. (1999) Purification, cDNA cloning, and expression of GDP-L-Fuc:Asn-linked GlcNAc alpha1,3-fucosyltransferase from mung beans. J. Biol. Chem. 274, 21830–21839 [DOI] [PubMed] [Google Scholar]
- 34. Wilson I. B., Rendic D., Freilinger A., Dumic J., Altmann F., Mucha J., Muller S., Hauser M. T. (2001) Cloning and expression of cDNAs encoding alpha1,3-fucosyltransferase homologues from Arabidopsis thaliana. Biochim. Biophys. Acta 1527, 88–96 [DOI] [PubMed] [Google Scholar]
- 35. Palmisano G., Melo-Braga M. N., Engholm-Keller K., Parker B. L., Larsen M. R. (2012) Chemical deamidation: a common pitfall in large-scale N-linked glycoproteomic mass spectrometry-based analyses. J. Proteom. Res. 11, 1949–1957 [DOI] [PubMed] [Google Scholar]
- 36. Ritchie M. A., Gill A. C., Deery M. J., Lilley K. (2002) Precursor ion scanning for detection and structural characterization of heterogeneous glycopeptide mixtures. J. Am. Soc. Mass Spectrom. 13, 1065–1077 [DOI] [PubMed] [Google Scholar]
- 37. Zhang S., Williamson B. L. (2005) Characterization of protein glycosylation using chip-based nanoelectrospray with precursor ion scanning quadrupole linear ion trap mass spectrometry. J. Biomol. Tech. 16, 209–219 [PMC free article] [PubMed] [Google Scholar]
- 38. Segu Z. M., Mechref Y. (2010) Characterizing protein glycosylation sites through higher-energy C-trap dissociation. Rapid Commun. Mass Spectrom. 24, 1217–1225 [DOI] [PubMed] [Google Scholar]
- 39. Cooper C. A., Gasteiger E., Packer N. H. (2001) GlycoMod–a software tool for determining glycosylation compositions from mass spectrometric data. Proteomics 1, 340–349 [DOI] [PubMed] [Google Scholar]
- 40. An H. J., Froehlich J. W., Lebrilla C. B. (2009) Determination of glycosylation sites and site-specific heterogeneity in glycoproteins. Curr. Opin. Chem. Biol. 13, 421–426 [DOI] [PMC free article] [PubMed] [Google Scholar]
- 41. Ytterberg A. J., Jensen O. N. (2010) Modification-specific proteomics in plant biology. J. Proteomics 73, 2249–2266 [DOI] [PubMed] [Google Scholar]
- 42. Buren S., Ortega-Villasante C., Blanco-Rivero A., Martinez-Bernardini A., Shutova T., Shevela D., Messinger J., Bako L., Villarejo A., Samuelsson G. (2011) Importance of post-translational modifications for functionality of a chloroplast-localized carbonic anhydrase (CAH1) in Arabidopsis thaliana. PLoS One 6, e21021. [DOI] [PMC free article] [PubMed] [Google Scholar]
- 43. Qin Q., Bergmann C. W., Rose J. K. C., Saladie M., Kolli V. S. K., Albersheim P., Darvill A. G., York W. S. (2003) Characterization of a tomato protein that inhibits a xyloglucan-specific endoglucanase. Plant J. 34, 327–338 [DOI] [PubMed] [Google Scholar]
- 44. Zhang Y., Giboulot A., Zivy M., Valot B., Jamet E., Albenne C. (2010) Combining various strategies to increase the coverage of the plant cell wall glycoproteome. Phytochemistry 72, 1109–1123 [DOI] [PubMed] [Google Scholar]
- 45. Jamet E., Albenne C., Boudart G., Irshad M., Canut H., Pont-Lezica R. (2008) Recent advances in plant cell wall proteomics. Proteomics 8, 893–908 [DOI] [PubMed] [Google Scholar]
- 46. Cosgrove D. J. (2005) Growth of the plant cell wall. Nat. Rev. Mol. Cell Biol. 6, 850–861 [DOI] [PubMed] [Google Scholar]
- 47. Gabius H. J., Siebert H. C., Andre S., Jimenez-Barbero J., Rudiger H. (2004) Chemical biology of the sugar code. Chembiochem 5, 740–764 [DOI] [PubMed] [Google Scholar]
- 48. Albenne C., Canut H., Boudart G., Zhang Y., San Clemente H., Pont-Lezica R., Jamet E. (2009) Plant cell wall proteomics: mass spectrometry data, a trove for research on protein structure/function relationships. Mol. Plant 2, 977–989 [DOI] [PubMed] [Google Scholar]
- 49. Lehle L., Strahl S., Tanner W. (2006) Protein glycosylation, conserved from yeast to man: a model organism helps elucidate congenital human diseases. Angew Chem. 45, 6802–6818 [DOI] [PubMed] [Google Scholar]
- 50. Imperiali B., O'Connor S. E., Hendrickson T., Kellenberger C. (1999) Chemistry and biology of asparagine-linked glycosylation. Pure Appl. Chem. 71, 777–787 [Google Scholar]
- 51. Bause E. (1983) Structural requirements of N-glycosylation of proteins. Studies with proline peptides as conformational probes. Biochem. J. 209, 331–336 [DOI] [PMC free article] [PubMed] [Google Scholar]
- 52. Mazola Y., Chinea G., Musacchio A. (2011) Integrating bioinformatics tools to handle glycosylation. PLoS Comput. Biol. 7, e1002285. [DOI] [PMC free article] [PubMed] [Google Scholar]
- 53. Shakin-Eshleman S. H., Spitalnik S. L., Kasturi L. (1996) The amino acid at the X position of an Asn-X-Ser sequon is an important determinant of N-linked core-glycosylation efficiency. J. Biol. Chem. 271, 6363–6366 [DOI] [PubMed] [Google Scholar]
- 54. Kang J., Low W., Norberg T., Meisenhelder J., Hansson K., Stenflo J., Zhou G. P., Imperial J., Olivera B. M., Rigby A. C., Craig A. G. (2004) Total chemical synthesis and NMR characterization of the glycopeptide tx5a, a heavily post-translationally modified conotoxin, reveals that the glycan structure is alpha-D-Gal-(1–>3)-alpha-D-GalNAc. Eur. J. Biochem. 271, 4939–4949 [DOI] [PubMed] [Google Scholar]
- 55. Balen B., Krsnik-Rasol M. (2007) N-glycosylation of recombinant therapeutic glycoproteins in plant systems. Food Technol. Biotech. 45, 1–10 [Google Scholar]
- 56. Ashraf S., Singh P. K., Yadav D. K., Shahnawaz M., Mishra S., Sawant S. V., Tuli R. (2005) High level expression of surface glycoprotein of rabies virus in tobacco leaves and its immunoprotective activity in mice. J. Biotechnol. 119, 1–14 [DOI] [PMC free article] [PubMed] [Google Scholar]
- 57. Fitchette A. C., Dinh O. T., Faye L., Bardor M. (2007) Plant proteomics and glycosylation. Methods Mol. Biol. 355, 317–342 [DOI] [PubMed] [Google Scholar]
- 58. Kurogochi M., Matsushista T., Amano M., Furukawa J., Shinohara Y., Aoshima M., Nishimura S. (2010) Sialic acid-focused quantitative mouse serum glycoproteomics by multiple reaction monitoring assay. Mol. Cell. Proteomics 9, 2354–2368 [DOI] [PMC free article] [PubMed] [Google Scholar]
- 59. Kurogochi M., Amano M., Fumoto M., Takimoto A., Kondo H., Nishimura S. (2007) Reverse glycoblotting allows rapid-enrichment glycoproteomics of biopharmaceuticals and disease-related biomarkers. Angew Chem. Int. Ed. Engl. 46, 8808–8813 [DOI] [PubMed] [Google Scholar]
- 60. Rose J. K., Bennett A. B. (1999) Cooperative disassembly of the cellulose-xyloglucan network of plant cell walls: parallels between cell expansion and fruit ripening. Trends Plant Sci. 4, 176–183 [DOI] [PubMed] [Google Scholar]
- 61. Brummell D. A. (2006) Cell wall disassembly in ripening fruit. Funct. Plant Biol. 33, 103–119 [DOI] [PubMed] [Google Scholar]
- 62. Vicente A. R., Saladie M., Rose J. K. C., Labavitch J. M. (2007) The linkage between cell wall metabolism and fruit softening: looking to the future. J. Sci. Food Agric. 87, 1435–1448 [Google Scholar]
- 63. Seymour G. B., Chapman N. H., Chew B. L., Rose J. K. (2012) Regulation of ripening and opportunities for control in tomato and other fruits. Plant Biotechnol. J. DOI: 10.1111/j.1467–7652.2012.00738.x [DOI] [PubMed] [Google Scholar]
- 64. Kohorn B. D., Johansen S., Shishido A., Todorova T., Martinez R., Defeo E., Obregon P. (2009) Pectin activation of MAP kinase and gene expression is WAK2 dependent. Plant J. 60, 974–982 [DOI] [PMC free article] [PubMed] [Google Scholar]
- 65. Decreux A., Messiaen J. (2005) Wall-associated kinase WAK1 interacts with cell wall pectins in a calcium-induced conformation. Plant Cell Physiol. 46, 268–278 [DOI] [PubMed] [Google Scholar]
- 66. Cheung A. Y., Wu H. M. (2011) THESEUS 1, FERONIA and relatives: a family of cell wall-sensing receptor kinases? Curr. Opin. Plant Biol. 14, 632–641 [DOI] [PubMed] [Google Scholar]
- 67. Steinwand B. J., Kieber J. J. (2010) The role of receptor-like kinases in regulating cell wall function. Plant Physiol. 153, 479–484 [DOI] [PMC free article] [PubMed] [Google Scholar]
- 68. Furukawa K., Ohkawa Y., Yamauchi Y., Hamamura K., Ohmi Y. (2012) Fine tuning of cell signals by glycosylation. J. Biochem. 151, 573–578 [DOI] [PubMed] [Google Scholar]
- 69. Gaikwad A., Tewari K. K., Kumar D., Chen W., Mukherjee S. K. (1999) Isolation and characterisation of the cDNA encoding a glycosylated accessory protein of pea chloroplast DNA polymerase. Nucleic Acids Res. 27, 3120–3129 [DOI] [PMC free article] [PubMed] [Google Scholar]
- 70. Asatsuma S., Sawada C., Kitajima A. (2005) Investigation of intracellular localization of rice alpha-amylase isoforms. Plant Cell Physiol. 46, S107. [DOI] [PubMed] [Google Scholar]
- 71. Kleffmann T., Russenberger D., von Zychlinski A., Christopher W., Sjolander K., Gruissem W., Baginsky S. (2004) The Arabidopsis thaliana chloroplast proteome reveals pathway abundance and novel protein functions. Curr. Biol. 14, 354–362 [DOI] [PubMed] [Google Scholar]
- 72. Jarvis P. (2008) Targeting of nucleus-encoded proteins to chloroplasts in plants. New Phytol. 179, 257–285 [DOI] [PubMed] [Google Scholar]
- 73. Villarejo A., Buren S., Larsson S., Dejardin A., Monne M., Rudhe C., Karlsson J., Jansson S., Lerouge P., Rolland N., von Heijne G., Grebe M., Bako L., Samuelsson G. (2005) Evidence for a protein transported through the secretory pathway en route to the higher plant chloroplast. Nat. Cell Biol. 7, 1224–1231 [DOI] [PubMed] [Google Scholar]
- 74. Nanjo Y., Oka H., Ikarashi N., Kaneko K., Kitajima A., Mitsui T., Munoz F. J., Rodriguez-Lopez M., Baroja-Fernandez E., Pozueta-Romero J. (2006) Rice plastidial N-glycosylated nucleotide pyrophosphatase/phosphodiesterase is transported from the ER-golgi to the chloroplast through the secretory pathway. Plant Cell 18, 2582–2592 [DOI] [PMC free article] [PubMed] [Google Scholar]
Associated Data
This section collects any data citations, data availability statements, or supplementary materials included in this article.