Abstract
PURPOSE
Magnetic resonance images of biological media based on chemical exchange saturation transfer (CEST) show contrast that depends on chemical exchange between water and other protons. In addition, spin-lattice relaxation rates in the rotating frame (R1ρ) are also affected by exchange, especially at high fields, and can be exploited to provide novel, exchange-dependent contrast. Here, we evaluate and compare the factors that modulate the exchange contrast for these methods using simulations and experiments on simple, biologically relevant samples.
METHODS
Simulations and experimental measurements at 9.4T of rotating frame relaxation rate dispersion and CEST contrast were performed on solutions of macromolecules containing amide and hydroxyl exchanging protons.
RESULTS
The simulations and experimental measurements confirm that both CEST and R1ρ measurements depend on similar exchange parameters, but they manifest themselves differently in their effects on contrast. CEST contrast may be larger in the slow and intermediate exchange regimes for protons with large resonant frequency offsets (e.g. > 2ppm). Spin-locking techniques can produce larger contrast enhancement when resonant frequency offsets are small (< 2 ppm) and exchange is in the intermediate to fast regime. The image contrasts scale differently with field strength, exchange rate and concentration.
CONCLUSION
CEST and R1ρ measurements provide different and somewhat complementary information about exchange in tissues. Whereas CEST can depict exchange of protons with specific chemical shifts, appropriate R1ρ dependent acquisitions can be employed to selectively portray protons of specific exchange rates.
Keywords: CEST, spin lock, R1ρ, chemical exchange
INTRODUCTION
There is continuing interest in developing and exploiting novel contrast mechanisms in proton magnetic resonance imaging (MRI) to characterize tissues. Proton exchange between water and exchangeable protons in other molecules provides one such mechanism that reports the presence of specific chemical components within a mixture. Methods such as chemical exchange saturation transfer (CEST) depend explicitly on exchange between water and protons with specific chemical shifts, but other approaches may also be affected by exchange on appropriate time scales, especially at high magnetic fields. In particular, exchange between sites of different chemical shifts contributes directly to both transverse relaxation rates (R2) and spin-lattice relaxation rates in the rotating frame (R1ρ). Here we compare and contrast the sensitivity and selectivity for producing contrast based on exchange processes of CEST with a novel approach based on measurements of R1ρ.
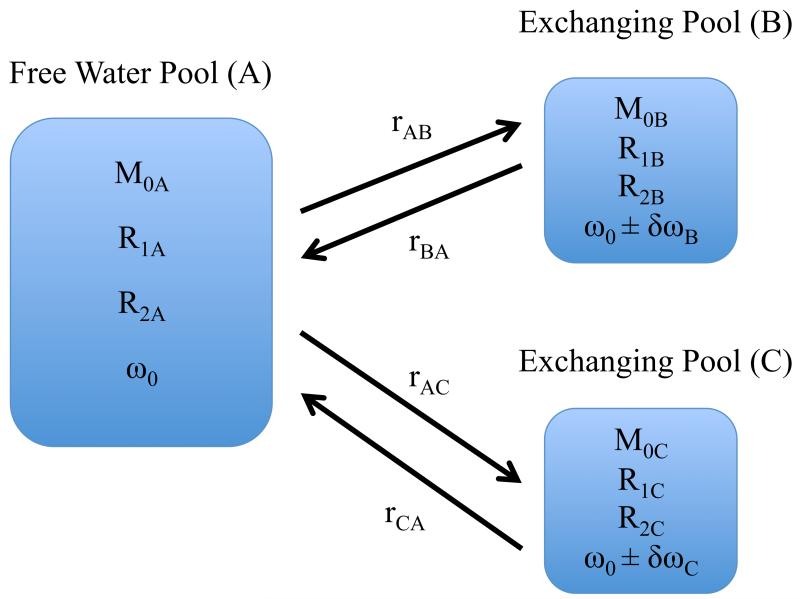
The dynamics of exchange with amide and hydroxyl sites in particular have been extensively exploited to generate contrast in CEST imaging (1,2). To interpret CEST data, protons are considered to comprise at least two pools, the solvent water and the exchangeable protons in the solute, as shown in Figure 1. Each pool is characterized by its own relaxation times and chemical shift, but they communicate via chemical exchange at specific rates. Where the exchanging species is largely derived from a singular tissue constituent, such as glycogen (glycoCEST) or gycosaminoglycans (gagCEST), the endogenous CEST contrast potentially reports on the concentrations of specific molecules in tissues (3,4). In addition, exogenous agents such as paramagnetic chelates have been developed to shift proton resonance frequencies to increase exchange effects (paraCEST) (5,6), while common x-ray contrast agents which contain exchanging amide and hydroxyl groups have also been shown to produce significant CEST effects (7,8) and therefore are also potential MRI contrast agents. However, in practice, CEST signal changes may be contaminated by non-specific magnetization transfer and nuclear Overhauser effects, and are sensitive to the effects of direct saturation as well as field inhomogeneities. In addition, the derivation of explicit information on exchange rates or molecular concentration requires the acquisition of multiple images and fitting the data to a model.
Figure 1.
Model of chemical exchange between a large pool of free water protons (A) and smaller pools of exchangeable protons B and C. The rate rAB represents the exchange rate from free water to the exchangeable proton site, and rBA is the reverse rate. The relaxation rates R1 and R2 and resonant frequency offsets δω are the assumed independent parameters for each site and are distinguished by an appropriate subscript. The total magnetization M0A + M0B + M0C =1. There is negligible presumed communication between pools B and C, and a two-pool model is obtained by simply removing pool C.
Measurements of R1ρ using spin-locking sequences are also sensitive to exchange effects at high fields but are less affected by some of the above considerations and are differently influenced by other factors, including the field strength and exchange rates. Here, we present simulations and experimental data to illustrate the influences of factors that affect signals in both CEST and spin lock imaging and to quantify how specific parameters such as exchange rate and field strength modify contrast. The sensitivities of CEST and spin locking (SL) techniques to chemical exchange effects in specific experimental regimes are predicted theoretically and measured experimentally and used to quantify contrast in polypeptide and sugar systems of biologic interest.
CEST methods include radiofrequency (RF) saturation of an exchanging species, which is then transferred to water, reducing its longitudinal magnetization. This change does not, in the ideal case of perfectly selective RF saturation, explicitly depend on the chemical shift of the irradiated protons. In practice, RF saturation is applied at a series of frequencies (offset δω relative to the water peak), and the acquired images yield a “z-spectrum” of the signal intensity at each voxel in which peaks correspond to specific exchanging species. However, the RF pulses may also alter the water signal by direct saturation or non-specific magnetization transfer (9) with other broad resonances. One strategy to correct for these effects is to acquire images at the opposite frequency offset(s) for metabolites of interest. The difference in the normalized signals from opposite sides of the water peak is the magnetization transfer ratio asymmetry (MTRasym):
| [1] |
where S(ω) is the signal when the RF pulse is at frequency ω, S0 is the signal without RF saturation, and ω0 is the resonance frequency of water.
Spin-locking techniques may also generate exchange-dependent contrast and can be implemented for imaging experiments (10,11). Typically, a 90-degree adiabatic half-passage (AHP) pulse nutates longitudinal magnetization to the transverse plane, followed by a spin-locking pulse (B1) on resonance for some duration. Another 90-degree reverse half-passage (RHP) pulse returns magnetization to the longitudinal axis, residual transverse magnetization is spoiled, and an imaging sequence may then acquire R1ρ-weighted images. Relaxation rates in the rotating frame are sensitive to molecular interactions on the time scale defined by the locking field amplitude, B1, about which magnetization would precess at frequency ω1 = γB1 (12,13). Variations in R1ρ with locking-field strength (R1ρ dispersion) can provide quantitative information on the relevant parameters that describe chemical and diffusive exchange (14-16). In tissues, values of R1ρ are affected by slow molecular motions which modulate dipole-dipole interactions, but at high fields the increased separation of resonance frequencies between water and other chemical species gives rise to large contributions from chemical exchange whose magnitudes depend on the locking field amplitude and exchange rate.
CEST and SL techniques are both sensitive to chemical exchange effects, but have different constraints and sensitivities. Two important parameters are the chemical shift resonant frequency difference (δω) and the rate of proton exchange between the metabolite and free water (rBA) (3,17). As in conventional spectroscopy, exchange regimes in CEST can be divided into slow, intermediate, and fast exchange relative to the chemical shift between water and the exchanging species. In high resolution spectroscopy, the chemical shift of an exchanging species must be greater than the exchange rate (δω/rBA > 1) in order for individual peaks to be well resolved. As rBA increases into the intermediate (δω/rBA ≅ 1) and fast (δω/rBA << 1) exchange regimes, line broadening reduces the ability to resolve individual resonances. At moderate saturation power levels, CEST contrast exhibits similar exchange regimes and constraints due to the spectral blurring effects of the applied irradiation field. Faster exchange requires larger saturating field strengths in order to achieve solute saturation, and creates correspondingly larger blurring of z-spectra. However, if saturation requirements are reduced, the conventional exchange rate constraints can be stretched, allowing, for example, CEST peaks to be resolved when conventional spectroscopy peaks are blurred (1). Nonetheless, CEST peaks are easiest to resolve in the slow exchange regime.
By contrast, fast exchange can be advantageous for affecting R1ρ values. Chemical exchange between sites of different chemical shift causes spin dephasing, which increases the difference between longitudinal (R1) and transverse (R2) relaxation rates, and thereby the dispersion of R1ρ with locking field, to a degree that increases with chemical shift and exchange frequencies. The values of R1ρ observed for different media (and therefore potential image contrast) may be selectively modulated by adjusting the amplitude of spin-locking pulses to reduce the contributions to relaxation of a specific range of exchange rates, up to the point where the rates become so large that the necessary locking field becomes impractical. In practice these rates can be much higher than those detectable by CEST.
Here we study exchange in solutions of biologically relevant macromolecules (polypeptides and sugars) in order to better understand the factors that modulate exchange-based image contrast for CEST and R1ρ imaging, and examine the limits of each technique. We show, using theory, simulations and experimental measurements, how CEST contrast and a novel metric based on R1ρ dispersion may be used to emphasize the presence of protons characterized either by chemical shifts or by specific exchange rates.
METHODS
(a) COMPUTER SIMULATIONS
Numerical simulations were used to quantify the contributions of exchange to R1ρ and CEST measurements for the two-pool and three-pool models shown in Figure 1. The effects of chemical exchange on R1ρ and CEST contrast were calculated using the Bloch equations modified with exchange terms for each species (18,19) and solved by numerical methods as described previously (6,13).
Chemical exchange effects were simulated using parameters appropriate for poly-L-lysine (PLK) and dextran (DXT) as a representative polypeptide and sugar, respectively. Simulation parameters were adapted from literature values of CEST z-spectra. PLK was modeled with the following parameters (the subscript A refers in each case to the solvent pool, whereas B refers to the solute pool): T1A = 3 sec, T2A = 2 sec, T1B = 1 sec, T2B = 30 msec, fractional populations pA = 0.99, pB = 0.01, resonant offset frequencies δωA = 0 ppm δωB = 3.5 ppm, exchange rate rBA = 140 Hz (1,22). DXT was modeled with the following parameters: T1A = 3 sec, T2A = 2 sec, T1B = 1 sec, T2B = 30 msec, pA = 0.99, pB = 0.01, δωA = 0 ppm δωB = 1.2 ppm, rBA = 1 kHz (17,21). For spin-locking simulations, the locking field amplitude (SLA, denoted in ) was varied over a range achievable experimentally, corresponding to frequencies of 13.5 Hz to 10 kHz. To calculate CEST z-spectra, the frequency offset was varied from −10 to +10 ppm and assumed an RF amplitude of 1 μT and duration 8 sec.
Selected parameters of interest were varied, including chemical exchange rate, chemical shift, concentration, and main field strength, to assess their effects. The effect of main field (B0) was varied from 0.54 Tesla to 9.4 Tesla (a resonant frequency range of 23 to 400 MHz). The effects of increasing chemical exchange rate were modeled by varying rBA from 0.1 to 50 kHz. The effects of chemical shift were explored by comparing a typical hydroxyl chemical shift of 1.2 ppm at rBA = 1 kHz to a typical amide shift and rate (δωB = 3.5 ppm and rBA = 140 Hz). The effects of concentration of the labile species were evaluated by varying the values of the pool size (pB) from 0.001 to 0.05.
A three-pool model was also evaluated to illustrate the effects of multiple exchanging sites for substances such as poly-L-threonine (PLT) or chondroitin sulfate (CS) that carry both NH and OH groups. Two exchanging pools at two different offset frequencies and exchange rates were modeled in equal concentrations (each 0.01 as above, using the same offset and exchange rates). Exchange between pools B and C was ignored.
(b) ANALYSES
CEST contrast was quantified in terms of MTRasym calculated from the predicted z-spectra using Equation 1. To analyze and compare these with R1ρ effects, a novel metric was devised. Previously, Chopra et al. (23) derived an expression for exchange effects on R1ρ that in our case can be simplified to
| [2] |
where R2A, R2B are the transverse relaxation rates of the A (water) and B (exchanging) pools, respectively. Parameters pB, rBA, δωB denote the exchanging pool fractional population, exchange rate from the B to the A pool, and chemical shift respectively, and ω1 is the spin-locking field amplitude. This is valid when rBA>>R2B>R1B as is always the case here. If we consider three measurements of R1ρ taken at three different values of ω1 (low (≈ 0), high (≈ ∞), and a selected value ω1), we can define an Exchange Rate Contrast (ERC) as
| [3] |
Using [2] and [3] we obtain the following simple expression
| [4] |
where and
| [5] |
The locking frequency ωe is characteristic of the compound and corresponds to the field at which the dispersion of R1ρ with ω1 shows an inflection point so the rate of change of R1ρ with locking field takes on its maximum negative value. Equation 4 has a straightforward interpretation that provides the theoretical basis for modulating the contrast in exchange imaging. The ERC is smooth, has a single peak, and by including the factor 4 in equations [3] and [4], it has a maximum value of 1 when α = 1, i.e. when the selected locking field satisfies . The ERC decreases rapidly at higher and lower locking fields and the width of the overall response is again determined by the ratio α. For amides, even at moderate field, the chemical shift dominates the expression . Typically or less while a shift of 3.5ppm corresponds to at 7T (1,15). For hydroxyls, at 7T the exchange rate is much more significant (typically or more (27) and the chemical shift is smaller (≈ 1.2 ppm). The locking frequencies to obtain maximum ERC of 1 at 7T are then 394 and 1050 Hz for hydroxyl and amide protons respectively. When one of these locking frequencies is selected, the ERC for the other species is much reduced (≈ 0.43 for hydroxyls when amide frequency selected, and for amides when hydroxide frequency is selected). Thus by choosing the locking field we can emphasize different species according to their exchange rates.
Actual measurements of R1ρ are not essential to this analysis. A simpler quantity can be defined, similar to the ERC, but based on a comparison of image intensities rather than explicitly on relaxation rates, which behaves in a similar fashion. We name this the Exchange-Weighted Image Contrast or EWIC
| [6] |
Here, S is the spin lock signal acquired for a fixed locking time. EWIC requires only 3 images and by comparing signals at different locking fields, different exchanging populations may be emphasized. Below, values of ERC and EWIC are computed and compared to MTRasym for both experimental and simulated data.
(c) Experiments
Solutions of varied concentrations of polypeptides and sugars were created in 0.6 ml plastic tubes in 1× phosphate-buffered saline (PBS) and titrated to pH 7.4. All chemicals were purchased from Sigma-Aldrich (St. Louis, MO).
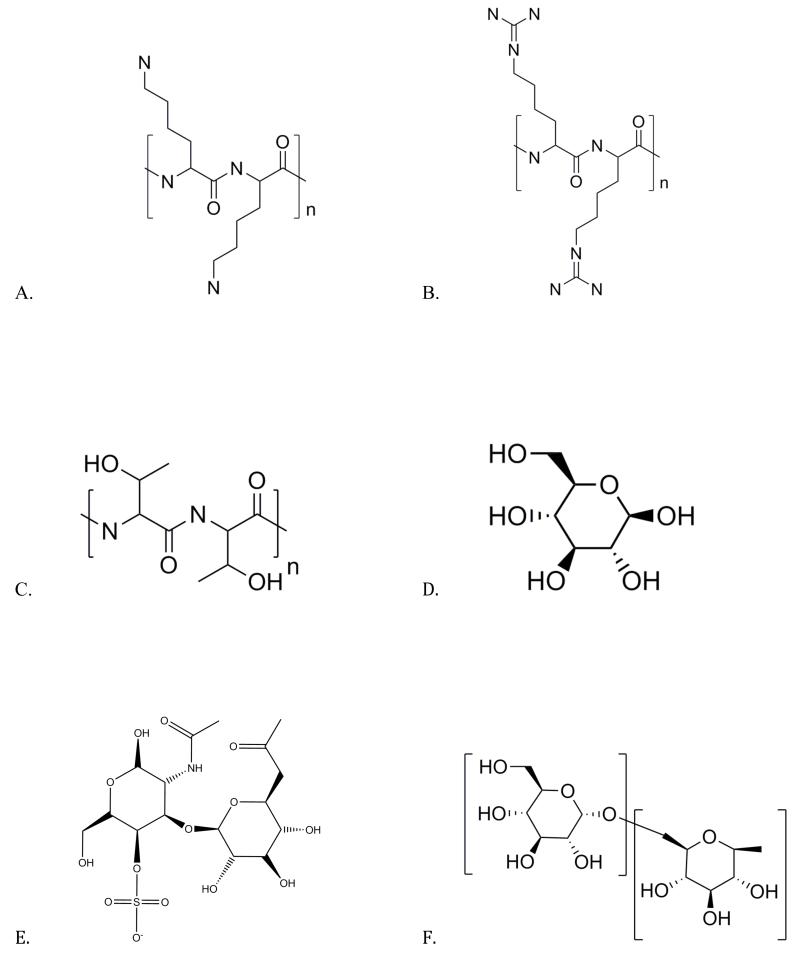
Samples of poly-L-threonine (PLT, P8077), poly-L-arginine (PLR, P4663), and poly-L-lysine (PLK, P7890) at 10 mg/mL of molecular weight ~15 kDa were prepared. These three polypeptides have previously been identified in a study of a wide range of compounds as having particularly large CEST effects by McMahon et al. (2). Their structures are shown in Figure 2 and were generated from the National Institutes of Health PubChem database (http://pubchem.ncbi.nlm.nih.gov/). PLT contains one backbone NH2 and a single side-chain OH exchangeable group per sub-unit at chemical shifts of ~3.5 and ~0.8 ppm respectively. PLR contains two side-chain guanidyl NH2 groups and one backbone NH per sub-unit at ~1.8 and ~3.7 ppm respectively. PLK contains one side-chain NH2 and a backbone NH group at ~3.6 ppm per lysine sub-unit.
Figure 2.
Structures of units of molecules in which proton chemical exchange occurs.
2.a. Poly-L-lysine with exchangeable amide (RC(O)NR’R) groups that resonate collectively near 3.69 ppm from water.
2.b. Poly-L-arginine with exchanging guadinyl NH+ (gNH2) groups.
2.c. Poly-L-threonine with exchanging NH+ and −OH groups.
2.d. Glucose molecule (CID: 5793) with 3 distinct hydroxyl (−OH) exchanging sites.
2.e. Chondroitin Sulfate (CID: 24766), a sulfated glycosaminoglycan, that carries multiple exchanging −OH and a single NH+ site.
2.f. Dextran (CID: 4125253), a poly-glucose molecule that is formed from multiple glycosidic linkages at the α-1,6 or α-1,3 sites on the glucose sub-unit and carries exchanging −OH sites that resonate near 1.2 ppm.
Samples of 40% (wt/wt) glucose (G8270), and dextran (D9260) were created both in distilled water and in 1× PBS at pH 7.4. Samples of 10% (wt/wt) chondroitin sulfate (CS, C4384) were also created in water and PBS. Samples in PBS were diluted by half four times to create different concentrations. Samples in water were titrated to a pH range of 3 through 11 in 5 steps.
R1ρ and CEST data and images were acquired at 9.4T (Varian Medical Systems, Palo Alto, CA). Sample temperature was monitored and maintained at 37 °C. R1ρ values at each locking field amplitude were measured by varying the time of the locking pulse (SLT) between 20 ms and 1 sec, and these data were then fit to a monoexponential decay. R1ρ dispersion was evaluated by varying the locking field amplitude (SLA) between 150 Hz to 10 kHz (corresponding to ω1 between 943 and 62,840 rad.sec−1). CEST data were obtained using an 8 second 1μT saturation pulse with TR of 20 sec. The RF frequency offset was varied between +6 and −6 ppm in 0.1 ppm increments.
Magnetic resonance images were also acquired of the samples in a water bath. The R1ρ imaging sequence consisted of a SL pulse as described by Witschey et al. followed by a fast spin-echo acquisition (12). Images at each of 10 values of SLT were acquired as before at twelve spin lock amplitudes between 150 Hz and 10 kHz. Other imaging parameters included: FOV = 25 × 25 × 1 mm, matrix = 64 × 128 × 1, TR = 4 sec, TE = 10 ms, ETL = 8, NEX = 1.
RESULTS
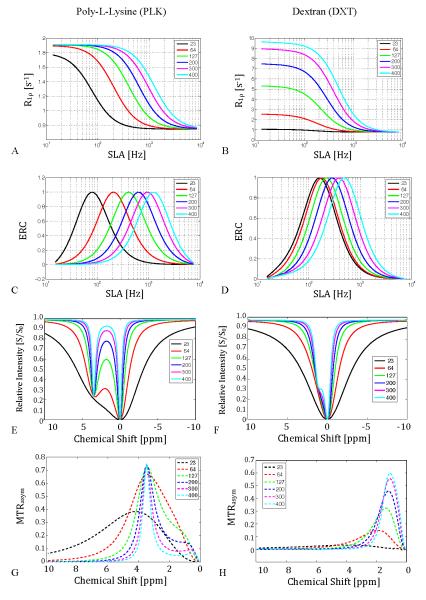
Figures 3.a and b show the effects of field strength on R1ρ dispersion obtained from simulations of the coupled Bloch equations assuming other relaxation rates (R1, R2) remain fixed. The degree of dispersion of R1ρ increases strongly with field, especially when exchange is moderately fast. Figures 3.c and d show the ERC values calculated from the dispersion curves using Eq. 3. The locking frequency at which maximum contrast occurs scales with B0 as the resonant frequency differences of the exchanging species increase.
Figure 3.
Simulated effect of moving to higher main field on chemical exchange mediated R1ρ dispersion for peptides (PLK) and sugars (DXT), assuming other relaxation rates do not vary. (T1A = 3 sec, T2A = 2 sec, T1B = 1 sec, T2B = 30 msec, pA = 0.99, pB = 0.01, ΔωB = 3.5 ppm or 1.2 ppm, rBA= 140 Hz for PLK or 1kHz for DXT)
3.a. Peptide R1ρ dispersion vs. applied locking field amplitude with increasing main field/frequency.
3.b. Sugar R1ρ dispersion.
3.c & 3.d. Simulated Exchange Rate Contrast (ERC) using Eq. 3. Note that the contrast enhancement scales with main field.
3.e & 3.f. CEST z-spectra for PLK (left) and DXT (right).
3.g & 3.h. CEST MTRasym for PLK and DXT, respectively. The field dependence reflects direct saturation effects on water that reduce as the chemical shift frequency difference increases.
Figure 3.e shows the dramatic effect of field on the separation of the water and metabolite peak of the polypeptide in CEST. The plots of MTRasym for the peptide (Fig. 3.g) are very similar above 64 MHz with MTRasym ≈ 0.75. Figure 3.f demonstrates how the small chemical shift and rapid exchange rate of the sugar hydroxyl result in a broad coalesced CEST water peak below 200 MHz. Above 200 MHz, the OH shoulder becomes more pronounced, leading to a more distinct MTRasym as shown in Figure 3.h. The MTRasym peak approaches the actual chemical shift only as the main field increases above 2T. The variations with field reflect the direct effects of saturation on the water, which decrease as the chemical shift frequency difference increases.
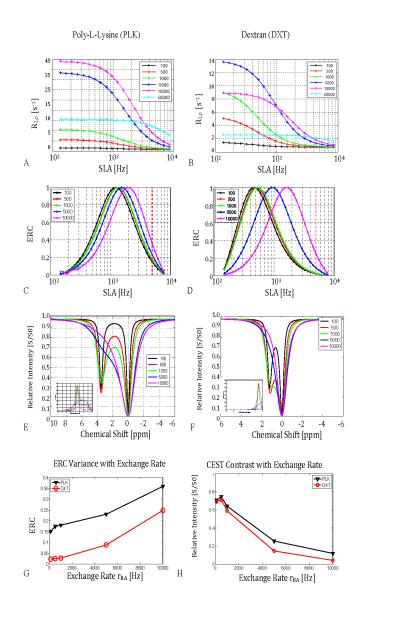
Figure 4 demonstrates the predicted effects of increasing chemical exchange rates at 9.4T. R1ρ at low ω1 increases dramatically as the exchange rate increases until a maximum is reached, after which R1ρ decreases. Figure 4 also shows that the ERC is maximized when ω1 (SLA) is chosen appropriately. The locking field at which maximum contrast occurs increases with the chemical exchange rate to a degree that depends on the chemical shift.
Figure 4.
Simulated effect of changes in chemical exchange rate (rBA) on R1ρ dispersion and CEST contrast. (T1A = 3 sec T2A = 2 sec, T1B = 1 sec, T2B = 30 msec, pA = 0.99, pB = 0.01, ΔωB = 3.5 ppm or 1.2 ppm, ω0 = 2π*400 MHz)
4.a. Peptide R1ρ dispersion vs applied locking field amplitude SLA for increasing exchange rates.
4.b. Sugar R1ρ dispersion with increasing exchange rate.
4.c & 4.d. Exchange Rate Contrast (ERC) using Eq. 3. The DXT data in 4.d shift more with exchange rate than PLK because the chemical shift of the exchanging proton is smaller. The red vertical line at 2π*5kHz is used to generate figure 4.g.
4.e & 4.f. CEST z-spectra with inset MTRasym for PLK (left) and DXT (right). Note how CEST contrast sensitivity decreases rapidly as line broadening causes the metabolite peak to coalesce into the water peak above 10 kHz exchange rates.
4.g & 4.h. ERC contrast at fixed ω1 (SLA=5 kHz) (See Fig. 4.c and 4.d) compared to CEST contrast for PLK and DXT. Note that SL contrast generally increases with increasing exchange rate in 4.g, and decreases for CEST contrast as shown in 4.h.
Figures 4.e and 4.f show simulated z-spectra and MTRasym for the polypeptide and sugar for increasing exchange rates. As the exchange rate increases from the slow to the intermediate regimes, the two peaks coalesce and result in a much-reduced MTRasym (at this 1μT irradiation strength). When the chemical shift is reduced from 3.5 to 1.2 ppm (polypeptide vs. sugar), this drop occurs at even lower exchange rates.
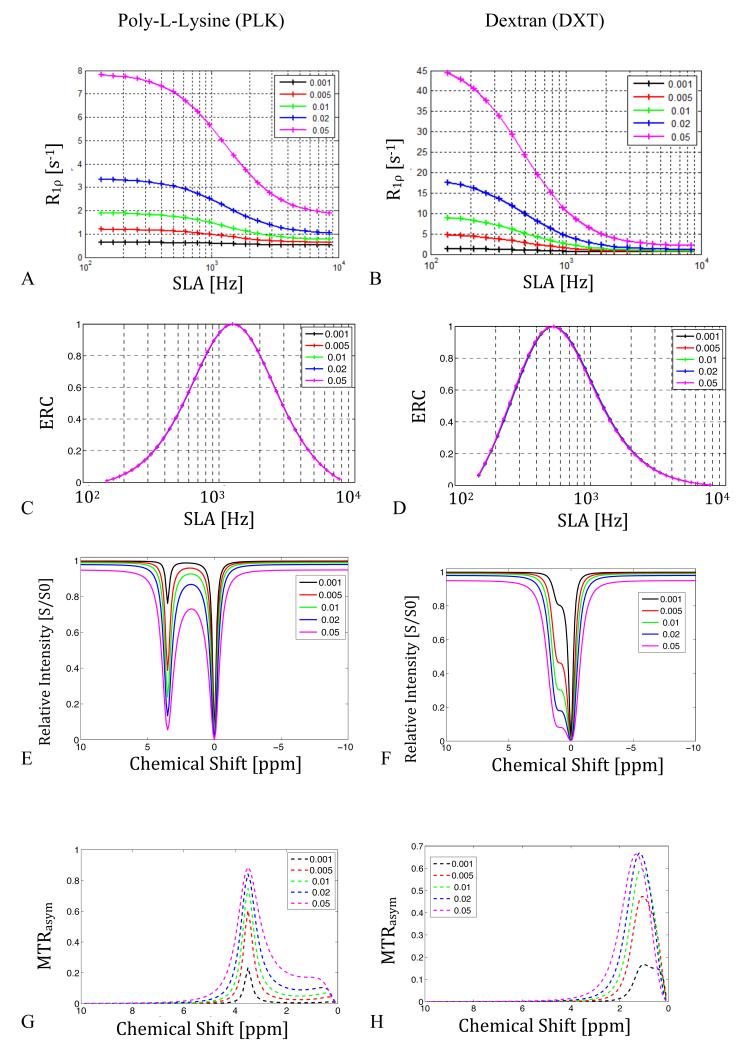
Figures 4.g and 4.h show trends for ERC and CEST contrasts, respectively. Spin lock contrast was simulated for DXT and PLK using a fixed locking field amplitude of 5 kHz, shown as the red vertical line in 4.c and 4.d, and exchange rates of between 100 Hz and 10 kHz. The results show spin lock contrast increasing with the exchange rate, whereas CEST contrast for the same materials and range of exchange rates decreases with increasing exchange rate. This simulation demonstrates simply that ERC may be best suited for examining materials undergoing rapid exchange compared to CEST methods that provide greater contrast for the same materials in slower exchange regimes.
The effects of increasing the concentration of the exchanging pool are shown in Figure 5. The R1ρ values increase monotonically with the concentration, whereas the ERC plots show complete insensitivity to concentration as expected. The magnitude of the CEST contrast varies non-linearly with the amount of solute present under the chosen conditions of irradiation. At moderate concentrations, MTRasym changes little even for large changes in the pool size fraction.
Figure 5.
Simulated effect of increasing concentration of metabolite pool on R1ρ dispersion and CEST. (T1A = 3 sec T2A = 2 sec, T1B = 1 sec, T2B = 30 msec, ΔωB = 3.5 ppm or 1.2 ppm, rBA = 140 Hz or 1 kHz, ω0 = 2π*400 MHz)
5.a. R1ρ dispersion for different SLA for PLK. Note how dispersion is very small at low metabolite (pB< 0.01) concentrations and the low simulated exchange rate (140 Hz).
5.b. R1ρ dispersion for DXT. Note the greater contribution of exchange to R1ρ dispersion attributed to the higher exchange rate (1 kHz), as compared to the peptide in 5.a.
5.c & 5.d. Simulated Exchange Rate Contrast (ERC) using Eq. 3 for both PLK and DXT. The potential contrast becomes insensitive to pool size in contrast with the CEST method shown in 5.g and 5.h.
5.e & 5.f. CEST z-spectra for PLK (left) and DXT (right). Note how CEST contrast is relatively insensitive to pool size, and large contrast enhancement is available at low concentrations and at low exchange rates.
5.g & 5.h. The corresponding CEST MTRasym plots for PLK and DXT, respectively.
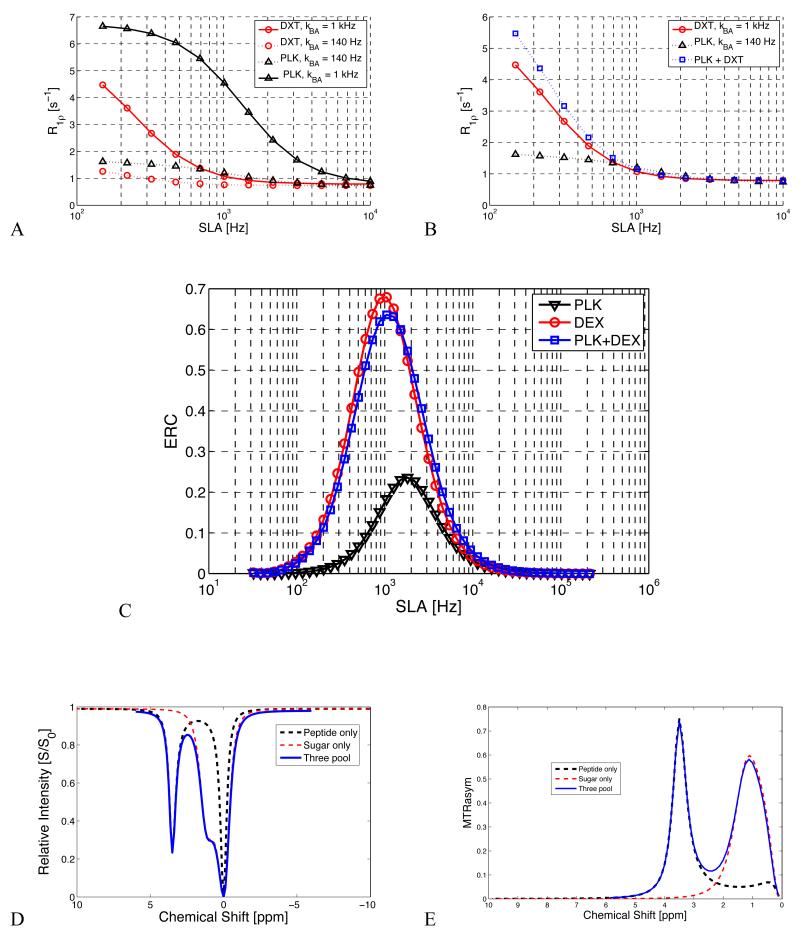
Figure 6 highlights the relative contributions of two different chemically exchanging species. R1ρ dispersion curves of the individual and combined contributions of NH and OH at typical exchange rates confirm that OH exchange may dominate R1ρ dispersion in mixtures at typical rates and fields. Figure 6 also shows that by selecting appropriate values of ω1, contrast may be dominated by −OH exchange, but the relative contribution of peptide exchange can be manipulated. The simulated CEST z-spectrum and MTRasym for the three-pool system clearly show separate sugar and polypeptide exchanging peaks with only a mild conflation near 2.2 ppm on the MTRasym plot.
Figure 6.
Demonstration of a 3-pool model of proton relaxation on R1ρ dispersion and CEST contrast. This figure gives the simulated effects of multiple exchanging species and demonstrates the relative effects of slowly exchanging NH+ groups vs. typically faster −OH groups at typical chemical shifts and exchange rates under physiologic conditions.
6.a. The individual and combined predicted contribution of exchange at different sites to R1ρ dispersion from −OH and NH+ sites at typical rates. This demonstrates that for a substance with an equal amount of peptide and sugar, the sugar dispersion contribution may dominate the overall R1ρ dispersion curve, but by suitable selection of locking field, the relative peptide contribution can be modulated.
6.b. Calculated Exchange Rate Contrast (ERC) using Eq. 3.
6.c. & 6.d. CEST z-spectrum and MTRasym for combined 3-pool model. Note how, unlike R1ρ dispersion, the effects of each species may be separated by chemical shift.
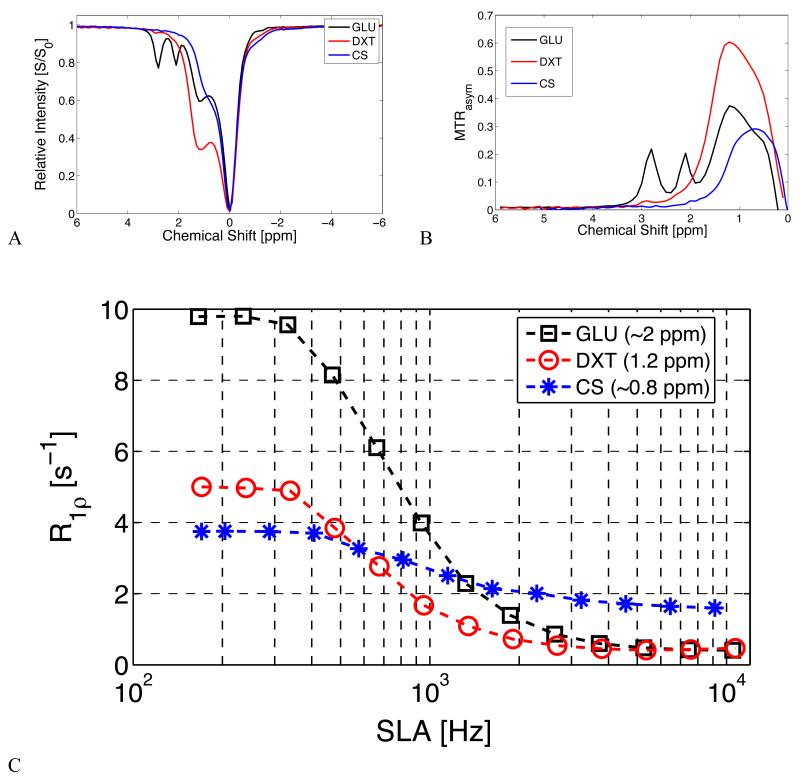
Figure 7 shows measured CEST z-spectra and MTRasym for glucose (GLU), dextran (DXT), and chondroitin sulfate (CS) at 5% (wt/wt) concentration. Dextran shows a dominant peak at ~1.2 ppm with a smaller peak near 2.8 ppm, attributed to residual sites on the molecule that are not cross-linked to other glucose subunits. This 2.8 ppm peak is much larger in the GLU z-spectrum, which features three distinct exchangeable OH sites. The CS z-spectrum and MTRasym show a dominant peak at ~0.8 ppm that is attributed to exchangeable OH sites and a smaller peak near ~3.5 ppm visible only at high concentrations that is attributed to the single NH+ site on the CS molecule. Figure 7 also shows R1ρ dispersion profiles for the same samples. Fitted values for R2, R1ρ(ω1 = ∞), and exchange rate (rBA) for the Chopra model (Eq. 2) are given in Table 1.
Figure 7.
CEST z-spectra, MTRasym, and R1ρ dispersion for 5% (wt/wt) concentrations of the sugars glucose (GLU), chondroitin sulfate (CS), and dextran (DXT).
7.a CEST z-spectra of CS, GLU, and DXT.
7.b Corresponding MTRasym of the three sugars.
7.c R1ρ dispersion of sugars.
Table 1.
Sugar Exchange Rates and Fitted Parameters:
| 5% Sugar | R2 [S−1] | R1ρ(∞) [S−1] | rBA [Hz] | LB | UB |
|---|---|---|---|---|---|
| CS | 3.7 | 1.6 | 6720.7 | 5706.9 | 7734.5 |
| GLU | 10.5 | 0.1 | 3716.9 | 3208.0 | 4226.0 |
| DXT | 5.7 | 0.3 | 466.3 | 157.0 | 575.0 |
|
| |||||
| Dextran | 1.2 ppm | ||||
|
| |||||
| Conc | R2 [S−1] | R1ρ(∞) [S−1] | rBA [Hz] | LB | UB |
| 0 | 1.0 | 0.3 | 0.0 | 0.0 | 0.0 |
| 5 | 5.7 | 0.3 | 466.3 | 257.0 | 675.0 |
| 10 | 11.6 | 0.3 | 634.7 | 176.0 | 1092.0 |
| 20 | 26.2 | 0.1 | 650.2 | 217.0 | 1083.0 |
| 40 | 60.0 | 0.0 | 386.7 | 148.0 | 625.0 |
|
| |||||
| Glucose | 1.2 ppm | ||||
|
| |||||
| Conc | R2 [S−1] | R1ρ(∞) [S−1] | rBA [Hz] | LB | UB |
| 0 | 1.0 | 0.3 | 0.0 | ||
| 5 | 10.5 | 0.1 | 3716.9 | 3208.0 | 4226.0 |
| 10 | 25.4 | 0.0 | 3913.4 | 3863.0 | 5184.0 |
| 20 | 54.4 | 0.0 | 4001.5 | 3282.0 | 4781.0 |
| 40 | 124.0 | 0.0 | 4400.0 | 3487.0 | 5432.0 |
|
| |||||
| CS | 0.8 ppm | ||||
|
| |||||
| Conc | R2 [S−1] | R1ρ(∞) [S−1] | rBA [Hz] | LB | UB |
| 0 | 1.0 | 0.3 | 0.0 | ||
| 1.2 | 1.7 | 0.6 | 3275.5 | 2653.4 | 3897.6 |
| 2.5 | 2.3 | 1.0 | 5647.5 | 4820.4 | 6474.7 |
| 5 | 3.7 | 1.6 | 6720.7 | 5706.9 | 7734.5 |
| 10 | 6.3 | 2.7 | 6371.0 | 5336.3 | 7405.7 |
| CS with modified pH | |||||
|
| |||||
| pH | R2 [S−1] | R1ρ(∞) [S−1] | rBA [Hz] | LB | UB |
|
| |||||
| 3 | 5.6 | 2.1 | 6723 | 5707 | 7735 |
| 5 | 5.8 | 2.2 | 6855 | 5512 | 7812 |
| 7 | 5.6 | 1.7 | 6954 | 5707 | 7735 |
| 9 | 5.7 | 2.5 | 7472 | 6334 | 8523 |
| 11 | 5.5 | 3.0 | 10193 | 8512 | 12412 |
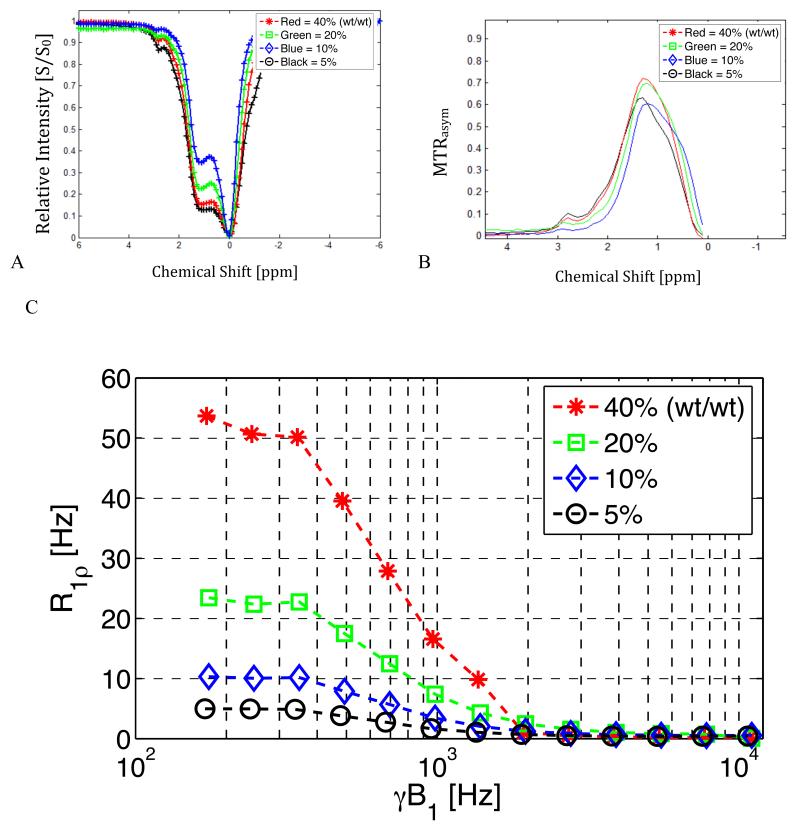
Figure 8 shows the measured effects of varying the concentration of dextran. The dominant CEST peak at 1.2 ppm becomes more distinct as the concentration decreases but MTRasym does not vary linearly in proportion to concentration. By contrast, R1ρ shows a nearly linear dependence on concentration over the range of locking fields in which exchange contributions are significant. Exchange rates and other fitted parameters from the Chopra model are given in Table 1.
Figure 8.
Experimental results for solutions of dextran with increasing concentration.
8.a. CEST data for solutions of dextran of concentration 5-40% (wt/wt). Note the dominant peak at 1.2 ppm.
8.b. Corresponding MTRasym for figure 8.a.
8.c. R1ρ dispersion results for the same dextran samples used in 8.a.
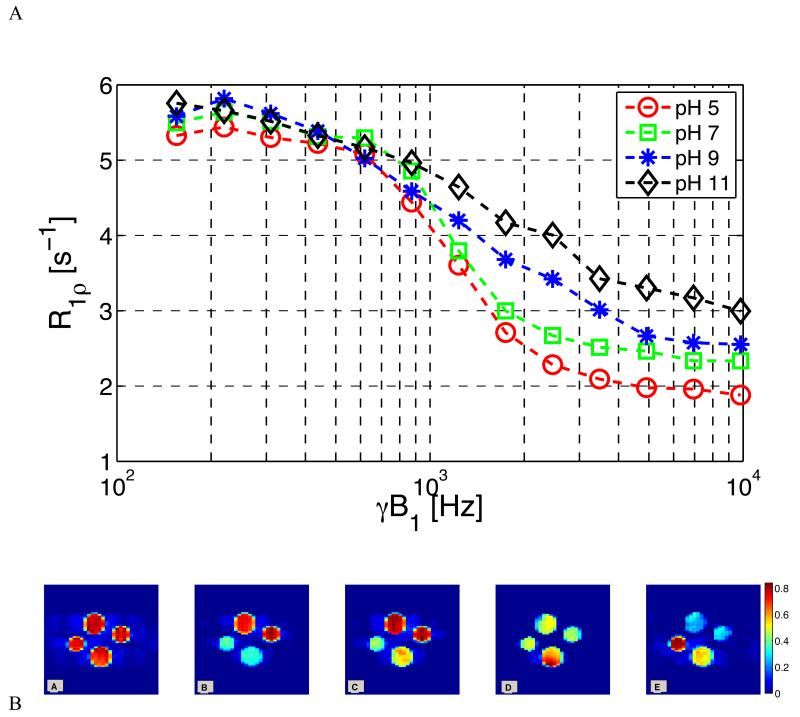
Figure 9 shows the effects of pH on the dispersion of R1ρ for CS. The values of R1ρ at low locking field were clustered together but at higher fields the curves separate, with the higher pH samples showing less rapid dispersion. The inflection point of the dispersion curve moves to lower frequencies as pH drops along with exchange rates. The fitted exchange rates, other model parameter values, and confidence intervals are given in Table 1 and show a sharp increase in exchange rate above pH 7.
Figure 9.
Exchange rate selective imaging and R1ρ dispersion measurements of 10% CS (wt/wt) with varied pH at 400 MHz.
9.a. Reference “T2-weighted” image (SLT = 20 msec, SLA = 150 Hz). Top phantom = pH 5, Right = pH 7, Bottom = pH 9, Left = pH 11.
9.b. Exchange Weighted Image Contrast (EWIC) with SLA = 1200 Hz.
9.c. EWIC with SLA = 3450 Hz.
9.d. EWIC with SLA = 5250 Hz.
9.e. EWIC with SLA = 8400 Hz.
Maps obtained by calculating EWIC using Eq. 6 at each pixel are shown in Figure 9.b. An initial short-TE, T2-weighted image was recorded at SLA =150 Hz (ω1 = 942.4 rad. sec−1) and SLT = 20 msec. Four sample tubes are shown in clockwise order from pH=5 at the top, pH=7 at right, pH=9 at bottom and pH=11 at left. The phantoms appear equally bright in this initial image. Next, EWIC maps were calculated starting with the nearest acquired locking field value to the midpoint of the pH 5 dispersion curve in Figure 9.a for S(ω1) in equation 6. The next sub-figure uses the next larger acquired value of ω1 for S(ω1) and so on, to produce the results in Figure 9.b. The sample with maximum contrast cycles from the low pH sample to the high pH sample as ω1 varies. Artifacts are visible that may be attributed to variations in ω1 and B0 across the samples. Note how the pH = 5 and 7 samples are brighter at low ω1, and the pH = 9 and 11 samples are emphasized at high ω1. Thus, by using Eqn. 6 and varying ω1 exchange rate selective images are produced. However, whether pH changes of practical significance can be detected by such means remains to be established.
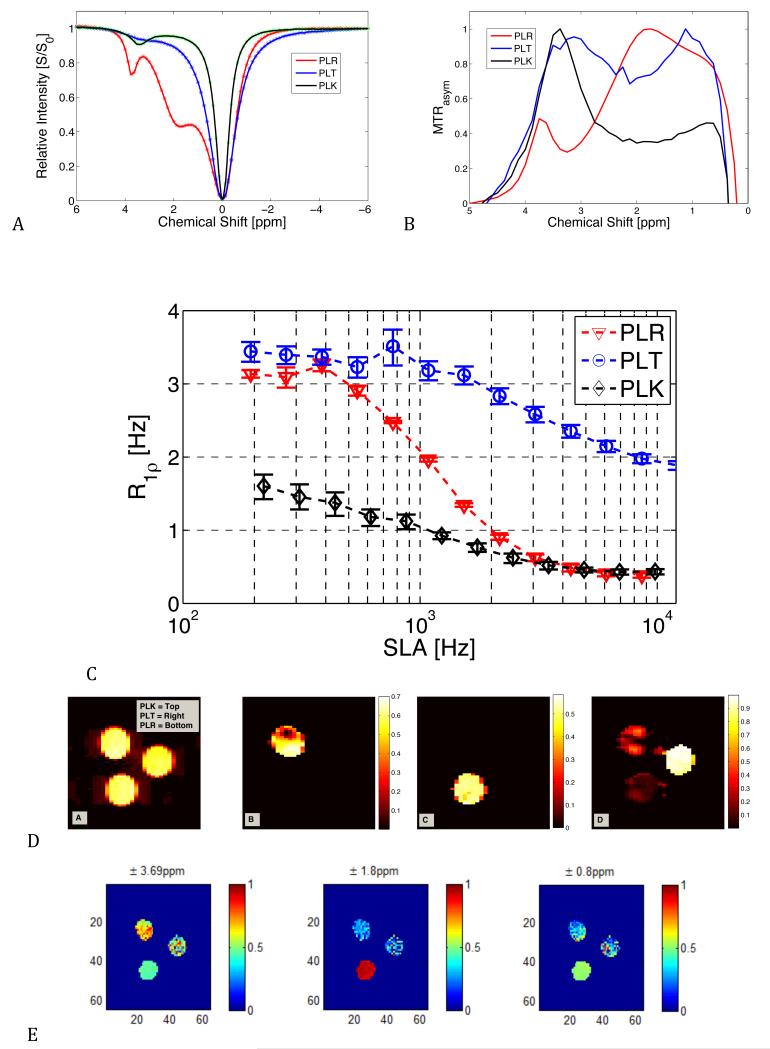
Figure 10 shows CEST z-spectra of the solutions of PLK, PLR, and PLT. PLK has a z-spectrum “peak” apparent at ~3.5 ppm. The PLR polypeptide carries a guanidyl amine (gNH2) group in addition to backbone groups that resonate between 1.8 and 3.7 ppm. The PLT group carries an amide group resonating near 3.5 ppm and also a hydroxyl exchange site at 1 ppm, giving a wide spread in saturation effects as shown in the MTRasym plot in Figure 10.b.
Figure 10.
CEST and exchange rate selective imaging and R1ρ dispersion for three 10 mM polypeptides: PLK, PLR, PLT.
10.a. CEST z-spectra of the three peptides. The PLR, with its gNH2 exchanging groups, has the greatest dispersion of R1ρ from 3.3 s−1 to 0.4 s−1 and carries a fitted mean exchange rate near 980 Hz. The PLK (NH2) has much slower fitted exchange rates near 70 Hz and shows a smaller dispersion profile. The PLT has both −OH and NH+ exchanging sites and shows a small dispersion at much higher exchange rates > 3 kHz.
10.b. Corresponding CEST MTRasym
10.c. R1ρ dispersion profiles for each peptide.
- Original image of PLK (left), PLT (right), and PLR (bottom)
- EWIC with SLA= 300 Hz.
- EWIC with SLA = 1200 Hz.
- EWIC with SLA = 4300 Hz.
- Chemical shift selective image with saturation pulse offset = 3.69 ppm.
- Chemical shift selective image with pulse offset = 1.8 ppm.
- Chemical shift selective image with pulse offset = 0.8 ppm.
Figure 10 also shows the corresponding R1ρ dispersions for the polypeptides. PLR showed the largest dispersion and a fitted exchange rate to the Chopra model of ~930 Hz. PLK and PLT showed much smaller dispersions with estimated exchange rates ~70 Hz and ~3200 Hz respectively. These and other fitted parameters are given in Table 1. Note that no attempt was made to separate the individual contributions of the multiple exchanging species in PLR and PLT so the fitted rates are apparent average exchange rates (24,25).
Figure 10.d shows EWIC maps for the three polypeptides. The image acquired with a locking field of 150 Hz and SLT = 20 msec shows PLK, PLT, and PLR with nearly equal brightness. The image acquired with locking field 300 Hz shows PLK clearly, while the other samples are suppressed. The color bar indicates how closely the selected frequency matches the apparent chemical exchange rate, with unity representing a good match. PLK has an average value of about 0.55 (if the banding artifact at the top of the phantom is left out of the measured region of interest). When the locking field is 1200 Hz, only the PLR sample is visible with an average value of 0.5. At 7 kHz, only the PLT with average image intensity of 0.95 is clearly seen.
Figure 10 also shows the corresponding CEST images resulting from selective irradiation at ±3.69 ppm. All peptide species studied here have significant MTRasym near 3.69 ppm with PLK and PLT showing greater saturation effects and MTRasym than PLR. When the saturation occurs at ±1.8 ppm, only the PLR sample has significant contrast. At ±0.8 ppm, the PLR and PLT samples show greater contrast than PLK, consistent with the z-spectra.
DISCUSSION
The studies described above illustrate several distinct features of both spin locking and CEST techniques and provide a basis for understanding some of the factors that affect contrast in exchange-dependent imaging. They confirm that both methods are sensitive to chemical exchange effects, especially at high fields. Additionally, some characteristic limitations of each technique are demonstrated, so that each may provide a complementary approach to obtaining chemical exchange-based contrast. The chemical shift frequency difference and exchange rate are the most important factors affecting measured signals and their relative values determine the precise behavior of both SL and CEST contrast.
Imaging is being performed at ever-greater magnetic field strengths both clinically and in pre-clinical research, and field strength is clearly of great importance for exchange imaging, but affects each method differently. Variations in the values of R1ρ with locking field depend explicitly on B0 because spin locking is sensitive to the time scales of the local fields that promote relaxation, and in an exchanging system these depend on the frequency separation of the exchanging species and the lifetimes spent in each location. Increasing B0 in SL experiments results in larger magnitude of dispersive effects that make the effects of exchange relatively more important, depending on the exchange rate. Conversely, when the saturating RF pulse in CEST has an ideal narrow-band frequency content and avoids direct water saturation, the CEST signal change does not depend explicitly on the chemical shift. Increasing B0 clarifies where the exchanging peak occurs, but not the magnitude of the effects on the water resonance. Such effects are seen only indirectly as the resulting z-spectrum suffers from the effects of pulse bandwidth and direct saturation that must be optimized by varying the irradiation power. Thus whereas spin lock dispersion may increase with field, CEST contrast becomes relatively field independent.
Our simulations and experiments confirm that each technique shows distinct chemical exchange contrast that is dependent on the exchange regime in which the experiment is performed. Each technique has highest sensitivity in different regimes. The specific effects of increasing chemical exchange rates on R1ρ and CEST contrasts are also distinct. For example, once an appropriate value for ω1 is chosen there is a monotonic increase in SL contrast with exchange up to very high rates (~10 kHz), whereas CEST contrast decreases significantly over the same exchange range. The ERC and EWIC are maximized when ω1 is chosen appropriately which depends on the chemical exchange rate and shift as predicted by Equation 5. This implies also that more distinct contrast may be obtained from substances with smaller chemical shifts if exchange rates are sufficiently separated and sufficient RF power is available.
CEST contrast decreases as exchange rates approach the intermediate and fast exchange regimes. For example, our simulation data for hydroxyl exchange in dextran show that MTRasym varies little with increasing exchange rate at rates below 1 kHz, but contrast dramatically reduces at rates above 5 kHz. When exchange is very fast compared to the chemical shift frequency difference, line broadening adversely affects the ability to produce difference images with CEST as the exchanging peak coalesces with the water resonance. For example, at rates greater than 1 kHz, the OH peak broadens into the water peak and the corresponding MTRasym reduces to near zero. Thus, an increase in exchange rate reduces contrast in CEST. For spin locking techniques, fast exchange between the water and metabolite site promotes signal dephasing that may be reduced with sufficient locking field ω1. The larger this dephasing effect is, the greater the contrast enhancement that may be obtained. However, at extremely high rates (>10 kHz) R1ρ also loses sensitivity to ω1.
In a mixture of more than one type of exchanging species, the relative contributions to R1ρ dispersion will again depend on the locking field ω1. The combined OH and NH mixture considered above shows that OH exchange will dominate R1ρ dispersion in mixtures, consistent with the findings of Reddy et al. who noted a larger contribution from OH exchange to CEST than from NH sites in studies on chondroitin sulfate (4). The influence of exchange rate in SL compared to chemical shift can be understood by reference to Eqs. 3 through 5 and the relative sizes of rBA and δωB. These expressions demonstrate that exchange rate may be much more important for contrast than chemical shift when the exchange rate is >> chemical shift.
Figures 9 and 10 demonstrate novel images derived from spin-locking acquisitions in which the contrast emphasizes the presence of exchanging protons with specific exchange rates, as opposed to CEST techniques that emphasize contrast from particular chemical shifts. By appropriate selection of the spin lock field amplitude, maximal contrast can be derived from nuclei whose exchange rates occur around the values predicted by the theory given in Equations 3-5 where α = 1. When the R1ρ dispersion is different for different species, so that the critical locking frequency varies, the contrast may be manipulated by selecting different locking fields.
In conclusion, we have demonstrated with simulations and experiments on model systems that CEST and spin lock images are sensitive to chemical exchange and the influence of factors including the size of the metabolite pool, exchange rate and pH, and field strength. CEST may be particularly suited to exploring contrast from systems in the slow-to-intermediate exchange regime and with low metabolite concentrations, but CEST contrast does not provide a clear indication of the concentration of a species under the irradiation conditions considered here. Spin-lock acquisitions and dispersion are well suited to the intermediate-to-fast regime where other approaches, such as CEST or CPMG, may be technically difficult. R1ρ-weighted images show contrast that scales with concentration, but novel metrics are suggested that could highlight disparate species by a combination of exchange rate and offset frequency rather than chemical shift alone. Each technique demonstrates strengths in a particular exchange regime, and therefore the two techniques may be thought of as providing complementary information about chemically exchanging systems.
Table 2.
Peptide Exchange Rates and Fitted Parameters:
| R2 [s−1] | R1ρ(∞) [s−1] | rBA [Hz] | LB [Hz] | UB [Hz] | |
|---|---|---|---|---|---|
| PLK | 1.6 | 0.4 | 69.8 | 28.8 | 110.8 |
| PLR | 3.3 | 0.3 | 928.0 | 863 | 993 |
| PLT | 3.4 | 1.8 | 3185 | 2815 | 3555 |
ACKNOWLEDGEMENTS
NCRR 1S10 RR17799
NIH R01 EB000214
Footnotes
Publisher's Disclaimer: This is a PDF file of an unedited manuscript that has been accepted for publication. As a service to our customers we are providing this early version of the manuscript. The manuscript will undergo copyediting, typesetting, and review of the resulting proof before it is published in its final citable form. Please note that during the production process errors may be discovered which could affect the content, and all legal disclaimers that apply to the journal pertain.
References
- 1.Zhou JY, van Zijl PCM. Chemical exchange saturation transfer imaging and spectroscopy. Prog Nucl Mag Res Sp. 2006;48(2-3):109–136. [Google Scholar]
- 2.McMahon MT, Gilad AA, DeLiso MA, Berman SM, Bulte JW, van Zijl PC. New “multicolor” polypeptide diamagnetic chemical exchange saturation transfer (DIACEST) contrast agents for MRI. Magn Reson Med. 2008;60(4):803–812. doi: 10.1002/mrm.21683. [DOI] [PMC free article] [PubMed] [Google Scholar]
- 3.van Zijl PCM, Jones CK, Ren J, Malloy CR, Sherry AD. MR1 detection of glycogen in vivo by using chemical exchange saturation transfer imaging (glycoCEST) P Natl Acad Sci USA. 2007;104(11):4359–4364. doi: 10.1073/pnas.0700281104. [DOI] [PMC free article] [PubMed] [Google Scholar]
- 4.Ling W, Regatte RR, Navon G, Jerschow A. Assessment of glycosaminoglycan concentration in vivo by chemical exchange-dependent saturation transfer (gagCEST) Proc Natl Acad Sci U S A. 2008;105(7):2266–2270. doi: 10.1073/pnas.0707666105. [DOI] [PMC free article] [PubMed] [Google Scholar]
- 5.Zhang S, Merritt M, Woessner DE, Lenkinski RE, Sherry AD. PARACEST agents: modulating MRI contrast via water proton exchange. Acc Chem Res. 2003;36(10):783–790. doi: 10.1021/ar020228m. [DOI] [PubMed] [Google Scholar]
- 6.Woessner DE, Zhang S, Merritt ME, Sherry AD. Numerical solution of the Bloch equations provides insights into the optimum design of PARACEST agents for MRI. Magn Reson Med. 2005;53(4):790–799. doi: 10.1002/mrm.20408. [DOI] [PubMed] [Google Scholar]
- 7.Aime S, Calabi L, Biondi L, De Miranda M, Ghelli S, Paleari L, Rebaudengo C, Terreno E. Iopamidol: Exploring the potential use of a well-established x-ray contrast agent for MRI. Magn Reson Med. 2005;53(4):830–834. doi: 10.1002/mrm.20441. [DOI] [PubMed] [Google Scholar]
- 8.Longo DL, Dastru W, Digilio G, Keupp J, Langereis S, Lanzardo S, Prestigio S, Steinbach O, Terreno E, Uggeri F, Aime S. Iopamidol as a responsive MRI-chemical exchange saturation transfer contrast agent for pH mapping of kidneys: In vivo studies in mice at 7 T. Magn Reson Med. 2011;65(1):202–211. doi: 10.1002/mrm.22608. [DOI] [PubMed] [Google Scholar]
- 9.Wolff SD, Balaban RS. Magnetization transfer contrast (MTC) and tissue water proton relaxation in vivo. Magn Reson Med. 1989;10(1):135–144. doi: 10.1002/mrm.1910100113. [DOI] [PubMed] [Google Scholar]
- 10.Sepponen RE, Pohjonen JA, Sipponen JT, Tanttu JI. A method for T1 rho imaging. J Comput Assist Tomogr. 1985;9(6):1007–1011. doi: 10.1097/00004728-198511000-00002. [DOI] [PubMed] [Google Scholar]
- 11.Witschey WR, 2nd, Borthakur A, Elliott MA, Mellon E, Niyogi S, Wallman DJ, Wang C, Reddy R. Artifacts in T1 rho-weighted imaging: compensation for B(1) and B(0) field imperfections. J Magn Reson. 2007;186(1):75–85. doi: 10.1016/j.jmr.2007.01.015. [DOI] [PMC free article] [PubMed] [Google Scholar]
- 12.Hills BP. The Proton-Exchange Cross-Relaxation Model of Water Relaxation in Biopolymer Systems. Mol Phys. 1992;76(3):489–508. [Google Scholar]
- 13.Hills BP. The Proton-Exchange Cross-Relaxation Model of Water Relaxation in Biopolymer Systems .2. The Sol and Gel States of Gelatin. Mol Phys. 1992;76(3):509–523. [Google Scholar]
- 14.Duvvuri U, Goldberg AD, Kranz JK, Hoang L, Reddy R, Wehrli FW, Wand AJ, Englander SW, Leigh JS. Water magnetic relaxation dispersion in biological systems: the contribution of proton exchange and implications for the noninvasive detection of cartilage degradation. Proc Natl Acad Sci U S A. 2001;98(22):12479–12484. doi: 10.1073/pnas.221471898. [DOI] [PMC free article] [PubMed] [Google Scholar]
- 15.Hills BP, Babonneau F. A quantitative study of water proton relaxation in packed beds of porous particles with varying water content. Magn Reson Imaging. 1994;12(6):909–922. doi: 10.1016/0730-725x(94)92032-x. [DOI] [PubMed] [Google Scholar]
- 16.Cobb JG, Xie J, Gore JC. Contributions of chemical exchange to T1ρ dispersion in a tissue model. Magn Reson Med. 2011;66(6):1563–1571. doi: 10.1002/mrm.22947. [DOI] [PMC free article] [PubMed] [Google Scholar]
- 17.Ward KM, Aletras AH, Balaban RS. A new class of contrast agents for MRI based on proton chemical exchange dependent saturation transfer (CEST) J Magn Reson. 2000;143(1):79–87. doi: 10.1006/jmre.1999.1956. [DOI] [PubMed] [Google Scholar]
- 18.Bloch F. Nuclear Induction. Physical Review. 1946;70(7-8):460. [Google Scholar]
- 19.McConnell HM. Reaction Rates by Nuclear Magnetic Resonance. The Journal of Chemical Physics. 1958;28(3):430–431. [Google Scholar]
- 20.Sun PZ, van Zijl PC, Zhou J. Optimization of the irradiation power in chemical exchange dependent saturation transfer experiments. J Magn Reson. 2005;175(2):193–200. doi: 10.1016/j.jmr.2005.04.005. [DOI] [PubMed] [Google Scholar]
- 21.Hills BP, Wright KM, Belton PS. Nmr-Studies of Water Proton Relaxation in Sephadex Bead Suspensions. Mol Phys. 1989;67(1):193–208. [Google Scholar]
- 22.Cobb JG, Xie J, Li K, Gochberg DF, Gore JC. Exchange-mediated contrast agents for spin-lock imaging. Magn Reson Med. 2012;67(5):1427–1433. doi: 10.1002/mrm.23130. [DOI] [PMC free article] [PubMed] [Google Scholar]
- 23.Chopra S, McClung RED, Jordan RB. Rotating-Frame Relaxation Rates of Solvent Molecules in Solutions of Paramagnetic-Ions Undergoing Solvent Exchange. J Magn Reson. 1984;59(3):361–372. [Google Scholar]
- 24.Hills B. Magnetic resonance imaging in food science. Wiley; New York: 1998. [Google Scholar]
- 25.Jin T, Autio J, Obata T, Kim SG. Spin-locking versus chemical exchange saturation transfer MRI for investigating chemical exchange process between water and labile metabolite protons. Magn Reson Med. 2011;65(5):1448–1460. doi: 10.1002/mrm.22721. [DOI] [PMC free article] [PubMed] [Google Scholar]
- 26.Hills BP, Cano C, Belton PS. Proton Nmr Relaxation Studies of Aqueous Polysaccharide Systems. Macromolecules. 1991;24(10):2944–2950. [Google Scholar]
- 27.Van Zijl PCM, Yadav NN. Chemical exchange saturation transfer (CEST): What is in a name and what isn’t? MRM. 2011;65(4):927–948. doi: 10.1002/mrm.22761. [DOI] [PMC free article] [PubMed] [Google Scholar]


